1. Introduction
Rewiring algorithms are often employed in network science to build “synthetic networks” for the mathematical modeling of dynamics or diffusion processes [
1,
2,
3,
4,
5]. Usually, rewiring algorithms preserve the degree distribution of the network while changing the degree correlations and other topological features.
The “configuration model” [
6] is a well established generalization of the random networks of Erdös-Renyi which yields uncorrelated networks having a pre-assigned (typically scale-free) degree distribution. It is known, however, that assortative and disassortative correlations play an important role in dynamics and diffusion on networks [
7,
8,
9,
10,
11]. For this reason some algorithms have been devised, which are able to perform a degree-conserving rewiring while modifying the pair correlations in the direction of increasing assortativity or disassortativity.
It is also possible to rewire the network in order to change its clustering coefficient (see [
12] and references) or other metrics, but in this work the focus is on assortativity and disassortativity as measured by the Newman coefficient
r, and on the average nearest neighbors degree function
, or better on its network average
. Here,
is the degree distribution,
denotes the conditional probability for a node of degree
k to be connected to a node of degree
h, and
.
The algorithm by Xulvi-Brunet and Sokolov [
13] is quite efficient for generating networks that are maximally assortative or maximally disassortative, or even have an intermediate
r coefficient, if a tunable return probability is inserted in the rewiring criterion. It does not allow, however, any direct control of the degree correlations
or
, the
r coefficient or the
function. (We recall that
is the probability for a node with excess degree
j, i.e., degree
, to be connected with a node with excess degree
k.).
The rewiring method proposed by Newman [
1] allows in principle to generate ensembles of networks displaying, on average, any “target” two-point correlations assigned through an
matrix compatible with the given degree distribution. There exist several recipes for the construction of such matrices in the case of scale-free networks [
1,
14,
15].
We have recently proposed a new algorithm [
16] that is equivalent to the algorithm of [
13] when applied to maximally assortative or disassortative networks, but allows at each step the control of the variation
in the Newman coefficient, and therefore permits the introduction of a rewiring “temperature”
T in order to tune the return probability via a standard Metropolis update.
It is known that in many classes of networks, no simple method for the creation of random networks of the class exists [
3]. In these cases a Monte Carlo method is usually invoked. The desired network class is determined by an energy function, which is defined on a network configuration. The lower the function is, the more desirable are the properties of the network. For a good performance of the algorithm, the energy function should be calculable locally. That is, the change in energy between configurations should depend only on the changed links and possibly some near neighbors, so calculating the new energy should not require recalculating the energy for the entire network. Our proposed method improves previous methods since it satisfies these properties by using
as energy variation.
In order to increase the convergence probability of Metropolis algorithms it is sometimes attempted to start with a high temperature, making all moves probable and covering the entire configuration space, and gradually decrease the temperature in order to approach the real energy minimum (procedure of ”simulated annealing”). This is also possible in principle with our method, but it should be stressed that in general rewiring algorithms do not sample uniformly through spaces of networks (see for instance [
17,
18,
19] and references), and that the more features one wants to preserve in the rewiring, the less successful sampling is. Therefore our rewiring algorithm, like the other cited algorithms for changing network correlations, cannot be used as a randomization procedure. Another reason for this is that these algorithms may generate multiple copies of isomorphic random networks, and so cause over-counting in the sampling.
One of the aims of this work is to clarify the relations existing among these rewiring methods and the asymptotic constraints on maximally assortative and disassortative networks found by Menche et al. [
20]. Using our “
-rewiring” we have also been able to see the effects of extreme assortativity and disassortativity in networks with many nodes of small degree. These were not considered by the authors of [
20], who took as a minimum degree a typical value
and therefore found in general highly connected networks with a very large giant component.
The study of complex networks is often motivated by the interest for the dynamics of some diffusion problem on top of them. Clearly, if a mean-field approximation of the dynamics or diffusion on the network is sufficient for one’s purposes, then the corresponding equations can be written, analyzed, or solved in terms of the excess-degree correlations or in terms of the degree distribution plus the conditional probabilities (the so-called probabilistic or “Markovian” description of the network). If, on the other hand, a full realization of the network is needed (e.g., for simulations or stochastic modeling, or because one wants to take into account the effect of correlations beyond the second order), then several issues arise, for example:
Is it possible to build any desired assortative or disassortative network, defined at the probabilistic level through a suitable “theoretical” matrix, using a Newman rewiring, at least at the ensemble level? What is in this respect the role of the asymptotic constraints on r? Can the asymptotic constraints tell us in advance that a certain theoretical is impossible to be implemented in a real network?
Among the networks obtained through a Xulvi–Brunet–Sokolov rewiring or our rewiring, will one find the desired assortative or disassortative network? If yes, with what accuracy is this possible, compared to the Newman rewiring?
How do the results (and their level of fluctuations and uncertainty) change if we modify the degree distribution, and especially the probability of the nodes with the lowest degree? Will a giant component always be present? If the network is much fragmented, what are the consequences for diffusion processes?
As this work was progressing, we gradually realized that such issues are hard to solve in general terms. We found partial answers, but we chose to leave most of them for a forthcoming publication. Still the efforts described in this work have already led to some useful spin-offs. In an attempt to obtain a better characterization of the rewiring process, we have represented the state of the network in an
r-
K plane trying to use
K as a “coordinate” independent from
r. This brought us first to a revision of the meaning and of the properties of
K (
Section 2,
Section 2.1, and
Section 2.2) and then to establish a new general relation between the variations of
r and
K in a rewiring step (
Section 2.3 and
Section 2.4). This relation has been proven theoretically and verified numerically through the rewiring code. The code has also allowed to guess some related properties of the quantity
(average number of second neighbors in the branching approximation), which have been proven theoretically in
Section 3, although they are not strictly necessary for the rest of the present work.
In
Section 4, we describe the main features of the rewiring code and the procedure for the calculation of the entropy of the generated networks. In
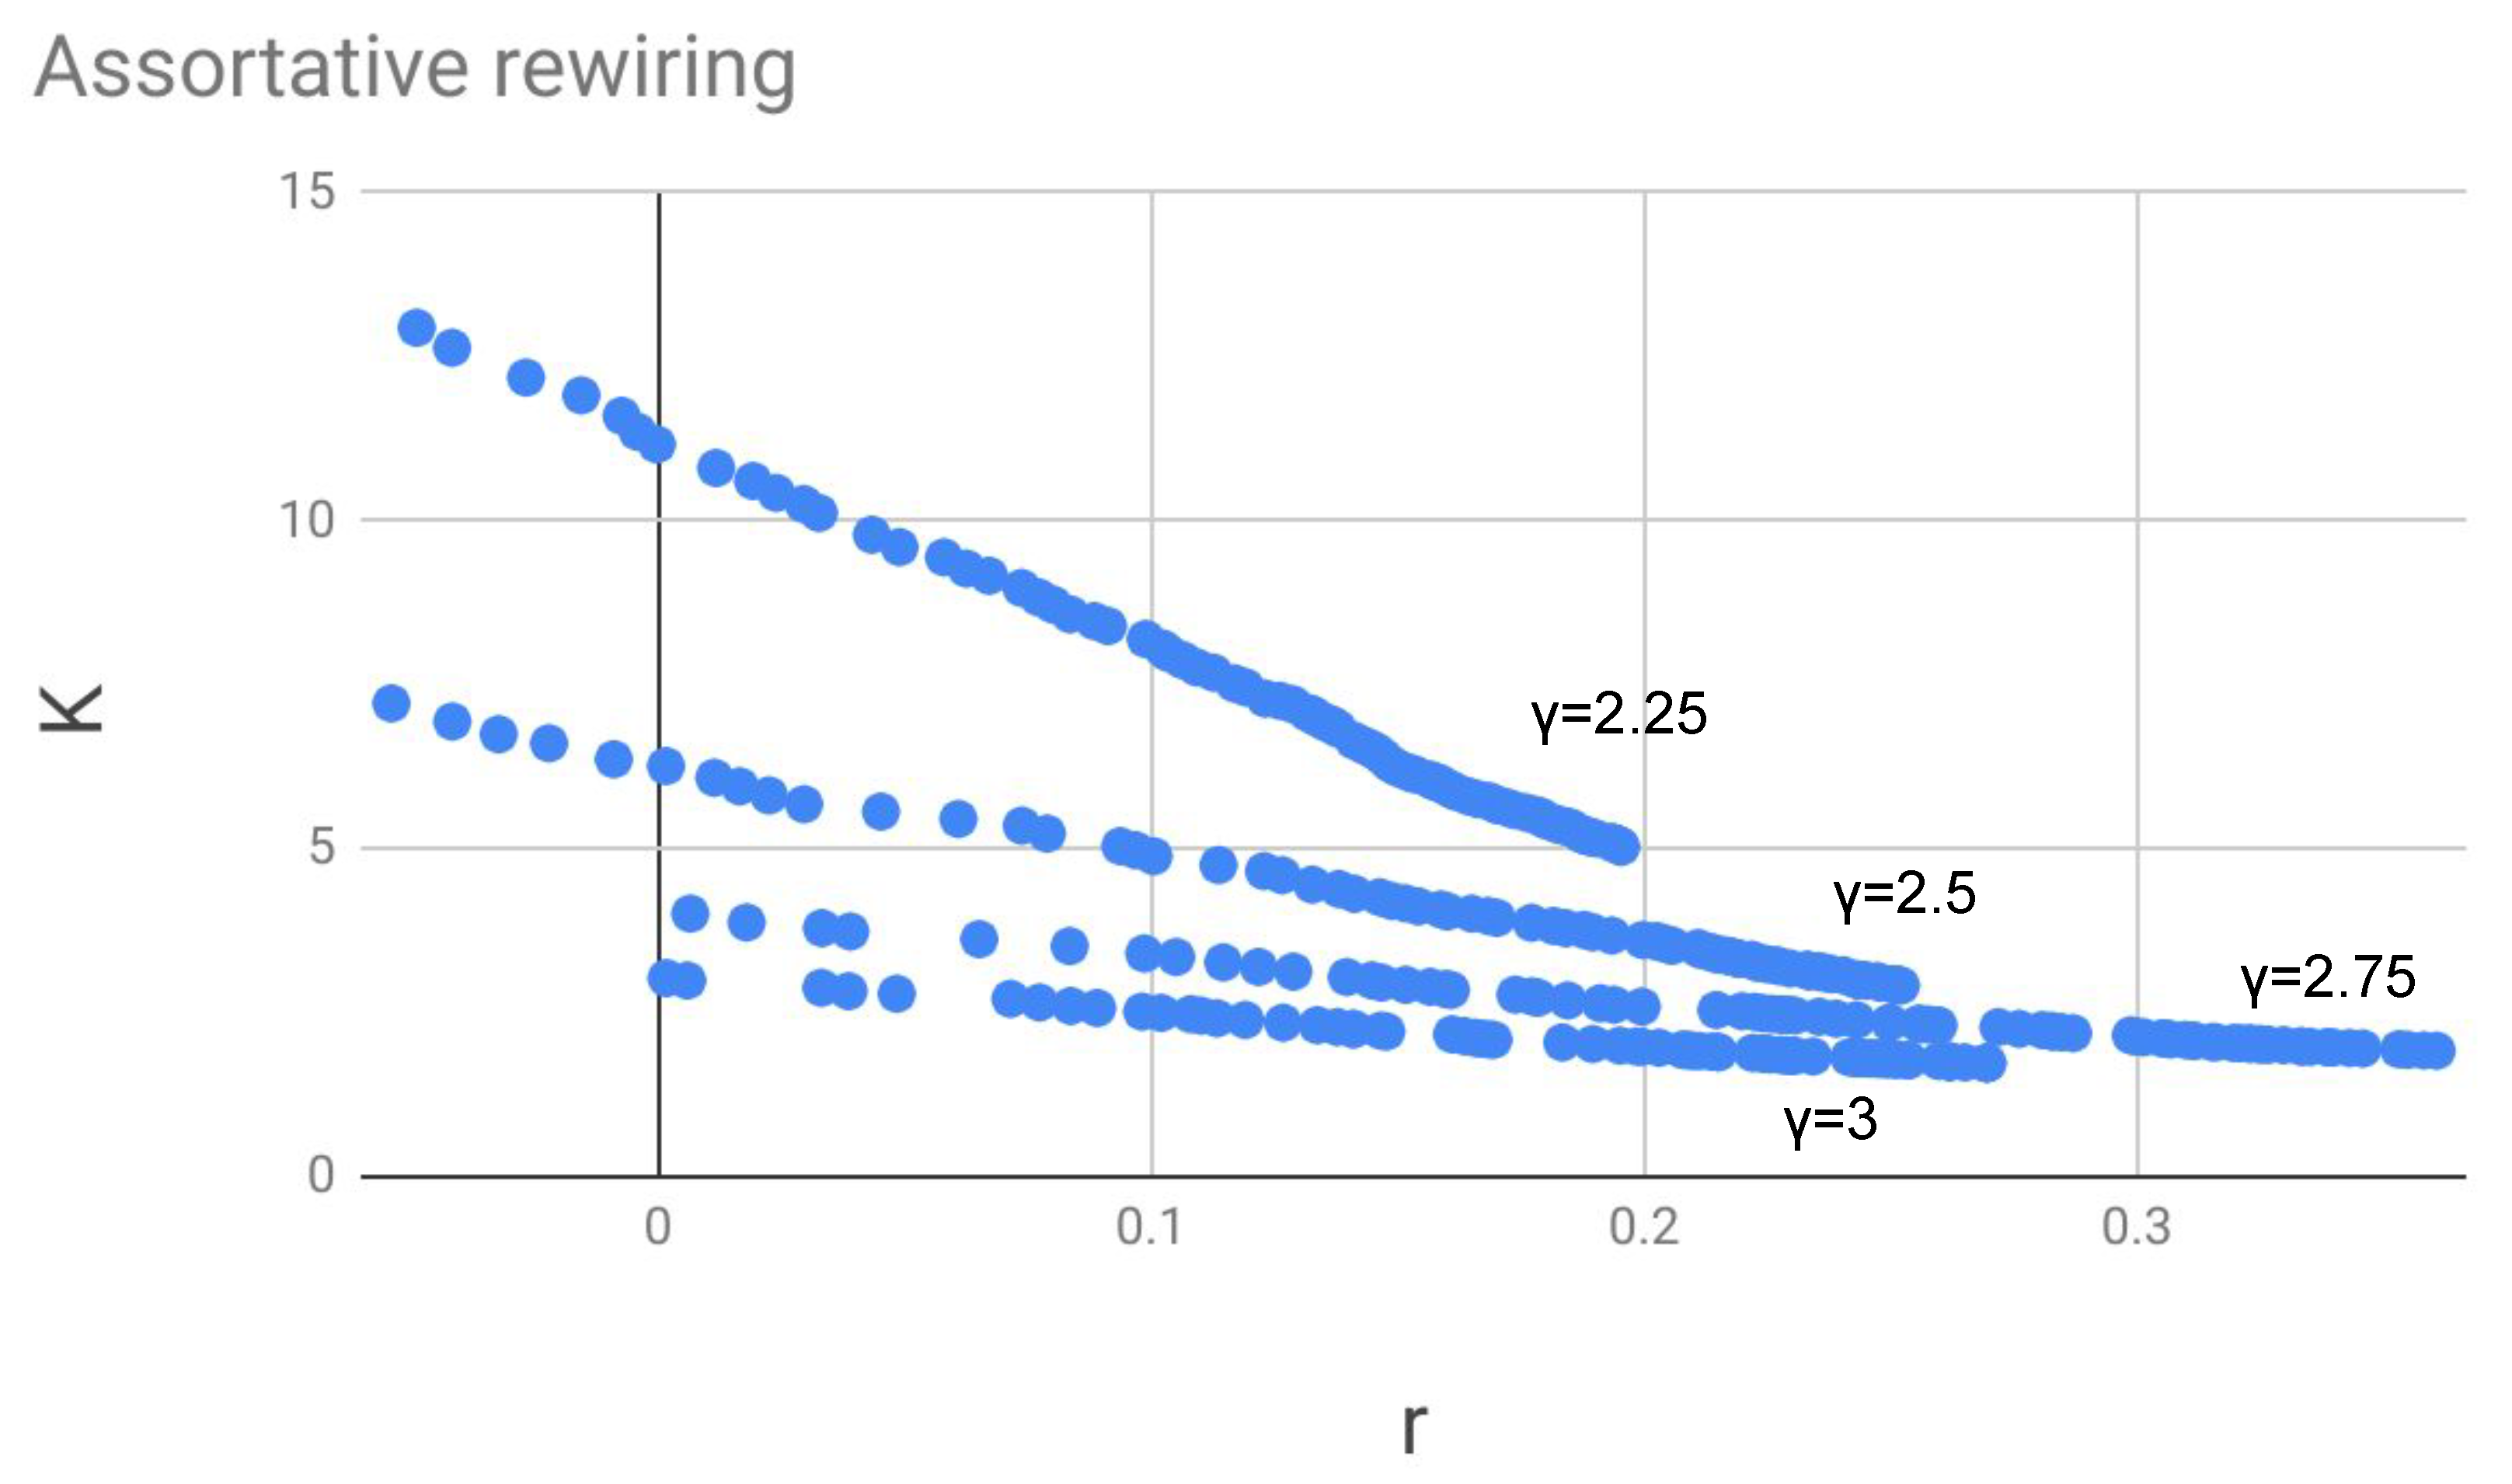
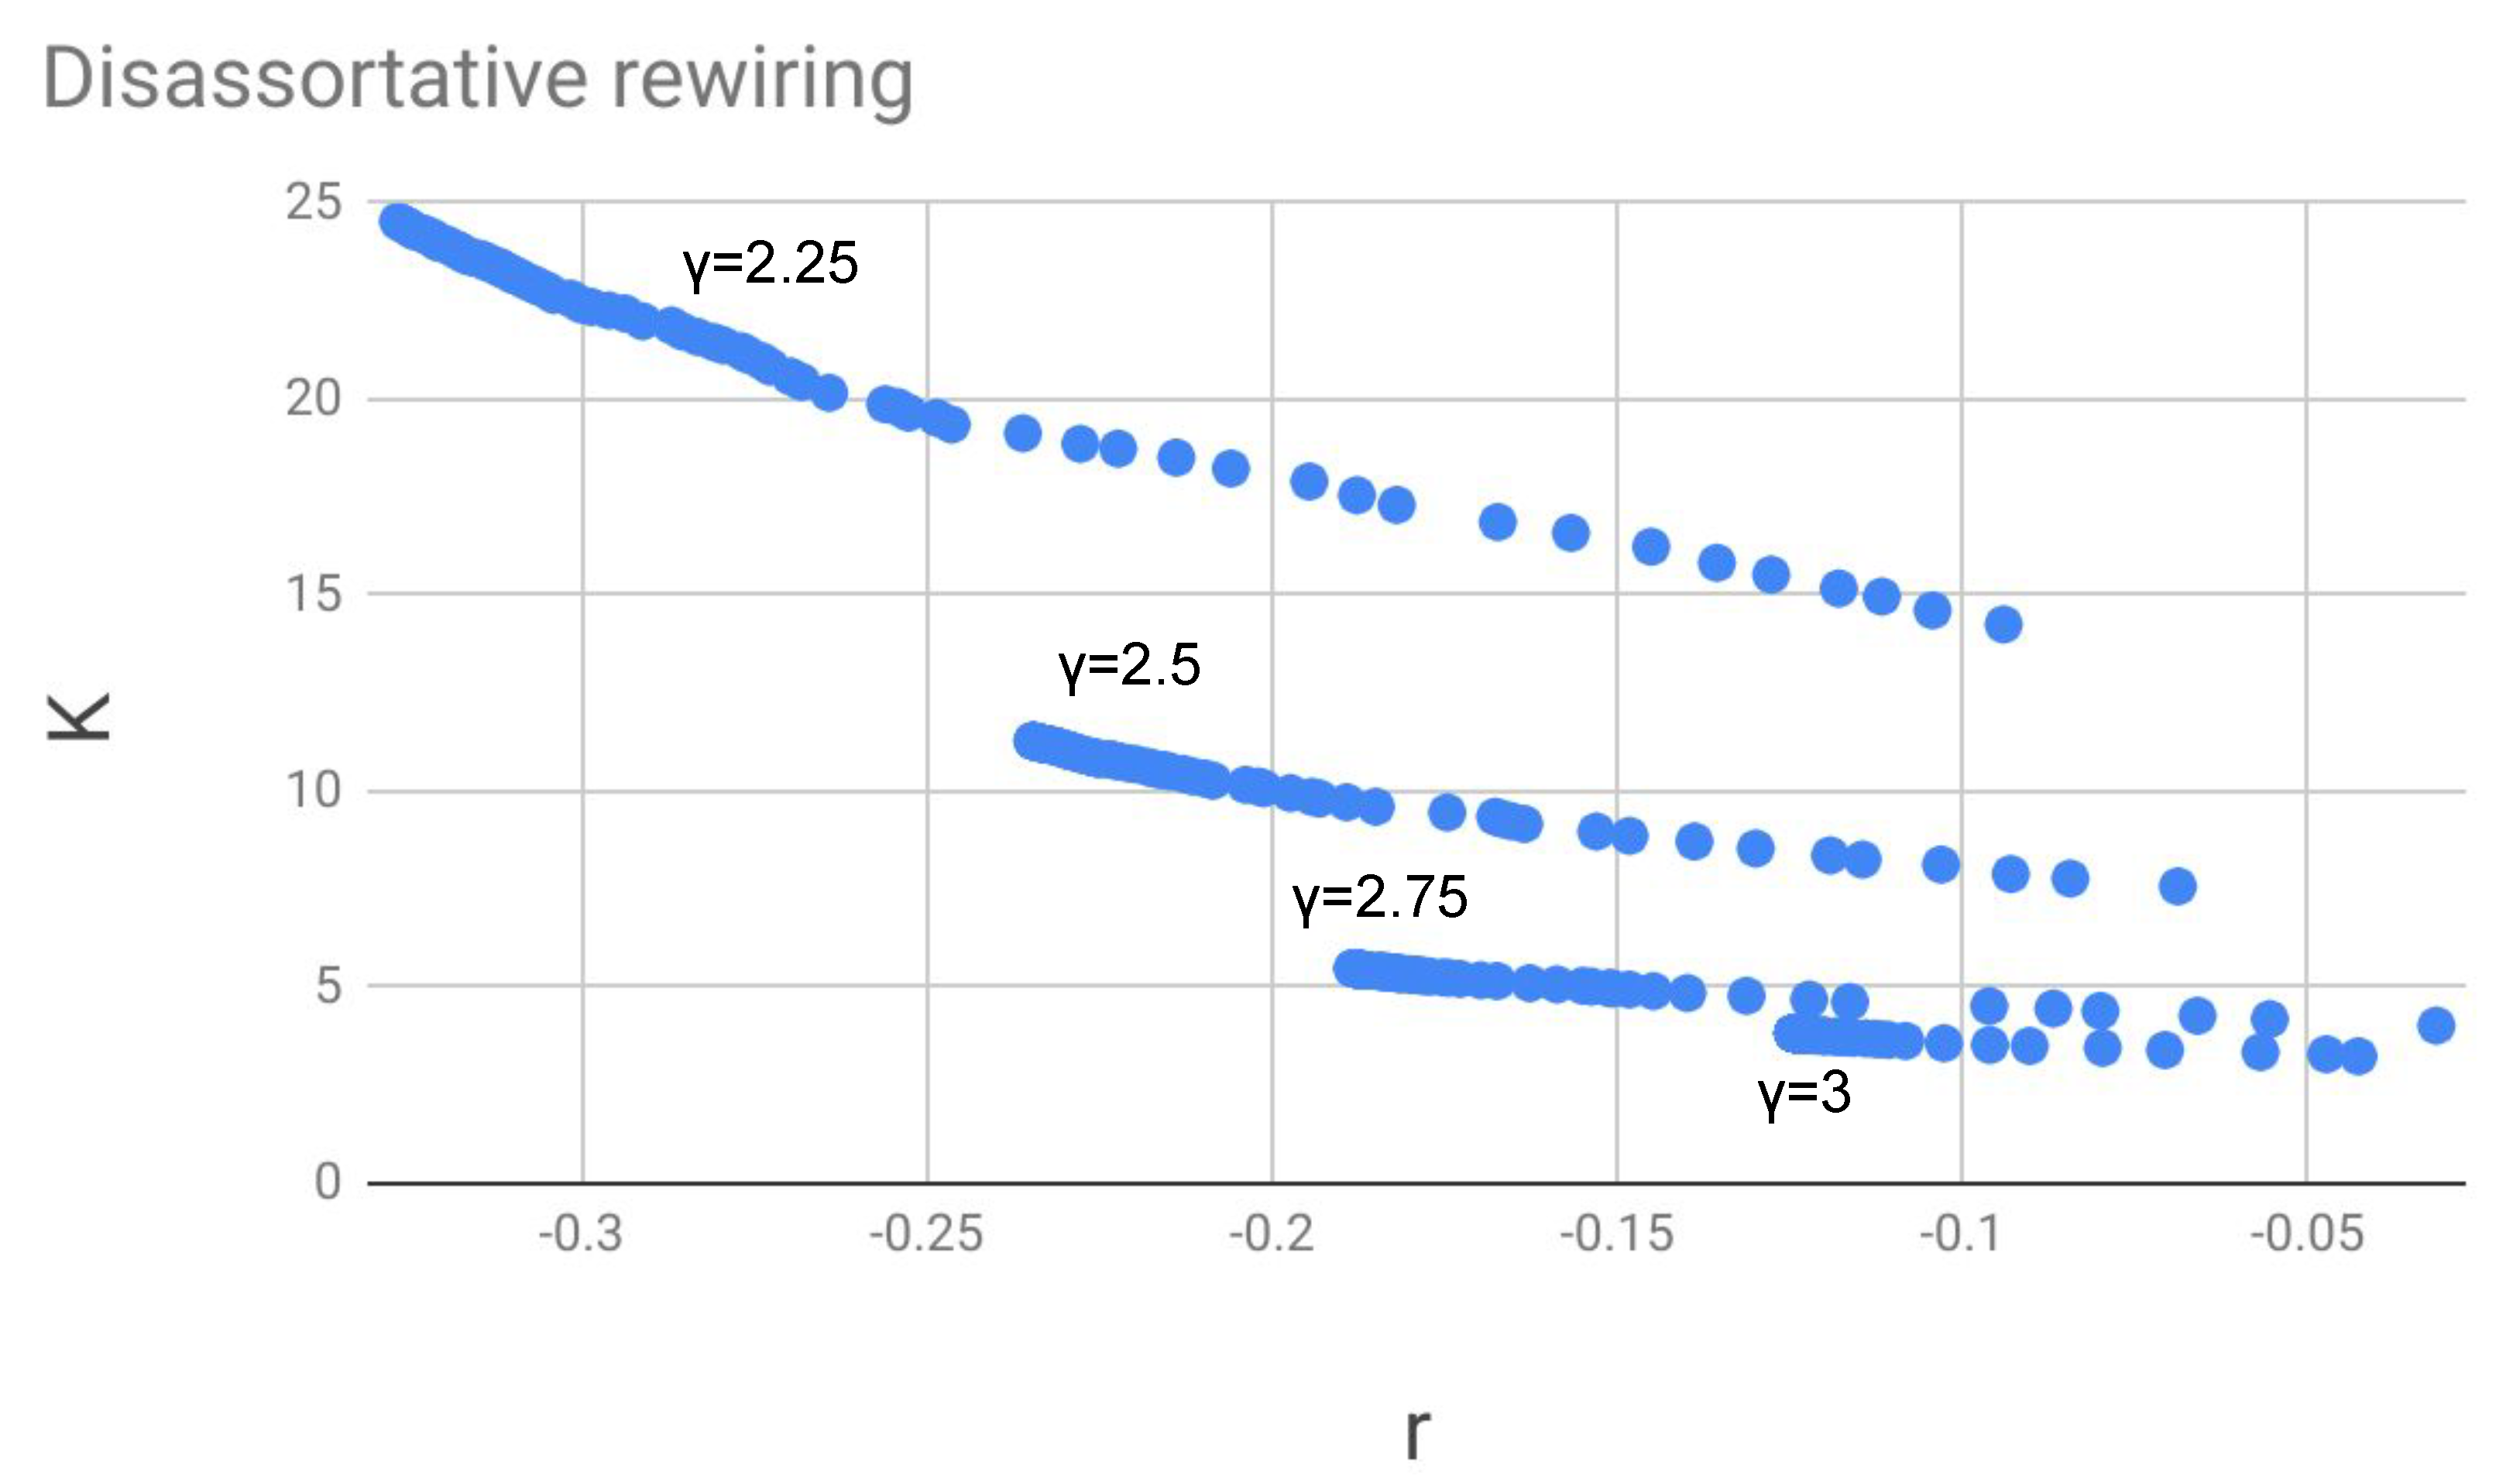
Section 5.1 we describe the “rewiring trajectories” in the
r-
K plane obtained for some different values of the scale-free exponent
(
2.25, 2.5, 2.75, 3) starting from uncorrelated networks and performing an assortative or disassortative rewiring at a low temperature, i.e., with small return probability. For some of the cases a qualitative description is given of the “super-assortative” and “super-disassortative” asymptotic networks generated.
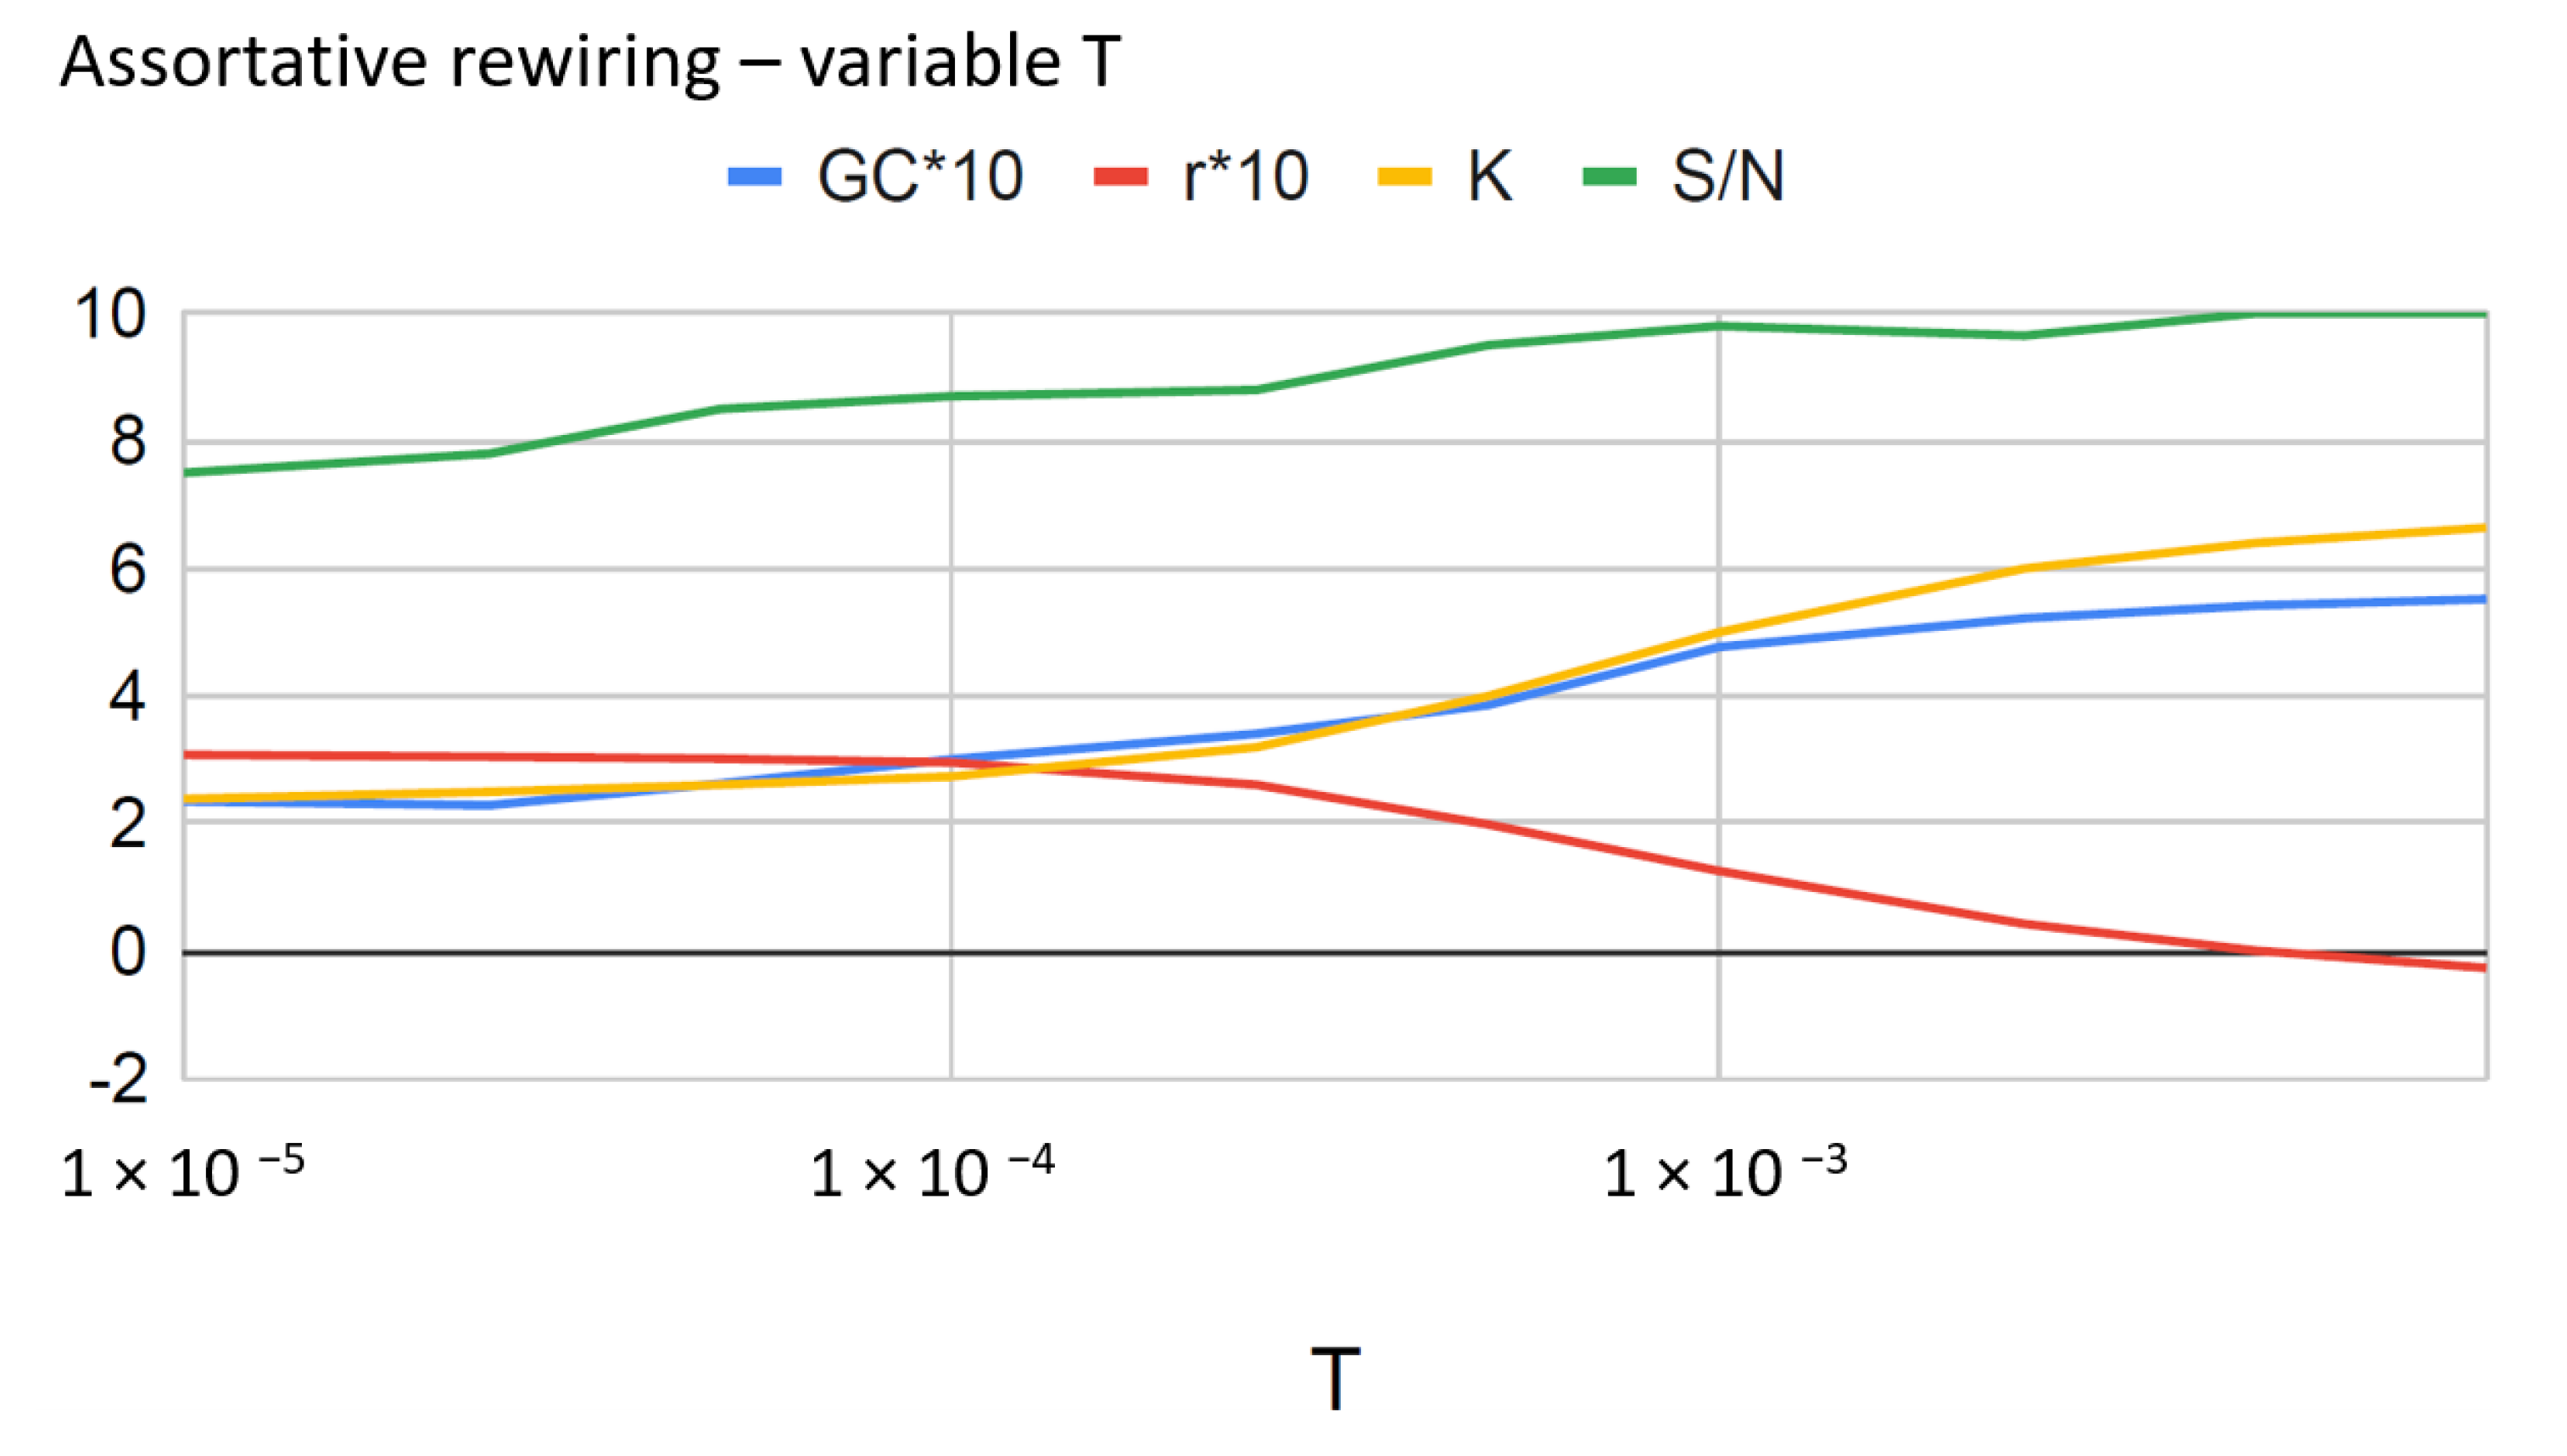
Section 5.2 describes the preliminary results of the assortative rewiring in equilibrium at variable temperature
T, with a plot showing the case
, as a function of
T, the values of the entropy
S, of
,
, and the size of the giant component.
Section 6 contains our conclusions.
2. The Function “Average Degree of the First Neighbors”
The quantity
, introduced by Boguñá et al. [
21], is defined as:
We shall denote it for simplicity
K, or
, since for a given type of network it depends only on its size, namely on the number
N of nodes (related in turn to the maximum degree
n, for scale-free networks, through the Dorogovtsev–Mendes criterion as detailed in Equation (
3)). Since
amounts to the average degree of the first neighbors of a node of degree
k and
is the probability that such a node is present,
is the average degree of the first neighbors taken over the entire network, or better the average degree of the first neighbors of a randomly chosen node. Generally speaking,
is strongly related to the diffusion properties of the network.
The definition above is probabilistic, and used for Markovian networks and for applications to mean-field equations on these networks. If we have complete knowledge of the network, we can compute
K exactly by just looking at the first neighbors of each node and computing a total average of their degrees (see
Section 4).
The authors of [
21] prove that as a function of
N,
is diverging when
in a scale-free network with exponent
, for any kind of correlations (at least when the function
has a certain form). This property is employed to conclude that in the “thermodinamic” limit of large
N, phenomena of epidemic diffusion always propagate to the entire network, no matter how small the contagion probability is (“absence of epidemic threshold”). The intuitive reason is that although the average number of neighbors
tends to a constant for large
N, the average degree of these neighbors tends to infinity. This means that each node is very close to a hub from which the epidemics can easily spread.
In the following two sub-sections we give some examples of computation of the function in Markovian networks, as an introduction to the results obtained through the rewiring of real networks.
2.1. Uncorrelated Networks
For an uncorrelated network we obtain for
a simple expression. We have in this case:
Therefore
does not depend on
k:
and
where we have used the normalization condition
and the last inequality is due to the fact that in general
.
The inequality expresses the well-known property that in an uncorrelated network, from the point of view of one node looking at its first neighbors, on the average “my friends have more friends than me” (because their average degree is and my degree is k). As we shall see, this property is also numerically confirmed for correlated networks, at least in the scale-free case.
The dependence from
N in the expression of Equation (
2) for
arises as follows. First note that when we consider a finite network with maximal degree
n, the normalization condition of
is
. Therefore the properly normalized degree distribution
for a scale-free network is:
The quantities
and
, respectively equal to
and
, depend on
n through the factor
and the upper limit of the sum. However, in the limit of large
n the factor
tends to a constant and
is convergent for
; the dependence of
on
n comes from the divergent series
.
Approximating with an integral the dependence of the series on its upper limit, we obtain for large
n:
and
Of course, for
k close to 1 the integral is not a good approximation of the series; furthermore, if the sum starts from a value
, the factor
has a substantial dependence on
(see
Table 1), as we shall later see in some examples. Here, however, we are interested into the divergent dependence of
K on
n.
In order to relate the maximum degree
n to the number of nodes
N we make recourse to the integral criterium of Dorogovtsev–Mendes [
22], which states that the probability to have in the network a node with degree in the range
must be equal to 1, implying:
From this we obtain the known relation:
An example of exact values of the various quantities involved is given in
Table 1.
2.2. Correlated Networks
In order to obtain for a correlated network we must compute numerically the sum over k starting from an explicit expression for , if known, or else expressing also as a sum, according to its definition .
A simple formula which defines assortative correlations has been proposed by Vazquez and Weigt [
14] and has been employed in [
24] for diffusion studies. It is a linear combination of an uncorrelated term and a totally assortative term proportional to
, namely:
where
r ranges from 0 to 1 and coincides with the Newman assortativity coefficient.
From this matrix one obtains:
whence
It follows that for fixed
n (which also fixes
and
), when
one has
, corresponding to the fact that in the case of extreme assortativity each node is only connected with other nodes having the same degree. We shall show in forthcoming work, however, that for a real scale-free network this limit is purely hypothetical, because the function
cannot increase linearly for large
k, but eventually must decrease.
Further evaluations of
as a function of
N for assortative networks, built using a different set of
matrices [
15,
25], and for disassortative networks will be given elsewhere.
In any case, for fixed
N the value of
K is quite useful in characterizing the network and depends strongly on the type of correlations, on the scale-free exponent and on the minimum degree. A first example is given in
Table 1 for Markovian networks. Then in
Section 5.1 and
Section 5.2 we investigate the behavior of
K for real rewired networks. An exact direct calculation of
K from the list of links of a real network can be efficiently implemented and compared with the average value of
K obtained from the
function.
2.3. Local Variation of K
The variation of
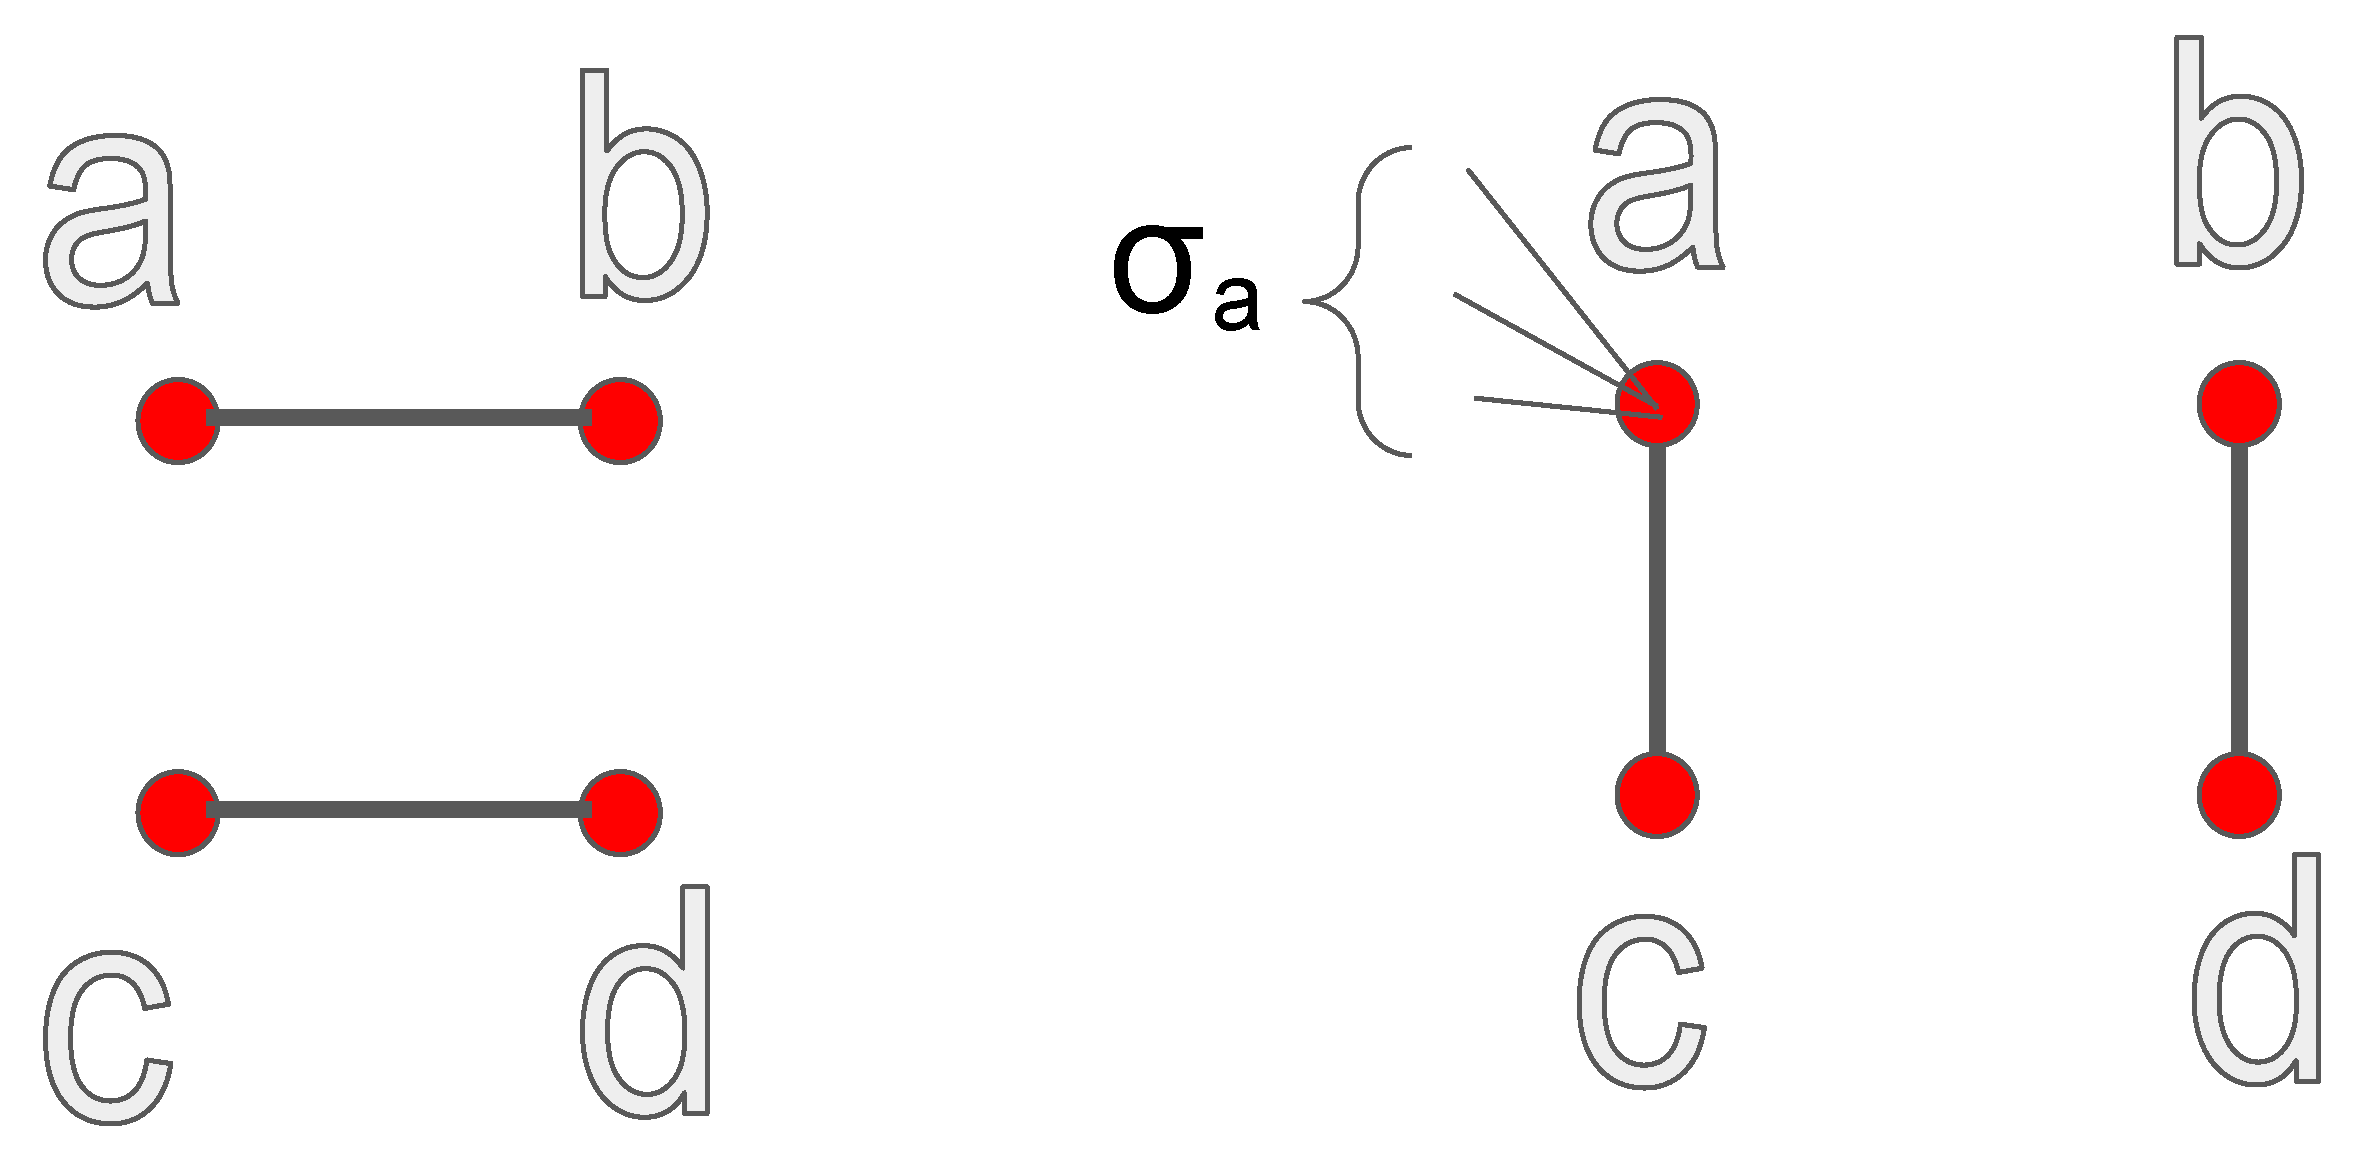
K in a rewiring step is obtained using its definition as the average degree of the first neighbors of each node, averaged over the whole network. Let
denote respectively the degrees of the nodes
involved in the rewiring (see
Figure 1). Let
denote the sum of the degrees of the first neighbors of the node
a, which are not involved in the rewiring, and similarly define
,
,
. Before the rewiring the averages
of the degrees of the first neighbors of
are:
After the rewiring, these quantities become:
Therefore the change in the total average
K is:
2.4. Relation between the Local Variations of K and r
In previous work [
16] we found an expression for the local variation of the Newman coefficient in a rewiring of the same kind as in
Figure 1. The variation is given by:
where
L is the number of links in the network and
is the denominator of the fraction which defines
r, namely:
Here
is the probability of finding in the network a link between nodes with excess-degrees
j and
k and
is the excess-degree distribution. Note that
and
depend on the degree distribution but not on the correlations. Also note that in [
16] a slightly different notation is used, in which
denote directly the excess-degrees. However, since:
we can safely use Equation (
6) according to the conventions of this paper, where
are the degrees and not the excess-degrees.
After some algebraic manipulations it is possible to express the variation
in Equation (
5) in terms of
, thus establishing a relation between two quantities which have very different definitions and topological meaning. We find:
This holds for each rewiring. The factor
is fixed for a given degree distribution, while the factor
clearly depends on the nodes involved; we only know a priori that it is always positive, and as a consequence
is always opposite to
and
if and only if
. For the rewiring trajectories described in
Section 5.1 the ratio
, averaged over many rewirings, turns out to be approximately constant for a given degree distribution; see data in
Table 2.
3. The Average Number of Second Neighbors
The condition for the existence of a giant component in an uncorrelated network with arbitrary degree distribution has been first found by Molloy and Reed [
26] and is expressed by the inequality:
Later the same condition has been proven by Newman, Strogatz, and Watts with the method of the generating functions, which also allows one to find the size of the giant component [
27]. In [
27] the inequality in Equation (
10) is reformulated in an intuitive way by stating that the giant component exists when
, where
is the average number of second neighbors and
(the average degree) can also be interpreted as the average number of first neighbors. A crucial underlying assumption is that the network is locally a branching structure; moreover, being the network uncorrelated, one supposes that there are no preferences in linking behavior depending on the node degrees and that therefore it makes sense to consider total averages like
and
.
We are now going to define a quantity that is closely related to
and will show that starting from the intuitive “percolation” condition
, Equation (
10) can be immediately obtained without using the generating functions.
We call this quantity “average number of second neighbors in the branching approximation” and denote it by . It is a network average like , but includes by definition multiple counting in the case of shared second neighbors. More precisely, if one node has a second neighbor b in common with other h nodes , then b is counted times in the average . The two quantities and coincide if the network is a pure branching structure, without nodes that have second neighbors in common with other nodes.
According to this definition,
can be obtained as:
because the probability for a node to have degree
k is
, the node has
k first neighbors and their average degree is
.
Let us compute
for an uncorrelated network:
This expression gives the Molloy–Reed condition if we require
and admit that the network is a locally branching structure such that
.
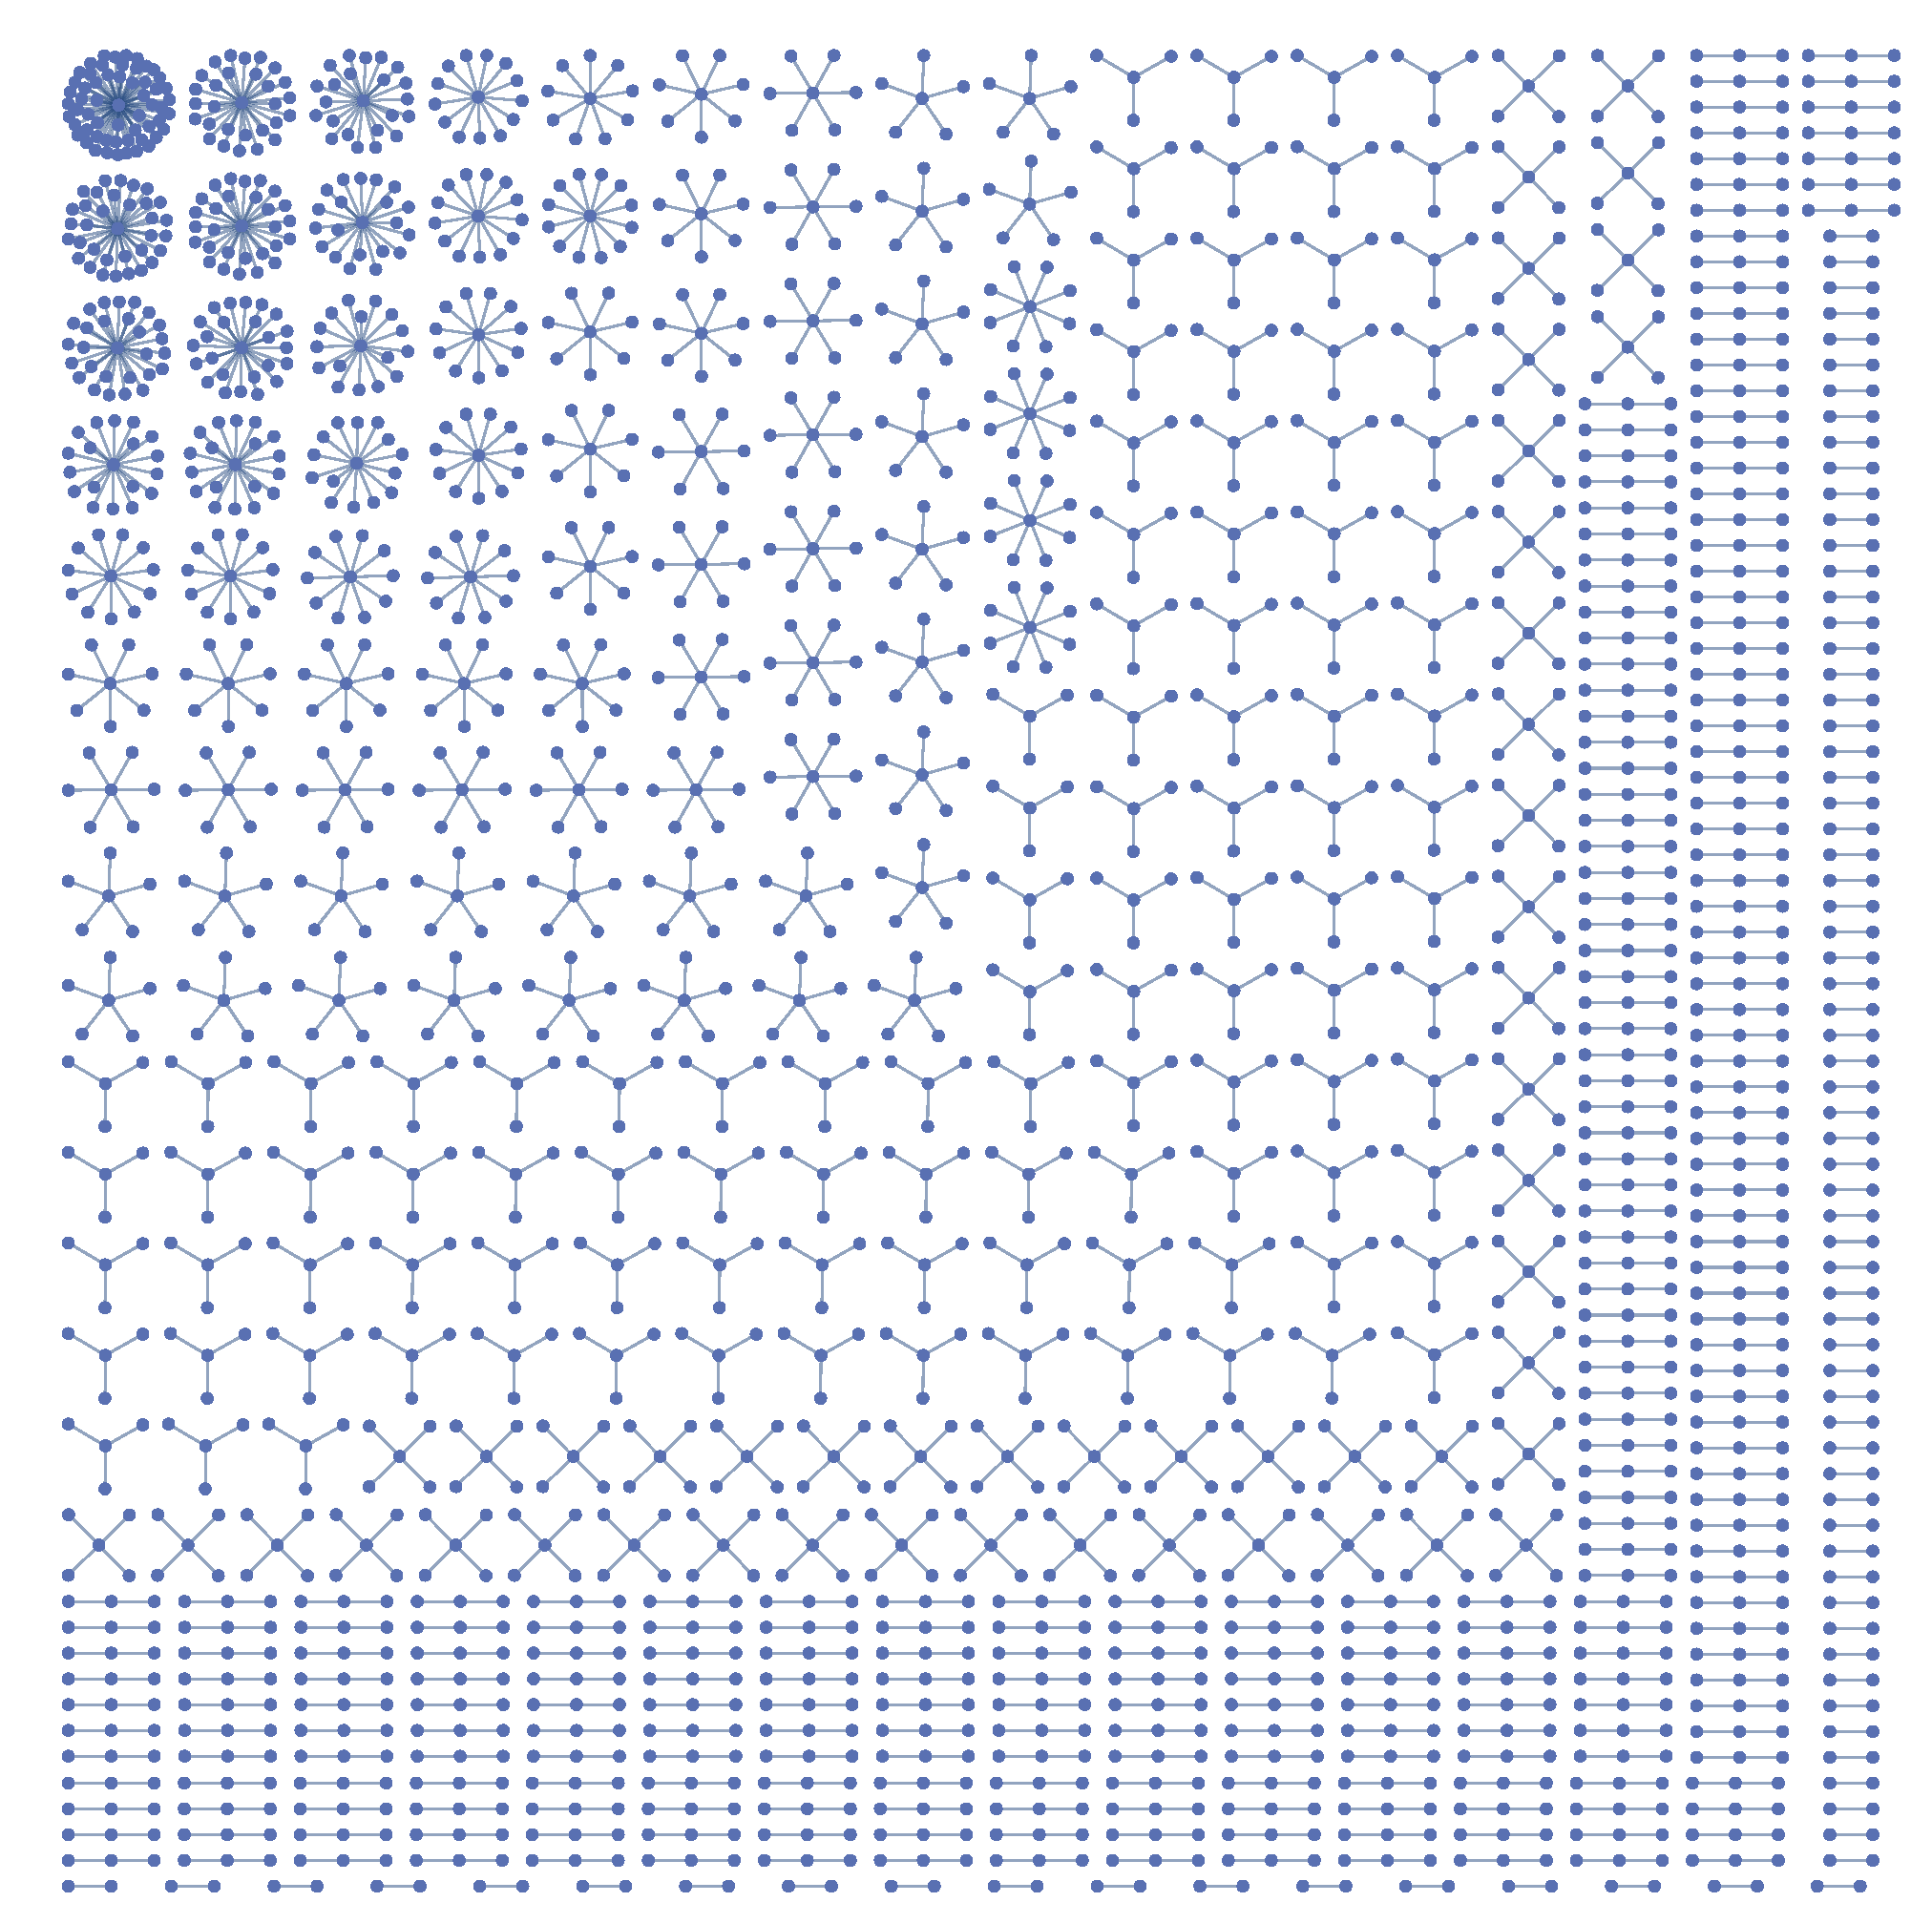
Equation (
11) for
is interesting in itself and we have used our code for the configuration model with rewiring in order to test it. The code generates a list, called the “
Friends” list, of the first neighbors of each node. The list is updated and used in many parts of the program, for instance after the first wiring of the stubs, in order to check that the nodes’ degrees match the prescribed degree distribution. It is also used at the end of the rewiring cycles, in order to find the giant component of the final network, and possibly for the numerical solution of diffusion equations in first or second closure approximation. It is straightforward to use the
Friends list to also obtain the number of second neighbors of each node, because the degrees of the nodes do not change in the rewiring and are stored in a vector “
Degrees[i]”, with
, fixed from the degree distribution before the wiring. The contribution to
from each node is obtained as the sum of (
degree of each friend − 1). The total network average
is the sum of the contributions of all nodes, divided by
N. One can check that the exact value obtained in this way is well approximated by the probabilistic value in Equation (
11).
Somewhat unexpectedly, the exact obtained value of is accurately reproduced in each simulation with the same degree distribution, signaling that it is not affected by the rewiring. In fact, the following two properties hold, which are not difficult to prove but cannot be found in the literature, to the best of our knowledge.
Property 1 (Property of
).
For Markovian networks which satisfy the Network Closure Condition , does not depend on the correlations but only on the degree distribution, and it is equal to the value obtained for an uncorrelated network having that degree distribution (Equation (13)). In fact the first term on the r.h.s. in Equation (
11), namely
, is equal to
, as already noted in [
21]:
(because
). The second term is equal to
, which is fixed if the degree distribution is fixed.
Property 2 (Property of ). does not change in a binary rewiring which preserves the degree distribution.
This is a direct consequence of the definition of the rewiring (see
Figure 1). Let
denote, as before, the sum of the degrees of the first neighbors of the node
a which are not involved in the rewiring, and similarly define
,
,
. Let
denote the degrees of the nodes. The total number of second neighbors of the four nodes involved in the rewiring is equal, before the rewiring, to:
After the rewiring we have:
and the two quantities are equal.
These properties offer a strong indication for the absence of epidemic threshold in correlated large scale-free networks with . In fact, in this range of , diverges when . Denoting by the contagion probability for one single contact, consider an infected node randomly chosen, thus with the average degree . The probability that the node infects one of its neighbors is , which tends to zero if is very small. However, the probability that the node infects one of its second neighbors is (for a locally branching structure) equal to , and this quantity can stay finite even as , because of the divergence of , independently from the degree correlations.
4. The Rewiring Algorithm
In the first part of the algorithm, the “wiring” part, we generate a series of
“stubs” with given degree distribution, like in any implementation of the configuration model. The exact procedure for assigning the degrees to the hubs has two possible alternatives and has been described in [
16]. In the first alternative (“cumulative hubs”), the probability of hubs for which
is cumulated with increasing
k until it exceeds 1, at which point the hub is created and the accumulation starts again. In the second alternative (“random hubs”), hubs of degree
k are created entirely at random with probability
.
For a description of the linking of the stubs the reader is referred to [
16]. Details of this procedure are little relevant because the extensive rewiring that follows cancels any memory of the initial wiring scheme.
When we perform a rewiring step, we choose at random two links in the current list of links describing the network, say
and
(nodes are identified by a sequential number in the range
, so
denote this number). With a probability of 50% we exchange
a and
b, to avoid any asymmetry, and then we build the new links
,
. In order to avoid the formation of loops, the rewiring is not performed if
or
. The formation of multi-links (more than one link between the same two nodes) is avoided through a check of the adjacency matrix
, which is computed from the list of links before the rewiring cycle and updated after each rewiring according to formulas:
(plus the symmetrical variations for
etc.).
The knowledge of the adjacency matrix also allows one to compute the Shannon entropy of the network (see [
28] and references) by ensemble-averaging
A over sub-cycles. For instance, consider a typical rewiring cycle with 100 sub-cycles of
steps each, for a network with
. The values of
, with
at the end of each sub-cycle are averaged to compute
S according to the formula:
The number of sub-cycles is increased until the result stabilizes. The averages of
r and
K are also computed in the same way. A long rewiring process of this kind is used to compute
S and other quantities as functions of the temperature; see results in
Section 5.2.
When the rewiring temperature is very low one can actually observe that the value of r changes by or less, and the entropy becomes very small. This is because when the network is very close to its maximum possible assortativity or disassortativity, almost all rewiring steps are rejected, changes in r are very small and the adjacency matrix remains practically constant (thus is either very close to 0 or 1, with small contribution to S).
In its present form the algorithm has been applied to relatively small networks ( nodes), because the double sum involved in the calculation of the entropy has terms and the average adjacency matrix requires much memory. For such values of N the part of the code which performs the rewiring is quite fast, taking at most a few seconds to complete. If one wants to apply the rewiring to larger networks without computing the entropy, a check of the adjacency matrix A will still be needed (especially in the assortative case) in order to avoid the formation of multi-link. However, in that case A should be handled as a sparse integer matrix, thus lowering the memory requirements.
6. Conclusions
The method of assortative and disassortative rewiring at variable
T that we presented in this work appeared to be quite effective for the generation of correlated scale-free networks. At each step of the rewiring process, our algorithm permitted a control of the variations of the assortativity coefficient
r and of the average degree of the nearest neighbors
K. The two variations were actually connected through a general relation that we have proven in
Section 2.4.
We also proved that the average number of second neighbors in the branching approximation was constant in the rewiring. This property provided further evidence for the absence of epidemic threshold in scale-free networks with exponent in the range .
If we represented an assortative or disassortative rewiring process at low temperature (i.e., with low return probability) in a r-K plane, we obtained an almost linear trajectory converging towards a point, which represents the maximally assortative or disassortative network having the given degree distribution. The position of the trajectory in the plane and its (negative) slope depended on the exponent . In general, the value of K was smaller for assortative networks, compared to uncorrelated or disassortative networks having the same degree distribution. For a fixed value of r, K was larger when was smaller, therefore the trajectories with small lie in the upper part of the plane.
The features of super-assortative and super-disassortative networks were found to depend quite strongly, for a given , on the minimum and maximum degree present in the network.
Preliminary evaluations of the network entropy, the size GC of the giant component, K and r as functions of the rewiring temperature confirmed the exact anti-correlation between r and K and indicated a positive correlation between K and GC.


