A New Parametric Life Distribution with Modified Bagdonavičius–Nikulin Goodness-of-Fit Test for Censored Validation, Properties, Applications, and Different Estimation Methods
Abstract
1. Introduction
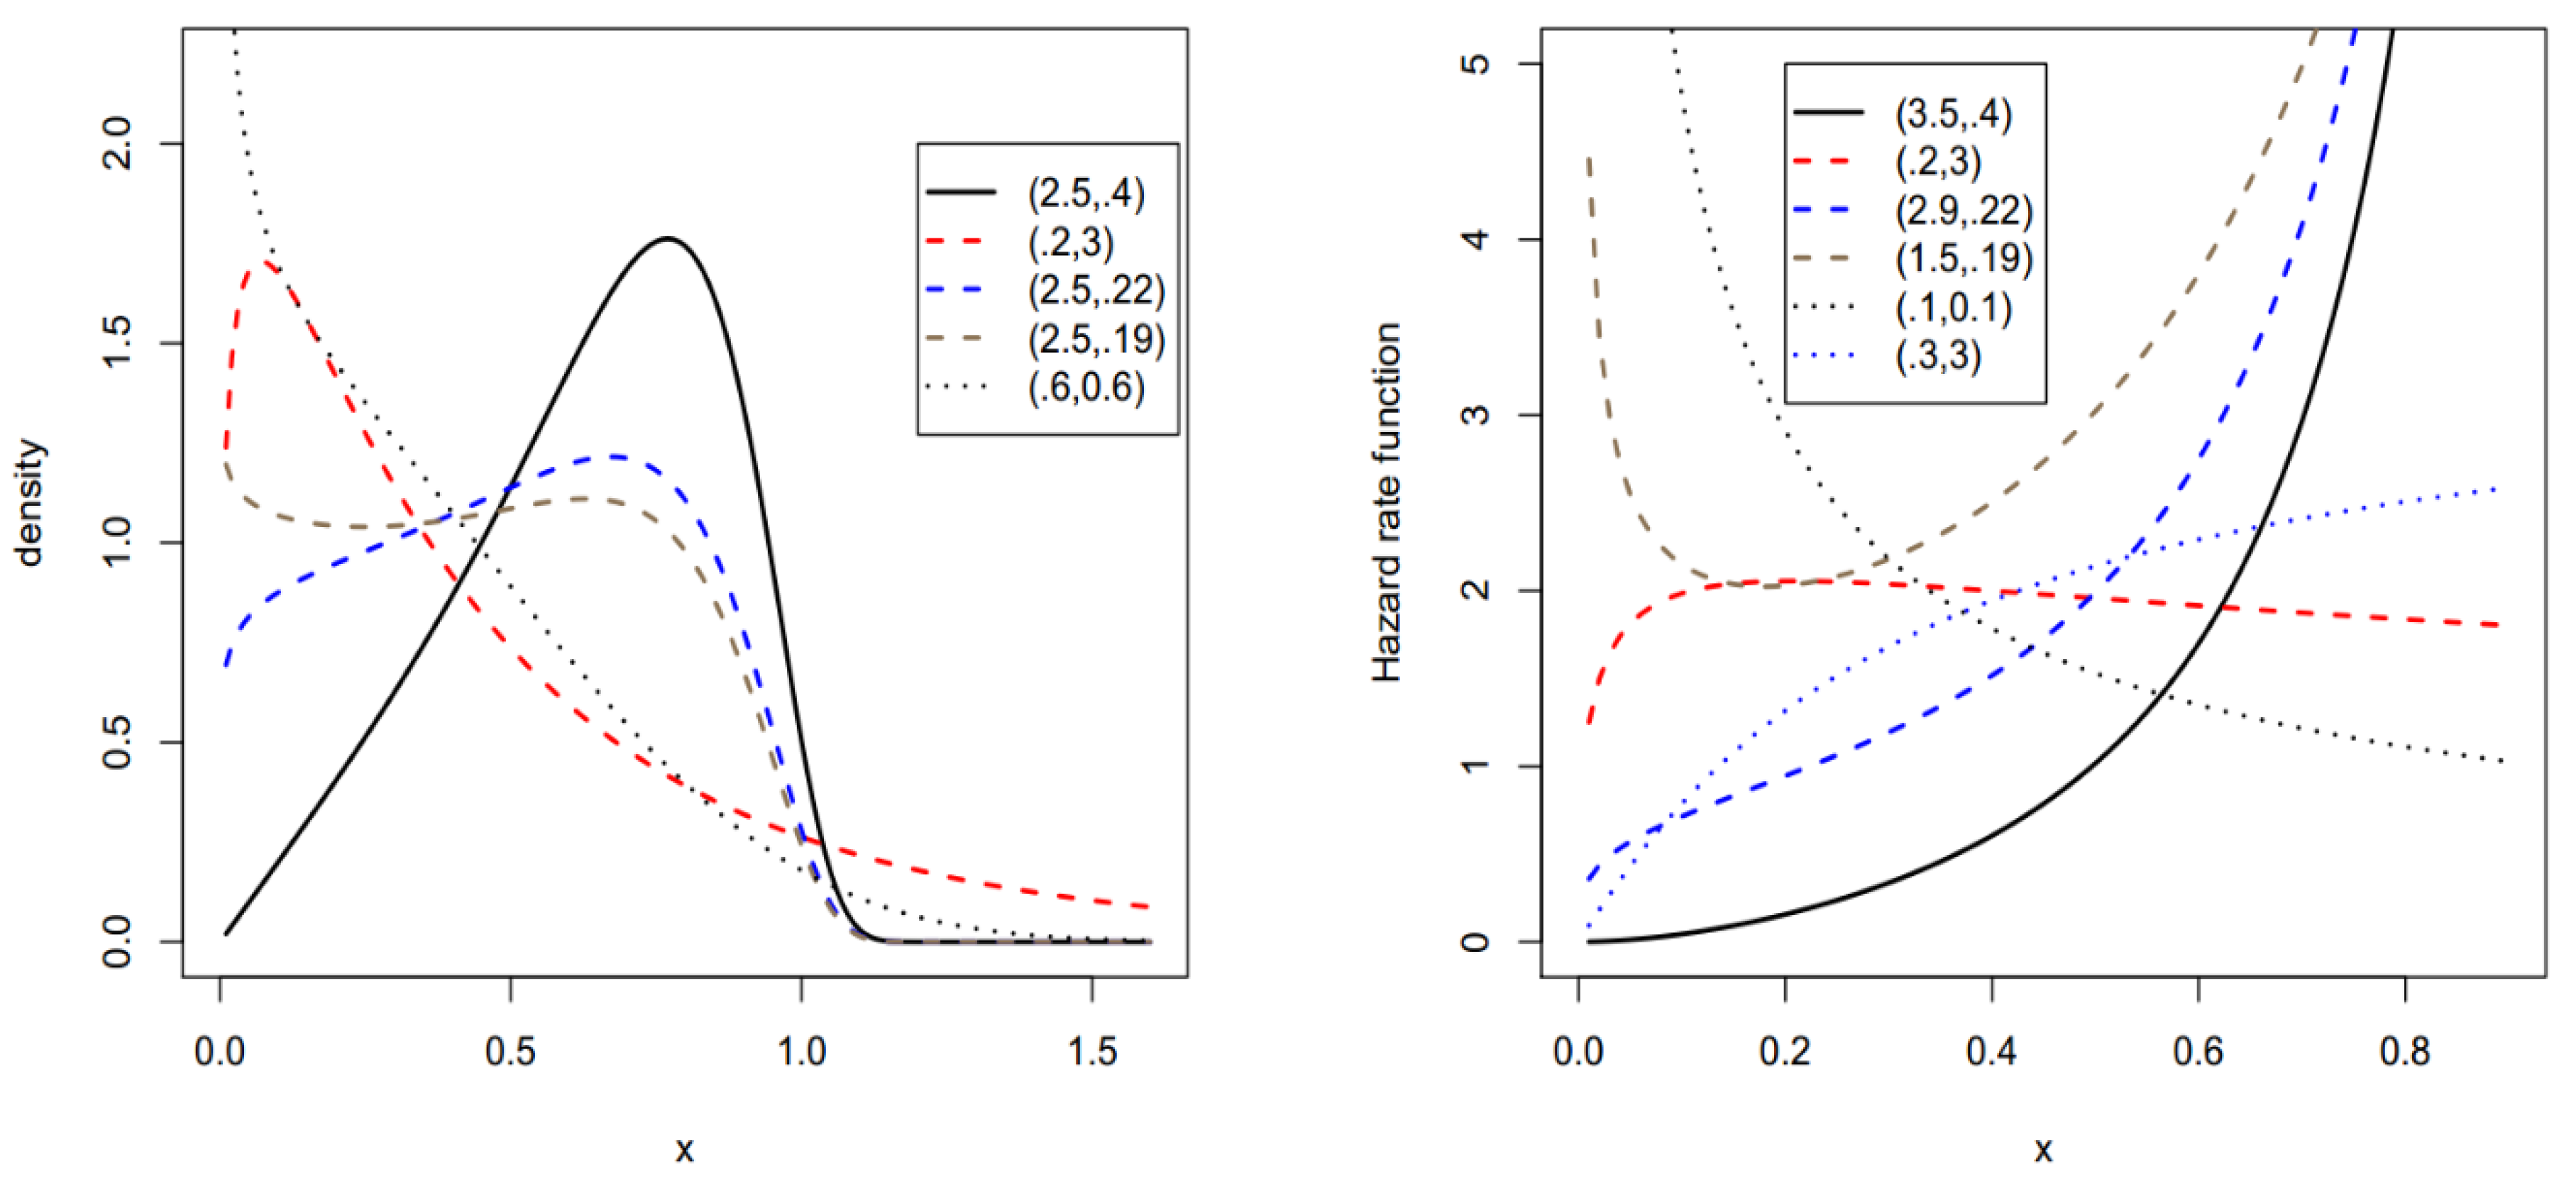
2. The BXW Model
3. Properties
3.1. Some Moments
3.2. Generating Function
3.3. Probability Weighted Moments (PWMs)
3.4. Order Statistics
3.5. Renyi and −Entropies
4. Classical Parameter Estimation
- I.
- The maximum likelihood method;
- II.
- Method of Cramer-Von-Mises estimation;
- III.
- Method of percentile estimation;
- IV.
- Method of L-moments.
4.1. The Maximum Likelihood Method
4.2. Cramer-Von-Mises Estimation Method
4.3. Method of Percentile Estimation
4.4. Method of L-Moments
5. Simulation Studies
5.1. Simulation Study for Assessing the Maximum Likilihood Method
5.1.1. Numerical Assessment
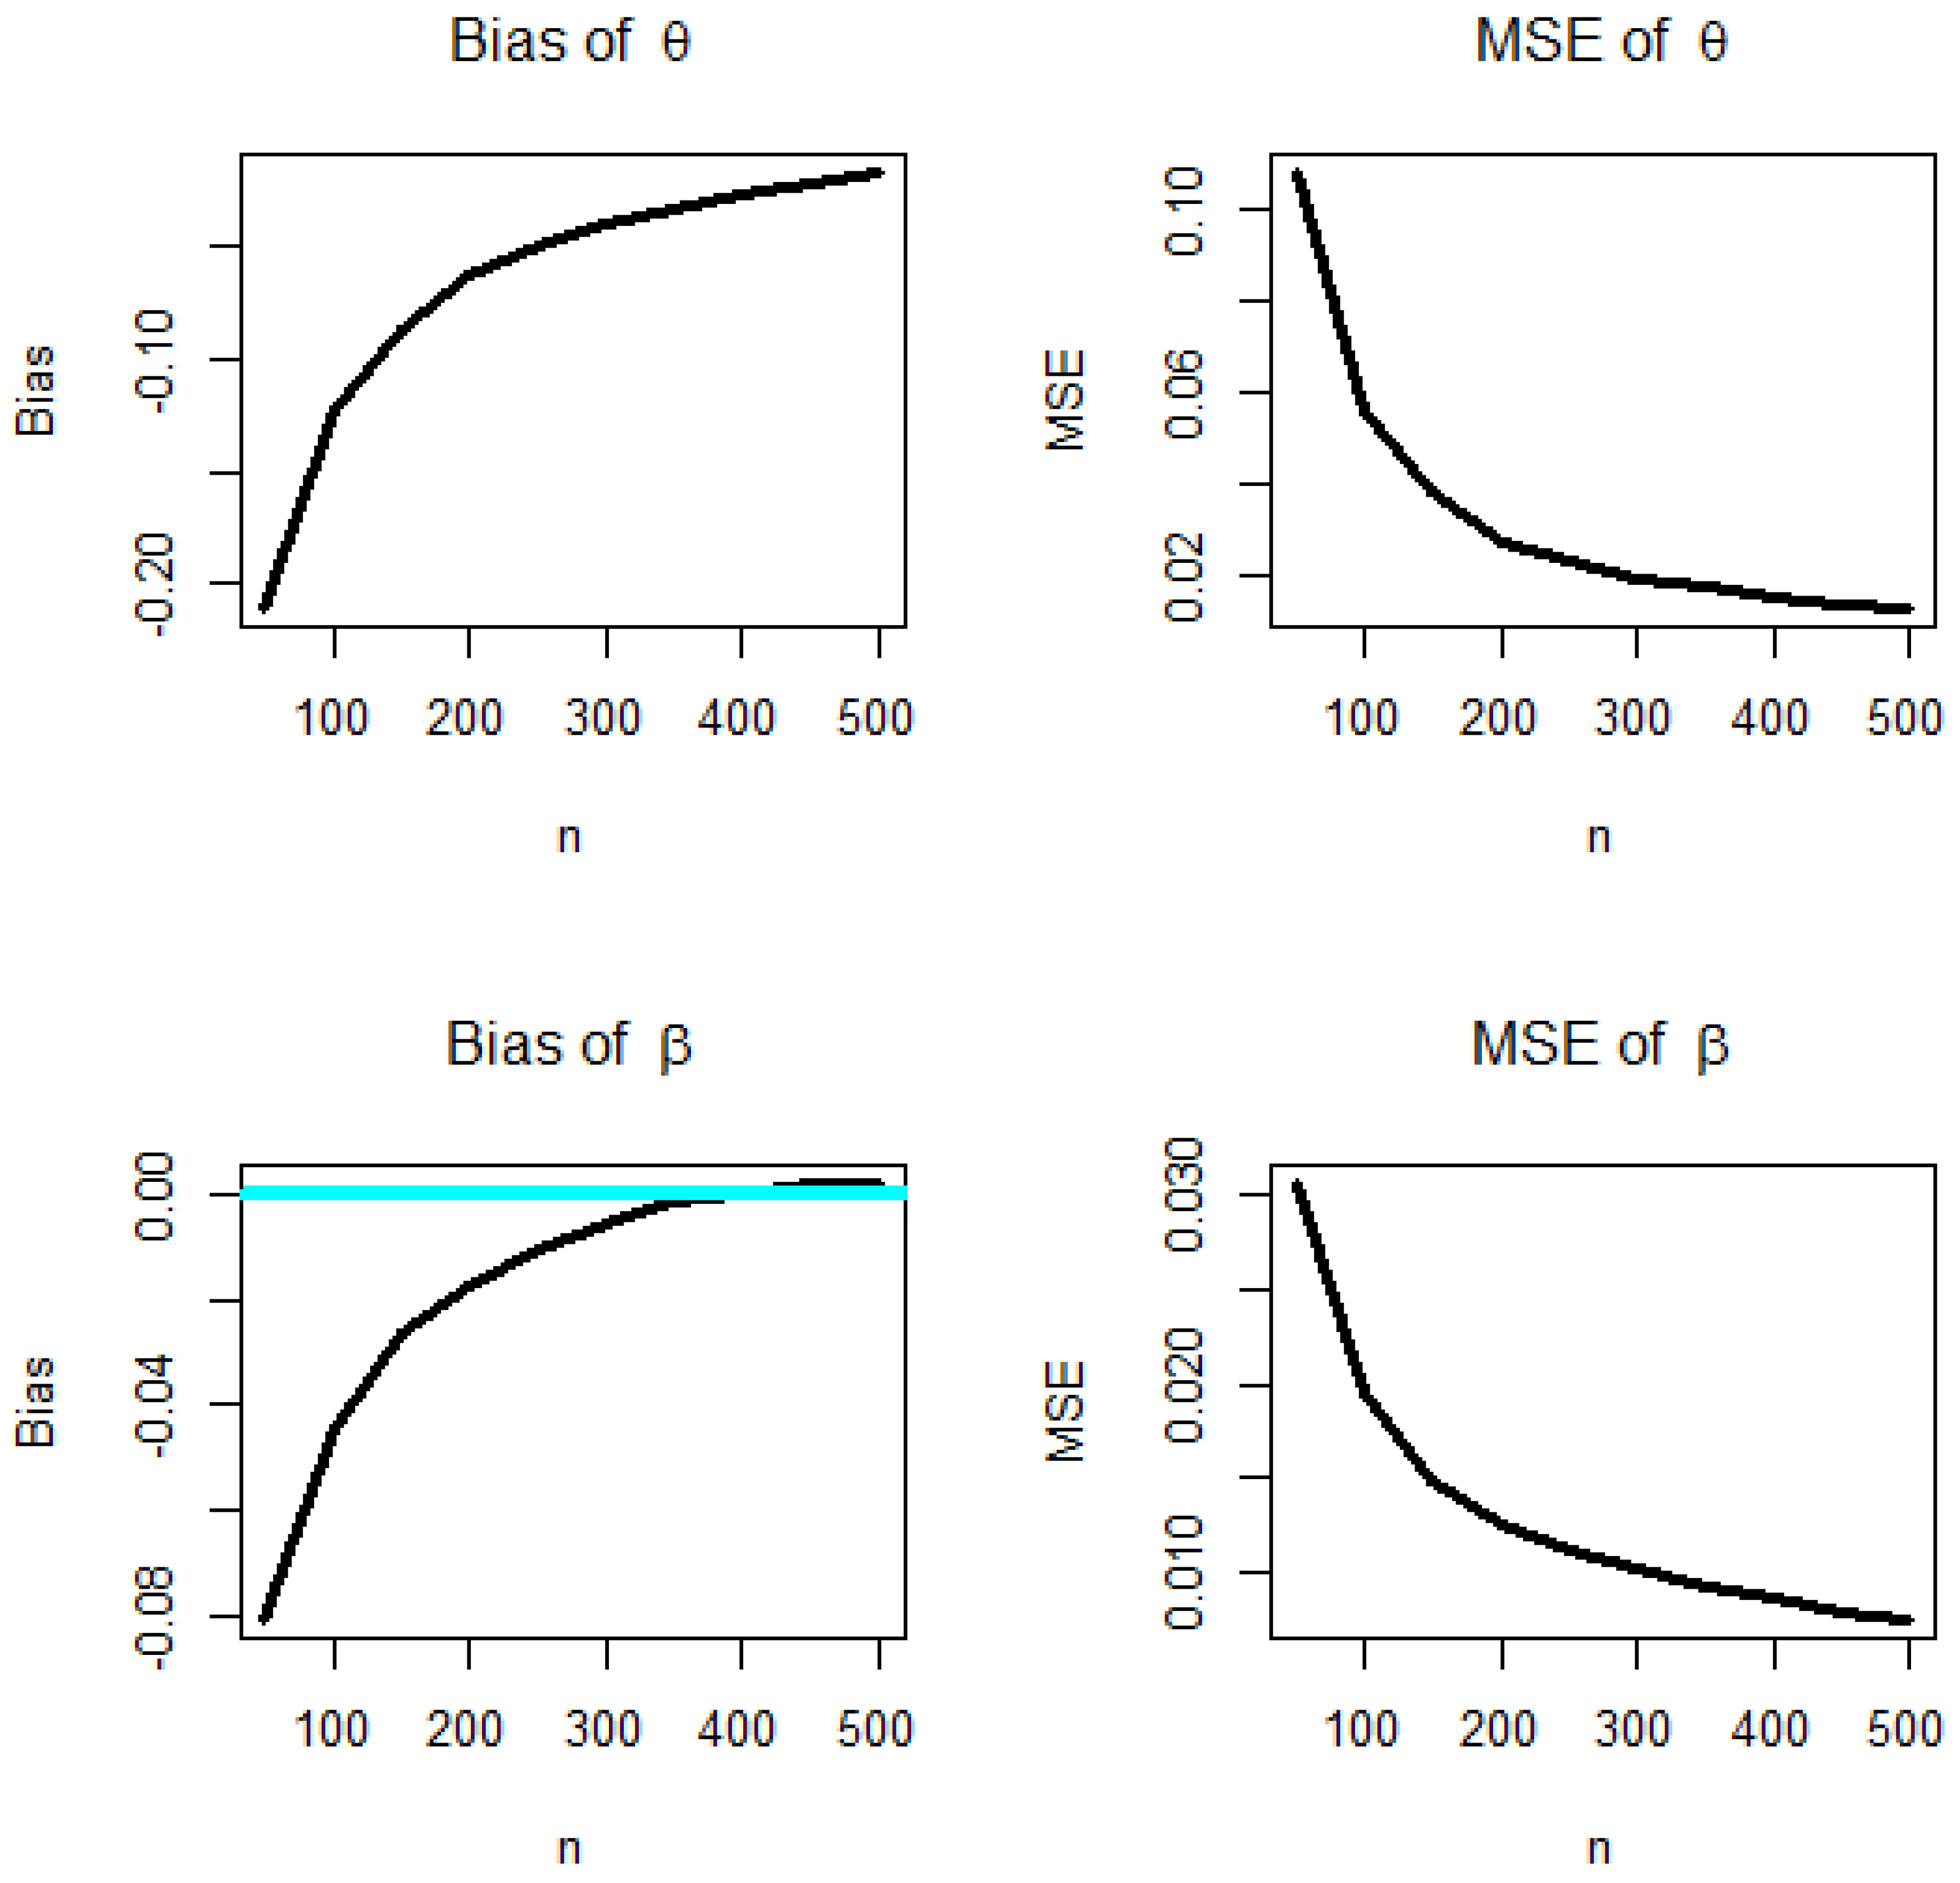
5.1.2. Graphical Assessment
- Use Equation (13) to generate 1000 samples of size n from the BXW distribution;
- Compute the MLEs for the 1000 samples;
- Compute the standard errors (SEs) of the MLEs for the 1000 samples (the standard errors (SEs) were computed by inverting the observed information matrix).
- Compute the biases and mean square errors given for .
5.2. Simulation Studies for Comparing Non-Bayesian Estimation Methods
| Parameters | I | II | III |
| θ | 2 | 0.6 | 6 |
| β | 0.5 | 0.4 | 0.1 |
6. Non-Bayesian Uncensored Applications
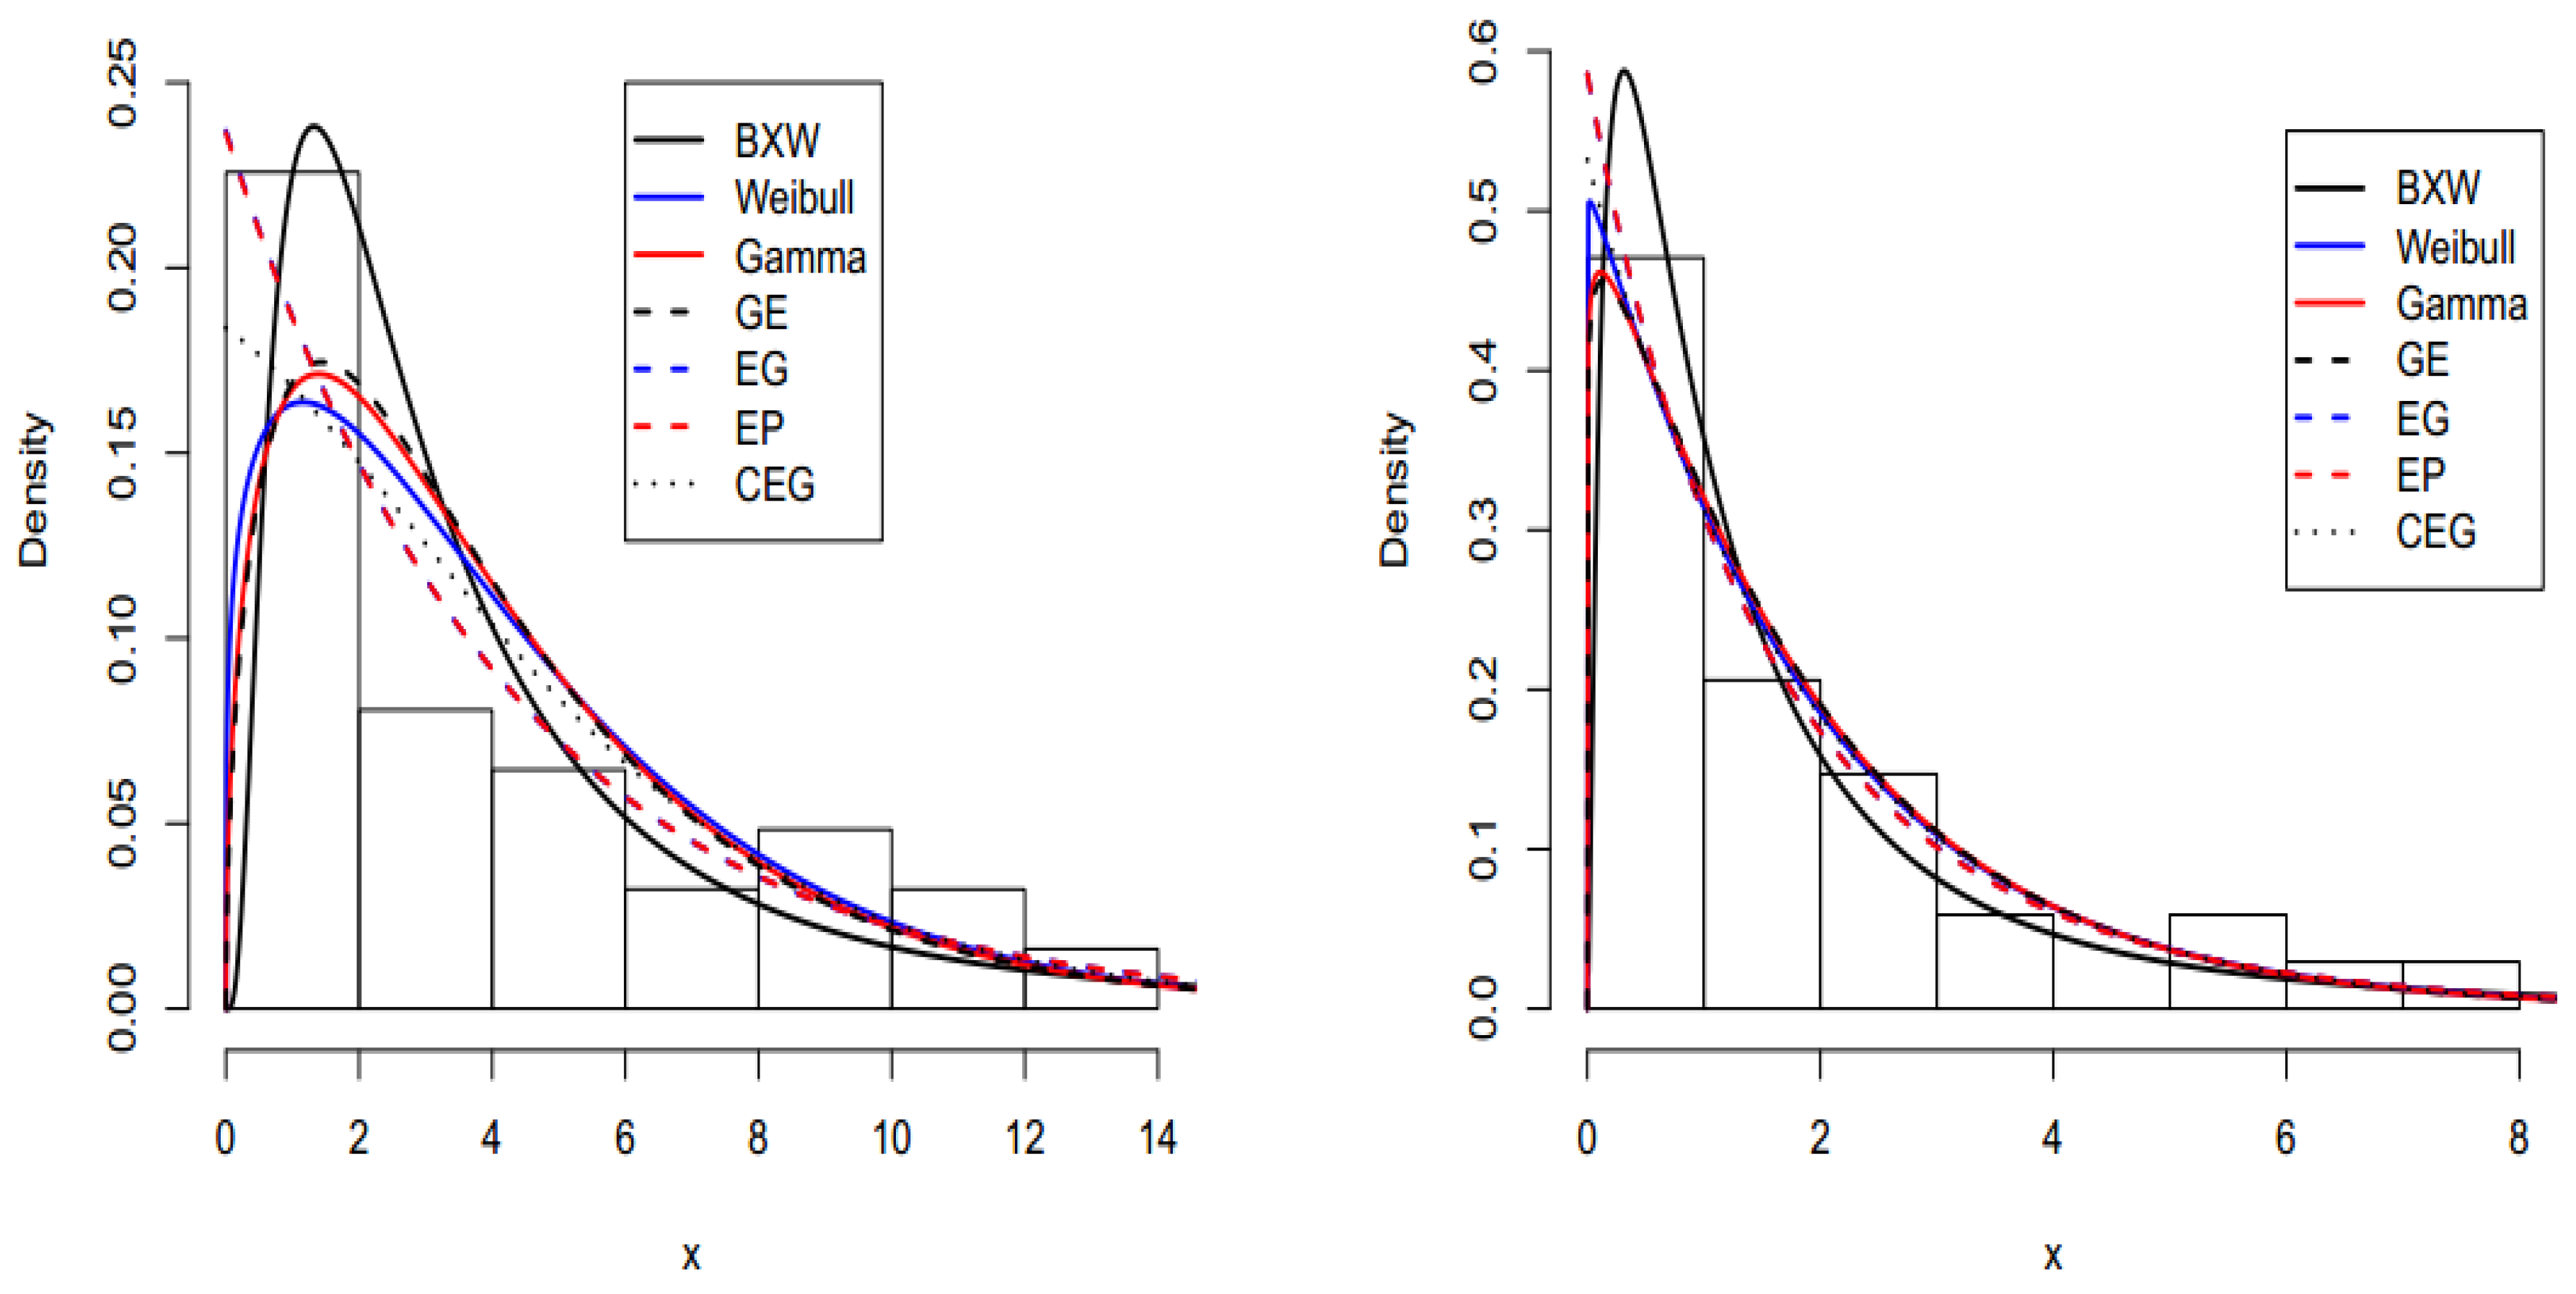
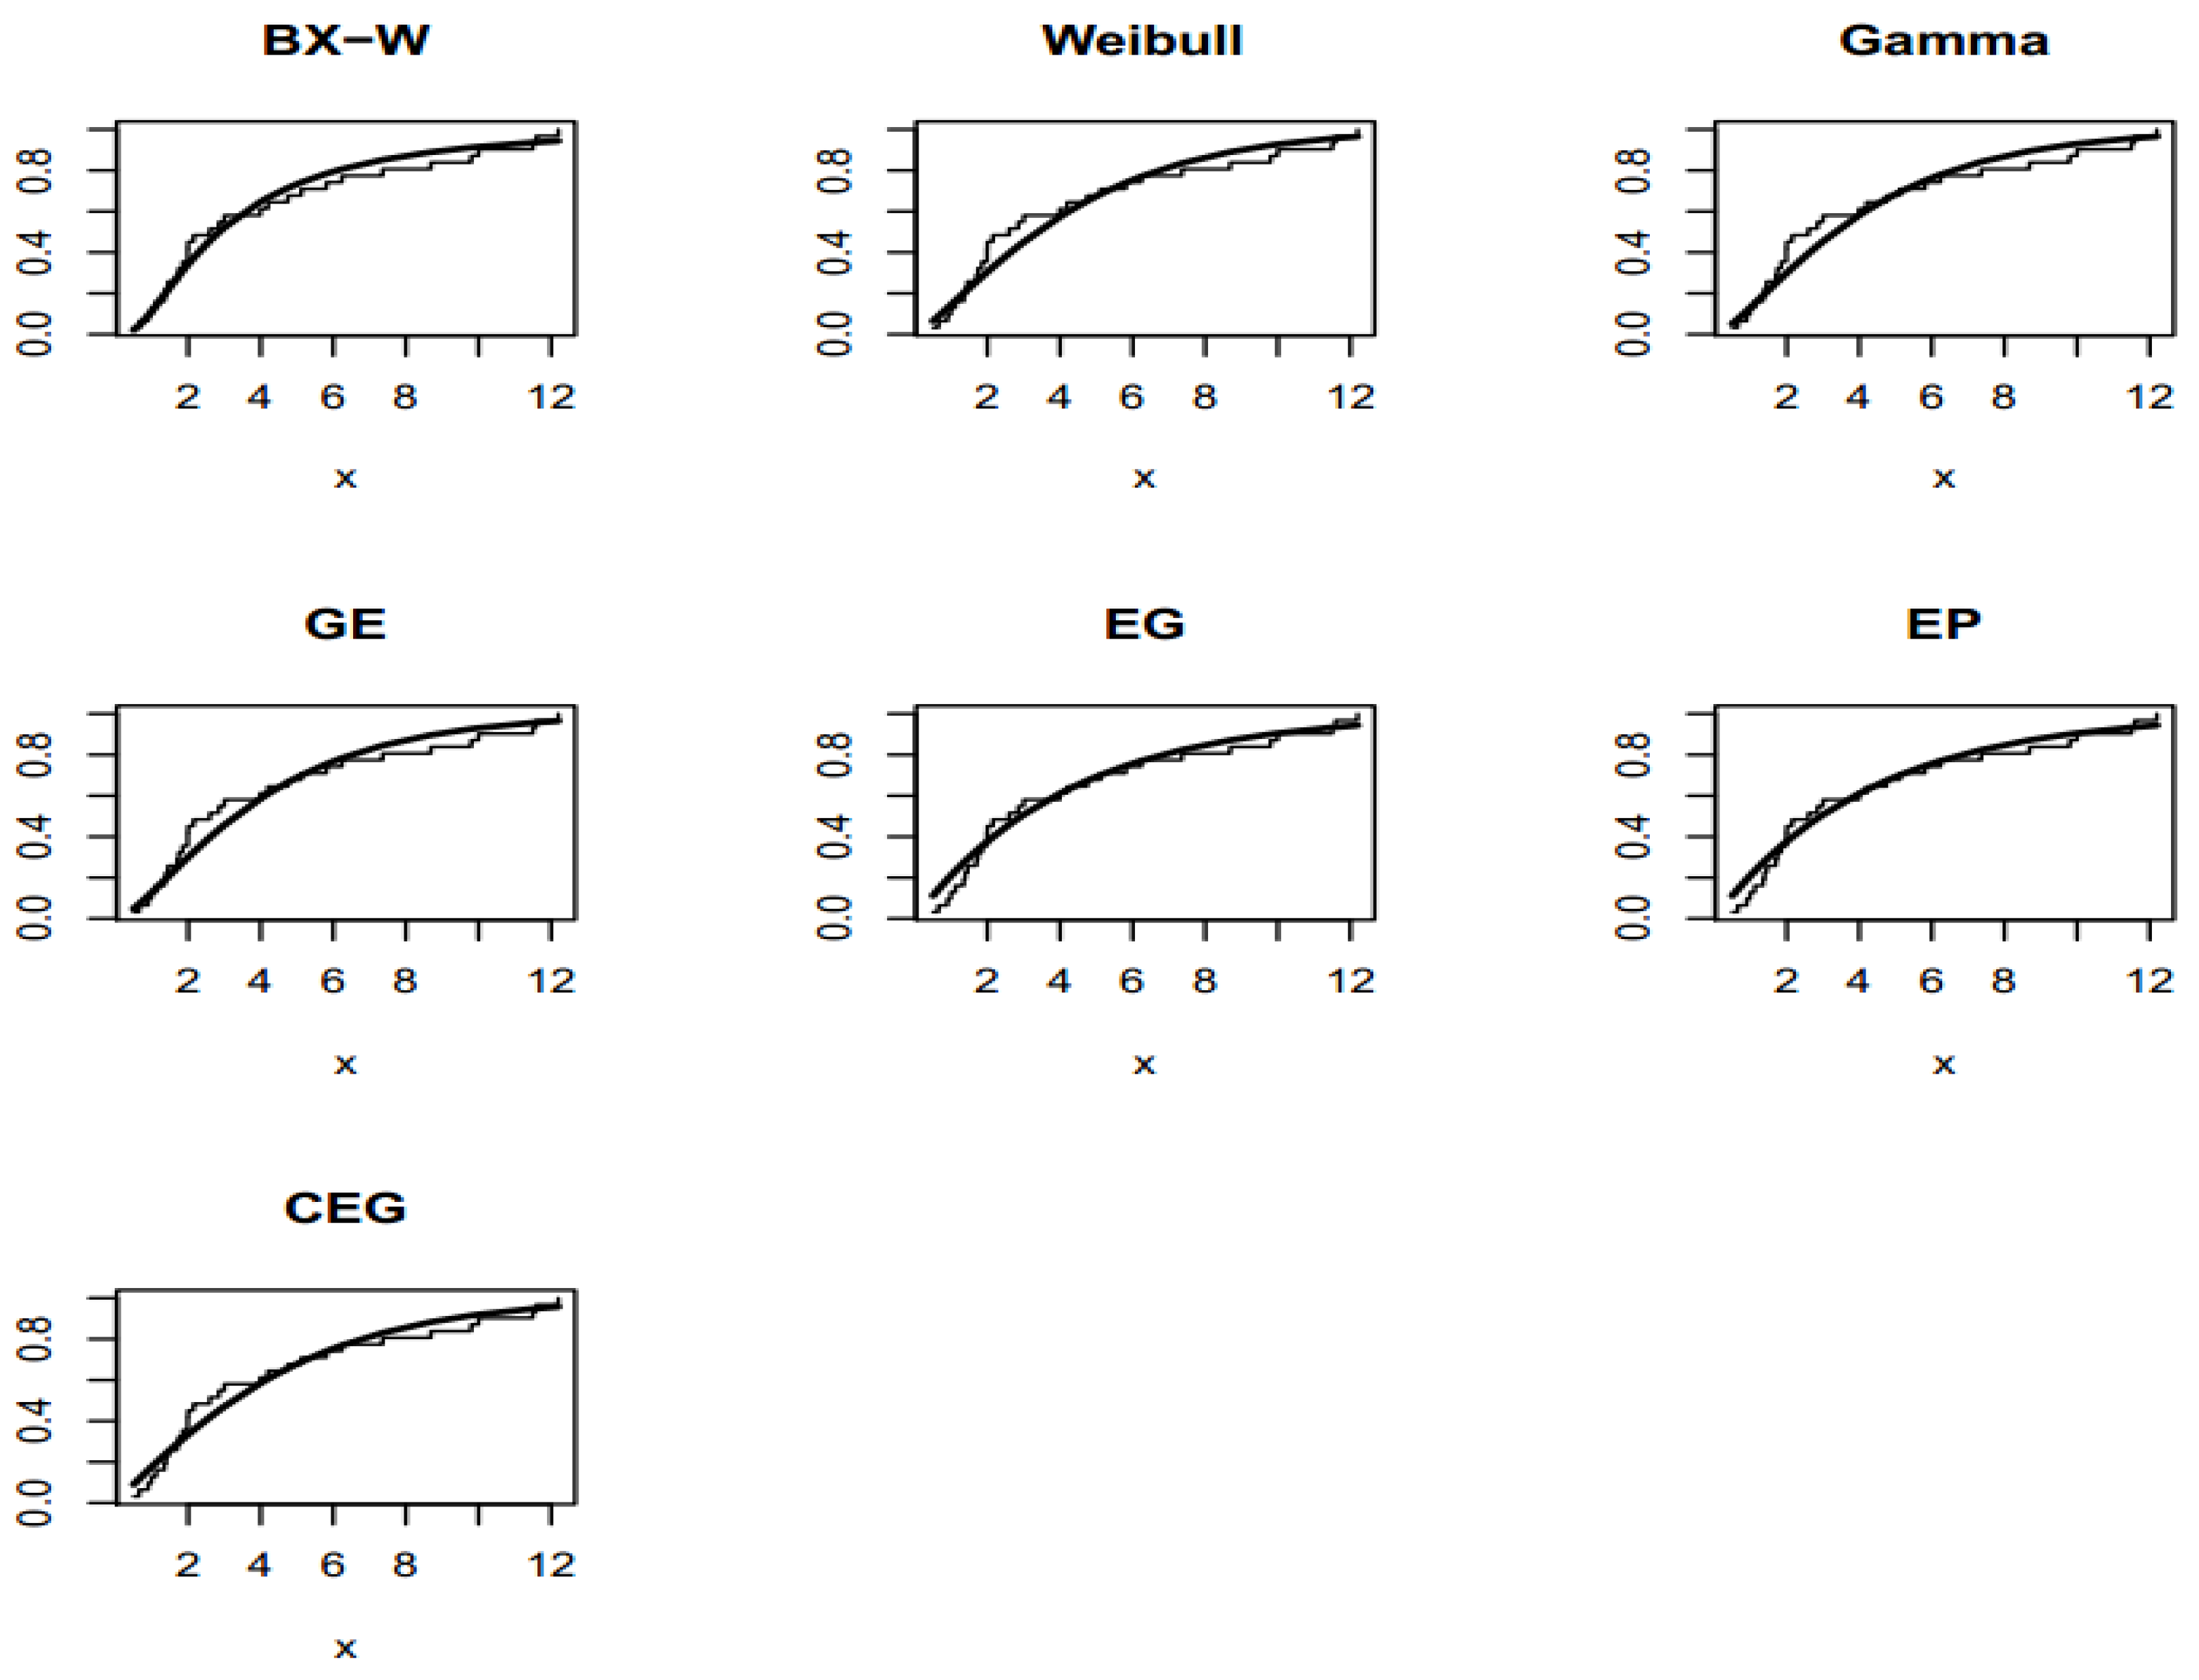
6.1. Non-Bayesian Uncensored Applications for Comparing Models
6.2. Uncensored Applications for Comparing the Non-Bayesian Methods
7. Censored Maximum Likelihood Estimation
8. Modified Chi-Squared Type Test for Right Censored Data
8.1. Choice of Random Grouping Intervals
8.2. Quadratic Form
8.3. Estimated Information Matrix
9. Simulations
9.1. Censored Maximum Likelihood Estimation for BXW
9.2. Test Statistic
10. Data Analysis
11. Conclusions
Author Contributions
Funding
Acknowledgments
Conflicts of Interest
References
- Lai, C.D.; Xie, M.; Murthy, D.N.P. A modified Weibull distribution. IEEE Trans. Reliab. 2003, 52, 33–37. [Google Scholar] [CrossRef]
- Mudholkar, G.S.; Srivastava, D.K.; Freimer, M. The expnentiated Weibull family: A reanalysis of the bus-motor-failure data. Technometrics 1995, 37, 436–445. [Google Scholar] [CrossRef]
- Mudholkar, G.S.; Srivastava, D.K.; Kollia, G.D. A generalization of the Weibull distribution with application to the analysis of survival data. J. Am. Stat. Assoc. 1996, 91, 1575–1583. [Google Scholar] [CrossRef]
- Xie, M.; Lai, C.D. Reliability analysis using an additive Weibull model with bathtub-shaped failure rate function. Reliab. Eng. Syst. Saf. 1995, 52, 87–93. [Google Scholar] [CrossRef]
- Ghitany, M.E.; Al-Hussaini, E.K.; Al-Jarallah, R.A. MarshallOlkin extended Weibull distribution and its application to censored data. J. Appl. Stat. 2005, 32, 1025–1034. [Google Scholar] [CrossRef]
- Hanook, S.; Shahbaz, M.Q.; Mohsin, M.; Kibria, G. A Note on Beta Inverse Weibull Distribution. Commun. Stat. Theory Methods 2013, 42, 320–335. [Google Scholar] [CrossRef]
- Yousof, H.M.; Afify, A.Z.; Alizadeh, M.; Butt, N.S.; Hamedani, G.G.; Ali, M.M. The transmuted exponentiated generalized-G family of distributions. Pak. J. Stat. Oper. Res. 2015, 11, 441–464. [Google Scholar] [CrossRef]
- Afify, A.Z.; Cordeiro, G.M.; Yousof, H.M.; Saboor, A.; Ortega, E.M.M. The Marshall-Olkin additive Weibull distribution with variable shapes for the hazard rate. Hacet. J. Math. Stat. 2016, 47, 365–381. [Google Scholar] [CrossRef]
- Aryal, G.R.; Ortega, E.M.; Hamedani, G.G.; Yousof, H.M. The Topp Leone generated Weibull distribution: Regression model, characterizations and applications. Int. J. Stat. Probab. 2017, 6, 126–141. [Google Scholar] [CrossRef]
- Aryal, G.R.; Yousof, H.M. The exponentiated generalized-G Poisson family of distributions. Econ. Qual. Control 2017, 32, 1–17. [Google Scholar] [CrossRef]
- Hamedani, G.G.; Yousof, H.M.; Rasekhi, M.; Alizadeh, M.; Najibi, S.M. Type I general exponential class of distributions. Pak. J. Stat. Oper. Res. 2017, XIV, 39–55. [Google Scholar] [CrossRef][Green Version]
- Yousof, H.M.; Afify, A.Z.; Cordeiro, G.M.; Alzaatreh, A.; Ahsanullah, M. A new four-parameter Weibull model for lifetime data. J. Stat. Theory Appl. 2017, 16, 448–466. [Google Scholar]
- Cordeiro, G.M.; Yousof, H.M.; Ramires, T.G.; Ortega, E.M.M. The Burr XII system of densities: Properties, regression model and applications. J. Stat. Comput. Simul. 2018, 88, 432–456. [Google Scholar] [CrossRef]
- Korkmaz, M.C.; Yousof, H.M.; Hamedani, G.G.; Ali, M.M. The Marshall–Olkin generalized G Poisson family of distributions. Pak. J. Stat. 2018, 34, 251–267. [Google Scholar]
- Almamy, J.A.; Ibrahim, M.; Eliwa, M.S.; Al-mualim, S.; Yousof, H.M. The two-parameter odd Lindley Weibull lifetime model with properties and applications. Int. J. Stat. Probab. 2018, 7, 1927–7040. [Google Scholar] [CrossRef]
- Cordeiro, G.M.; Afify, A.Z.; Yousof, H.M.; Cakmakyapan, S.; Ozel, G. The Lindley Weibull distribution: Properties and applications. An. da Acad. Bras. de Ciências 2018, 90, 1–20. [Google Scholar] [CrossRef] [PubMed]
- Yousof, H.M.; Majumder, M.; Jahanshahi, S.M.A.; Ali, M.M.; Hamedani, G.G. A new Weibull class of distributions: Theory, characterizations and applications. J. Stat. Res. Iran 2018, 15, 45–83. [Google Scholar] [CrossRef]
- Hamedani, G.G.; Altun, E.; Korkmaz, M.C.; Yousof, H.M.; Butt, N.S. A new extended G family of continuous distributions with mathematical properties, characterizations and regression modeling. Pak. J. Stat. Oper. Res. 2018, 14, 737–758. [Google Scholar] [CrossRef]
- Hamedani, G.G.; Rasekhi, M.; Najibi, S.M.; Yousof, H.M.; Alizadeh, M. Type II general exponential class of distributions. Pak. J. Stat. Oper. Res. 2019, XV, 503–523. [Google Scholar] [CrossRef]
- Khalil, M.G.; Hamedani, G.G.; Yousof, H.M. The Burr X exponentiated Weibull model: Characterizations, mathematical properties and applications to failure and survival times data. Pak. J. Stat. Oper. Res. 2019, XV, 141–160. [Google Scholar] [CrossRef]
- Korkmaz, M.C.; Altun, E.; Yousof, H.M.; Hamedani, G.G. The odd power Lindley generator of probability distributions: Properties, characterizations and regression modeling. Int. J. Stat. Probab. 2019, 8, 70–89. [Google Scholar] [CrossRef]
- Nascimento, A.D.C.; Silva, K.F.; Cordeiro, G.M.; Alizadeh, M.; Yousof, H.M. The odd Nadarajah-Haghighi family of distributions: Properties and applications. Stud. Sci. Math. Hung. 2019, 56, 1–26. [Google Scholar] [CrossRef]
- Yousof, H.M.; Mansoor, M.; Alizadeh, M.; Afify, A.Z.; Ghosh, I.; Afify, A.Z. The Weibull-G Poisson family for analyzing lifetime data. Pak. J. Stat. Oper. Res. 2020, 16, 131–148. [Google Scholar] [CrossRef]
- Yousof, H.M.; Afify, A.Z.; Hamedani, G.G.; Aryal, G. The Burr X generator of distributions for lifetime data. J. Stat. Theory Appl. 2016, 16, 288–305. [Google Scholar] [CrossRef]
- Lando, T.; Bertoli-Barsotti, L. Second-order stochastic dominance for decomposable multiparametric families with applications to order statistics. Stat. Probab. Lett. 2020, 159, 108691. [Google Scholar] [CrossRef]
- MacDonald, P.D.M. Comment on an estimation procedure for mixtures of distributions by Choi and Bulgren. J. R. Stat. Soc. Ser. B 1971, 33, 326–329. [Google Scholar]
- Gupta, R.D.; Kundu, D. Exponentiated exponential family; an alternative to gamma and Weibull. Biom. J. 2001, 43, 117–130. [Google Scholar] [CrossRef]
- Adamidis, K.; Loukas, S. A lifetime distribution with decreasing failure rate. Stat. Probab. Lett. 1998, 39, 35–42. [Google Scholar] [CrossRef]
- Kus, C. A new lifetime distribution. Comput. Stat. Data Anal. 2007, 51, 4497–4509. [Google Scholar] [CrossRef]
- Burnham, K.P.; Anderson, D.R. Model Selection and Multimodel Inference: A Practical Information-Theoretic Approach, 2nd ed.; Springer: Berlin/Heidelberg, Germany, 2002. [Google Scholar]
- Yusuf, A.; Mikail, B.B.; Aliyu, A.L.; Sulaiman, A.L. The inverse Burr negative binomial distribution with application to real data. J. Stat. Appl. Probab. 2016, 5, 53–65. [Google Scholar] [CrossRef]
- Bhaumik, D.K.; Kapur, K.; Gibbons, R.D. Testing Parameters of a Gamma Distribution for Small Samples. Technometrics 2009, 51, 326–334. [Google Scholar] [CrossRef]
- Barreto-Souza, W.; Cribari-Neto, F. A Generalization of the Exponential-Poisson Distribution. Stat. Probab. Lett. 2009, 79, 2493–2500. Available online: https://arxiv.org/P.D.F/0809.1894 (accessed on 23 May 2020). [CrossRef]
- Evans, D.L.; Drew, J.H.; Leemis, L.M. The Distribution of the Kolmogorov-Smirnov, Cramer-von Mises, and Anderson Darling Test Statistics for Exponential Populations with Estimated Parameters. Commun. Stat. Simul. Comput. 2008, 37, 1396–1421. [Google Scholar] [CrossRef]
- Aarset, A.S. How to identify a bathtub hazard rate. IEEE Trans. Reliab. 1987, 36, 106–108. [Google Scholar] [CrossRef]
- Habib, M.G.; Thomas, D.R. Chi-squared Goodness-of-Fit Tests for Randomly Censored Data. Ann. Stat. 1986, 14, 759–765. [Google Scholar] [CrossRef]
- Hollander, M.; Pena, E. Chi-square goodness-of-fit test for ran-domly censored data. JASA 1992, 87, 458–463. [Google Scholar] [CrossRef]
- Galanova, N.; Lemeshko, B.Y.; Chimitova, E.V. Using Nonparametric Goodness-of-Fit Tests to Validate Accelerated Failure Time Models. Optoelectron. Instrum. Data Process. 2012, 48, 580–592. [Google Scholar] [CrossRef]
- Bagdonavičius, V.; Nikulin, M. Chi-squared Goodness-of-fit Test for Right Censored Data. Int. J. Appl. Math. Stat. 2011, 24, 30–50. [Google Scholar]
- Bagdonavičius, V.; Nikulin, M. Chi-squared tests for general composite hypotheses from censored samples Comptes Rendus de lácadémie des Sciences de Paris. Mathématiques 2011, 349, 219–223. [Google Scholar]
- Bagdonavičius, V.; Levuliene, R.J.; Nikulin, M. Chi-squared goodness-of-fit tests for parametric accelerated failure time models. Commun. Stat. Theory Methods 2013, 42, 2768–2785. [Google Scholar] [CrossRef]
- Voinov, V.; Nikulin, M.; Balakrishnan, N. Chi-Squared Goodness of Fit Tests with Applications; Academic Press, Elsevier: Amsterdam, The Netherlands, 2013. [Google Scholar]
- Ravi, V.; Gilbert, P.D. An R package for solving a large system of nonlinear equations and for optimizing a high-dimensional nonlinear objective function. J. Statist. Softw. 2009, 32, 1–26. [Google Scholar]
- Pike, M.C. A method of analysis of a certain class of experiments in carcinogenesis. Biometrics 1966, 22, 142–161. [Google Scholar] [CrossRef] [PubMed]

| n = 100 | ||
| (0.4,2.5) | 0.018 (0.018) | 0.180 (0.946) |
| (3,0.2) | −0.114 (0.345) | 0.008 (0.001) |
| (0.6,0.6) | 0.002 (0.033) | 0.053 (0.040) |
| (0.19,2.5) | 0.038 (0.009) | −0.257 (0.449) |
| n = 200 | ||
| (0.4,2.5) | −0.004 (0.010) | 0.180 (0.424) |
| (3,0.2) | −0.089 (0.172) | 0.002 (5e−4) |
| (0.6,0.6) | −0.001 (0.019) | 0.031 (0.018) |
| (0.19,2.5) | 0.015 (0.004) | −0.206 (0.248) |
| n = 500 | ||
| (0.4,2.5) | 0.002 (0.003) | 0.036 (0.125) |
| (3,0.2) | −0.026 (0.068) | −0.002 (3e−4) |
| (0.6,0.6) | 0.001 (0.007) | 0.008 (0.005) |
| (0.19,2.5) | 0.006 (0.002) | −0.164 (0.141) |
| Parameters | MLE | CVM | PerEs | L-Moment |
|---|---|---|---|---|
| Θ = 2 | 2.123510 | 2.088200 | 2.043230 | 2.09791 |
| (0.08387) | (0.32986) | (0.27218) | (0.35417) | |
| Β = 0.5 | 0.51657 | 0.51770 | 0.50701 | 0.517620 |
| (0.00877) | (0.06045) | (0.01224) | (0.01580) | |
| Θ = 0.6 | 0.64940 | 0.63391 | 0.66041 | 0.620200 |
| (0.02499) | (0.03179) | (0.05275) | (0.06030) | |
| Β = 0.4 | 0.413460 | 0.41341 | 0.432070 | 0.402780 |
| (0.00592) | (0.00965) | (0.01652) | (0.01904) | |
| Θ = 6 | 6.55660 | 6.251720 | 6.284390 | 6.695530 |
| (5.97827) | (2.75560) | (7.71943) | (23.64994) | |
| Β = 0.1 | 0.103750 | 0.108850 | 0.095230 | 0.122000 |
| Parameters | MLE | CVM | PerEs | L-Moment |
|---|---|---|---|---|
| Θ = 2 | 2.04042 | 2.020530 | 1.9875600 | 2.028160 |
| (0.11254) | (0.11274) | (0.09788) | (0.13328) | |
| Β = 0.5 | 0.50549 | 0.50440 | 0.49716 | 0.50573 |
| (0.00276) | (0.00471) | (0.00384) | (0.00685) | |
| Θ = 0.6 | 0.61713 | 0.61232 | 0.62687 | 0.609540 |
| (0.00771) | (0.01104) | (0.01714) | (0.02187) | |
| Β = 0.4 | 0.40422 | 0.40531 | 0.41483 | 0.40260 |
| (0.00216) | (0.00299) | (0.00533) | (0.00790) | |
| Θ = 6 | 6.22870 | 6.14691 | 5.96776 | 6.212280 |
| (1.82638) | (1.04639) | (4.01295) | (8.14331) | |
| Β = 0.1 | 0.10169 | 0.10262 | 0.09246 | 0.11227 |
| Parameters | MLE | CVM | PerEs | L-Moment |
|---|---|---|---|---|
| Θ = 2 | 2.00870 | 2.01118 | 1.99028 | 2.01254 |
| (0.03709) | (0.03613) | (0.03488) | (0.03911) | |
| Β = 0.5 | 0.50107 | 0.50228 | 0.49783 | 0.50274 |
| (0.00095) | (0.00149) | (0.00124) | (0.00198) | |
| Θ = 0.6 | 0.60668 | 0.60501 | 0.60609 | 0.60683 |
| (0.00262) | (0.00312) | (0.00607) | (0.00641) | |
| Β = 0.4 | 0.40272 | 0.40228 | 0.40332 | 0.40313 |
| (0.00072) | (0.00086) | (0.00179) | (0.00236) | |
| Θ = 6 | 6.08709 | 6.00740 | 5.75105 | 6.08802 |
| (0.49247) | (0.28755) | (2.26499) | (2.31531) | |
| Β = 0.1 | 0.10068 | 0.10020 | 0.09448 | 0.10431 |
| Parameters | MLE | CVM | PerEs | L-Moment |
|---|---|---|---|---|
| Θ = 2 | 2.01328 | 2.01143 | 1.99373 | 2.00475 |
| (0.01739) | (0.01740) | (0.01622) | (0.01930) | |
| Β = 0.5 | 0.50197 | 0.50233 | 0.49867 | 0.50085 |
| (0.00045) | (0.00071) | (0.00056) | (0.00101) | |
| Θ = 0.6 | 0.60395 | 0.60365 | 0.60186 | 0.60209 |
| (0.00134) | (0.00164) | (0.00271) | (0.00311) | |
| Β = 0.4 | 0.40181 | 0.40173 | 0.40109 | 0.40074 |
| (0.00036) | (0.00046) | (0.00077) | (0.00115) | |
| θ = 6 | 6.02037 | 6.02330 | 5.56693 | 6.05655 |
| (0.25345) | (0.15614) | (1.65906) | (0.94734) | |
| β = 0.1 | 0.10015 | 0.10042 | 0.09423 | 0.101650 |
| Model | Estimates | Log-Likelihood |
|---|---|---|
| BXW (θ, β) | 40.768 (7.32) 0.095 (10 × e−3) | 73.565 |
| Weibull (α, β) | 1.227 (0.160) 4.557 (0.666) | 74.788 |
| Gamma (α, λ) | 1.487 (0.184) 0.350 (0.051) | 74.459 |
| GE (α, λ) | 1.560 (0.280) 0.309 (0.045) | 74.396 |
| EG (λ, p) | 0.234 (0.042) 0.010 (0.280) | 75.802 |
| EP (λ, β) | 0.011 (0.622) 0.235 (0.042) | 75.795 |
| CEG (λ, θ) | 0.297 (0.047) 0.618 (0.190) | 75.454 |
| Model | Estimates | Log-Likelihood |
|---|---|---|
| BXW (θ, β) | 14.347 (2.46) 0.104 (90.01) | 55.049 |
| Weibull (α, β) | 1.010 (0.125) 1.887 (0.320) | 55.449 |
| Gamma (α, λ) | 1.062 (0.139) 0.565 (0.094) | 55.413 |
| GE (α, λ) | 1.076 (0.184) 0.558 (0.092) | 55.401 |
| EG (λ, p) | 0.481 (0.086) 0.177 (0.242) | 55.395 |
| EP (λ, β) | 0.427 (0.596) 0.476 (0.085) | 55.392 |
| CEG (λ, θ) | 0.532 (0.091) 0.999 (0.289) | 55.453 |
| Model | Goodness of Fit Criteria | |||||
|---|---|---|---|---|---|---|
| AIC | BIC | HQIC | CAIC | |||
| BXW | 151.131 | 153.999 | 152.066 | 151.559 | 0.061 | 0.395 |
| Weibull | 153.577 | 156.445 | 154.512 | 154.006 | 0.118 | 0.713 |
| Gamma | 152.918 | 155.786 | 153.853 | 153.347 | 0.122 | 0.713 |
| GE | 152.793 | 155.661 | 153.728 | 153.222 | 0.120 | 0.705 |
| EG | 155.604 | 158.472 | 156.539 | 156.032 | 0.095 | 0.751 |
| EP | 155.590 | 158.458 | 156.525 | 156.019 | 0.095 | 0.749 |
| Model | Goodness of Fit Criteria | |||||
|---|---|---|---|---|---|---|
| AIC | BIC | HQIC | CAIC | |||
| BXW | 114.098 | 117.151 | 115.139 | 114.485 | 0.032 | 0.227 |
| Weibull | 114.899 | 117.952 | 115.940 | 115.286 | 0.043 | 0.282 |
| Gamma | 114.826 | 117.879 | 115.867 | 115.213 | 0.050 | 0.312 |
| GE | 114.803 | 117.856 | 115.844 | 115.190 | 0.052 | 0.317 |
| EG | 114.791 | 117.844 | 115.832 | 115.178 | 0.032 | 0.240 |
| EP | 114.785 | 117.837 | 115.826 | 115.172 | 0.032 | 0.239 |
| Method | θ | β | ||
|---|---|---|---|---|
| ML | 40.768 | 0.095 | 0.05782 | 0.37572 |
| CVM | 35.997 | 0.087 | 0.05909 | 0.38163 |
| PerEs | 55.730 | 0.101 | 0.05551 | 0.36612 |
| L-moment | 42.097 | 0.098 | 0.05747 | 0.37407 |
| Method | θ | β | ||
|---|---|---|---|---|
| ML | 14.347 | 0.105 | 0.02847 | 0.20972 |
| CVM | 17.784 | 0.097 | 0.02876 | 0.21271 |
| PerEs | 16.690 | 0.106 | 0.02910 | 0.21539 |
| L-moment | 14.672 | 0.109 | 0.02846 | 0.20934 |
| N = 10,000 | n₁ = 20 | n₂ = 50 | n₃ = 150 | n₄ = 300 |
|---|---|---|---|---|
| θ = 1.5 | 1.4838 (0.0076) | 1.4884 (0.0062) | 1.4922 (0.0045) | 1.4983 (0.0023) |
| β = 0.7 | 0.7192 (0.0089) | 0.7137 (0.0077) | 0.7096 (0.0057) | 0.7043 (0.0034) |
| θ = 0.8 | 0.8213 (0.0082) | 0.8126 (0.0058) | 0.8084 (0.0032) | 0.8012 (0.0016) |
| β = 0.5 | 0.4828 (0.0076) | 0.4877 (0.0052) | 0.4912 (0.0037) | 0.4996 (0.0018) |
| θ = 3 | 2.9696 (0.0094) | 2.9776 (0.0066) | 2.9894 (0.0042) | 2.9982 (0.0027) |
| β = 0.4 | 0.4331 (0.0068) | 0.4284 (0.0044) | 0.4167 (0.0029) | 0.4024 (0.0013) |
| N = 10,000 | n = 20 | n = 50 | n = 150 | n = 300 |
|---|---|---|---|---|
| ε = 1% | 0.0055 | 0.0064 | 0.0085 | 0.0094 |
| ε = 5% | 0.0443 | 0.0452 | 0.0468 | 0.0486 |
| ε = 10% | 0.0931 | 0.0943 | 0.0959 | 0.0974 |
| 189.6 | 214.9 | 237.7 | 304 | |
| 4 | 5 | 6 | 4 | |
| 0.9463 | 1.2416 | 0.8863 | 0.7648 | |
| 1.1346 | 0.9946 | 1.2476 | 0.9263 | |
| 0.4859 | 0.4859 | 0.4859 | 0.4859 |
© 2020 by the authors. Licensee MDPI, Basel, Switzerland. This article is an open access article distributed under the terms and conditions of the Creative Commons Attribution (CC BY) license (http://creativecommons.org/licenses/by/4.0/).
Share and Cite
Mansour, M.; Rasekhi, M.; Ibrahim, M.; Aidi, K.; Yousof, H.M.; Abd Elrazik, E. A New Parametric Life Distribution with Modified Bagdonavičius–Nikulin Goodness-of-Fit Test for Censored Validation, Properties, Applications, and Different Estimation Methods. Entropy 2020, 22, 592. https://doi.org/10.3390/e22050592
Mansour M, Rasekhi M, Ibrahim M, Aidi K, Yousof HM, Abd Elrazik E. A New Parametric Life Distribution with Modified Bagdonavičius–Nikulin Goodness-of-Fit Test for Censored Validation, Properties, Applications, and Different Estimation Methods. Entropy. 2020; 22(5):592. https://doi.org/10.3390/e22050592
Chicago/Turabian StyleMansour, Mahmoud, Mahdi Rasekhi, Mohamed Ibrahim, Khaoula Aidi, Haitham M. Yousof, and Enayat Abd Elrazik. 2020. "A New Parametric Life Distribution with Modified Bagdonavičius–Nikulin Goodness-of-Fit Test for Censored Validation, Properties, Applications, and Different Estimation Methods" Entropy 22, no. 5: 592. https://doi.org/10.3390/e22050592
APA StyleMansour, M., Rasekhi, M., Ibrahim, M., Aidi, K., Yousof, H. M., & Abd Elrazik, E. (2020). A New Parametric Life Distribution with Modified Bagdonavičius–Nikulin Goodness-of-Fit Test for Censored Validation, Properties, Applications, and Different Estimation Methods. Entropy, 22(5), 592. https://doi.org/10.3390/e22050592


