Fifteen Years of Gene Set Analysis for High-Throughput Genomic Data: A Review of Statistical Approaches and Future Challenges


Abstract
1. Background
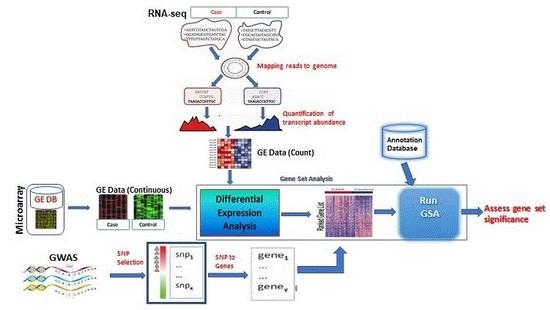
2. Structure of Gene Set Analysis
2.1. Units of Gene Set Analysis
2.2. Hypotheses in Gene Set Analysis
2.3. Sampling Models in Gene Set Analysis
2.3.1. Subject Sampling Model
2.3.2. Gene Sampling Model
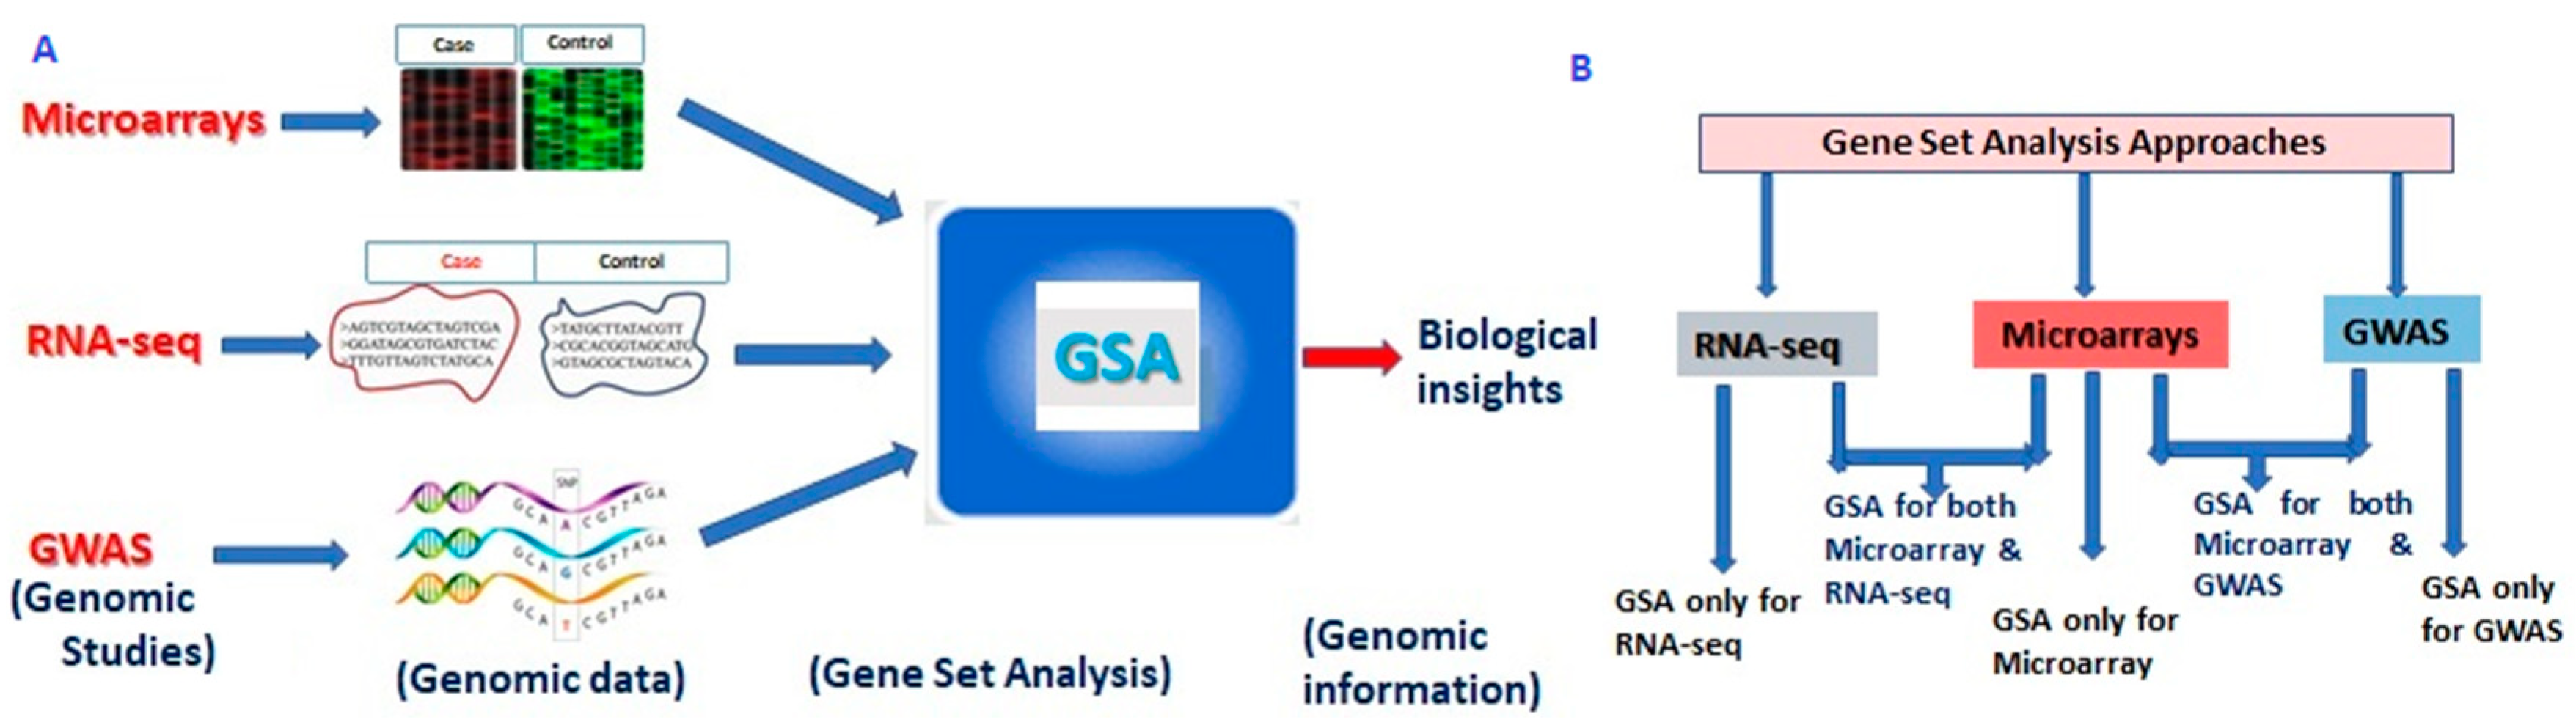
3. GSA Approaches for High-Throughput Genomic Studies
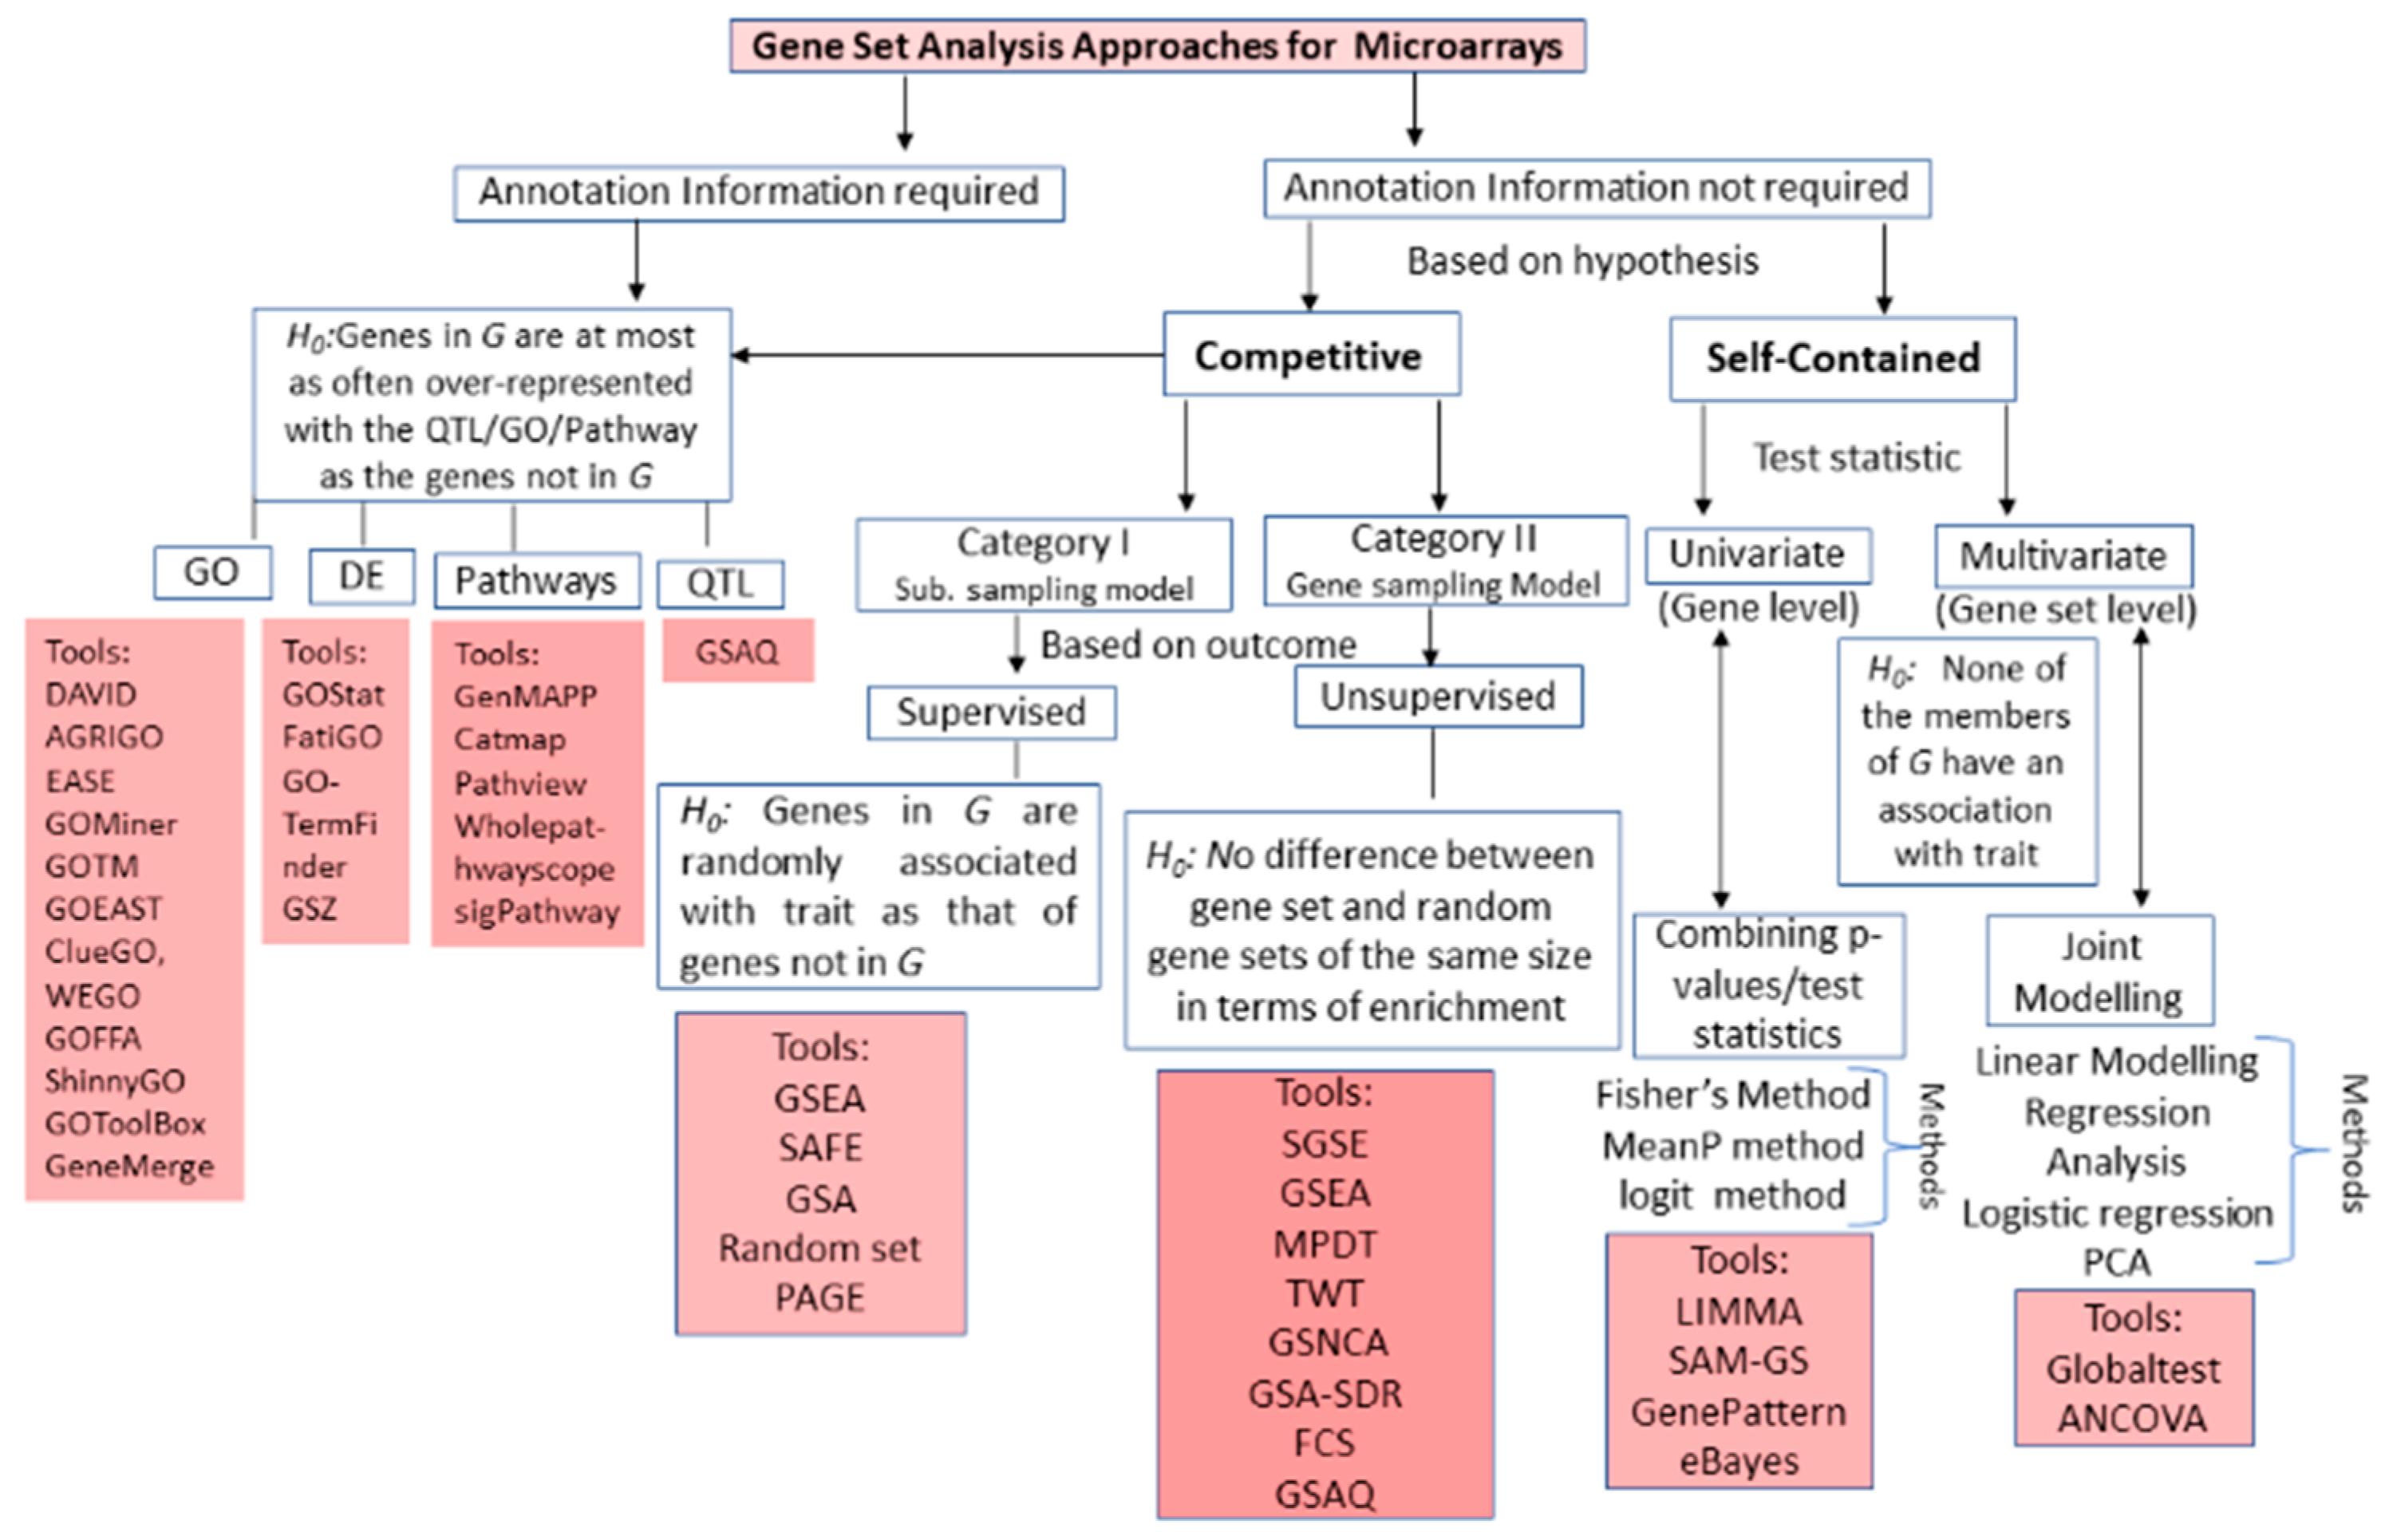
3.1. Microarrays GSA
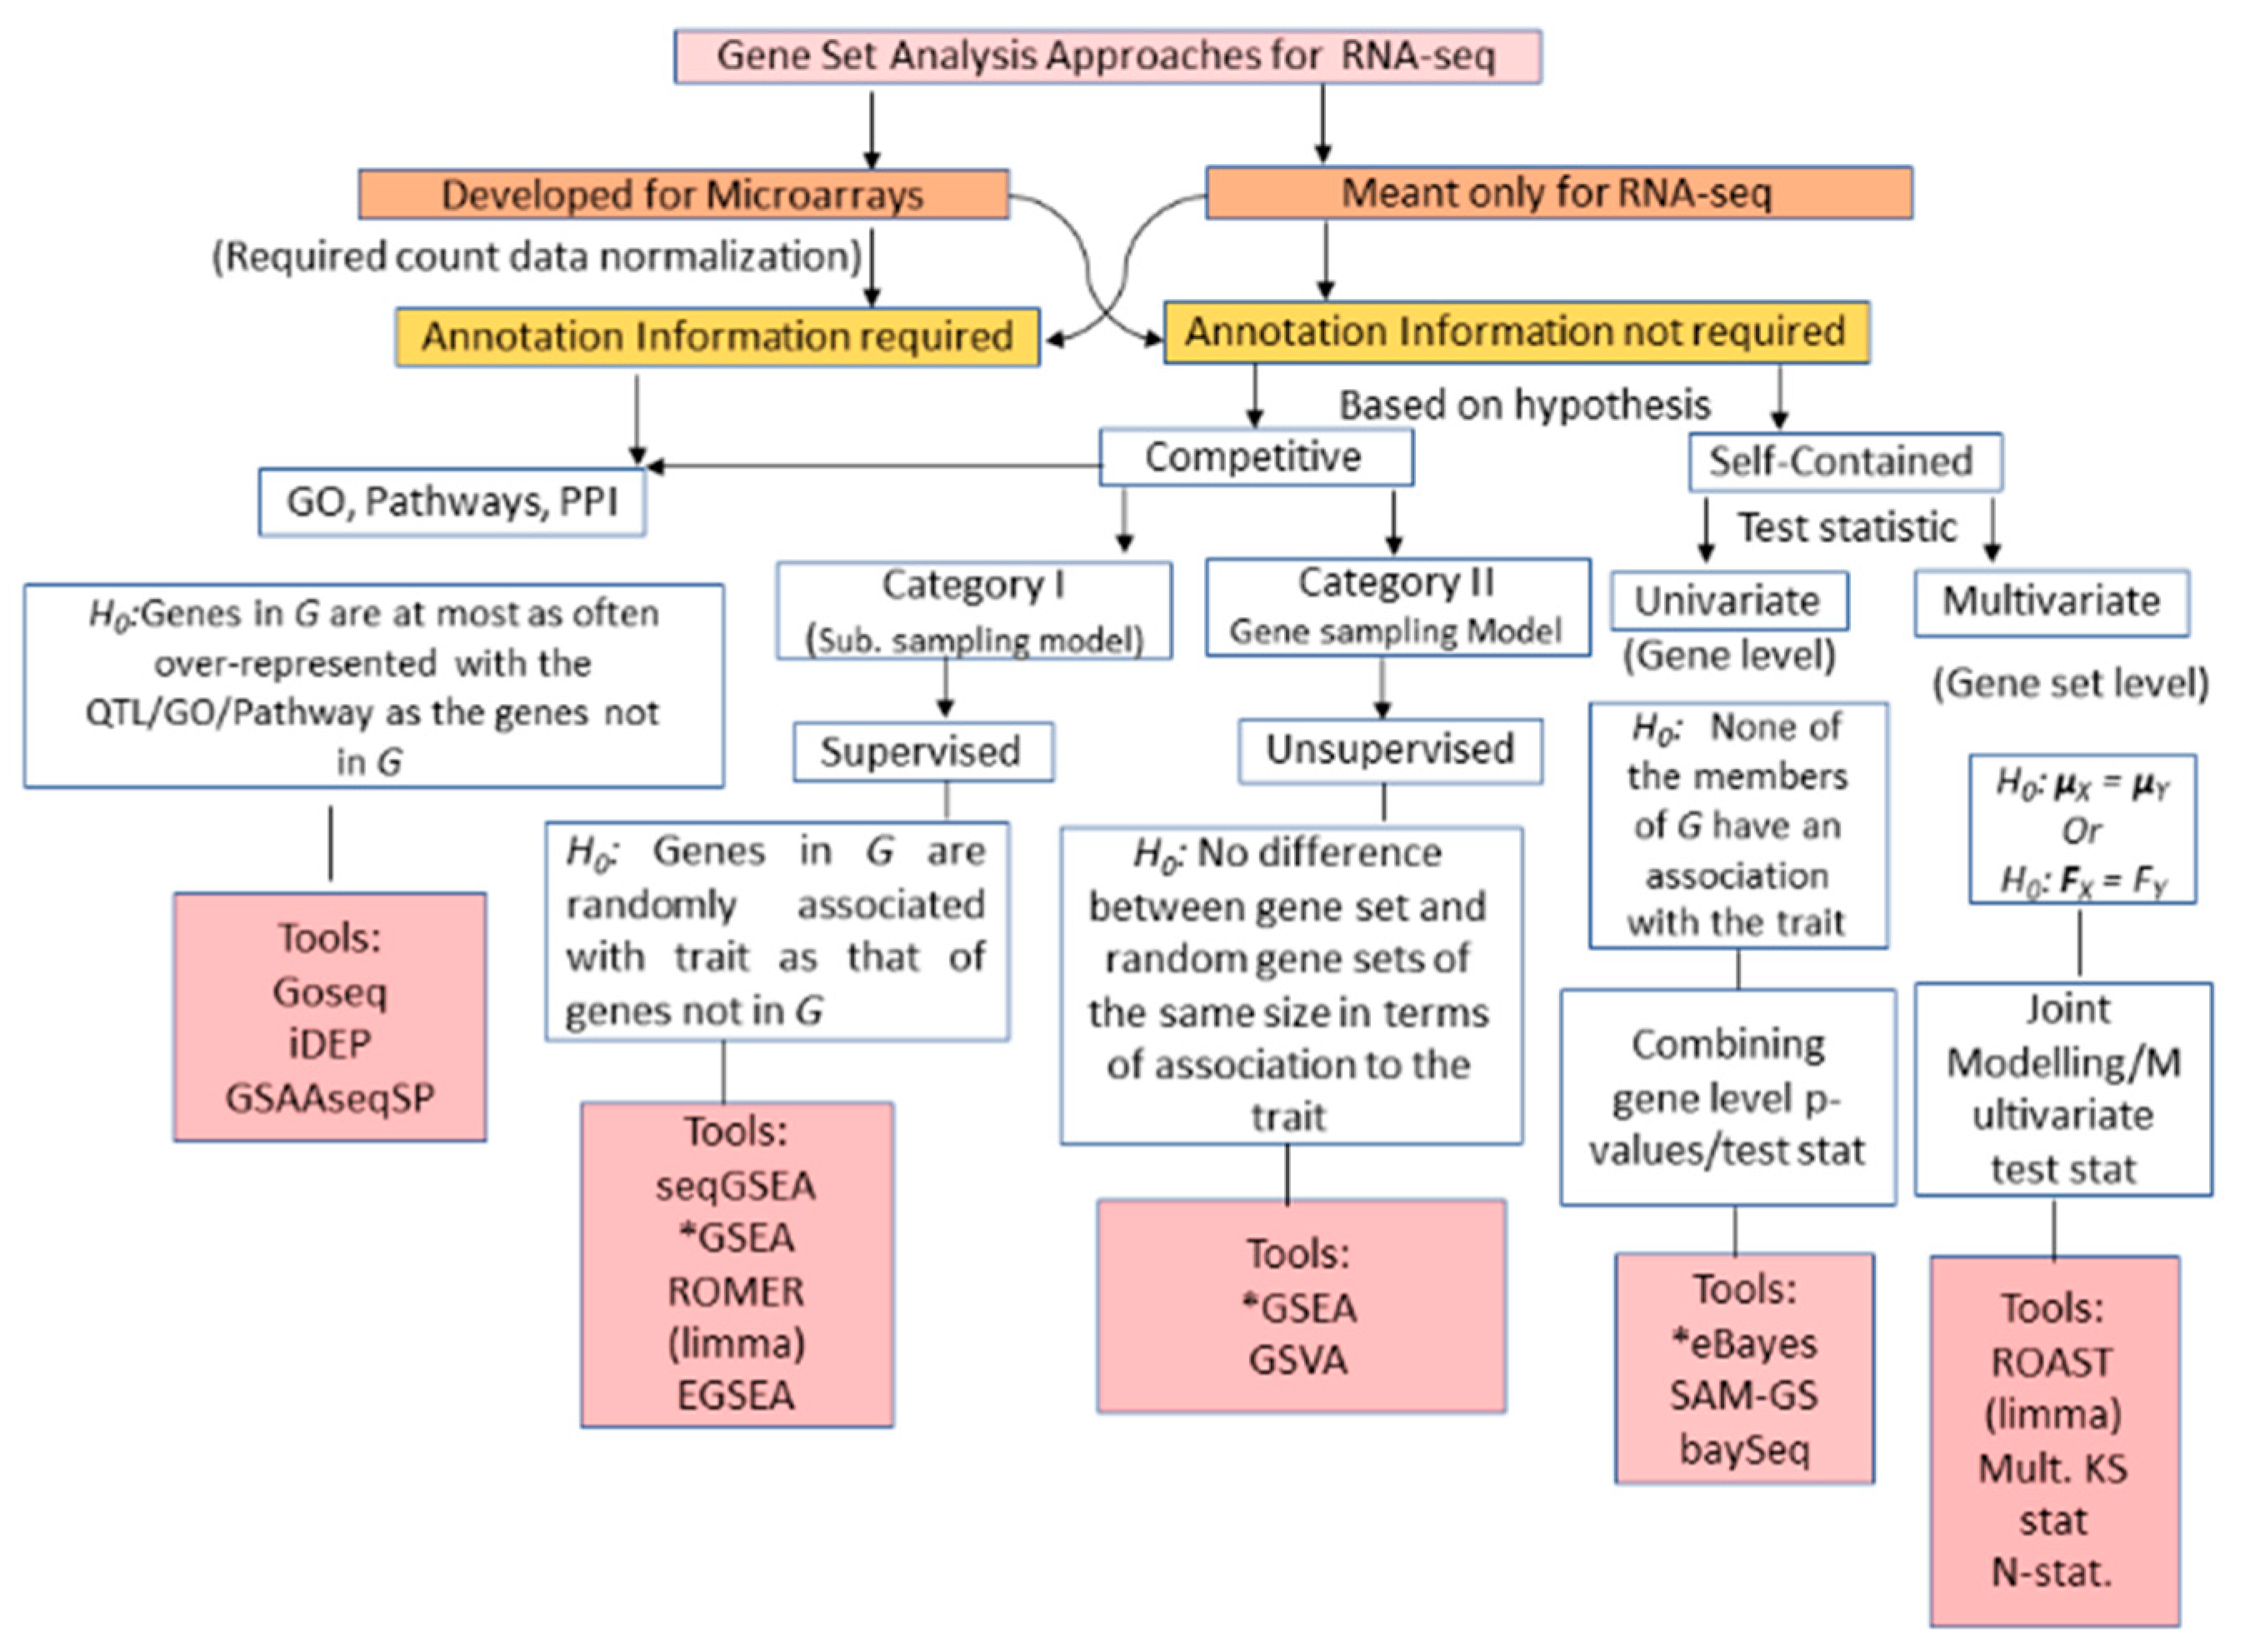
3.2. RNA-seq GSA
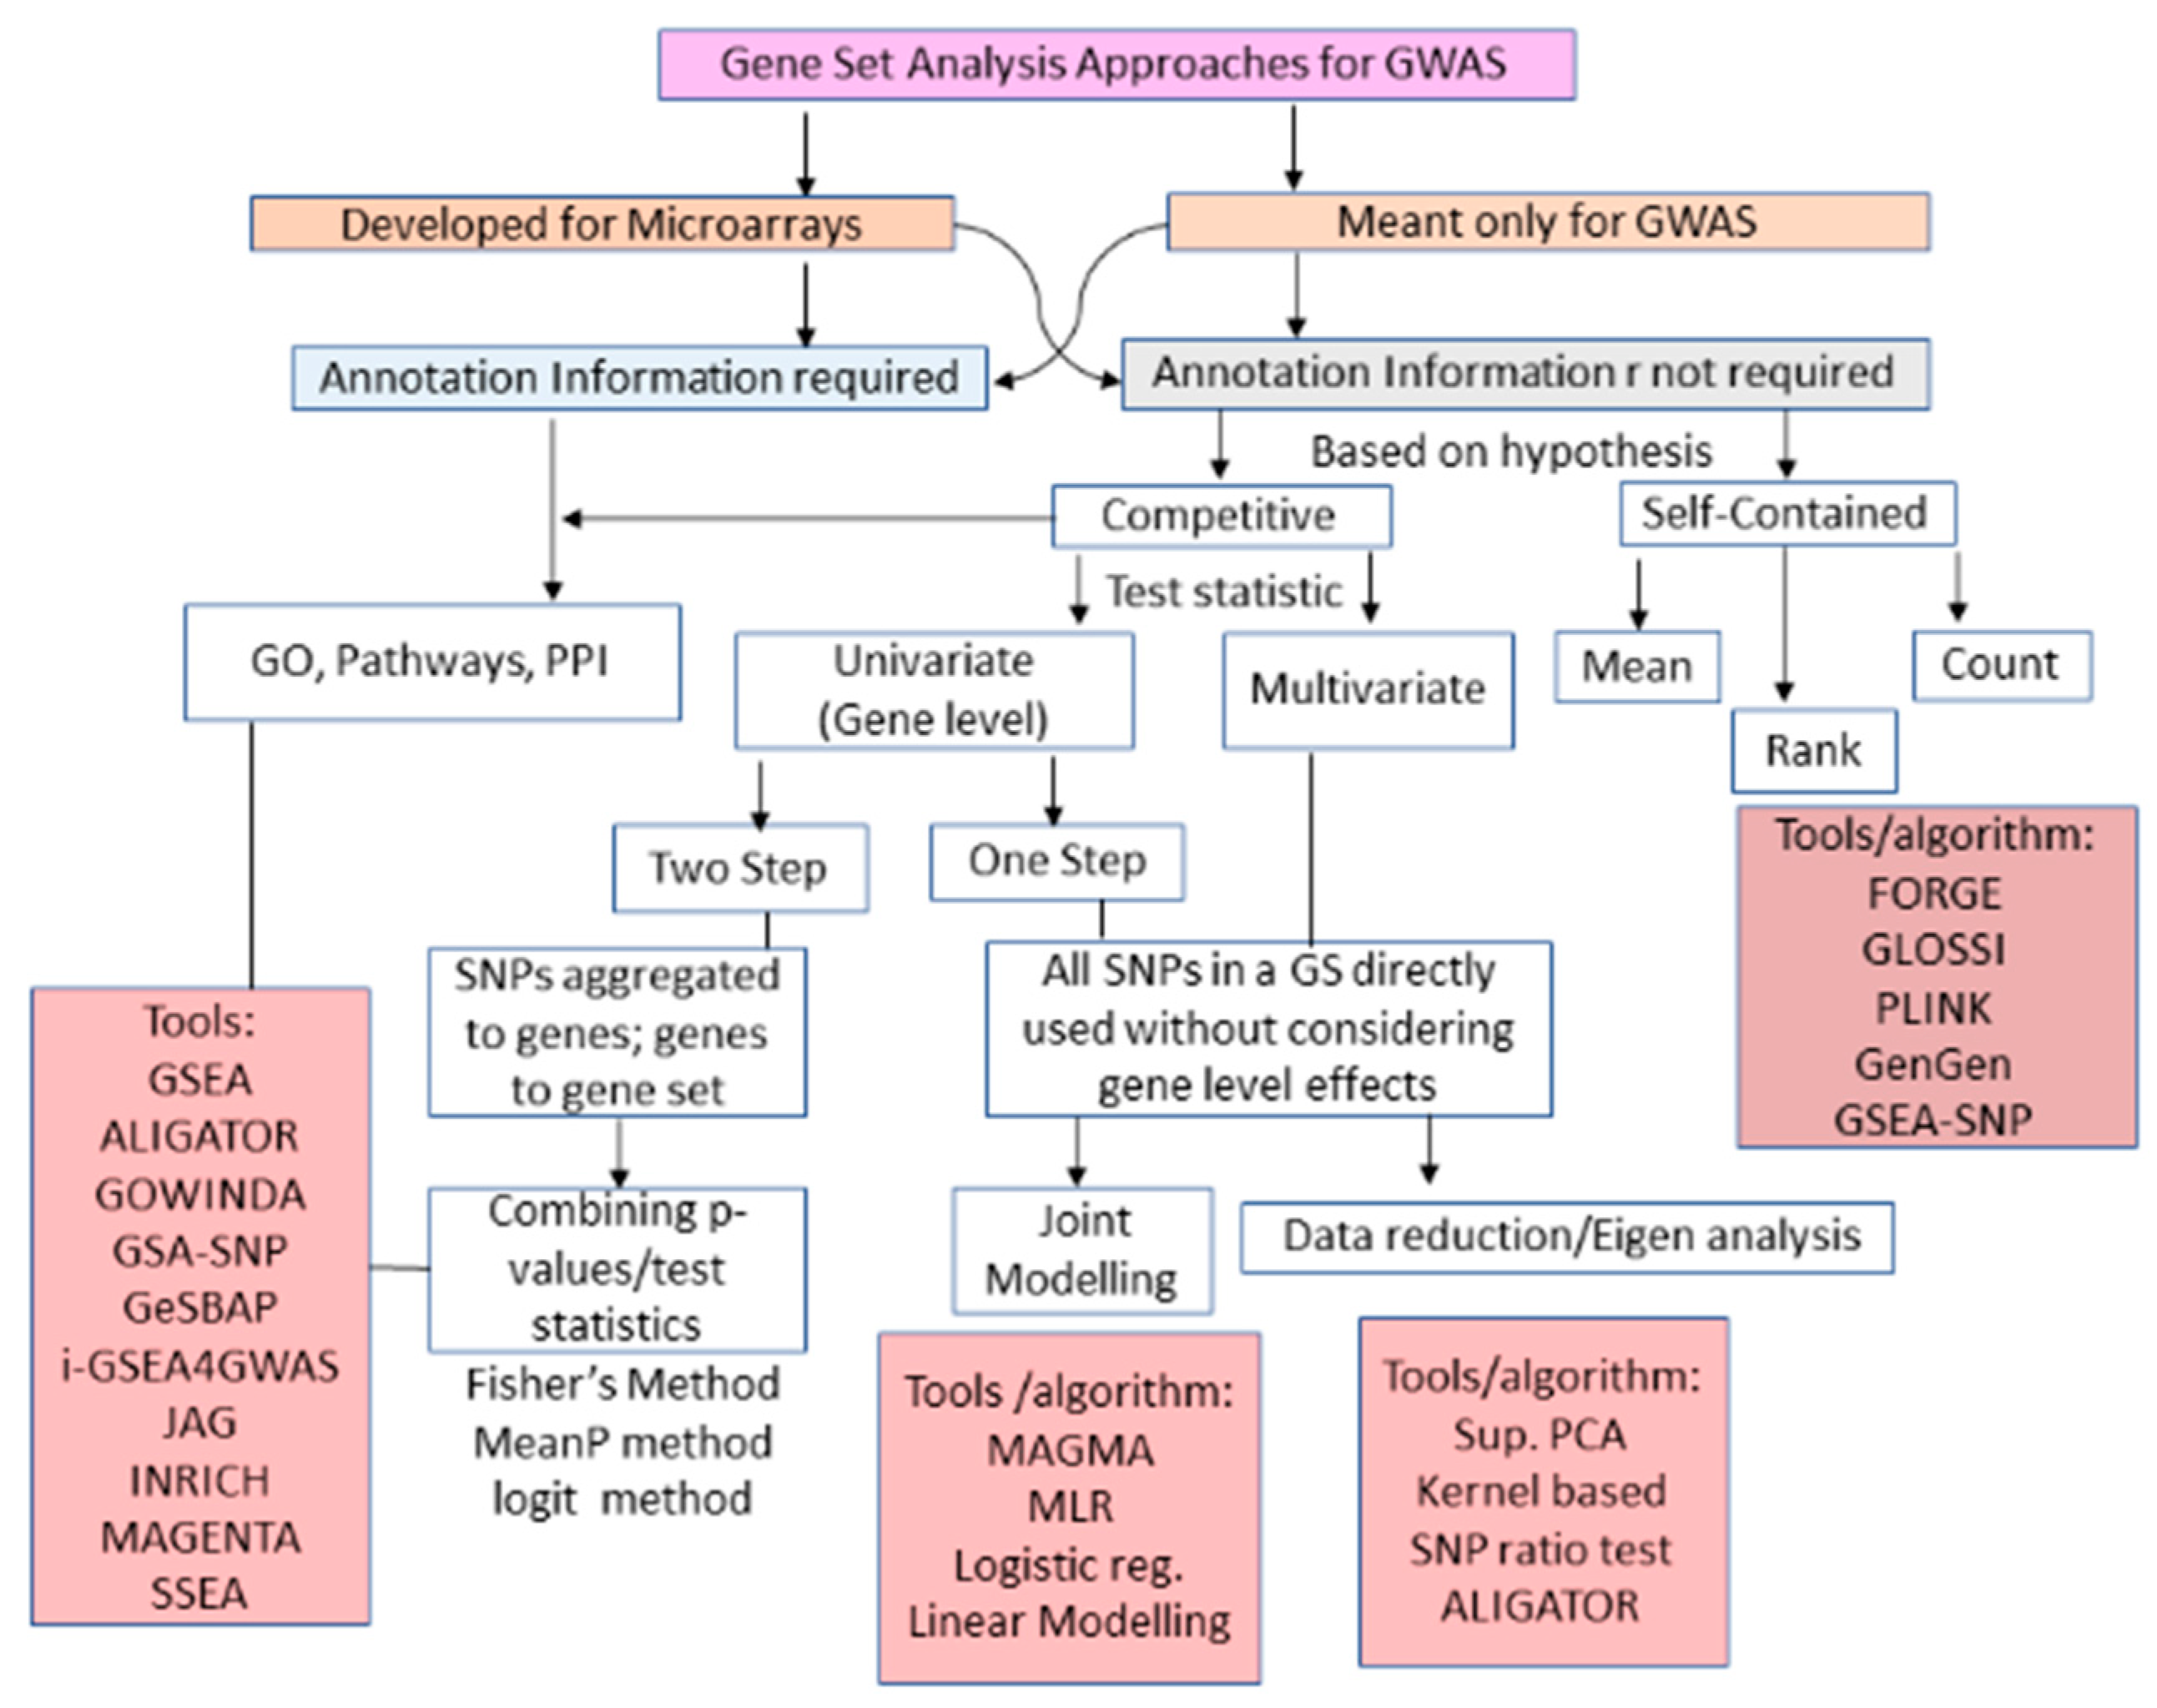
3.3. GWAS GSA
4. Limitations and Future Challenges of GSA
4.1. Biological Annotation Challenges
4.2. Methodological Challenges
5. Discussion
Supplementary Materials
Author Contributions
Funding
Acknowledgments
Conflicts of Interest
References
- Marx, V. The big challenges of big data. Nature 2013, 498, 255–260. [Google Scholar] [CrossRef] [PubMed]
- Wang, J.; Chen, L.; Wang, Y.; Zhang, J.; Liang, Y.; Xu, D. A Computational Systems Biology Study for Understanding Salt Tolerance Mechanism in Rice. PLoS ONE 2013, 8, e64929. [Google Scholar] [CrossRef]
- Cui, X.; Churchill, G.A. Statistical tests for differential expression in cDNA microarray experiments. Genome Biol. 2003. [Google Scholar] [CrossRef] [PubMed]
- Das, S.; Meher, P.K.; Rai, A.; Bhar, L.M.; Mandal, B.N. Statistical Approaches for Gene Selection, Hub Gene Identification and Module Interaction in Gene Co-Expression Network Analysis: An Application to Aluminum Stress in Soybean (Glycine max L.). PLoS ONE 2017, 12, e0169605. [Google Scholar] [CrossRef] [PubMed]
- Liang, Y.; Zhang, F.; Wang, J.; Joshi, T.; Wang, Y.; Xu, D. Prediction of Drought-Resistant Genes in Arabidopsis thaliana Using SVM-RFE. PLoS ONE 2011, 6, e21750. [Google Scholar] [CrossRef] [PubMed]
- Goeman, J.J.; Buhlmann, P. Analyzing gene expression data in terms of gene sets: Methodological issues. Bioinformatics 2007, 23, 980–987. [Google Scholar] [CrossRef] [PubMed]
- de Leeuw, C.A.; Neale, B.M.; Heskes, T.; Posthuma, D. The statistical properties of gene-set analysis. Nat. Rev. Genet. 2016, 17, 353–364. [Google Scholar] [CrossRef]
- Efron, B.; Tibshirani, R. On testing the significance of sets of genes. Ann. Appl. Stat. 2007, 1, 107–129. [Google Scholar] [CrossRef]
- Yi, X.; Du, Z.; Su, Z. PlantGSEA: A gene set enrichment analysis toolkit for plant community. Nucleic Acids Res. 2013. [Google Scholar] [CrossRef]
- Das, S.; Rai, A.; Mishra, D.C.; Rai, S.N. Statistical Approach for Gene Set Analysis with Trait Specific Quantitative Trait Loci. Sci. Rep. 2018, 8, 2391. [Google Scholar] [CrossRef]
- Rahmatallah, Y.; Emmert-Streib, F.; Glazko, G. Gene set analysis approaches for RNA-seq data: Performance evaluation and application guideline. Brief Bioinform. 2016, 17, 393–407. [Google Scholar] [CrossRef] [PubMed]
- Mooney, M.A.; Wilmot, B. Gene set analysis: A step-by-step guide. Am. J. Med. Genet. Part B Neuropsychiatr. Genet. 2015. [Google Scholar] [CrossRef] [PubMed]
- Sullivan, P.F.; Posthuma, D. Biological pathways and networks implicated in psychiatric disorders. Curr. Opin. Behav. Sci. 2015, 2, 58–68. [Google Scholar] [CrossRef]
- Nurnberger, J.I.; Koller, D.L.; Jung, J.; Edenberg, H.J.; Foroud, T.; Guella, I.; Vawter, M.P.; Kelsoe, J.R. Identification of Pathways for Bipolar Disorder. JAMA Psychiatry 2014, 71, 657. [Google Scholar] [CrossRef] [PubMed]
- Wang, K.; Zhang, H.; Kugathasan, S.; Annese, V.; Bradfield, J.P.; Russell, R.K.; Sleiman, P.M.; Imielinski, M.; Glessner, J.; Hou, C.; et al. Diverse Genome-wide Association Studies Associate the IL12/IL23 Pathway with Crohn Disease. Am. J. Hum. Genet. 2009. [Google Scholar] [CrossRef]
- Eleftherohorinou, H.; Hoggart, C.J.; Wright, V.J.; Levin, M.; Coin, L.J.M. Pathway-driven gene stability selection of two rheumatoid arthritis GWAS identifies and validates new susceptibility genes in receptor mediated signalling pathways. Hum. Mol. Genet. 2011. [Google Scholar] [CrossRef]
- Menashe, I.; Maeder, D.; Garcia-Closas, M.; Figueroa, J.D.; Bhattacharjee, S.; Rotunno, M.; Kraft, P.; Hunter, D.J.; Chanock, S.J.; Rosenberg, P.S.; et al. Pathway analysis of breast cancer genome-wide association study highlights three pathways and one canonical signaling cascade. Cancer Res. 2010. [Google Scholar] [CrossRef]
- Locke, A.E.; Kahali, B.; Berndt, S.I.; Justice, A.E.; Pers, T.H.; Day, F.R.; Powell, C.; Vedantam, S.; Buchkovich, M.L.; Yang, J.; et al. Genetic studies of body mass index yield new insights for obesity biology. Nature 2015, 518, 197–206. [Google Scholar] [CrossRef]
- Berriz, G.F.; King, O.D.; Bryant, B.; Sander, C.; Roth, F.P. Characterizing gene sets with FuncAssociate. Bioinformatics 2003. [Google Scholar] [CrossRef]
- Beißbarth, T.; Speed, T.P. GOstat: Find statistically overrepresented Gene Ontologies with a group of genes. Bioinformatics 2004. [Google Scholar] [CrossRef]
- Khatri, P.; Draghici, S.; Ostermeier, G.C.; Krawetz, S.A. Profiling Gene Expression Using Onto-Express. Genomics 2002, 79, 266–270. [Google Scholar] [CrossRef] [PubMed]
- Boyle, E.I.; Weng, S.; Gollub, J.; Jin, H.; Botstein, D.; Cherry, J.M.; Sherlock, G. GO::TermFinder--open source software for accessing Gene Ontology information and finding significantly enriched Gene Ontology terms associated with a list of genes. Bioinformatics 2004, 20, 3710–3715. [Google Scholar] [CrossRef] [PubMed]
- Fridley, B.L.; Patch, C. Gene set analysis of SNP data: Benefits, challenges, and future directions. Eur. J. Hum. Genet. 2011, 19, 837–843. [Google Scholar] [CrossRef] [PubMed]
- Subramanian, A.; Tamayo, P.; Mootha, V.K.; Mukherjee, S.; Ebert, B.L.; Gillette, M.A.; Paulovich, A.; Pomeroy, S.L.; Golub, T.R.; Lander, E.S.; et al. Gene set enrichment analysis: A knowledge-based approach for interpreting genome-wide expression profiles. Proc. Natl. Acad. Sci. USA 2005, 102, 15545–15550. [Google Scholar] [CrossRef] [PubMed]
- Wang, L.; Jia, P.; Wolfinger, R.D.; Chen, X.; Zhao, Z. Gene set analysis of genome-wide association studies: Methodological issues and perspectives. Genomics 2011, 98, 1–8. [Google Scholar] [CrossRef]
- Goeman, J.J.; Van de Geer, S.; De Kort, F.; van Houwellingen, H.C. A global test for groups fo genes: Testing association with a clinical outcome. Bioinformatics 2004. [Google Scholar] [CrossRef]
- Das, S.; Rai, A.; Mishra, D.C.; Rai, S.N. Statistical approach for selection of biologically informative genes. Gene 2018, 655. [Google Scholar] [CrossRef]
- Wang, X.; Cairns, M.J. Gene set enrichment analysis of RNA-Seq data: Integrating differential expression and splicing. BMC Bioinform. 2013, 14, S16. [Google Scholar] [CrossRef]
- Rahmatallah, Y.; Zybailov, B.; Emmert-Streib, F.; Glazko, G. GSAR: Bioconductor package for Gene Set analysis in R. BMC Bioinform. 2017. [Google Scholar] [CrossRef]
- Khatri, P.; Sirota, M.; Butte, A.J. Ten Years of Pathway Analysis: Current Approaches and Outstanding Challenges. PLoS Comput. Biol. 2012, 8, e1002375. [Google Scholar] [CrossRef]
- Dennis, G.; Sherman, B.T.; Hosack, D.A.; Yang, J.; Gao, W.; Lane, H.C.; Lempicki, R.A. DAVID: Database for Annotation, Visualization, and Integrated Discovery. Genome Biol. 2003, 4, R60. [Google Scholar] [CrossRef]
- Tian, T.; Liu, Y.; Yan, H.; You, Q.; Yi, X.; Du, Z.; Xu, W.; Su, Z. AgriGO v2.0: A GO analysis toolkit for the agricultural community, 2017 update. Nucleic Acids Res. 2017. [Google Scholar] [CrossRef] [PubMed]
- Mootha, V.K.; Lindgren, C.M.; Eriksson, K.-F.; Subramanian, A.; Sihag, S.; Lehar, J.; Puigserver, P.; Carlsson, E.; Ridderstråle, M.; Laurila, E.; et al. PGC-1α-responsive genes involved in oxidative phosphorylation are coordinately downregulated in human diabetes. Nat. Genet. 2003, 34, 267–273. [Google Scholar] [CrossRef] [PubMed]
- Pavlidis, P.; Qin, J.; Arango, V.; Mann, J.J.; Sibille, E. Using the Gene Ontology for Microarray Data Mining: A Comparison of Methods and Application to Age Effects in Human Prefrontal Cortex. Neurochem. Res. 2004, 29, 1213–1222. [Google Scholar] [CrossRef]
- Al-Shahrour, F.; Diaz-Uriarte, R.; Dopazo, J. Discovering molecular functions significantly related to phenotypes by combining gene expression data and biological information. Bioinformatics 2005, 21, 2988–2993. [Google Scholar] [CrossRef] [PubMed]
- Tian, L.; Greenberg, S.A.; Kong, S.W.; Altschuler, J.; Kohane, I.S.; Park, P.J. Discovering statistically significant pathways in expression profiling studies. Proc. Natl. Acad. Sci. USA 2005, 102, 13544–13549. [Google Scholar] [CrossRef]
- Kim, S.Y.; Volsky, D.J. PAGE: Parametric analysis of gene set enrichment. BMC Bioinform. 2005. [Google Scholar] [CrossRef]
- Jiang, Z.; Gentleman, R. Extensions to gene set enrichment. Bioinformatics 2007. [Google Scholar] [CrossRef]
- Barry, W.T.; Nobel, A.B.; Wright, F.A. Significance analysis of functional categories in gene expression studies: A structured permutation approach. Bioinformatics 2005. [Google Scholar] [CrossRef]
- Glazko, G.V.; Emmert-Streib, F. Unite and conquer: Univariate and multivariate approaches for finding differentially expressed gene sets. Bioinformatics 2009. [Google Scholar] [CrossRef]
- Huang, D.W.; Sherman, B.T.; Tan, Q.; Kir, J.; Liu, D.; Bryant, D.; Guo, Y.; Stephens, R.; Baseler, M.W.; Lane, H.C.; et al. DAVID Bioinformatics Resources: Expanded annotation database and novel algorithms to better extract biology from large gene lists. Nucleic Acids Res. 2007, 35, W169–W175. [Google Scholar] [CrossRef] [PubMed]
- Dahlquist, K.D.; Salomonis, N.; Vranizan, K.; Lawlor, S.C.; Conklin, B.R. GenMAPP, a new tool for viewing and analyzing microarray data on biological pathways. Nat Genet. 2002, 31, 19–20. [Google Scholar] [CrossRef] [PubMed]
- Zeeberg, B.R.; Feng, W.; Wang, G.; Wang, M.D.; Fojo, A.T.; Sunshine, M.; Narasimhan, S.; Kane, D.W.; Reinhold, W.C.; Lababidi, S.; et al. GoMiner: A resource for biological interpretation of genomic and proteomic data. Genome Biol. 2003, 4, R28. [Google Scholar] [CrossRef] [PubMed]
- Al-Shahrour, F.; Díaz-Uriarte, R.; Dopazo, J. FatiGO: A web tool for finding significant associations of Gene Ontology terms with groups of genes. Bioinformatics 2004. [Google Scholar] [CrossRef] [PubMed]
- Martin, D.; Brun, C.; Remy, E.; Mouren, P.; Thieffry, D.; Jacq, B. GOToolBox: Functional analysis of gene datasets based on Gene Ontology. Genome Biol. 2004. [Google Scholar] [CrossRef]
- Castillo-Davis, C.I.; Hartl, D.L. GeneMerge-Post-genomic analysis, data mining, and hypothesis testing. Bioinformatics 2003. [Google Scholar] [CrossRef]
- Zheng, Q.; Wang, X.J. GOEAST: A web-based software toolkit for Gene Ontology enrichment analysis. Nucleic Acids Res. 2008. [Google Scholar] [CrossRef]
- Bindea, G.; Mlecnik, B.; Hackl, H.; Charoentong, P.; Tosolini, M.; Kirilovsky, A.; Fridman, W.-H.; Pagès, F.; Trajanoski, Z.; Galon, J. ClueGO: A Cytoscape plug-in to decipher functionally grouped gene ontology and pathway annotation networks. Bioinformatics 2009. [Google Scholar] [CrossRef]
- Robinson, M.D.; Grigull, J.; Mohammad, N.; Hughes, T.R. FunSpec: A web-based cluster interpreter for yeast. BMC Bioinform. 2002. [Google Scholar] [CrossRef]
- Martínez-Cruz, L.A.; Rubio, A.; Martínez-Chantar, M.L.; Labarga, A.; Barrio, I.; Podhorski, A.; Segura, V.; Campo, J.L.S.; Avila, M.A.; Mato, J.M. GARBAN: Genomic analysis and rapid biological annotation of cDNA microarray and proteomic data. Bioinformatics 2003. [Google Scholar] [CrossRef]
- Wang, J.; Duncan, D.; Shi, Z.; Zhang, B. WEB-based GEne SeT AnaLysis Toolkit (WebGestalt): Update 2013. Nucleic Acids Res. 2013. [Google Scholar] [CrossRef] [PubMed]
- Sun, H.; Fang, H.; Chen, T.; Perkins, R.; Tong, W. GOFFA: Gene Ontology for Functional Analysis—A FDA Gene Ontology tool for analysis of genomic and proteomic data. BMC Bioinform. 2006. [Google Scholar] [CrossRef] [PubMed]
- Ye, J.; Fang, L.; Zheng, H.; Zhang, Y.; Chen, J.; Zhang, Z.; Wang, J.; Li, S.; Li, R.; Bolund, L.; et al. WEGO: A web tool for plotting GO annotations. Nucleic Acids Res. 2006, 34, W293–W297. [Google Scholar] [CrossRef] [PubMed]
- Zhang, B.; Schmoyer, D.; Kirov, S.; Snoddy, J. GOTree Machine (GOTM): A web-based platform for interpreting sets of interesting genes using Gene Ontology hierarchies. BMC Bioinform. 2004. [Google Scholar] [CrossRef]
- Luo, W.; Brouwer, C. Pathview: An R/Bioconductor package for pathway-based data integration and visualization. Bioinformatics 2013. [Google Scholar] [CrossRef]
- Yi, M.; Horton, J.D.; Cohen, J.C.; Hobbs, H.H.; Stephens, R.M. WholePathwayScope: A comprehensive pathway-based analysis tool for high-throughput data. BMC Bioinform. 2006. [Google Scholar] [CrossRef]
- Newton, M.A.; Quintana, F.A.; den Boon, J.A.; Sengupta, S.; Ahlquist, P. Random-set methods identify distinct aspects of the enrichment signal in gene-set analysis. Ann. Appl. Stat. 2007. [Google Scholar] [CrossRef]
- Cao, W.; Li, Y.; Liu, D.; Chen, C.; Xu, Y. Statistical and Biological Evaluation of Different Gene Set Analysis Methods. Procedia Environ. Sci. 2011, 8, 693–699. [Google Scholar] [CrossRef][Green Version]
- Dinu, I.; Potter, J.D.; Mueller, T.; Liu, Q.; Adewale, A.J.; Jhangri, G.S.; Einecke, G.; Famulski, K.S.; Halloran, P.; Yasui, Y. Improving gene set analysis of microarray data by SAM-GS. BMC Bioinform. 2007. [Google Scholar] [CrossRef]
- Smyth, G.K.; Ritchie, M.; Thorne, N.; Wettenhall, J. limma: Linear Models for Microarray Data. Bioinformatics and Computational Biology Solutions Using R and Bioconductor. Stat. Biol. Health 2005. [Google Scholar] [CrossRef]
- Breslin, T.; Edén, P.; Krogh, M. Comparing functional annotation analyses with Catmap. BMC Bioinform. 2004. [Google Scholar] [CrossRef] [PubMed]
- Boorsma, A.; Foat, B.C.; Vis, D.; Klis, F.; Bussemaker, H.J. T-profiler: Scoring the activity of predefined groups of genes using gene expression data. Nucleic Acids Res. 2005. [Google Scholar] [CrossRef] [PubMed]
- Henegar, C.; Cancello, R.; Rome, S.; Vidal, H.; Clément, K.; Zucker, J.-D. Clustering biological annotations and gene expression data to identify putatively co-regulated biological processes. J. Bioinform. Comput. Biol. 2006, 4, 833–852. [Google Scholar] [CrossRef] [PubMed]
- Backes, C.; Keller, A.; Kuentzer, J.; Kneissl, B.; Comtesse, N.; Elnakady, Y.A.; Müller, R.; Meese, E.; Lenhof, H.-P. GeneTrail-advanced gene set enrichment analysis. Nucleic Acids Res. 2007. [Google Scholar] [CrossRef]
- Kim, S.-B.; Yang, S.; Kim, S.-K.; Kim, S.C.; Woo, H.G.; Volsky, D.J.; Kim, S.Y.; Chu, I.-S. GAzer: Gene set analyzer. Bioinformatics 2007, 23, 1697–1699. [Google Scholar] [CrossRef]
- Wu, D.; Smyth, G.K. Camera: A competitive gene set test accounting for inter-gene correlation. Nucleic Acids Res. 2012. [Google Scholar] [CrossRef]
- Luo, W.; Friedman, M.S.; Shedden, K.; Hankenson, K.D.; Woolf, P.J. GAGE: Generally applicable gene set enrichment for pathway analysis. BMC Bioinform. 2009. [Google Scholar] [CrossRef]
- Frost, H.R.; Li, Z.; Moore, J.H. Spectral gene set enrichment (SGSE). BMC Bioinform. 2015, 16, 70. [Google Scholar] [CrossRef][Green Version]
- Rahmatallah, Y.; Emmert-Streib, F.; Glazko, G. Gene Sets Net Correlations Analysis (GSNCA): A multivariate differential coexpression test for gene sets. Bioinformatics 2014. [Google Scholar] [CrossRef]
- Hsueh, H.M.; Tsai, C.A. Gene set analysis using sufficient dimension reduction. BMC Bioinform. 2016. [Google Scholar] [CrossRef]
- Reich, M.; Liefeld, T.; Gould, J.; Lerner, J.; Tamayo, P.; Mesirov, J.P. Gene Pattern 2.0. Nat Genet. 2006, 38, 500–501. [Google Scholar] [CrossRef] [PubMed]
- Wu, X.; Hasan MAl Chen, J.Y. Pathway and network analysis in proteomics. J. Theor. Biol. 2014. [Google Scholar] [CrossRef] [PubMed]
- Rahnenführer, J.; Domingues, F.S.; Maydt, J.; Lengauer, T. Calculating the Statistical Significance of Changes in Pathway Activity From Gene Expression Data. Stat. Appl. Genet. Mol. Biol. 2005. [Google Scholar] [CrossRef] [PubMed]
- Tarca, A.L.; Draghici, S.; Khatri, P.; Hassan, S.S.; Mittal, P.; Kim, J.S.; Kim, C.J.; Kusanovic, J.P.; Romero, R. A novel signaling pathway impact analysis. Bioinformatics 2009. [Google Scholar] [CrossRef] [PubMed]
- Alexeyenko, A.; Lee, W.; Pernemalm, M.; Guegan, J.; Dessen, P.; Lazar, V.; Lehtiö, J.; Pawitan, Y. Network enrichment analysis: Extension of gene-set enrichment analysis to gene networks. BMC Bioinform. 2012. [Google Scholar] [CrossRef] [PubMed]
- Glaab, E.; Baudot, A.; Krasnogor, N.; Valencia, A. TopoGSA: Network topological gene set analysis. Bioinformatics 2010. [Google Scholar] [CrossRef] [PubMed]
- Martini, P.; Sales, G.; Massa, M.S.; Chiogna, M.; Romualdi, C. Along signal paths: An empirical gene set approach exploiting pathway topology. Nucleic Acids Res. 2013, 41, e19. [Google Scholar] [CrossRef]
- Rahmatallah, Y.; Emmert-Streib, F.; Glazko, G. Comparative evaluation of gene set analysis approaches for RNA-Seq data. BMC Bioinform. 2014, 15, 397. [Google Scholar] [CrossRef]
- Conesa, A.; Madrigal, P.; Tarazona, S.; Gomez-Cabrero, D.; Cervera, A.; McPherson, A.; Szcześniak, M.W.; Gaffney, D.J.; Elo, L.L.; Zhang, X.; et al. A survey of best practices for RNA-seq data analysis. Genome Biol. 2016. [Google Scholar] [CrossRef]
- Young, M.D.; Davidson, N.; Wakefield, M.J.; Smyth, G.K.; Oshlack, A. goseq: Gene Ontology testing for RNA-seq datasets. R Bioconductor 2012, 8, 1–25. [Google Scholar]
- Ge, S.X.; Son, E.W.; Yao, R. iDEP: An integrated web application for differential expression and pathway analysis of RNA-Seq data. BMC Bioinform. 2018. [Google Scholar] [CrossRef] [PubMed]
- Wu, D.; Lim, E.; Vaillant, F.; Asselin-Labat, M.L.; Visvader, J.E.; Smyth, G.K. ROAST: Rotation gene set tests for complex microarray experiments. Bioinformatics 2010. [Google Scholar] [CrossRef] [PubMed]
- Hänzelmann, S.; Castelo, R.; Guinney, J. GSVA: Gene set variation analysis for microarray and RNA-Seq data. BMC Bioinform. 2013. [Google Scholar] [CrossRef] [PubMed]
- Fridley, B.L.; Jenkins, G.D.; Grill, D.E.; Kennedy, R.B.; Poland, G.A.; Oberg, A.L. Soft truncation thresholding for gene set analysis of RNA-seq data: Application to a vaccine study. Sci. Rep. 2013. [Google Scholar] [CrossRef]
- oon, S.; Kim, S.Y.; Nam, D. Improving gene-set enrichment analysis of RNA-Seq data with small replicates. PLoS ONE 2016. [Google Scholar] [CrossRef]
- Xiong, Q.; Mukherjee, S.; Furey, T.S. GSAASeqSP: A toolset for gene set association analysis of RNA-Seq data. Sci. Rep. 2014. [Google Scholar] [CrossRef]
- Wang, X.; Cairns, M.J. SeqGSEA: A Bioconductor package for gene set enrichment analysis of RNA-Seq data integrating differential expression and splicing. Bioinformatics 2014. [Google Scholar] [CrossRef]
- Alhamdoosh, M.; Ng, M.; Wilson, N.J.; Sheridan, J.M.; Huynh, H.; Wilson, M.J.; Ritchie, M.E. Combining multiple tools outperforms individual methods in gene set enrichment analyses. Bioinformatics 2017. [Google Scholar] [CrossRef]
- Stamm, K.; Tomita-Mitchell, A.; Bozdag, S. GSEPD: A Bioconductor package for RNA-seq gene set enrichment and projection display. BMC Bioinform. 2019. [Google Scholar] [CrossRef]
- Lee, C.; Patil, S. Sartor MA. RNA-Enrich: A cut-off free functional enrichment testing method for RNA-seq with improved detection power. Bioinformatics 2016. [Google Scholar] [CrossRef]
- Wu, M.C.; Kraft, P.; Epstein, M.P.; Taylor, D.M.; Chanock, S.J.; Hunter, D.J.; Lin, X. Powerful SNP-Set Analysis for Case-Control Genome-wide Association Studies. Am. J. Hum. Genet. 2010. [Google Scholar] [CrossRef] [PubMed]
- Nam, D.; Kim, J.; Kim, S.-Y.; Kim, S. GSA-SNP: A general approach for gene set analysis of polymorphisms. Nucleic Acids Res. 2010, 38, W749–W754. [Google Scholar] [CrossRef] [PubMed]
- Wang, K.; Li, M.; Bucan, M. Pathway-Based Approaches for Analysis of Genomewide Association Studies. Am. J. Hum. Genet. 2007. [Google Scholar] [CrossRef]
- Madsen, B.E.; Browning, S.R. A Groupwise Association Test for Rare Mutations Using a Weighted Sum Statistic. PLoS Genet. 2009, 5, e1000384. [Google Scholar] [CrossRef] [PubMed]
- Morris, A.P.; Zeggini, E. An evaluation of statistical approaches to rare variant analysis in genetic association studies. Genet. Epidemiol. 2010, 34, 188–194. [Google Scholar] [CrossRef] [PubMed]
- Li, B.; Leal, S.M. Methods for Detecting Associations with Rare Variants for Common Diseases: Application to Analysis of Sequence Data. Am. J. Hum. Genet. 2008. [Google Scholar] [CrossRef]
- Wu, M.C.; Lee, S.; Cai, T.; Li, Y.; Boehnke, M.; Lin, X. Rare-variant association testing for sequencing data with the sequence kernel association test. Am. J. Hum. Genet. 2011. [Google Scholar] [CrossRef]
- Medina, I.; Montaner, D.; Bonifaci, N.; Pujana, M.A.; Carbonell, J.; Tarraga, J.; Al-Shahrour, F.; Dopazo, J. Gene set-based analysis of polymorphisms: Finding pathways or biological processes associated to traits in genome-wide association studies. Nucleic Acids Res. 2009, 37 (Suppl. 2), W340–W344. [Google Scholar] [CrossRef]
- O’Dushlaine, C.; Kenny, E.; Heron, E.A.; Segurado, R.; Gill, M.; Morris, D.W.; Corvin, A. The SNP ratio test: Pathway analysis of genome-wide association datasets. Bioinformatics 2009. [Google Scholar] [CrossRef]
- Chen, X.; Wang, L.; Hu, B.; Guo, M.; Barnard, J.; Zhu, X. Pathway-based analysis for genome-wide association studies using supervised principal components. Genet. Epidemiol. 2010, 34, 716–724. [Google Scholar] [CrossRef]
- Luo, L.; Zhu, Y.; Xiong, M. Smoothed functional principal component analysis for testing association of the entire allelic spectrum of genetic variation. Eur. J. Hum. Genet. 2013, 21, 217–224. [Google Scholar] [CrossRef] [PubMed]
- Kim, J.H.; Karnovsky, A.; Mahavisno, V.; Weymouth, T.; Pande, M.; Dolinoy, D.C.; Rozek, L.S.; Sartor, M.A. LRpath analysis reveals common pathways dysregulated via DNA methylation across cancer types. BMC Genom. 2012. [Google Scholar] [CrossRef] [PubMed]
- Sun, R.; Hui, S.; Bader, G.D.; Lin, X.; Kraft, P. Powerful gene set analysis in GWAS with the Generalized Berk-Jones statistic. PLOS Genet. 2019, 15, e1007530. [Google Scholar] [CrossRef] [PubMed]
- Schwarz, D.F.; Hädicke, O.; Erdmann, J.; Ziegler, A.; Bayer, D.; Möller, S. SNPtoGO: Characterizing SNPs by enriched GO terms. Bioinformatics 2008. [Google Scholar] [CrossRef]
- Holmans, P.; Green, E.K.; Pahwa, J.S.; Ferreira, M.A.R.; Purcell, S.M.; Sklar, P.; The Wellcome Trust Case-Control Consortium; Owen, M.J.; O’Donovan, M.C.; Craddock, N. Gene Ontology Analysis of GWA Study Data Sets Provides Insights into the Biology of Bipolar Disorder. Am. J. Hum. Genet. 2009. [Google Scholar] [CrossRef]
- Yu, K.; Li, Q.; Bergen, A.W.; Pfeiffer, R.M.; Rosenberg, P.S.; Caporaso, N.; Kraft, P.; Chatterjee, N. Pathway analysis by adaptive combination of P-values. Genet Epidemiol. 2009. [Google Scholar] [CrossRef]
- Bessarabova, M.; Ishkin, A.; JeBailey, L.; Nikolskaya, T.; Nikolsky, Y. Knowledge-based analysis of proteomics data. BMC Bioinform. 2012, 13, S13. [Google Scholar] [CrossRef]
- Yaspan, B.L.; Bush, W.S.; Torstenson, E.S.; Ma, D.; Pericak-Vance, M.A.; Ritchie, M.D.; Sutcliffe, J.S.; Haines, J.L. Genetic analysis of biological pathway data through genomic randomization. Hum Genet. 2011. [Google Scholar] [CrossRef]
- Moskvina, V.; O’Dushlaine, C.; Purcell, S.; Craddock, N.; Holmans, P.; O’Donovan, M.C. Evaluation of an approximation method for assessment of overall significance of multiple-dependent tests in a genomewide association study. Genet Epidemiol. 2011. [Google Scholar] [CrossRef]
- Lee, P.H.; O’dushlaine, C.; Thomas, B.; Purcell, S.M. INRICH: Interval-based enrichment analysis for genome-wide association studies. Bioinformatics 2012. [Google Scholar] [CrossRef]
- Araki, H.; Knapp, C.; Tsai, P.; Print, C. GeneSetDB: A comprehensive meta-database, statistical and visualisation framework for gene set analysis. FEBS Open Bio 2012, 2, 76–82. [Google Scholar] [CrossRef] [PubMed]
- Ayellet, V.S.; Groop, L.; Mootha, V.K.; Daly, M.J.; Altshuler, D. Common inherited variation in mitochondrial genes is not enriched for associations with type 2 diabetes or related glycemic traits. PLoS Genet. 2010. [Google Scholar] [CrossRef]
- Li, M.X.; Kwan, J.S.H.; Sham, P.C. HYST: A hybrid set-based test for genome-wide association studies, with application to protein-protein interaction-based association analysis. Am. J. Hum. Genet. 2012. [Google Scholar] [CrossRef] [PubMed]
- Purcell, S.; Neale, B.; Todd-Brown, K.; Thomas, L.; Ferreira, M.A.R.; Bender, D.; Maller, J.; Sklar, P.; Bakker, P.I.W.; Daly, M.J.; et al. PLINK: A tool set for whole-genome association and population-based linkage analyses. Am. J. Hum. Genet. 2007, 81, 559–575. [Google Scholar] [CrossRef]
- Lips, E.S.; Cornelisse, L.N.; Toonen, R.F.; Min, J.L.; Hultman, C.M.; Holmans, P.A.; O’Donovan, M.C.; Purcell, S.M.; Smit, A.B.; Verhage, M.; et al. Functional gene group analysis identifies synaptic gene groups as risk factor for schizophrenia. Mol. Psychiatry 2012, 17, 996–1006. [Google Scholar] [CrossRef]
- Pedroso, I.; Lourdusamy, A.; Rietschel, M.; Nöthen, M.M.; Cichon, S.; McGuffin, P.; AI-Chalabi, A.; Barnes, M.R.; Breen, G. Common genetic variants and gene-expression changes associated with bipolar disorder are over-represented in brain signaling pathway genes. Biol. Psychiatry 2012. [Google Scholar] [CrossRef]
- Holden, M.; Deng, S.; Wojnowski, L.; Kulle, B. GSEA-SNP: Applying gene set enrichment analysis to SNP data from genome-wide association studies. Bioinformatics 2008, 24, 2784–2785. [Google Scholar] [CrossRef]
- Subramanian, A.; Kuehn, H.; Gould, J.; Tamayo, P.; Mesirov, J.P. GSEA-P: A desktop application for Gene Set Enrichment Analysis. Bioinformatics 2007, 23, 3251–3253. [Google Scholar] [CrossRef]
- Zhang, K.; Chang, S.; Cui, S.; Guo, L.; Zhang, L.; Wang, J. ICSNPathway: Identify candidate causal SNPs and pathways from genome-wide association study by one analytical framework. Nucleic Acids Res. 2011, 39, W437–W443. [Google Scholar] [CrossRef]
- Zhang, K.; Cui, S.; Chang, S.; Zhang, L.; Wang, J. i-GSEA4GWAS: A web server for identification of pathways/gene sets associated with traits by applying an improved gene set enrichment analysis to genome-wide association study. Nucleic Acids Res. 2010, 38, W90–W95. [Google Scholar] [CrossRef]
- Zhang, K.; Chang, S.; Guo, L.; Wang, J. I-GSEA4GWAS v2: A web server for functional analysis of SNPs in trait-associated pathways identified from genome-wide association study. Protein Cell 2015, 6, 221–224. [Google Scholar] [CrossRef] [PubMed]
- Jia, P.; Zheng, S.; Long, J.; Zheng, W.; Zhao, Z. dmGWAS: Dense module searching for genome-wide association studies in protein–protein interaction networks. Bioinformatics 2011, 27, 95–102. [Google Scholar] [CrossRef] [PubMed]
- Krämer, A.; Green, J.; Pollard, J.; Tugendreich, S. Causal analysis approaches in Ingenuity Pathway Analysis. Bioinformatics 2014, 30, 523–530. [Google Scholar] [CrossRef] [PubMed]
- Wang, L.; Matsushita, T.; Madireddy, L.; Mousavi, P.; Baranzini, S.E. PINBPA: Cytoscape app for network analysis of GWAS data. Bioinformatics 2015, 31, 262–264. [Google Scholar] [CrossRef]
- Kutmon, M.; van Iersel, M.P.; Bohler, A.; Kelder, T.; Nunes, N.; Pico, A.R.; Evelo, C.T. PathVisio 3: An Extendable Pathway Analysis Toolbox. PLOS Comput Biol. 2015, 11, e1004085. [Google Scholar] [CrossRef]
- Smoot, M.E.; Ono, K.; Ruscheinski, J.; Wang, P.-L.; Ideker, T. Cytoscape 2.8: New features for data integration and network visualization. Bioinformatics 2011, 27, 431–432. [Google Scholar] [CrossRef]
- de Leeuw, C.A.; Mooij, J.M.; Heskes, T.; Posthuma, D. MAGMA: Generalized Gene-Set Analysis of GWAS Data. PLoS Comput. Biol. 2015. [Google Scholar] [CrossRef]
- Maciejewski, H. Gene set analysis methods: Statistical models and methodological differences. Brief Bioinform. 2014, 15, 504–518. [Google Scholar] [CrossRef]
- Ashburner, M.; Ball, C.A.; Blake, J.A.; Botstein, D.; Butler, H.; Cherry, J.M.; Davis, V.P.; Tarver, L.I.; Kasarakis, A.; Lewis, S.; et al. Gene Ontology: Tool for the unification of biology. Nat Genet. 2000, 25, 25–29. [Google Scholar] [CrossRef]
- Kanehisa, M. The KEGG resource for deciphering the genome. Nucleic Acids Res. 2004, 32, D277–D280. [Google Scholar] [CrossRef]
- Carbon, S.; Dietze, H.; Lewis, S.E.; Mungall, C.J.; Munoz-Torres, M.C.; Basu, S.; Chisholm, R.L.; Dodson, R.J.; Fey, P.; Thomas, P.D.; et al. Expansion of the Gene Ontology knowledgebase and resources. Nucleic Acids Res. 2017, 45, D331–D338. [Google Scholar] [CrossRef]
- Mishra, P.; Törönen, P.; Leino, Y.; Holm, L. Gene set analysis: Limitations in popular existing methods and proposed improvements. Bioinformatics 2014. [Google Scholar] [CrossRef] [PubMed]
- Abatangelo, L.; Maglietta, R.; Distaso, A.; D’Addabbo, A.; Creanza, T.M.; Mukherjee, S.; Ancona, N. Comparative study of gene set enrichment methods. BMC Bioinform. 2009. [Google Scholar] [CrossRef] [PubMed]
- Tarca, A.L.; Bhatti, G.; Romero, R. A comparison of gene set analysis methods in terms of sensitivity, prioritization and specificity. PLoS ONE 2013. [Google Scholar] [CrossRef]
- Pers, T.H. Gene set analysis for interpreting genetic studies. Hum. Mol. Genet. 2016. [Google Scholar] [CrossRef] [PubMed]
- Tamayo, P.; Steinhardt, G.; Liberzon, A.; Mesirov, J.P. The limitations of simple gene set enrichment analysis assuming gene independence. Stat. Methods Med. Res. 2016. [Google Scholar] [CrossRef]
- Dinu, I.; Potter, J.D.; Mueller, T.; Liu, Q.; Adewale, A.J.; Jhangri, G.S.; Einecke, G.; Famulski, K.S.; Halloran, P.; Yasui, Y. Gene-set analysis and reduction. Brief Bioinform. 2009, 10, 24–34. [Google Scholar] [CrossRef]
- Boca, S.M.; Kinzler, K.W.; Velculescu, V.E.; Vogelstein, B.; Parmigiani, G. Patient-oriented gene set analysis for cancer mutation data. Genome Biol. 2010. [Google Scholar] [CrossRef]


| Approach | Methodology | Advantages | Limitations | Tools/Algorithms |
|---|---|---|---|---|
| Over Representation Analysis (First generation microarrays GSA) | Hypergeometric distribution/Fisher’s test Binomial distribution, Chi-square distribution, etc. |
|
| DAVID [41], AgriGO [32], Onto-Express [21], GenMAPP [42], GoMiner [43], FatiGO [44], GOstat [20], FuncAssociate [19], GOToolBox [45], GeneMerge [46], GOEAST [47], ClueGO [48], FunSpec [49], GARBAN [50], GO:TermFinder [22], WebGestalt [51], GOFFA [52], WEGO [53], GOTM [54], EASE, GSAQ [10], Pathview [55], Wholepathwayscope [56], ShinnyGO |
| Enrichment Statistic Analysis (Second generation microarrays GSA) | Wilcoxon signed rank test, Sum, Mean, or Median of gene-level statistic(s), Wilcoxon signed rank sum, Max-Mean Statistic |
|
| GSEA [24], SAFE [39], GSA [8], Random set [57], sigPathway, Category, GlobalTest [26], PCOT2 [58], SAM-GS [59], LIMMA [60], Catmap [61], T-profiler [62], FunCluster [63], GeneTrail [64], Gazer [65], GSAQ [10], ANCOVA test, CAMERA [66], PAGE [37], GAGE [67], SGSE [68], GSNCA [69], GSA-SDR [70], GenePattern [71], plantGSEA [9], GSAR [29] |
| Topology Analysis (Third generation microarrays GSA) | Graph/network theory |
|
| PathwayExpress [72], ScorePAGE [73], SPIA [74], NetGSA [75], TopoGSA [76], CliPPER [77] |
| Approach | Methodology | Advantages | Limitations | Tools |
|---|---|---|---|---|
| Over Representation Analysis (First generation RNA-seq GSA) | Hypergeometric distribution, Fisher’s exact test |
|
| GoSeq [80], iDEP [81] |
| GS Enrichment Analysis (Second generation of RNA-seq GSA) | Wilcoxon signed rank test, Max-Mean Statistic (with count normalization technique) |
|
| AbsFilterGSEA [85], GSAAseqSP [86], seqGSEA [87], ssGSEA, EGSEA [88], GSVA [83], GSEPD [89], RNA-Enrich [90] |
| Approach | Methodology | Advantages | Limitations | Tools/Algorithm |
|---|---|---|---|---|
| Over Representation Analysis (First generation GWAS GSA) | Hypergeometric distribution, Fisher’s exact test, Binomial test |
|
| SNPtoGO [104], ALIGATOR [105], ATRP [106], MetaCore [107], PARIS [108], SET SCREEN test [109], SNP ratio test [99], GLOSSI, GeSBAP [98], INRICH [110], GeneSetDB [111], MAGENTA [112], KGG-HYST [113], PLINK [114], JAG [115], FORGE [116] |
| Enrichment Statistic(s) Analysis (Second generation GWAS GSA) | Wilcoxon signed rank test, Sum test, Weighted Sum test (Enrichment score like statistic) |
|
| GSA-SNP [92], GSA-SNP2, GSEA-SNP [117], GSEA-P [118] GenGen [15], ICSNPathway [119], i-GSEA4GWAS [120], i-GSEA4GWAS2 [121] |
| Topology Analysis (Third generation GWAS GSA) | Graph/Network theory |
|
| dmGWAS [122], Ingenuity Pathway Analysis (IPA) [123], PINBPA [124], PathVisio [125], Cytoscape [126] |
| Multivariate/Model/ Regression Analysis (Fourth generation GWAS GSA) | Linear regression Model, Ridge regression, Logistic regression, Linear models |
|
| LRpath [102], SPCA [100], SFPCA [101], MAGMA [127], GRASS, GeneralizedBerk-Jones statistic [103], |
© 2020 by the authors. Licensee MDPI, Basel, Switzerland. This article is an open access article distributed under the terms and conditions of the Creative Commons Attribution (CC BY) license (http://creativecommons.org/licenses/by/4.0/).
Share and Cite
Das, S.; McClain, C.J.; Rai, S.N. Fifteen Years of Gene Set Analysis for High-Throughput Genomic Data: A Review of Statistical Approaches and Future Challenges. Entropy 2020, 22, 427. https://doi.org/10.3390/e22040427
Das S, McClain CJ, Rai SN. Fifteen Years of Gene Set Analysis for High-Throughput Genomic Data: A Review of Statistical Approaches and Future Challenges. Entropy. 2020; 22(4):427. https://doi.org/10.3390/e22040427
Chicago/Turabian StyleDas, Samarendra, Craig J. McClain, and Shesh N. Rai. 2020. "Fifteen Years of Gene Set Analysis for High-Throughput Genomic Data: A Review of Statistical Approaches and Future Challenges" Entropy 22, no. 4: 427. https://doi.org/10.3390/e22040427
APA StyleDas, S., McClain, C. J., & Rai, S. N. (2020). Fifteen Years of Gene Set Analysis for High-Throughput Genomic Data: A Review of Statistical Approaches and Future Challenges. Entropy, 22(4), 427. https://doi.org/10.3390/e22040427