Article

Information Transfer between Stock Market Sectors: A Comparison between the USA and China

1
School of Business, East China University of Science and Technology, Shanghai 200237, China
2
School of Business, University of Technology Sydney, Sydney NSW 2007, Australia
3
College of Business, Shanghai University of Finance and Economics, Shanghai 200433, China
4
School of Economics, Finance and Banking, College of Business, Universiti Utara Malaysia, 06010 UUM Sintok, Kedah, Malaysia
5
Department of Mathematics, East China University of Science and Technology, Shanghai 200237, China
6
Research Center for Econophysics, East China University of Science and Technology, Shanghai 200237, China
*
Author to whom correspondence should be addressed.
Entropy 2020, 22(2), 194; https://doi.org/10.3390/e22020194
Submission received: 13 January 2020 / Revised: 4 February 2020 / Accepted: 5 February 2020 / Published: 7 February 2020
(This article belongs to the Special Issue Complexity in Economic and Social Systems)

Abstract

:
Information diffusion within financial markets plays a crucial role in the process of price formation and the propagation of sentiment and risk. We perform a comparative analysis of information transfer between industry sectors of the Chinese and the USA stock markets, using daily sector indices for the period from 2000 to 2017. The information flow from one sector to another is measured by the transfer entropy of the daily returns of the two sector indices. We find that the most active sector in information exchange (i.e., the largest total information inflow and outflow) is the non-bank financial sector in the Chinese market and the technology sector in the USA market. This is consistent with the role of the non-bank sector in corporate financing in China and the impact of technological innovation in the USA. In each market, the most active sector is also the largest information sink that has the largest information inflow (i.e., inflow minus outflow). In contrast, we identify that the main information source is the bank sector in the Chinese market and the energy sector in the USA market. In the case of China, this is due to the importance of net bank lending as a signal of corporate activity and the role of energy pricing in affecting corporate profitability. There are sectors such as the real estate sector that could be an information sink in one market but an information source in the other, showing the complex behavior of different markets. Overall, these findings show that stock markets are more synchronized, or ordered, during periods of turmoil than during periods of stability.

1. Introduction

Complex systems, such as financial markets, are usually composed of many subsystems; in the case of financial markets, information flows and interactions within the market itself are rarely investigated even though they are critical to driving the complex dynamics of the complex system as a whole. Many methods have been proposed to unveil these different relationships among subsystems, such as correlations including simple correlation analysis [1,2], Granger causality [3], nonparametric approaches such as the thermal optimal path method [4,5,6], and mutual information analysis [7,8,9]. These different approaches have their own advantages and limitations. Importantly, while Granger causality is commonly used to identify time-varying single or bidirectional causality in economics, it is sensitive to sample period selection and complexity in the underlying time series, as well as having other issues [10,11].
In this paper, we use an alternative approach termed transfer entropy to identify the information transfers between industrial sectors in the world’s two largest economies: the USA and China. Transfer entropy, as a kind of log-likelihood ratio [12], is a measure that quantifies information flow based on the probability density function (PDF). Better than correlations or Granger causality, transfer entropy not only identifies the direction of the information flow but also quantifies the flows between different subsystems. In other words, it is capable of quantifying the strength and direction of the interaction between different subsystems at the same time. This approach has found wide application [13,14,15,16,17,18,19,20,21]. Furthermore, variation and extensions of transfer entropy have been developed that are suitable for different situations [22], such as symbolic transfer entropy [23].
There are many studies adopting the concept of transfer entropy to economic systems such as financial time series [18,24,25], stock market indices [26,27], composite index and the constituent stocks [28,29], and indices of industry sectors of a stock market [30].
Stock price fluctuations reflect both global and local news as well as news within a subsystem. There are also well-known calendar anomalies related to business cycle and market participants sector rotations [31]. In a related work, Oh et al. investigated the information flows among different sectors of the Korean stock market [30]. They measured the amount of information flow and the degree of information flow asymmetry between industry sectors around the subprime crisis and identified the insurance sector as the key information source after the crisis. Although the authors do not attribute a economic basis for this finding, it is likely linked to the insurance sector acting as a leading indicator of risk in the economy. In this work, their analysis is extended and a comparative study is performed on the information transfer among different industry sectors of the Chinese and the USA stock markets. These two markets are respectively the largest emerging and developed stock markets associated with the two largest economies in the world.
The rest of this paper is organized as follows. Section 2 describes the method for calculating symbolic transfer entropy and the sector indices time series for the Chinese and the USA stock markets. Section 3 presents the empirical results about the information flows between stock market sectors and its relationship with market states. Section 4 concludes this work.

2. Method and Data

2.1. Symbolic Transfer Entropy

Schreiber was the first to use transfer entropy to measure information transfer and detect asymmetry in the interactions among subsystems [13]. He treated a sleeping human’s breath rate time series and heart rate time series as two subsystems and found that the information flow from the heart to the breath signal is dominant. To explore the transfer entropy between two time series, there are various approaches in the literature. We need to briefly summarize what the other approaches are and why the symbolic transfer method is used. We use the symbolic transfer entropy introduced by Staniek and Lehnertz [23]. Consider two different daily closing prices time series { X t } and { Y t }, t = 1 , 2 , , L , which have the same length L. Closing prices are used to ensure that prices factor in local market news as well as intramarket news from the various sectors. Transfer entropy T y x S assumes that X t is influenced by the previous l states of the same variable and by the m previous states of variable Y, for financial markets, only the day before is important [32]. Hence, we use l = m = 1 in this study. The procedure to calculate the symbolic transfer entropy T y x S from time series { y t } to { x t } is briefly described in the following five steps:
First, we adopt the log returns { x t } instead of the original price time series { X t } by
x t ln ( X t ) ln ( X t 1 )
where X t is the closing price of the index on the tth trading day.
Second, the returns are discretized into q nonoverlapping windows of equal length Δ . If there are too many windows, the chance of having particular combinations drops very quickly, making the calculation of probabilities slower and less informative [32]. Hence, it is irrational if q is too large or too small. Marschinski and Kantz consider q = 2 and q = 3 in their research [24]; Sandoval uses q = 24 and q = 6 [32]. We aim at finding the optimal q to maximize the transfer entropy difference between two time series meanwhile minimizing the calculation cost. In our comparative investigations, the parameter q varies from 2 to 22 with a moving step of 1. We find that when q 15 , the difference becomes significantly nonzero. Considering the calculation cost and the strength of transfer entropy, in this work, we use q = 15 . We obtain the maximum value x max and minimum value x min of the time series x t under investigation. The length of each interval is Δ x = [ x max x min ] / q and the kth interval is [ x min + ( k 1 ) Δ x , x min + k Δ x ) . Similarly, we repeat the procedure for y t and its Δ = Δ y is usually different from Δ x .
Third, the log return time series x ^ and y ^ are described as
x ^ t = f ( x t ) = k x and y ^ t = f ( y t ) = k y , k x , k y = 1 , 2 , , q ,
where x t [ x min + ( k x 1 ) Δ x , x min + k x Δ x ) and y t [ y min + ( k y 1 ) Δ y , y min + k y Δ y ) .
Fourth, the number of elements in the qth interval are denoted by x ^ t q and y ^ t q , respectively, and then calculate the probabilities p ( x ^ t ) = x ^ t q / ( L 1 ) and p ( y ^ t ) = y ^ t q / ( L 1 ) and the joint probabilities p ( x ^ t , y ^ t ) , p ( x ^ t , x ^ t + 1 ) and p ( x ^ t + 1 , x ^ t , y ^ t ) .
Fifth, in information theory, different bases of entropy lead to different units of entropy. Base 2 is the most widely applied in transfer entropy for most of empirical works. Therefore, in our study, we use Base 2 to calculate transfer entropy. The symbolic transfer entropy from time series { y t } to time series { x t } is calculated as
T y x S = x ^ t + 1 , x ^ t , y ^ t p ( x ^ t + 1 , x ^ t , y ^ t ) log 2 p ( x ^ t + 1 | x ^ t , y ^ t ) p ( x ^ t + 1 | x ^ t ) ,
where the joint probability p ( x ^ t + 1 , x ^ t , y ^ t ) means the probability that the combination of x ^ t + 1 , x ^ t and y ^ t occurs, while p ( x ^ t + 1 | x ^ t , y ^ t ) and p ( x ^ t + 1 | x ^ t ) are the conditional probabilities that x ^ t + 1 has a particular value when the values of previous samples x ^ t and y ^ t are known and x ^ t is known, respectively. Since
p ( x ^ t + 1 | x ^ t , y ^ t ) = p ( x ^ t + 1 , x ^ t , y ^ t ) p ( x ^ t , y ^ t ) and p ( x ^ t + 1 | x ^ t ) = p ( x ^ t + 1 , x ^ t ) p ( x ^ t ) ,
we can simplify Equation (3) and obtain
T y x S = x ^ t + 1 , x ^ t , y ^ t p ( x ^ t + 1 , x ^ t , y ^ t ) log 2 p ( x ^ t + 1 , x ^ t , y ^ t ) p ( x ^ t ) p ( x ^ t + 1 , x ^ t ) p ( x ^ t , y ^ t ) .
This expression is used for the estimation of the symbolic transfer entropy.

2.2. Data Description

To conduct our analysis, we selected two sets of data from two major stock markets: the Chinese and the USA stock market. The Chinese stock market is the largest emerging market, while the US stock market is the worlds largest developed stock market.
For the Chinese stock market, we retrieved and analyzed the SWS sector indices issued by Shenyin & Wanguo Securities Co., Ltd. (http://www.swsresearch.com). In total, this gave 28 sector indices of the Chinese stock market, and covered 3508 individual stocks. For each sector index series, there were 4359 daily prices from 4 January 2000 to 29 December 2017. The various sectors with their corresponding six-digit codes include: agriculture and forestry (801010), mining (801020), chemical (801030), steel (801040), non-ferrous metals (801050), electronic (801080), household appliances (801110), food and drink (801120), textile and apparel (801130), light manufacturing (801140), biotechnology (801150), utilities (801160), transportation (801170), real estate (801180), commercial trade (801200), leisure and services (801210), composite (801230), building materials (801710), building and decoration (801720), electrical equipment (801730), national defense (801740), computer (801750), media (801760), communications (801770), bank (801780), non-bank financial (801790), automobile (801880), and mechanical equipment (801890).
For the US stock market, we chose 16 sector indices composed by Thompson Reuters Co., Ltd. (http://www.thomsonreuters.cn). For each sector index time series, there were 4695 daily prices from 3 January 2000 to 29 December 2017. The differences in day count in the two series are due to differences in holidays in the two countries. The stock sectors are appliances resources (M3L), banking/investment services (BIL), cyclical construction producers (YPL), cyclical consumer services (CRL), energy (E2L), food/beverages (FBL), healthcare services (HSL), industrial and commercial services (IVL), industrial goods (IGL), mineral resources (MRL), pharmaceuticals/MD research (PHL), real estate (REL), retailers (RTL), technology (TEL), transportation (TRL), and utilities (U2$). We use the concept of symbolic transfer entropy to detect and measure the information flows among the return time series of the 28 sector indices of the Chinese stock market and the 16 sector indices of the USA stock market.

3. Results and Discussion

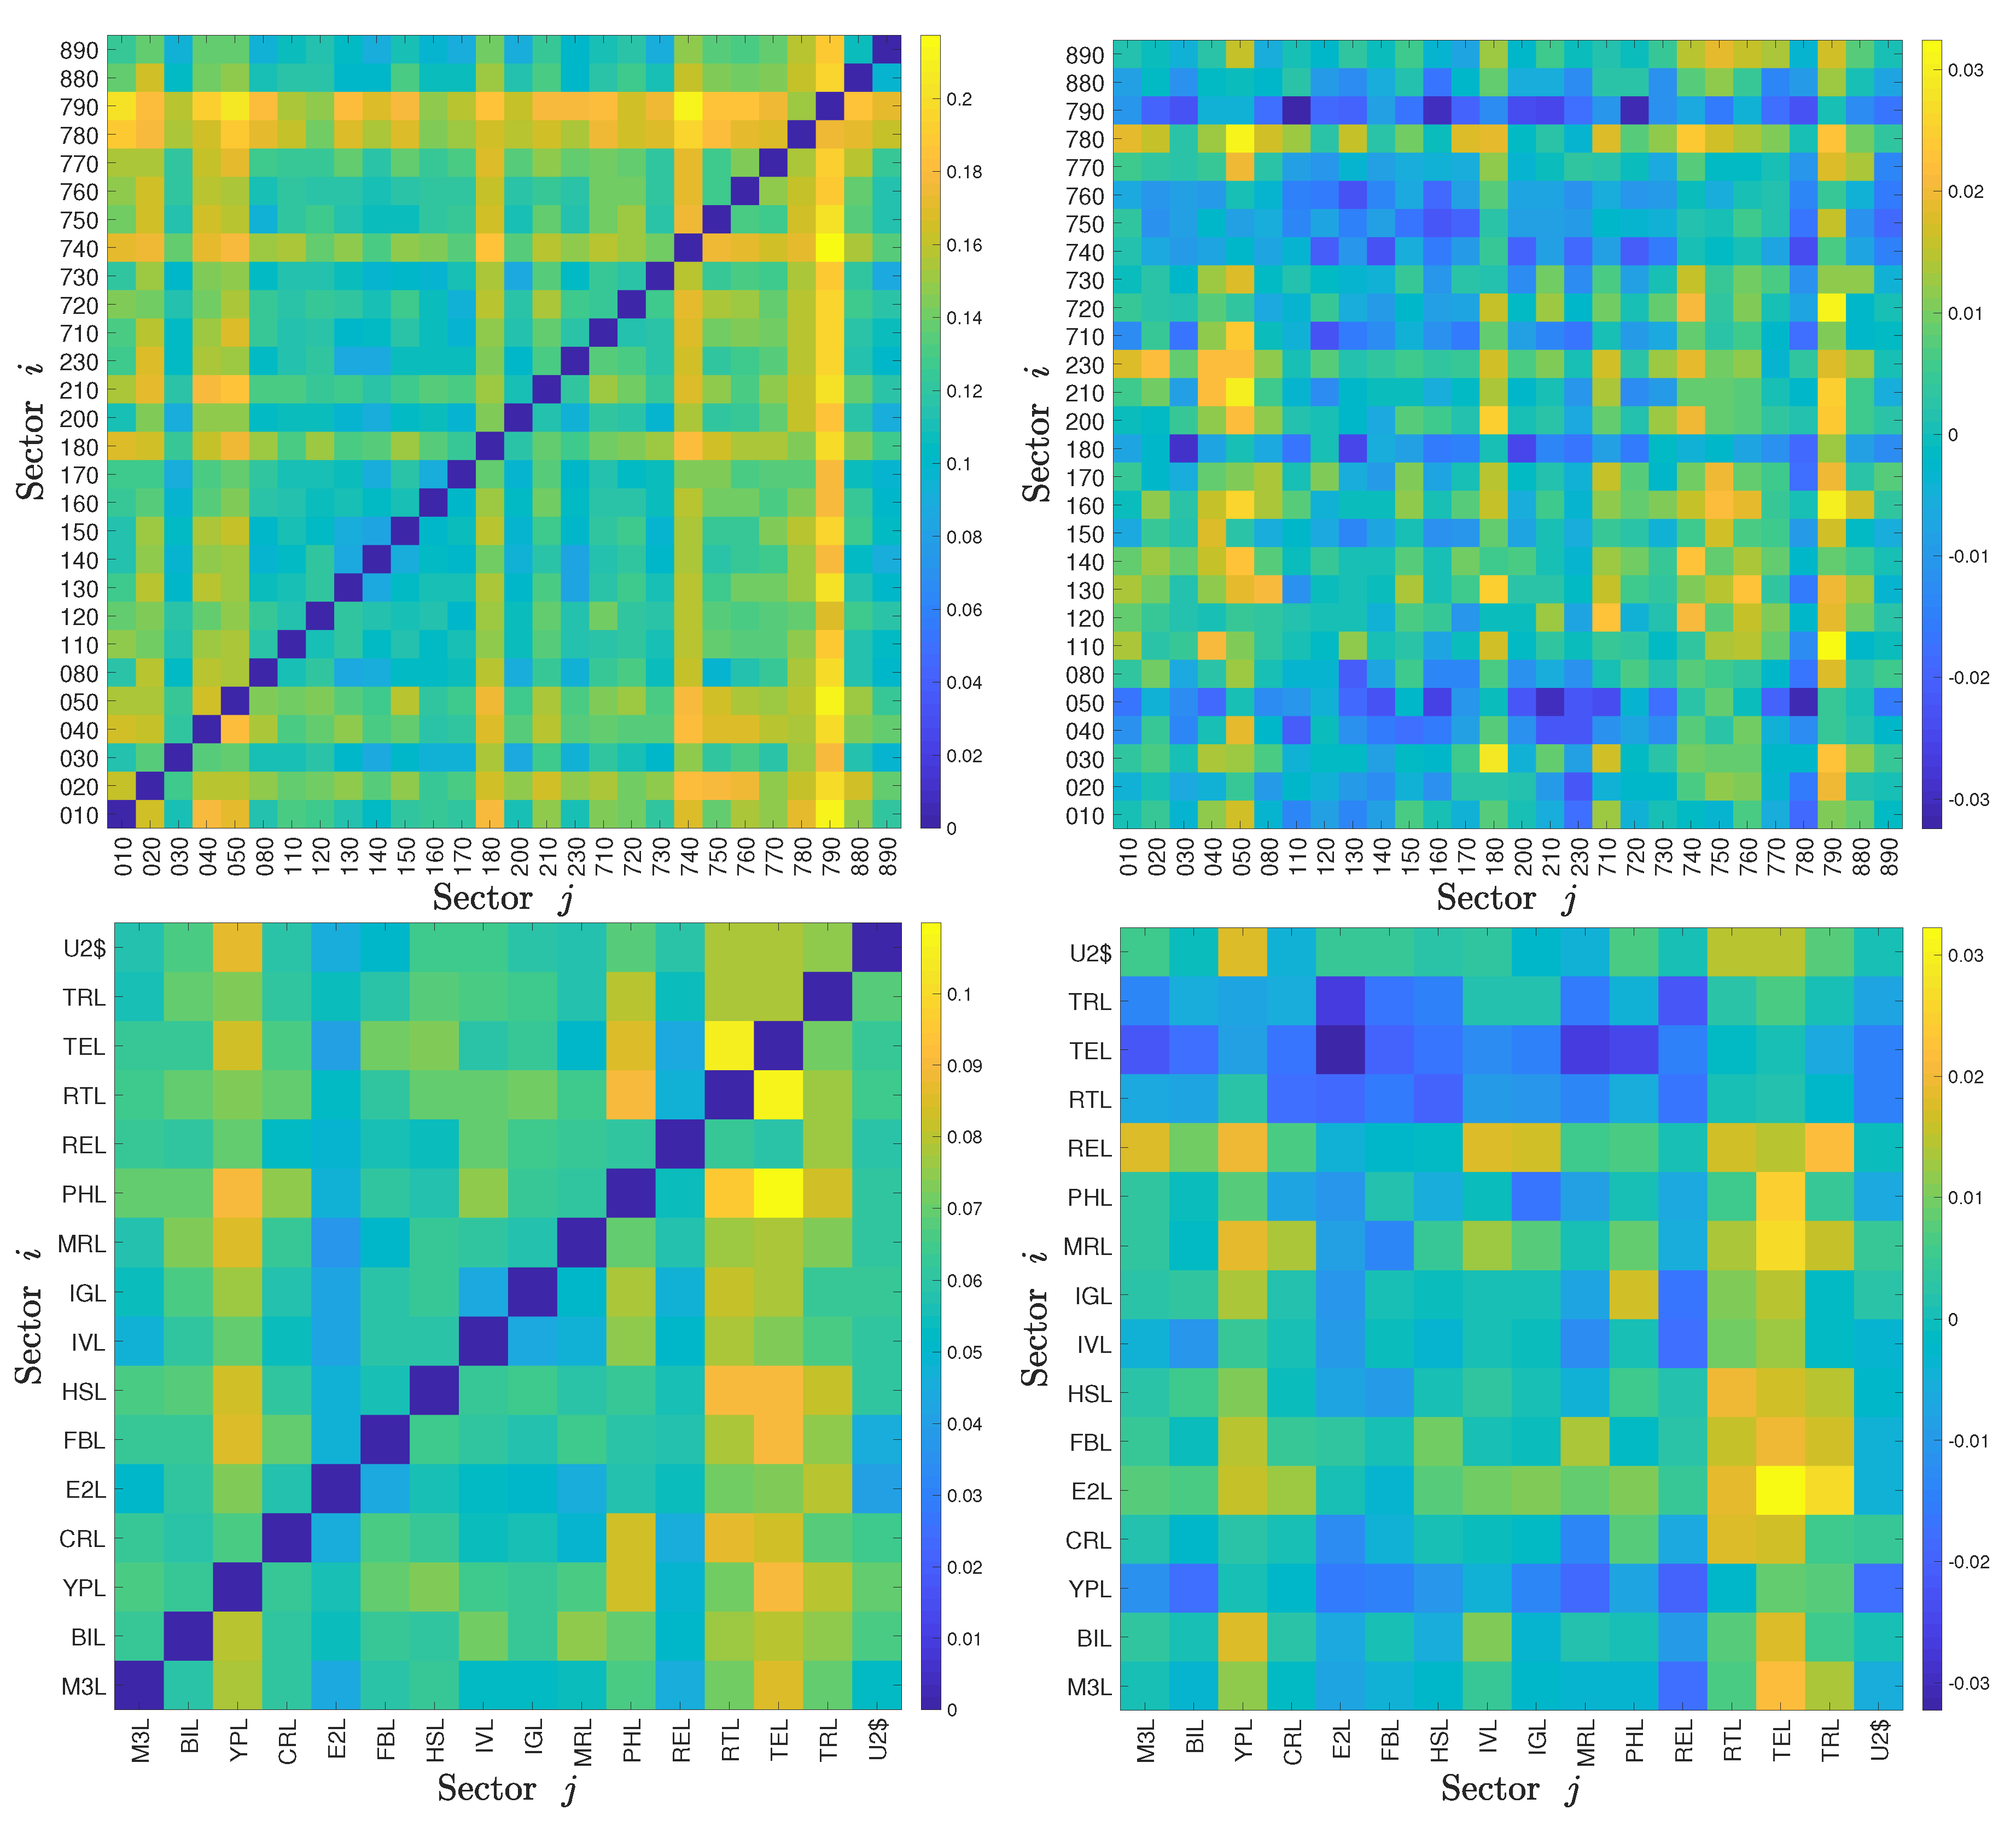
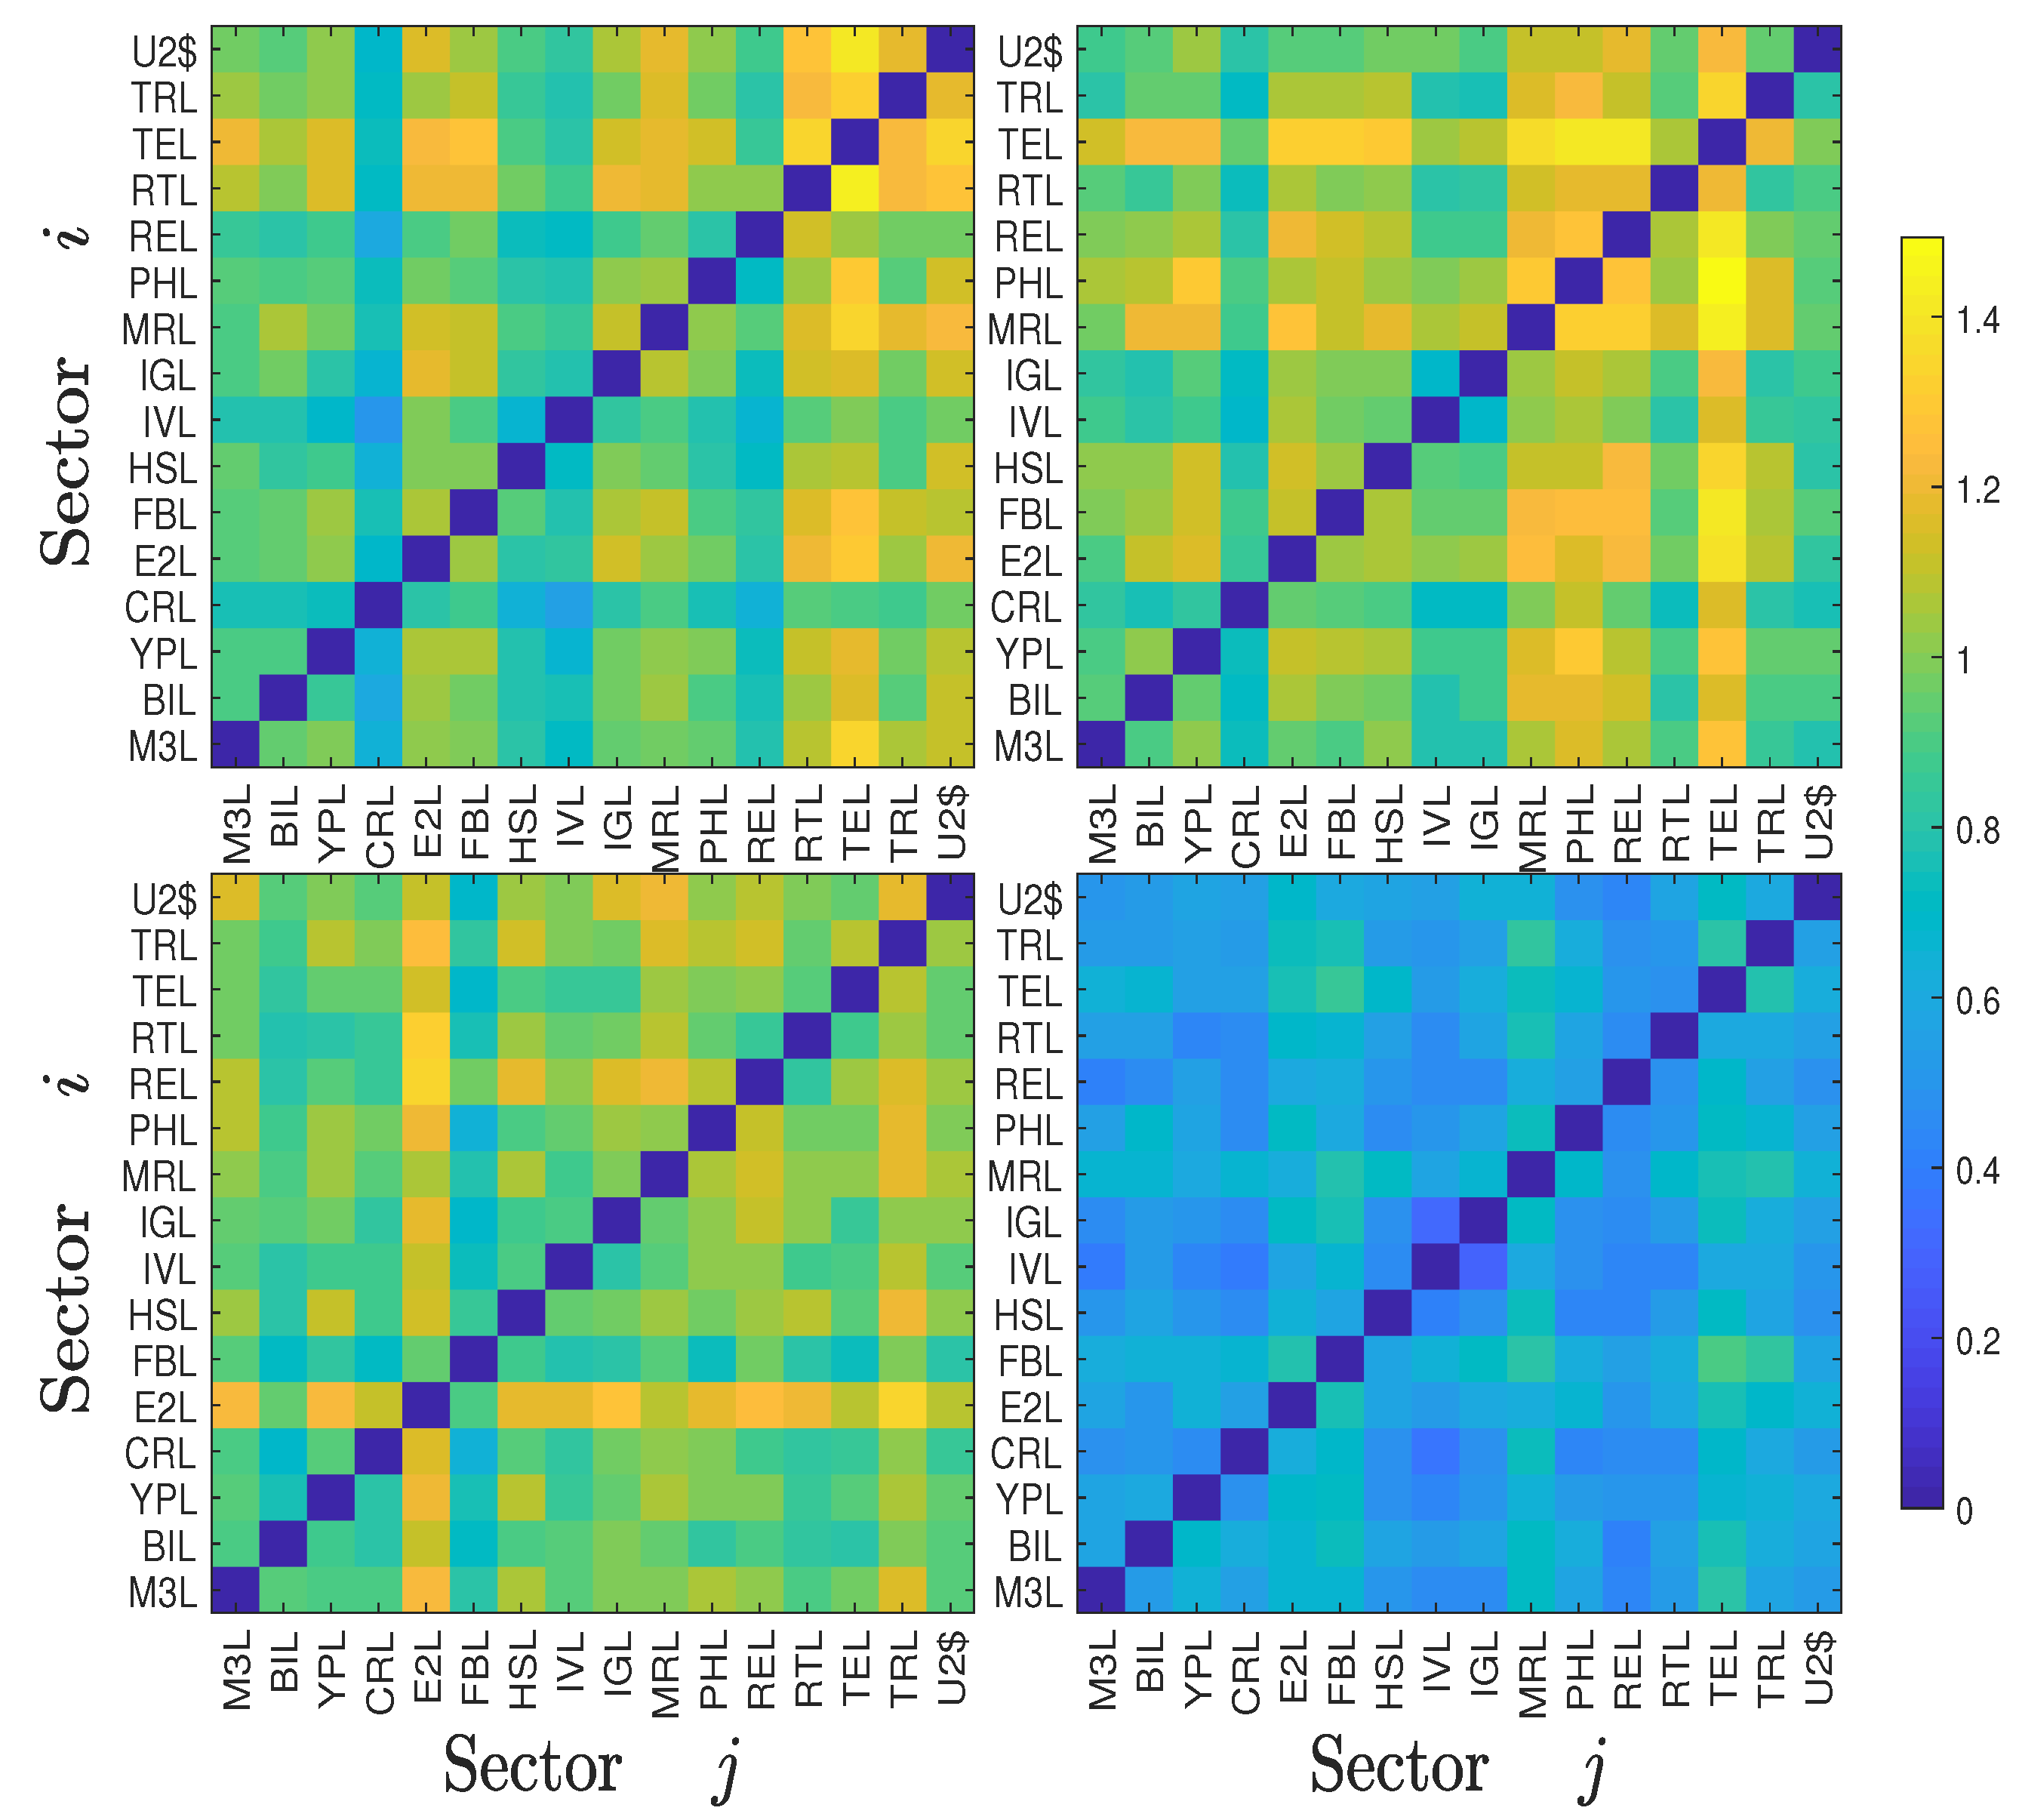
3.1. Symbolic Transfer Entropy and Degree of Asymmetric Information Flow of the Whole Samples

As mentioned in Section 1, symbolic transfer entropy can proxy for the strength and direction of the information flow between two time series. Following Oh et al. [30], we used the degree of asymmetric information flow to measure the information effect between two stock sectors, which is defined as
Δ T i j S = T i j S T j i S .
It follows that Δ T j i S = Δ T i j S . We show the calculation results of our datasets in four heat maps (top row for the Chinese sectors and bottom row for the US sectors) of T i , j S and Δ T i , j S in Figure 1, in which each cell shows the value of T S (left plot) or Δ T S (right plot) from sector i to sector j. We observe that the values in the diagonal matrices T i , j S and Δ T i , j S are zeros, which is trivial and can be understood from the concept of symbolic transfer entropy. We find that the non-bank financial sector (code 790) has roughly the highest T S values for both inflows and outflows among the Chinese sectors, and the technology sector (code TEL) has roughly the highest T S values for both inflows and outflows among the US sectors; the non-bank financial sector comprises three Level 2 sectors in the SWS index system which are security, insurance, and multivariate financial. This suggests that during the sample period from 2000 to 2017, the non-bank financial sector and the technology sector were respectively the most active in the two stock markets. That is, there was more information exchange between these sectors with the other sectors in their own stock markets than between other sectors in the same stock market.

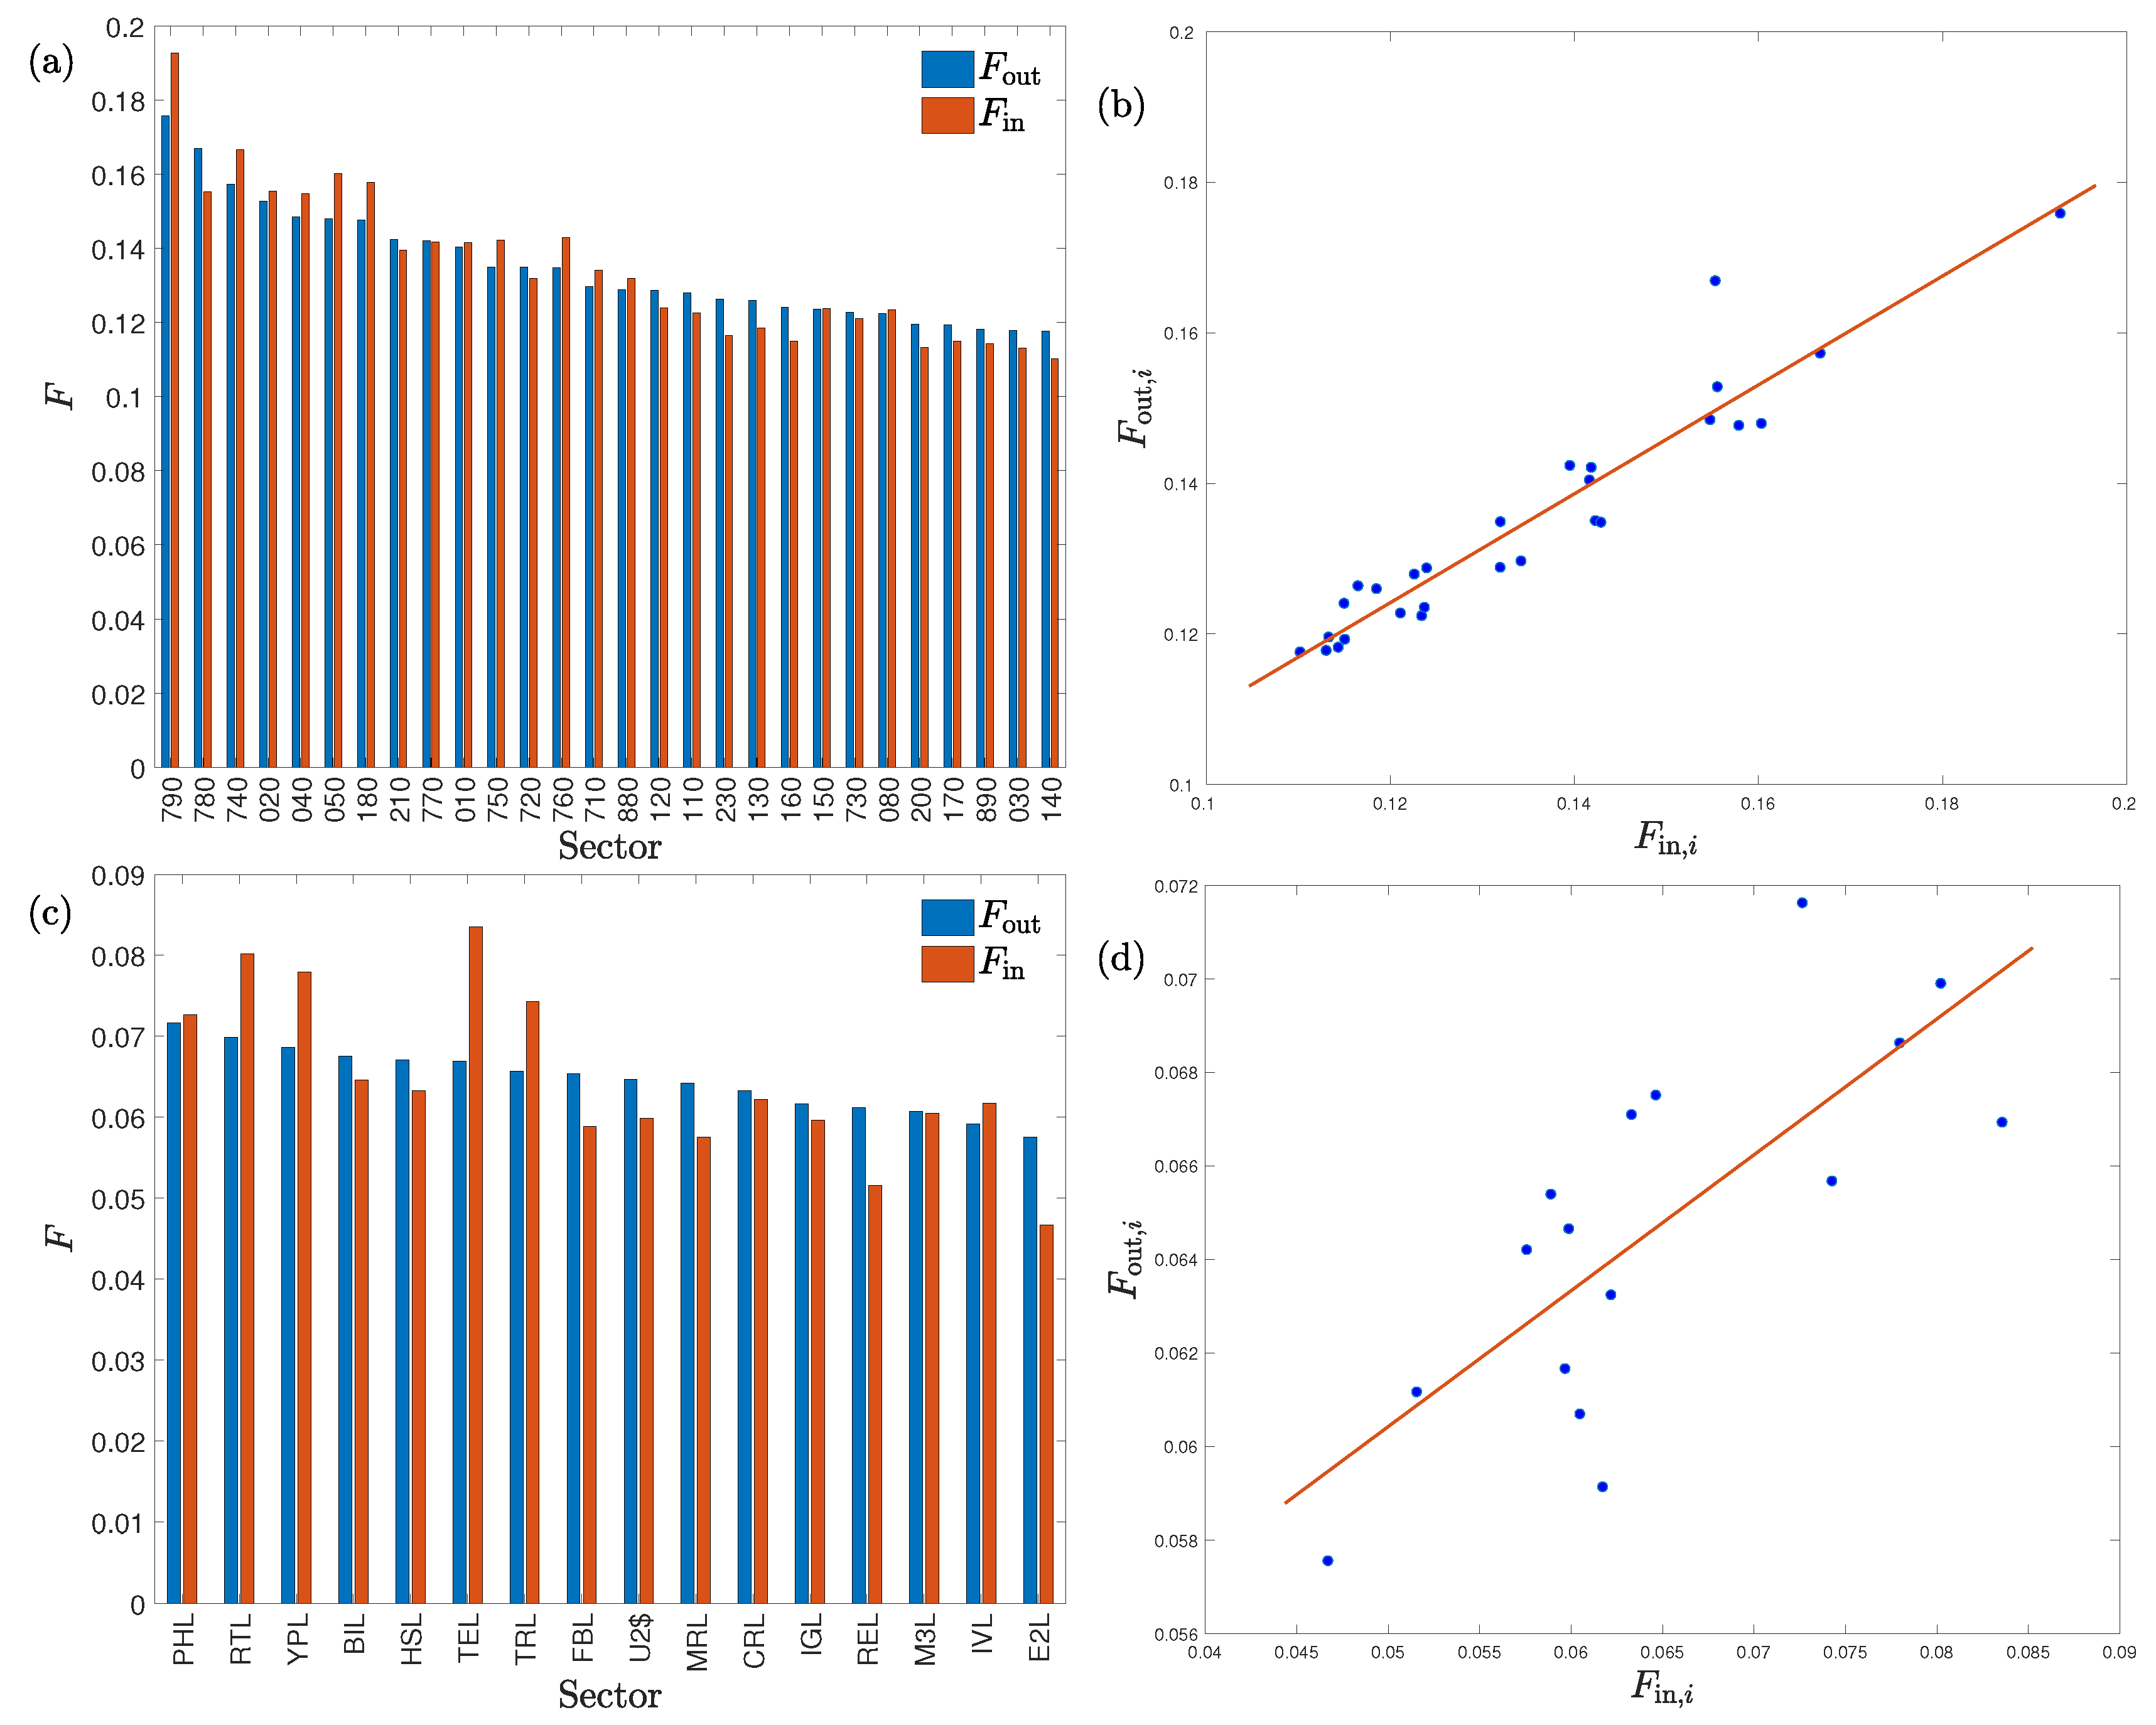
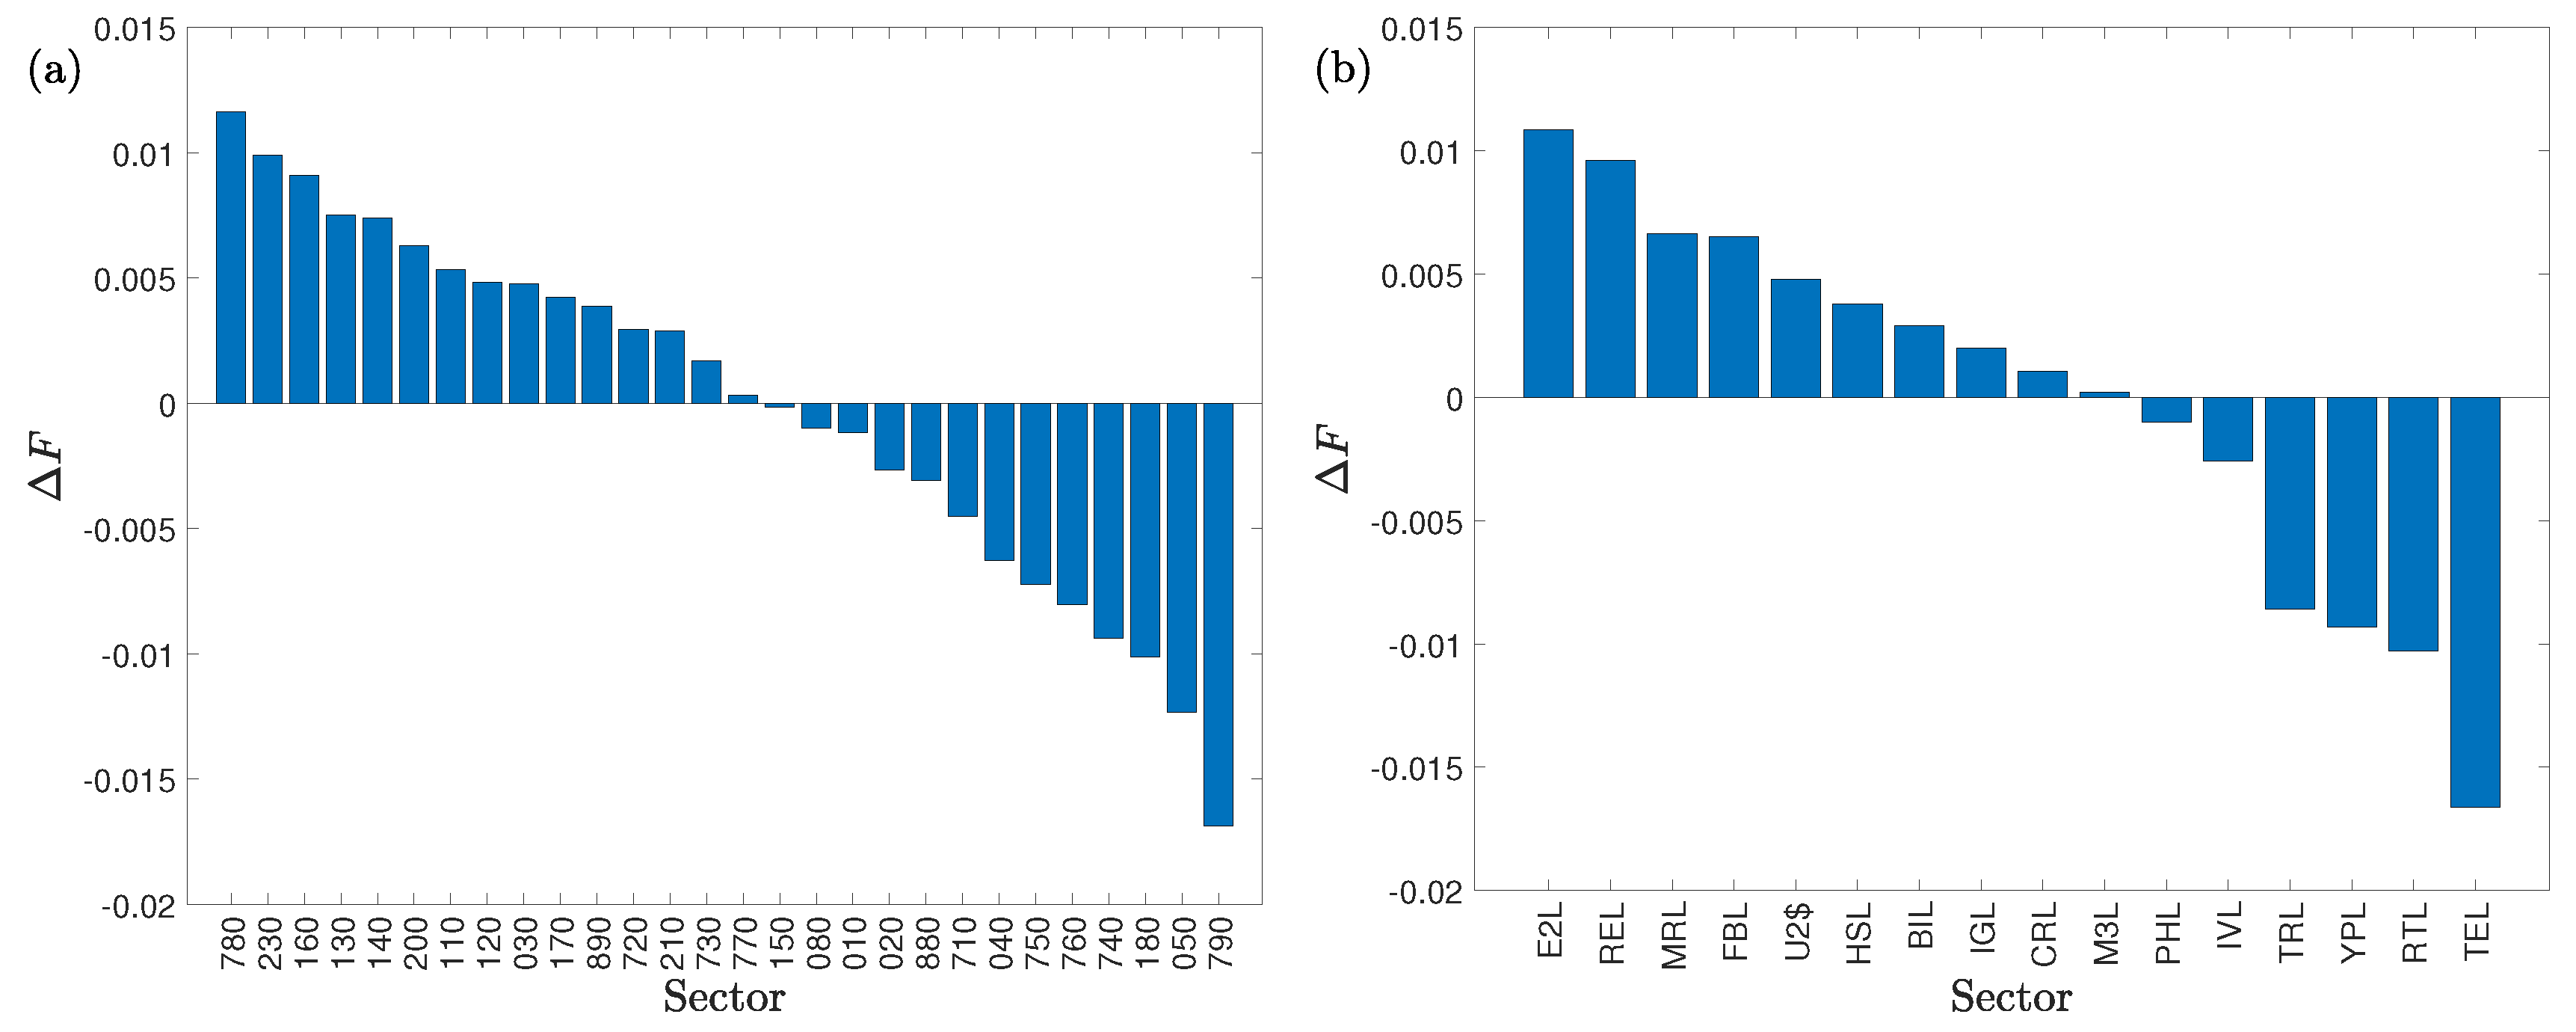
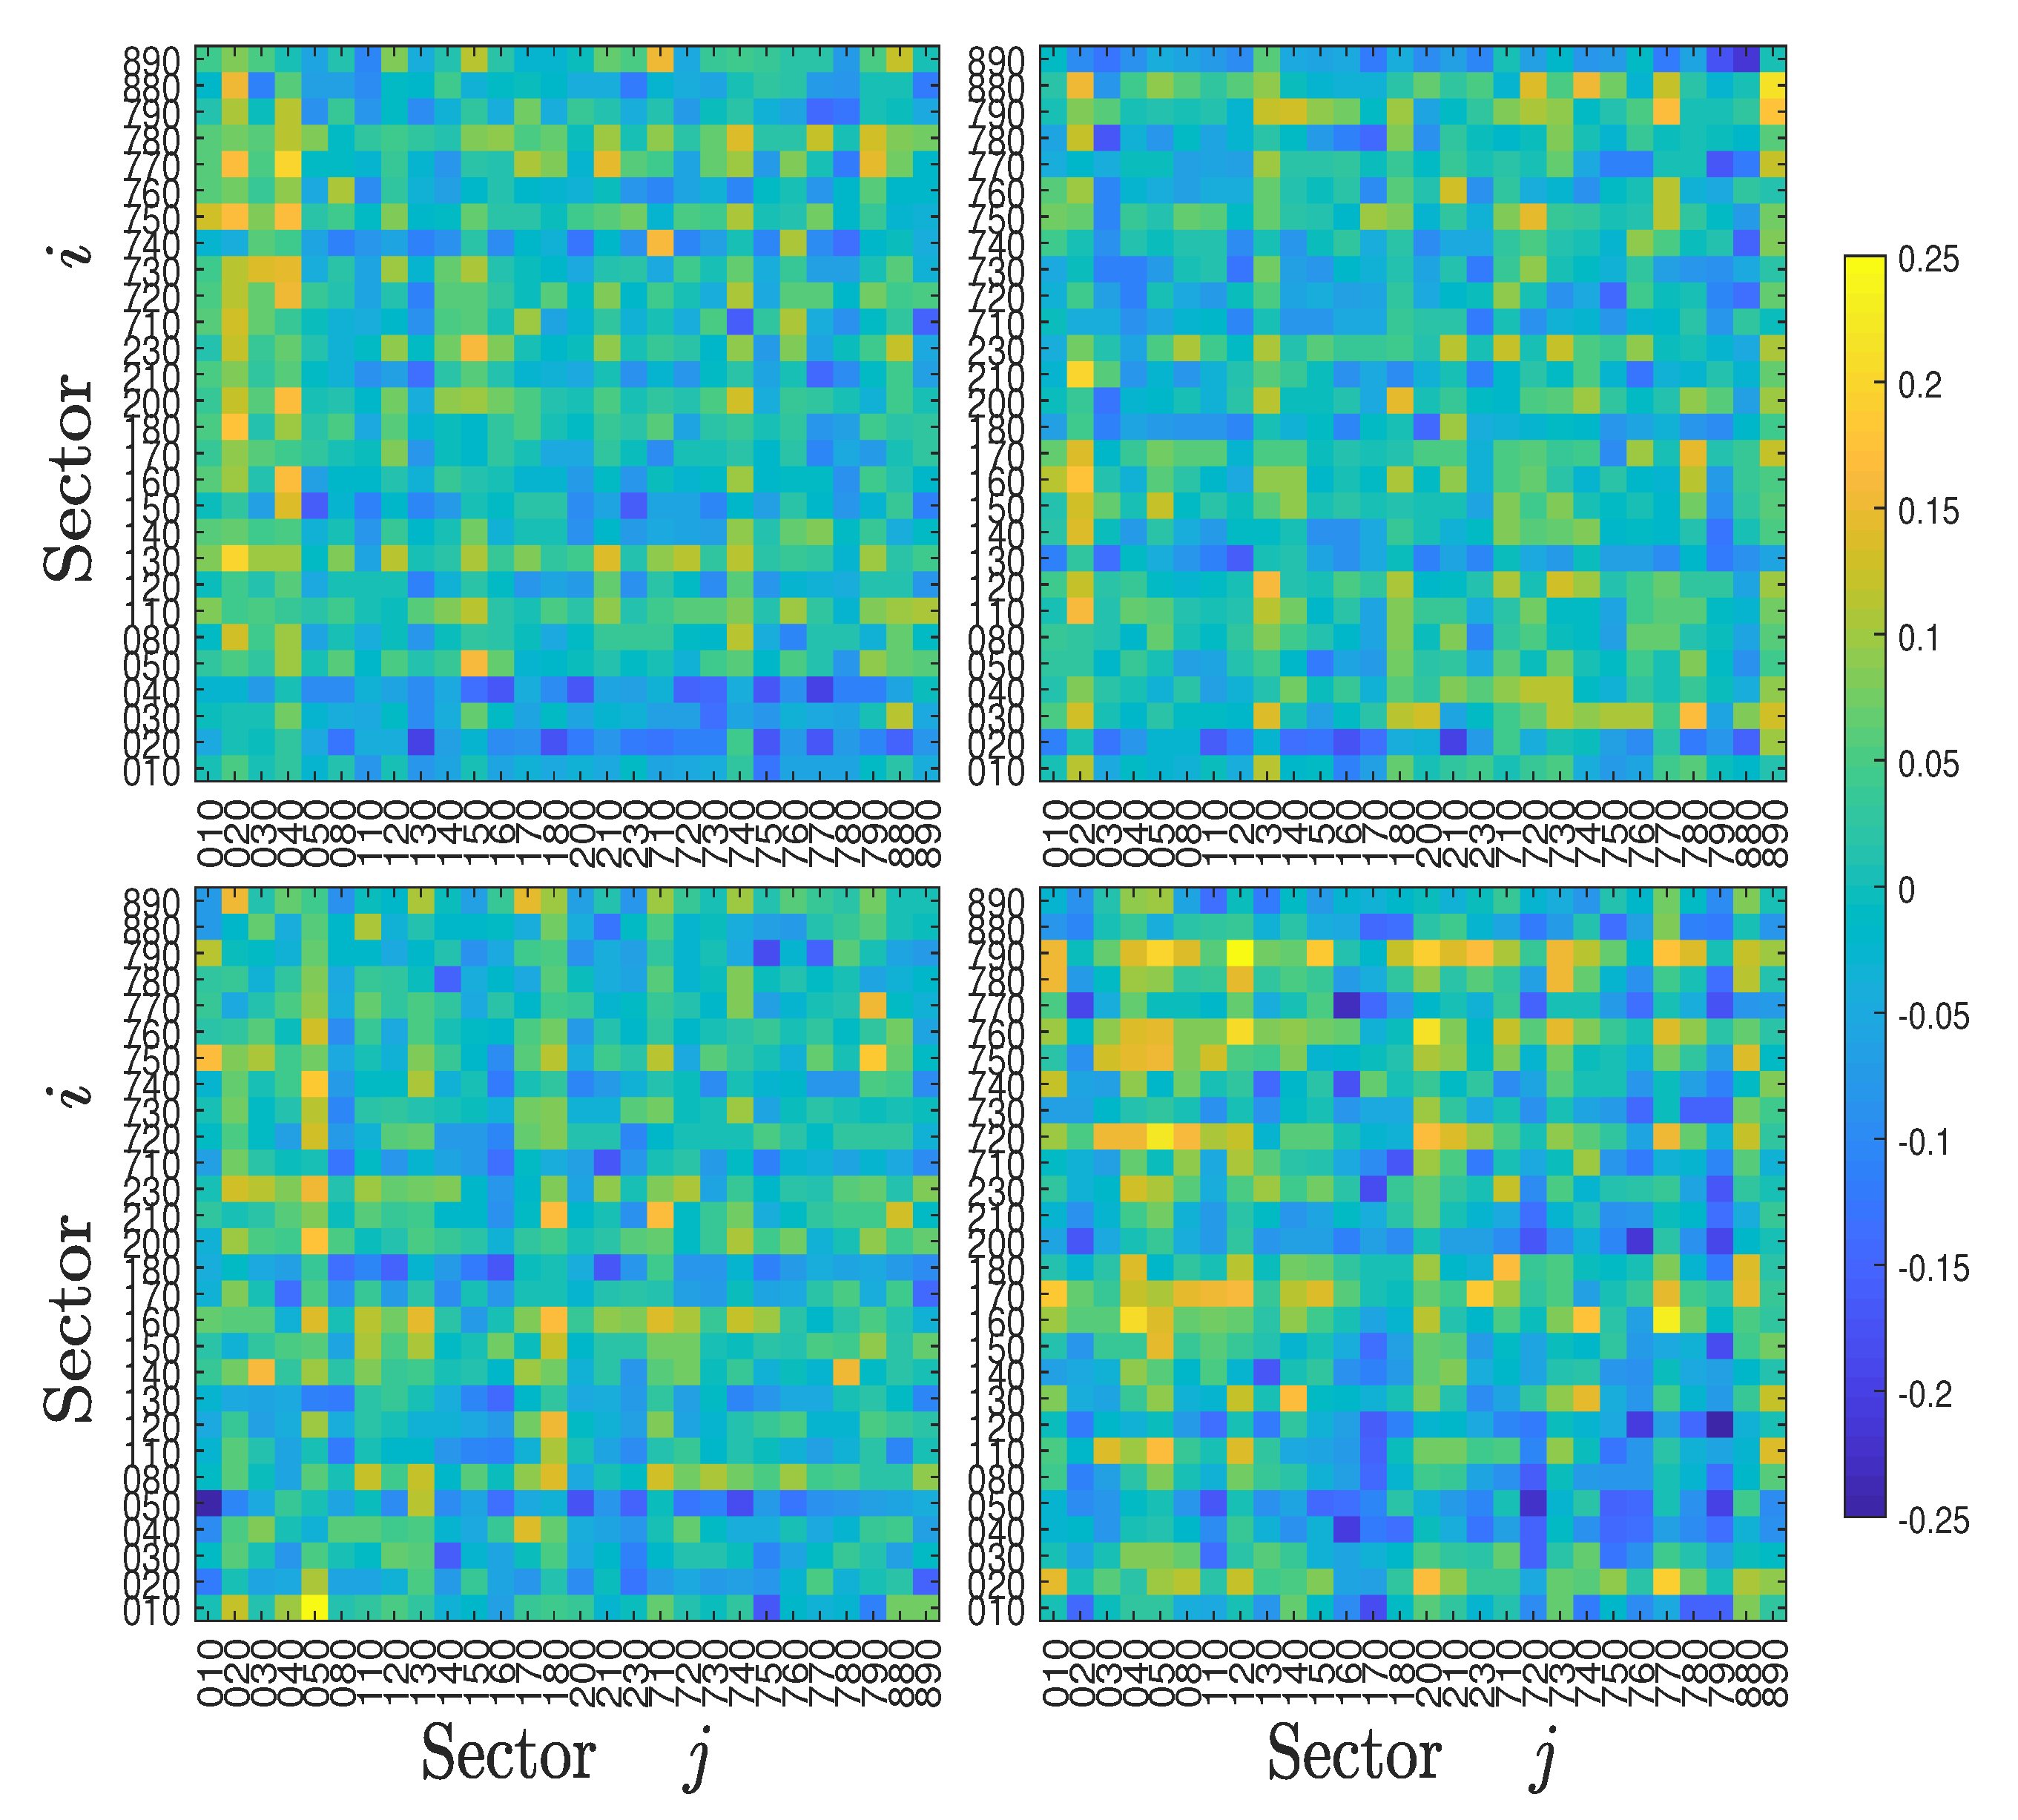
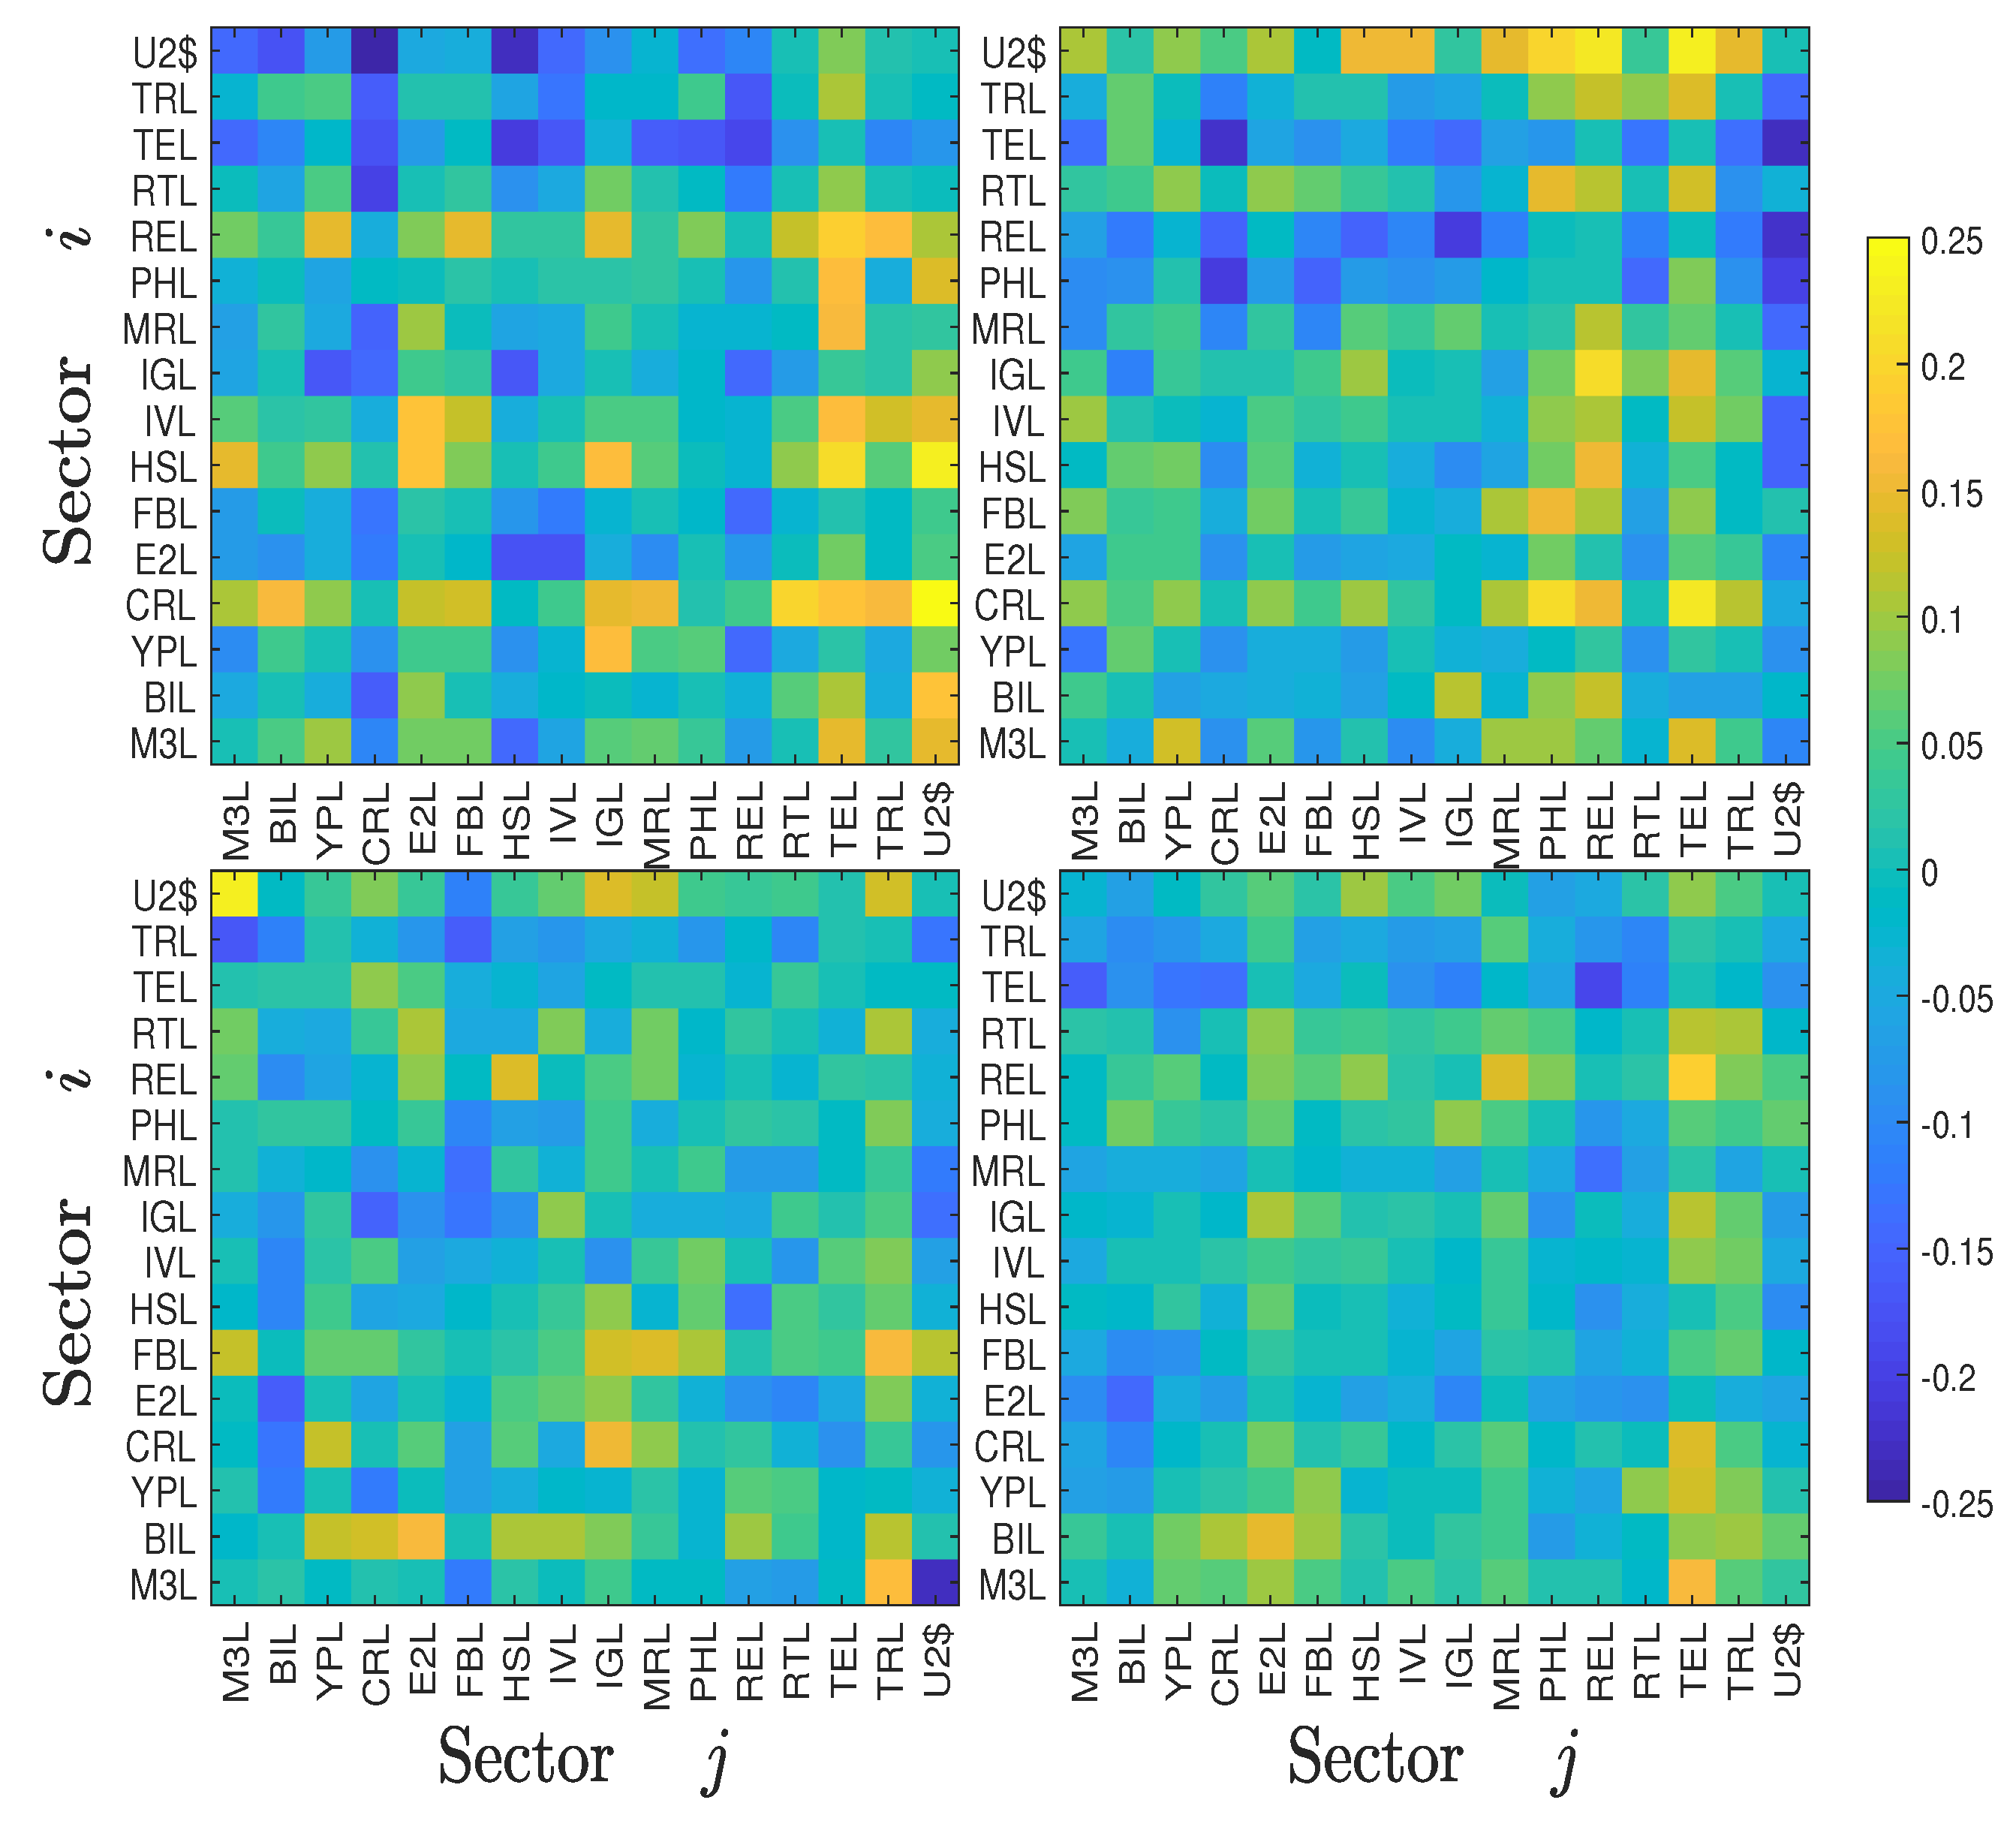
3.2. Average Inflow and Outflow

For each sector i, the average outflow F out , i and inflow F in , i of information can be calculated as follows [30]:
F out , i = 1 n 1 p i T i p S
and
F in , i = 1 n 1 p i T p i S ,
where the points with i = j are not included. Figure 2a,c show the bar charts of the average information inflows and outflows for all the sectors. This figure confirms that the non-bank financial sector (code 790) and the technology sector (code TEL) were the most active sectors in information exchange, respectively. We also find that the more information a sector sends out to other sectors, the more information it receives from others generally. Therefore, the outflow and inflow are positively related to each other. We present in Figure 2b,d the scatter plot of F out , i against F in , i , which confirms a significant positive correlation. The least-squares regression results in the following linear relationship for the Chinese market are as follows:
F out , i = 0.724 F in , i + 0.037 ,
where the p-values of the two coefficients are respectively 3 × 10 15 and 2 × 10 6 and the adjusted R 2 is 0.908. Similarly, for the USA market we have
F out , i = 0.291 F in , i + 0.046 ,
where the p-values of the two coefficients are 6 × 10 4 and 5 × 10 8 , respectively, and the adjusted R 2 is 0.548. It is clear from this simple estimation that the linear relationship is more significant for the Chinese stock market. We argue that the linearity reflects the degree of traders’ actions on the idiosyncratic traits of market sectors. The higher linearity of the Chinese stock market implies that the traders in the Chinese market are more irrational, such that their behavior is less reflected in the idiosyncratic traits of market sectors in their decision-making process.
We also use the average degree of asymmetric information flow Δ F i to measure the net information of sector i being sent to other sectors, which is defined as follows [30]:
Δ F i = F out , i F in , i .
We illustrate in Figure 3 the average degree of asymmetric information flow Δ F of the sectors in descending order for the two stock markets.
Among all the 28 Chinese sectors, the bank sector (code 780) has the highest Δ F value, while the Δ F value of the non-bank financial sector is the lowest. This finding suggests that the bank sector has the highest net outflow of information and is thus the most influential sector, while the non-bank financial sector is the most influenced sector. If we regard the Chinese stock market as an information transfer system, the bank sector is a big information source, influencing other sectors, while the non-bank financial sector is a big information sink, influenced by other sectors. Concerning the absolute Δ F value, we find that the biotechnology (code 150) is the closest one to zero, which indicates that the strength of information outflows and inflows are approximately equal and there is little net information transferred between the biotechnology sector and the whole market.
Among all the 16 US sectors, the energy sector (code E2L) has the highest Δ F value, while the Δ F value of the technology sector (code TEL) is the lowest. This suggests that the energy sector has the highest net outflow of information and is thus the most influential sector, while the technology sector is the most influenced sector. Therefore, the energy sector is a big information source, influencing other sectors, while the technology sector is a big information sink, influenced by other sectors. When we consider the absolute Δ F value, we find that the appliances sector (code M3L) is the closest one to zero, which indicates that the strength of information outflows and inflows are approximately equal and there is little net information transferred between the appliances sector and the whole market.
Although the sectors in both markets are similar, they play different roles in the two information transfer processes. For instance, the real estate sector is an information sink in the Chinese market but an information source in the US market. These results highlight the importance of the real estate sector in driving economic output in China and its less significant role in the US.

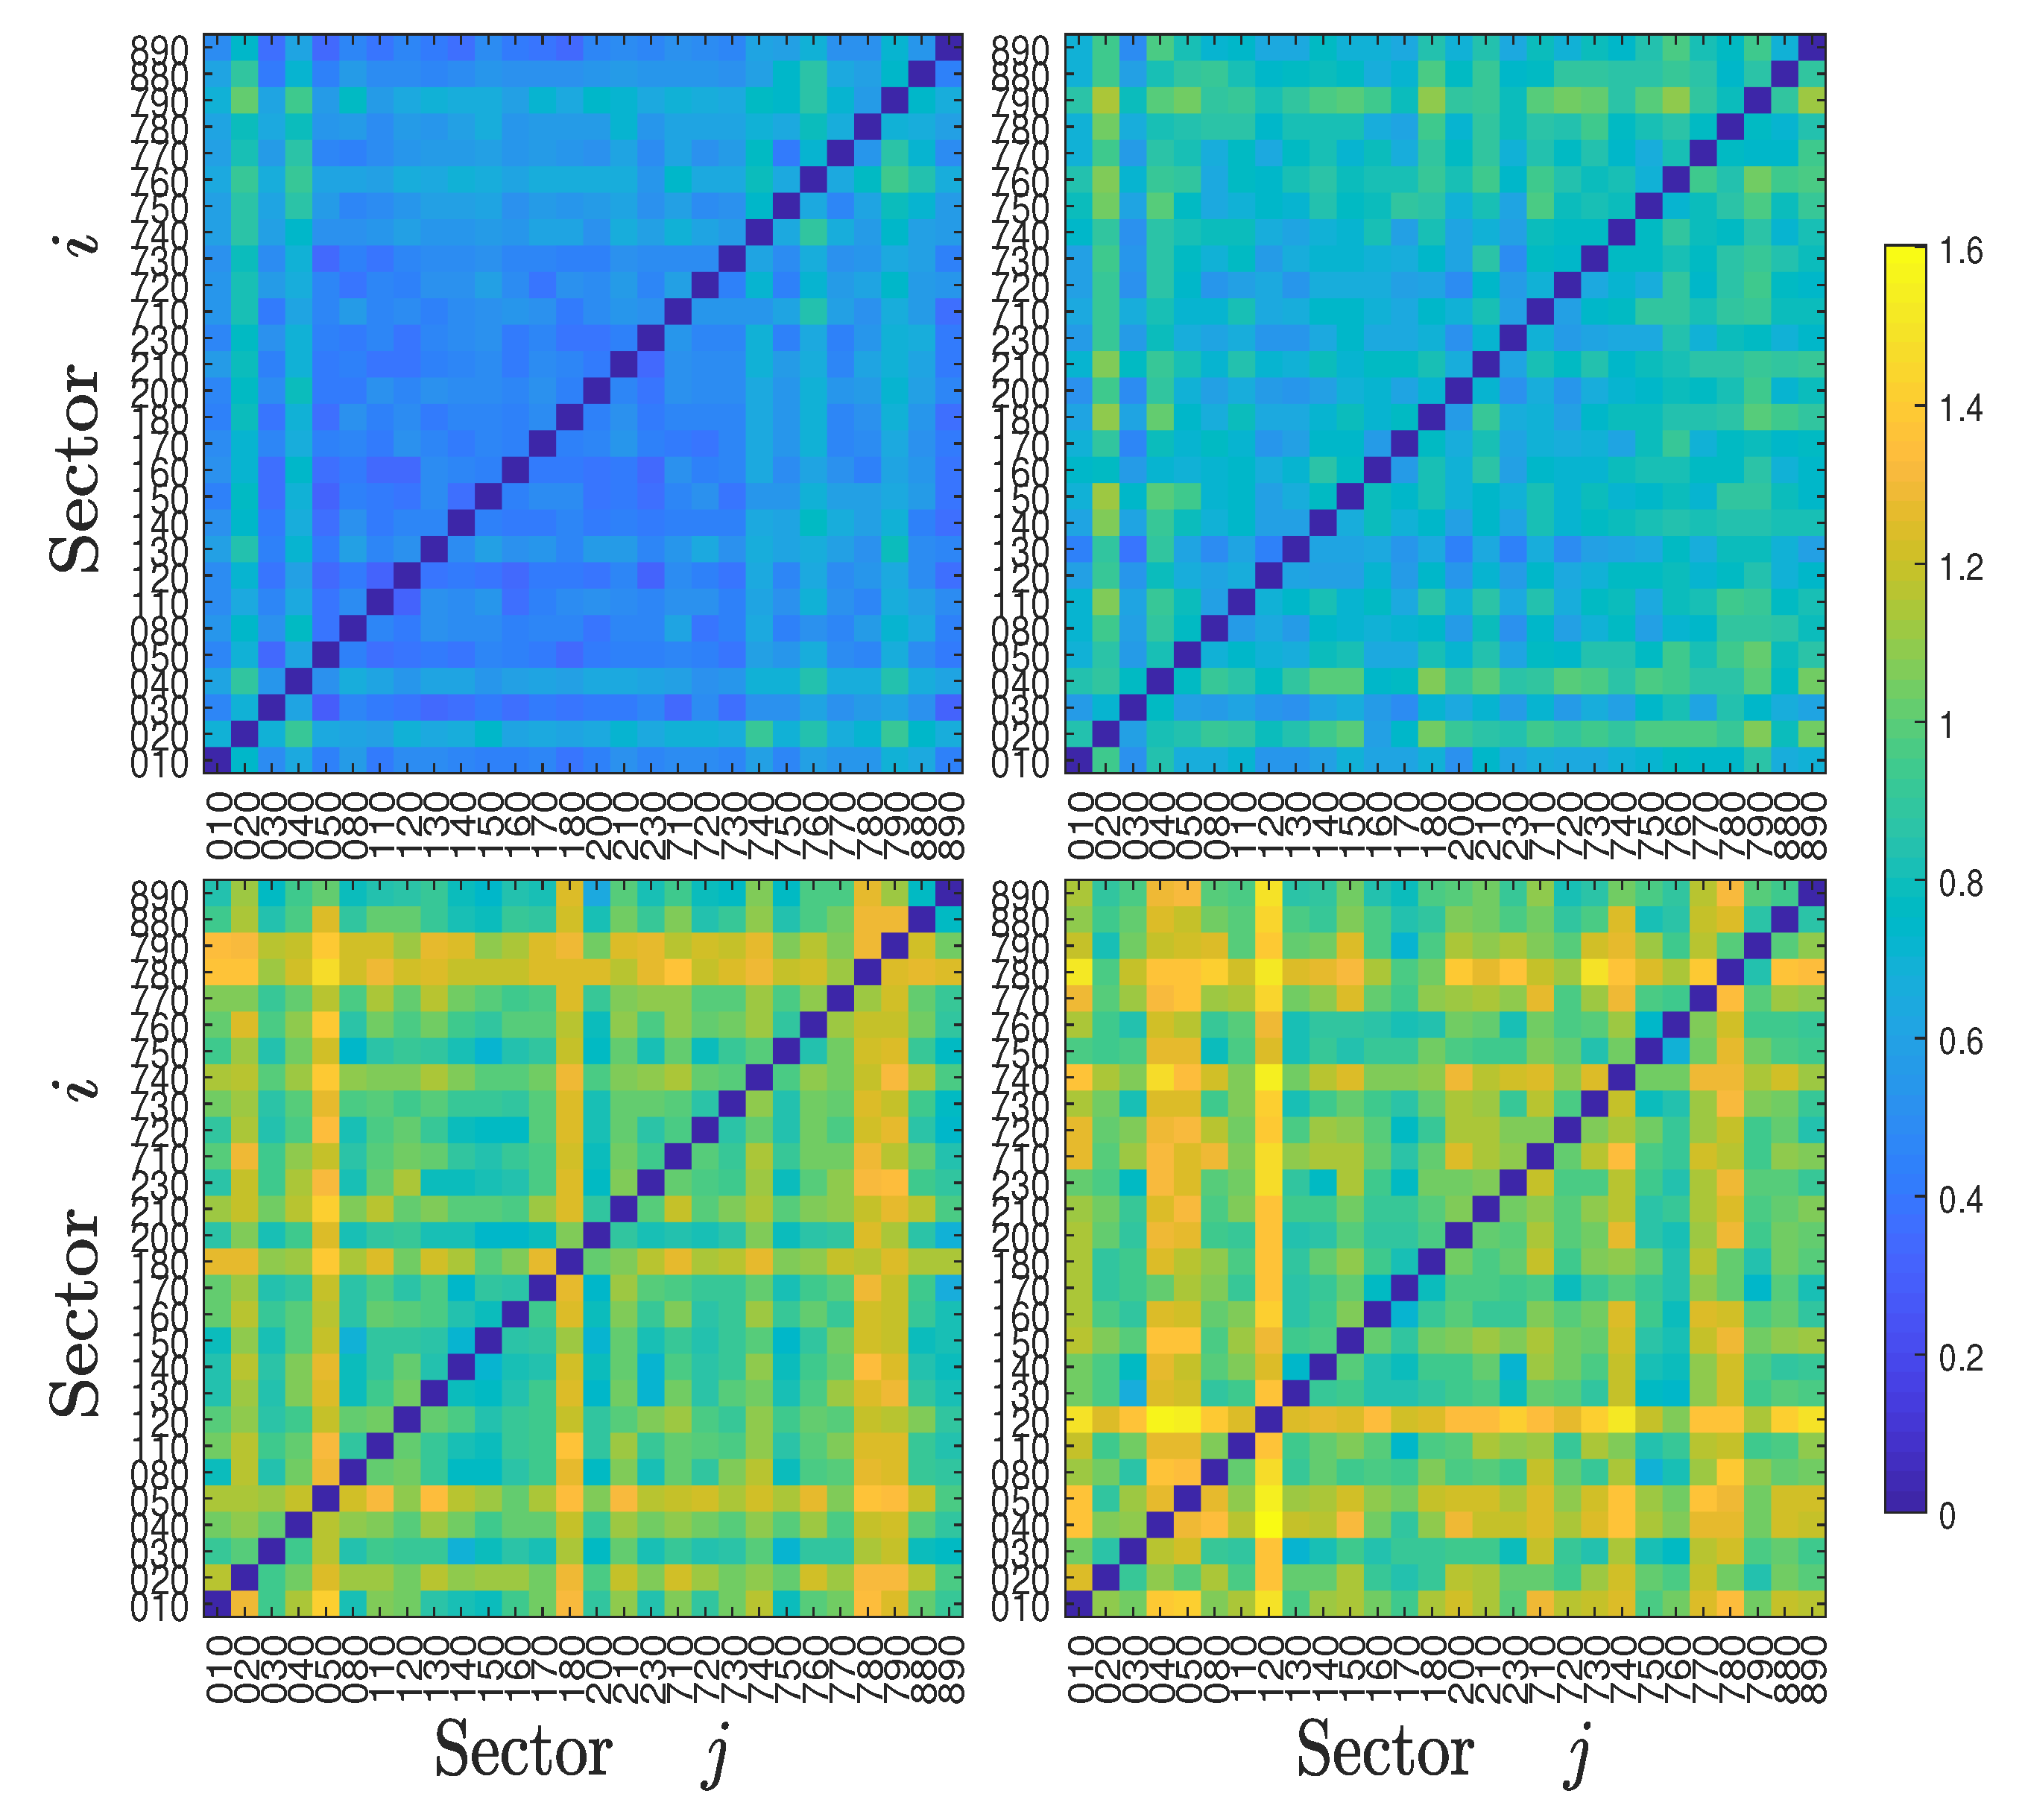
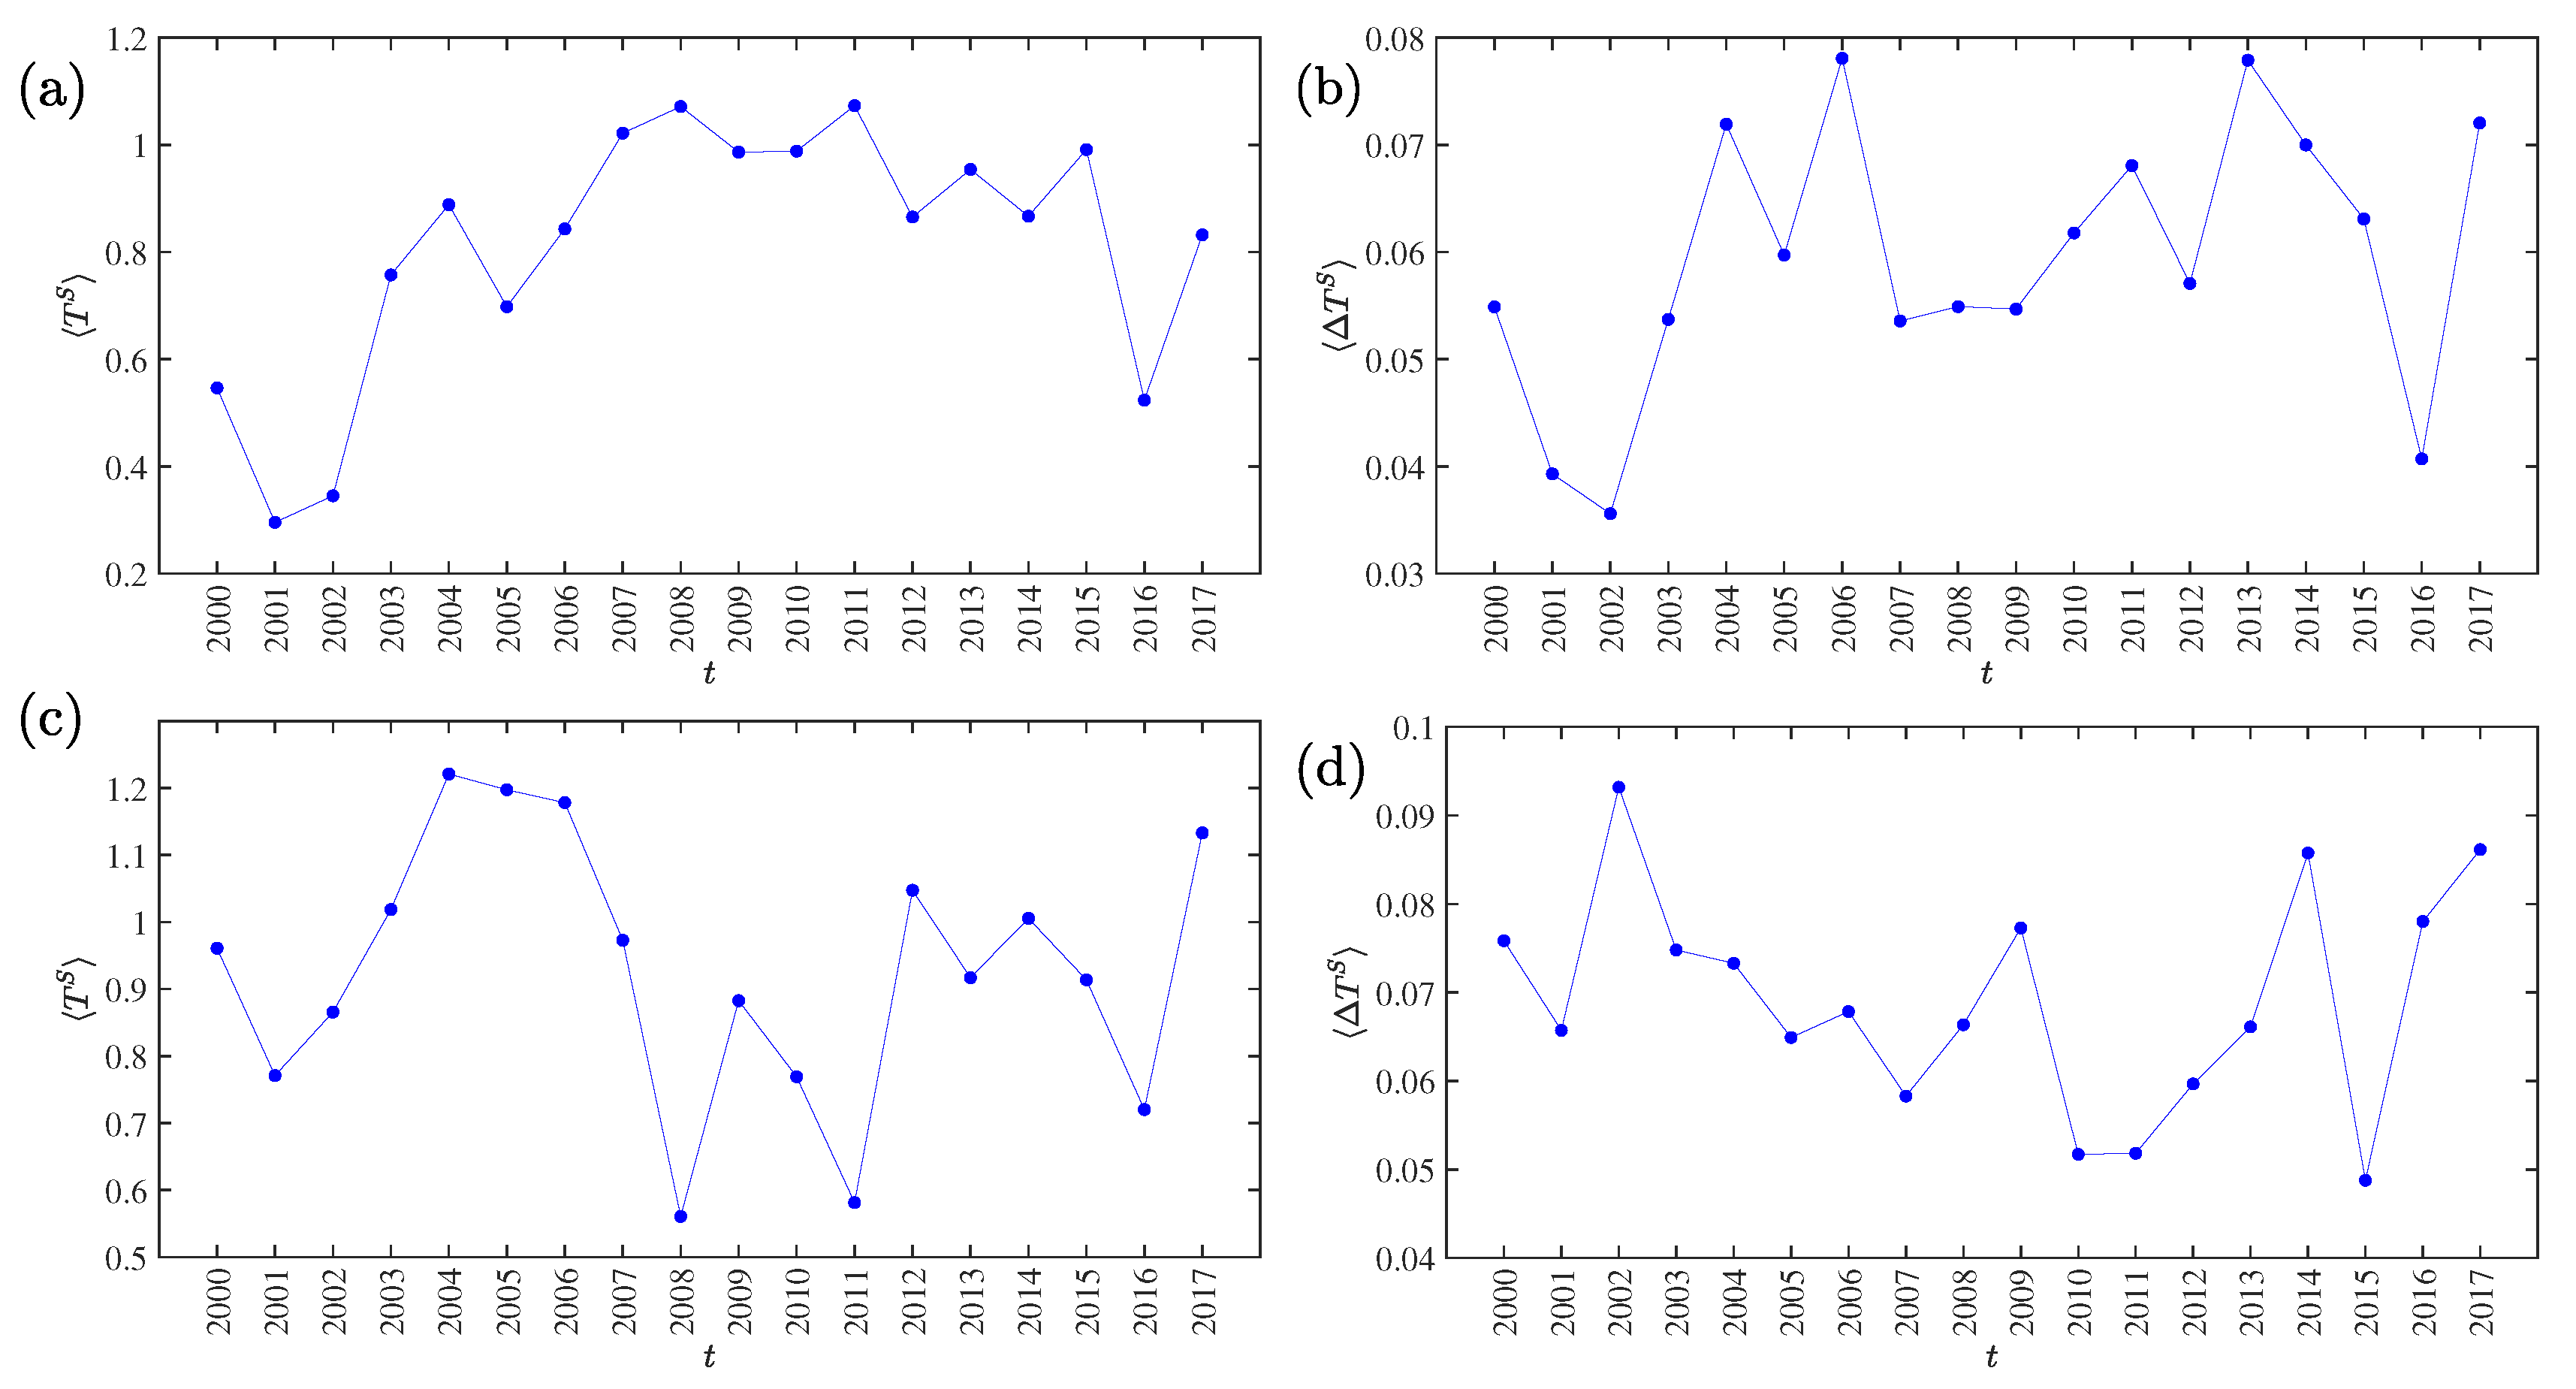
3.3. Yearly Evolution of Symbolic Transfer Entropy and Degree of Asymmetric Information Flow

Economic sectoral relationships are known to be unstable and change over time. For example, Bernanke (2016) highlighted the changing correlation between the energy and industrial sectors in the US over the last decade. To qualify the evolution of information flows over time, we calculated the symbolic transfer entropy matrix T S ( t ) and the asymmetric average information flow Δ T S ( t ) for each year t. The four T S ( t ) heat maps of the Chinese stock market for years 2000, 2003, 2007, and 2011 are illustrated in Figure 4, and the four T S ( t ) heat maps of the US stock market for years 2000, 2003, 2007, and 2011 are illustrated in Figure 5, respectively. For the Chinese stock market, it is found that the heat maps share some pattern of similarity. For instance, some relative bright lines emerge vertically and horizontally, echoing the pattern in Figure 4. However, these heat maps also exhibit remarkable differences. The most significant feature is that the heat maps become brighter over time, indicating that there are more information transfers among different sectors with the development of the stock market. The corresponding four heat maps of the asymmetric information flow Δ T S ( t ) are shown in Figure 6. A similar evolution of patterns is observed in the US stock markets, which is shown in Figure 5 and Figure 7. However, we do not observe a monotonic increase in information flows among the US sectors, in which the information flows among sectors were smaller in 2011.
To further quantify the evolution of information flows, we calculated the average of the symbolic transfer entropy matrix T S ( t ) for each year t as follows:
T S ( t ) = 1 n ( n 1 ) i j T i j S ( t ) ,
where the diagonal with i = j is not included, and the average asymmetric information flow Δ T S ( t ) for each year t is measured as follows:
Δ T S ( t ) = 2 n ( n 1 ) i = 1 n j = 1 i | Δ T i j S ( t ) | ,
where the lower triangle (i.e., the part with i j ) is not included. We note that there are no objective criteria to determine the window size. Too long windows will result in too few data points and vague evolution paths, while too short windows lead to less statistics and more noise [33]. The choice of one year is a trade-off.
The evolutionary trajectories of the average symbolic transfer entropy T S ( t ) and the average asymmetric information flow Δ T S ( t ) from 2000 to 2017 of the Chinese stock market are presented in Figure 8a,b, respectively, while the results for the US stock market are presented in Figure 8c,d. For the Chinese stock market, we observe two local minima around 2001 and 2016 for T S ( t ) and three local minima around 2001, 2008, and 2016 for Δ T S ( t ) . This observation is of particular interest, because the three periods correspond to key periods of market volatility associated with the market crashes in June 2001 [34], December 2007 [35], June 2009 [35], June 2015 [36], and January 2006 [37]. For the US stock market, we observe four local minima around 2001, 2008, 2011, and 2016 for T S ( t ) and three local minima around 2001, 2011, and 2015 for Δ T S ( t ) , which correspond to the 9/11 terrorist attack in 2001 [38], the subprime mortgage crisis in 2007 [39], the July–August 2011 stock market crash [40], and the 2015–16 stock market selloff beginning in the United States on 18 August 2015. It is documented for other types of networks that the structure of networks usually changes around large market movements (see [41] and the references therein).
We conclude that, during market turmoil periods, both the average information transfer and the average asymmetric information flow are lower than in stable states. This conclusion is not surprising. During bubbles and antibubbles, investors exhibit stronger convergence in decision making. The majority of investors buy stocks during bubbles and sell stocks during antibubbles. Although stock markets have higher volatility during periods of turmoil, investors’ actions are more synchronized. In other words, stock markets are more integrated during periods of turmoil than during periods of stability.

4. Conclusions

In this work, we compared the information transfer between industry sectors in the Chinese and US stock markets based on their symbolic transfer entropy. We used daily returns of key sector indices from 2000 to 2017. The results of this work offer several important insights into information flows between industry sectors. First, we find that the most active sector in information exchange is the non-bank financial sector in the Chinese market and the technology sector in the US market. Second, concerning the net information flow of individual sectors, we find that the main information source is the bank sector in the Chinese market and the energy sector in the US market, while the information sink is the non-bank financial in the Chinese market and the technology sector in the US market. The two information sinks with the largest net information inflow in the two markets are exactly the two most active sectors with the largest information transfer. Third, the same sector may play different roles in the two markets. For example, the real estate sector is an information sink in the Chinese market but an information source in the US market. Thus, the US stock market is expected to react to demand related to news originating from the housing sector, such as building approvals, whereas in China this is not the case since the markets are driven by supply side factors such as changes in bank lending.
We also investigated the evolution of the yearly information transfer for both markets. It is found that the local minima of the average symbolic transfer entropy T S ( t ) and the average asymmetric information flow Δ T S ( t ) correspond to periods of market turmoil. We argue that stock markets are more integrated during periods of turmoil than in stable periods, which results in smaller entropy.
Note that while there have been several studies that use entropy-based techniques to predict market fluctuations and crashes [42,43,44,45,46,47] or measures [48,49,50], in this study we argue that the average symbolic transfer entropy T S ( t ) and the average asymmetric information flow Δ T S ( t ) do not have a direct predictive power for market crashes. Further research is required to better understand the dynamics of market crashes, which are likely not driven by historical correlations but rather by behavioral factors.

Author Contributions

Data curation, P.Y.; Formal analysis, P.Y.; Investigation, P.Y., Y.F., J.A.B. and W.-X.Z.; Methodology, P.Y.; Supervision, W.-X.Z.; Writing—original draft, P.Y.; Writing—review & editing, Y.F., J.A.B. and W.-X.Z. All authors have read and agreed to the published version of the manuscript.

Funding

This work was partly supported by the National Natural Science Foundation of China (U1811462, 71532009), the Shanghai Philosophy and Social Science Fund Project (2017BJB006), the Program of Shanghai Young Top-notch Talent (2018), and the Fundamental Research Funds for the Central Universities.

Conflicts of Interest

The authors declare no conflict of interest.

References

  1. Mantegna, R.N.; Stanley, H.E. An Introduction to Econophysics: Correlations and Complexity in Finance; Cambridge University Press: Cambridge, UK, 2000. [Google Scholar]
  2. Zhang, Z.C.; Zhang, Y.J.; Shen, D.H.; Zhang, W. The dynamic cross-correlations between mass media news, new media news, and stock returns. Complexity 2018, 2018, 7619494. [Google Scholar] [CrossRef] [Green Version]
  3. Shan, J.; Pappas, N. The relative impacts of Japanese and US interest rates on local interest rates in Australia and Singapore: A Granger causality test. Appl. Financ. Econ. 2000, 10, 291–298. [Google Scholar] [CrossRef]
  4. Sornette, D.; Zhou, W.X. Non-parametric determination of real-time lag structure between two time series: The “optimal thermal causal path” method. Quant. Financ. 2005, 5, 577–591. [Google Scholar] [CrossRef]
  5. Meng, H.; Xu, H.C.; Zhou, W.X.; Sornette, D. Symmetric thermal optimal path and time-dependent lead-lag relationship: Novel statistical tests and application to UK and US real-estate and monetary policies. Quant. Financ. 2017, 17, 959–977. [Google Scholar] [CrossRef] [Green Version]
  6. Xu, H.C.; Zhou, W.X.; Sornette, D. Time-dependent lead-lag relationship between the onshore and offshore Renminbi exchange rates. J. Int. Financ. Mark. Inst. Money 2017, 49, 173–183. [Google Scholar] [CrossRef] [Green Version]
  7. Dionisio, A.; Menezes, R.; Mendes, D.A. Mutual information: a measure of dependency for nonlinear time series. Physica A 2004, 344, 326–329. [Google Scholar] [CrossRef]
  8. Abigail, J. A complex network model for seismicity based on mutual information. Physica A 2013, 392, 2498–2506. [Google Scholar] [CrossRef]
  9. Fiedor, P. Networks in financial markets based on the mutual information rate. Phys. Rev. E 2014, 89, 052801. [Google Scholar] [CrossRef] [Green Version]
  10. Ghysels, E.; Hill, J.B.; Motegi, K. Testing for Granger causality with mixed frequency data. J. Econom. 2016, 192, 207–230. [Google Scholar] [CrossRef]
  11. Gotz, T.B.; Hecq, A.; Smeekes, S. Testing for Granger causality in large mixed-frequency VARs. J. Econom. 2016, 193, 418–432. [Google Scholar] [CrossRef] [Green Version]
  12. Barnett, L.; Bossomaier, T. Transfer entropy as a log-likelihood ratio. Phys. Rev. Lett. 2012, 109, 138105. [Google Scholar] [CrossRef] [PubMed] [Green Version]
  13. Schreiber, T. Measuring information transfer. Phys. Rev. Lett. 2000, 85, 461–464. [Google Scholar] [CrossRef] [PubMed] [Green Version]
  14. Ai, X.B. Inferring a drive-response network from time series of topological measures in complex networks with transfer entropy. Entropy 2014, 16, 5753–5776. [Google Scholar] [CrossRef] [Green Version]
  15. Hu, Y.Z.; Zhao, H.Y.; Ai, X.B. Inferring weighted directed association networks from multivariate time series with the small-shuffle symbolic transfer entropy spectrum method. Entropy 2016, 18, 328. [Google Scholar] [CrossRef]
  16. Yook, S.H.; Chae, H.; Kim, J.; Kim, Y. Finding modules and hierarchy in weighted financial network using transfer entropy. Physica A 2016, 447, 493–501. [Google Scholar] [CrossRef]
  17. Borge-Holthoefer, J.; Peera, N.; Goncalves, B.; Gonzalez-Bailon, S.; Arenas, A.; Moreno, Y.; Vespignani, A. The dynamics of information-driven coordination phenomena: A transfer entropy analysis. Sci. Adv. 2016, 2, e1501158. [Google Scholar] [CrossRef] [Green Version]
  18. Zhang, N.N.; Lin, A.J.; Shang, P.J. Multiscale symbolic phase transfer entropy in financial time series classification. Fluct. Noise Lett. 2017, 16, 1750019. [Google Scholar] [CrossRef]
  19. Toriumi, F.; Komura, K. Investment index construction from information propagation based on transfer entropy. Comput. Econ. 2018, 51, 159–172. [Google Scholar] [CrossRef]
  20. Servadio, J.L.; Convertino, M. Optimal information networks: Application for data-driven integrated health in populations. Sci. Adv. 2018, 4, e1701088. [Google Scholar] [CrossRef] [Green Version]
  21. Zhang, Y.P.; Shang, P.J.; Xiong, H.; Xia, J.A. Multiscale analysis of time irreversibility based on phase-space reconstruction and horizontal visibility graph approach. Fluct. Noise Lett. 2018, 17, 1850006. [Google Scholar] [CrossRef] [Green Version]
  22. He, J.Y.; Shang, P.J. Comparison of transfer entropy methods for financial time series. Physica A 2017, 482, 772–785. [Google Scholar] [CrossRef]
  23. Staniek, M.; Lehnertz, K. Symbolic transfer entropy. Phys. Rev. Lett. 2008, 100, 158101. [Google Scholar] [CrossRef] [PubMed]
  24. Marschinski, R.; Kantz, H. Analysing the information flow between financial time series. Eur. Phys. J. B 2002, 30, 275–281. [Google Scholar] [CrossRef]
  25. Mao, X.G.; Shang, P.J. Transfer entropy between multivariate time series. Commun. Nonlinear Sci. Numer. Simul. 2017, 47, 338–347. [Google Scholar] [CrossRef]
  26. Dimpfl, T.; Peter, F.J. Using transfer entropy to measure information flows between financial markets. Stud. Nonlinear Dyn. Econom. 2013, 17, 85–102. [Google Scholar] [CrossRef] [Green Version]
  27. Kwon, O.; Yang, J.S. Information flow between stock indices. EPL (Europhys. Lett.) 2008, 82, 68003. [Google Scholar] [CrossRef] [Green Version]
  28. Kwon, O.; Yang, J.S. Information flow between composite stock index and individual stocks. Physica A 2008, 387, 2851–2856. [Google Scholar] [CrossRef] [Green Version]
  29. Kwon, O.; Oh, G. Asymmetric information flow between market index and individual stocks in several stock markets. EPL (Europhys. Lett.) 2012, 97, 28007. [Google Scholar] [CrossRef]
  30. Oh, G.; Oh, T.; Kim, H.Y.; Kwon, O. An information flow among industry sectors in the Korean stock market. J. Korean Phys. Soc. 2014, 65, 2140–2146. [Google Scholar] [CrossRef]
  31. Leibon, G.; Pauls, S.; Rockmore, D.; Savell, R. Topological structures in the equities market network. Proc. Natl. Acad. Sci. USA 2008, 105, 20589–20594. [Google Scholar] [CrossRef] [Green Version]
  32. Sandoval, L., Jr. Structure of a global network of financial companies based on transfer entropy. Entropy 2014, 16, 4443–4482. [Google Scholar] [CrossRef]
  33. Song, D.M.; Tumminello, M.; Zhou, W.X.; Mantegna, R.N. Evolution of worldwide stock markets, correlation structure, and correlation-based graphs. Phys. Rev. E 2011, 84, 026108. [Google Scholar] [CrossRef] [PubMed] [Green Version]
  34. Zhou, W.X.; Sornette, D. Antibubble and prediction of China’s stock market and real-estate. Physica A 2004, 337, 243–268. [Google Scholar] [CrossRef] [Green Version]
  35. Jiang, Z.Q.; Zhou, W.X.; Sornette, D.; Woodard, R.; Bastiaensen, K.; Cauwels, P. Bubble diagnosis and prediction of the 2005-2007 and 2008-2009 Chinese stock market bubbles. J. Econ. Behav. Org. 2010, 74, 149–162. [Google Scholar] [CrossRef] [Green Version]
  36. Sornette, D.; Demos, G.; Zhang, Q.; Cauwels, P.; Filimonov, V.; Zhang, Q.Z. Real-time prediction and post-mortem analysis of the Shanghai 2015 stock market bubble and crash. J. Investig. Strateg. 2015, 4, 77–95. [Google Scholar] [CrossRef]
  37. Wei, L.J.; Zhang, W.; Xiong, X. The mechanism and solution for the liquidity stampede crisis in stock markets. J. Manag. Sci. China 2017, 13, 1–23. (In Chinese) [Google Scholar]
  38. Charles, A.; Darne, O. Large shocks and the September 11th terrorist attacks on international stock markets. Econ. Model. 2006, 23, 683–698. [Google Scholar] [CrossRef]
  39. Demyanyk, Y.; Hemert, O.V. Understanding the subprime mortgage crisis. Rev. Financ. Stud. 2011, 24, 1848–1880. [Google Scholar] [CrossRef]
  40. Jayech, S. The contagion channels of July-August-2011 stock market crash: A DAG-copula based approach. Eur. J. Oper. Res. 2016, 249, 631–646. [Google Scholar] [CrossRef]
  41. Han, R.Q.; Xie, W.J.; Xiong, X.; Zhang, W.; Zhou, W.X. Market correlation structure changes around the Great Crash: A random matrix theory analysis of the Chinese stock market. Fluct. Noise Lett. 2017, 16, 1750018. [Google Scholar] [CrossRef] [Green Version]
  42. Maasoumi, E.; Racine, J. Entropy and predictability of stock market returns. J. Econom. 2002, 107, 291–312. [Google Scholar] [CrossRef]
  43. Eom, C.; Oh, G.; Jung, W.S. Relationship between efficiency and predictability in stock price change. Physica A 2008, 387, 5511–5517. [Google Scholar] [CrossRef] [Green Version]
  44. Lahmiri, S. Entropy-based technical analysis indicators selection for international stock markets fluctuations prediction using support vector machines. Fluct. Noise Lett. 2014, 13, 1450013. [Google Scholar] [CrossRef]
  45. Zhou, R.X.; Zhan, Y.; Cai, R.; Tong, G.Q. A mean-variance hybrid-entropy model for portfolio selection with fuzzy returns. Entropy 2015, 17, 3319–3331. [Google Scholar] [CrossRef] [Green Version]
  46. Zou, Y.C.; Yu, L.A.; He, K.J. Wavelet entropy based analysis and forecasting of crude oil price dynamics. Entropy 2015, 17, 7167–7184. [Google Scholar] [CrossRef] [Green Version]
  47. Benedetto, F.; Giunta, G.; Mastroeni, L. On the predictability of energy commodity markets by an entropy-based computational method. Energy Econ. 2016, 54, 302–312. [Google Scholar] [CrossRef]
  48. Hou, Y.F.; Liu, F.Y.; Gao, J.B.; Cheng, C.X.; Song, C.Q. Characterizing complexity changes in Chinese stock markets by permutation entropy. Entropy 2017, 19, 514. [Google Scholar] [CrossRef] [Green Version]
  49. Gu, R.B. Multiscale Shannon entropy and its application in the stock market. Physica A 2017, 484, 215–224. [Google Scholar] [CrossRef]
  50. Begušić, S.; Kostanjćar, Z.; Kovač, D.; Stanley, H.E.; Podobnik, B. Information feedback in temporal networks as a predictor of market crashes. Complexity 2018, 2018, 2834680. [Google Scholar] [CrossRef]
Figure 1. Heat maps of the symbolic transfer entropy matrix T i , j S (left matrices) and the degree of asymmetric information flow Δ T i , j S (right matrices) between the 28 Chinese stock market sectors (2000-2017, top matrices) and the 16 USA stock market sectors (2000-2017, bottom matrices). To simplify the label, we use the last three digits of each 6-digit code to represent the corresponding Chinese stock market sector.
Entropy 22 00194 g001
Figure 2. Average outflow F out , i and inflow F in , i of information for stock market sectors. (a) Bar chart for the Chinese stock market. (b) Scatter plot for the Chinese stock market. (c) Bar chart for the USA stock market. (d) Scatter plot for the USA stock market.
Entropy 22 00194 g002
Figure 3. Degree of asymmetric information flow Δ F in descending order of industry sectors. (a) Chinese stock market sectors. (b) USA stock market sectors.
Entropy 22 00194 g003
Figure 4. Heat maps of the symbolic transfer entropy matrix T i , j S for four years (2000, 2003, 2007, and 2011) of the Chinese stock market.
Entropy 22 00194 g004
Figure 5. Heat maps of the symbolic transfer entropy matrix T i , j S for four years (2000, 2003, 2007, and 2011) of the USA stock market.
Entropy 22 00194 g005
Figure 6. Heat maps of the symbolic transfer entropy matrix Δ T i , j S for four years (2000, 2003, 2007, and 2011) of the Chinese stock market.
Entropy 22 00194 g006
Figure 7. Heat maps of the symbolic transfer entropy matrix Δ T i , j S for four years (2000, 2003, 2007, and 2011) of the USA stock market.
Entropy 22 00194 g007
Figure 8. (a) Evolution of the average symbolic transfer entropy T S ( t ) from 2000 to 2017 of the Chinese stock market. (b) Evolution of the average asymmetric information flow Δ T S ( t ) from 2000 to 2017 of the Chinese stock market. (c) Evolution of the average symbolic transfer entropy T S ( t ) from 2000 to 2017 of the USA stock market. (d) Evolution of the average asymmetric information flow Δ T S ( t ) from 2000 to 2017 of the USA stock market.
Entropy 22 00194 g008

