1. Introduction
The characteristics of a chaotic signal—such as noise-like obscurity, aperiodicity, thumbtack-like correlation, sensitivity to initial conditions and system parameters—enable a chaotic signal to be widely investigated in engineering applications. Specifically, the noise-like property that determines the chaotic signal involves a low probability of interception (LPI), which is essential for secure communication and radar applications.
In the last decade, a class of analytically solvable chaotic system (ASCS) was introduced [
1,
2,
3]. ASCS is defined by a second-order differential equation and a discrete switching condition controlled by binary symbols. The ASCS can be expressed analytically with an exact solution by solving the differential equation. It can also be described by a linear convolution with a fixed basis function and binary symbols. Due to the fixed shape of the basis function, a matched filter was then proposed to recover the binary symbols from the received signal [
4]. Experiment and analysis proved that its bit error rate (BER) performance is comparable to that of the binary phase-shift keying (BPSK). Moreover, the circuit implementation of ASCS and the corresponding matched-filter based detector were provided [
2]. For its excellent performance against noise and its simplicity in circuit realization, ASCS has been used in chaos communication [
5,
6,
7,
8,
9,
10,
11], chaos radar [
12,
13], and underwater ranging and navigation [
14]. Reference [
6] proved that the information encoded in the chaotic signal is kept after being transmitted through a wireless channel with multipath effects. In Reference [
8], an easy coding method was proposed to encode the information bits into the initial value of the ASCS oscillator. The application of ASCS to the wireless channel was analyzed and tested through a circuit implementation. In Reference [
9], a high-frequency reverse-time ASCS was successfully generated in an optical carrier, which is promising for optical secure communication. In Reference [
11], a resisting-multipath technique was proposed to tackle the inter-symbol interference caused by multipath. In Reference [
10], an underwater spread spectrum scheme based on ASCS was proposed to provide superior reliability and security compared with the conventional chaos direct spread spectrum system.
Although ASCS shows superior performance in communication and radar applications, the ASCS signal can be considered as simply a BPSK communication waveform with an unconventional basis function so that it has no inherent security. The dynamical characteristics and the exact solution of such a class of ASCS signal make it possible to incoherently recover the symbols conveyed in the chaotic signal even if it is severely contaminated by noise. In this paper, we propose an efficient method for estimating the frequency of ASCS, and for detecting the symbols encoded in the waveform. The system parameters of ASCS and the binary symbols encoded in the continuous chaotic waveform can be estimated directly from the received signal via a difference-integral (DI) detector. For a potential attacker, this method process requires only the knowledge of the form of ASCS, which is practical in implementation.
Based on the square power spectrum of the received signal, we first proposed a maximum likelihood estimator (MLE) to obtain the frequency parameter of the ASCS. For the symbol detection, we proposed a DI detector in which the binary symbols are retrieved by cumulatively summing the difference between the received signal and its time-delayed version. This detector requires no parameters of the transmitter other than the basis frequency, which can be estimated. The advantages of the proposed method are two-fold: first, it does not require prior knowledge at the transmitter other than the form of ASCS; second, although the error performance of the proposed symbol detector is around 1 dB worse than that of the coherent detector for ASCS, it provides a new tool for a potential adversary hoping to incoherently detect an ASCS signal.
The rest of this paper is organized as follows: In
Section 2, we provide a brief review of the system description and exact solution of ASCS. In
Section 3, the MLE based on the square power spectrum is proposed to estimate the basis frequency of ASCS. The performance of the estimator is also evaluated. In
Section 4, a DI detector is proposed with detailed theoretical derivations. In
Section 5, a closed-form expression for error probability in symbol detection is derived and verified through simulations. The robustness of the detector is also discussed. Finally, some conclusions are made in
Section 6.
2. The Analytically Solvable Chaotic System
The standard form of ASCS is described with a differential equation as [
1]
where
determines the symbol period as
and
is the damping coefficient of the linear part of ASCS system. The waveform
is continuous and state
is discrete. The state can be controlled by a binary symbol sequence
which is set as the sign of current
once the switching condition meets and is held constant until the next time when the switching condition triggers. The switching condition and state change process are described as
The chaotic signal
can be obtained by the numerical solution of the Equation (
1) with an adjustable step size Runge-Kutta integrator. Suppose the initial conditions are
and
, the exact analytic local solution of Equation (
1) for the segment of
is derived as
with the iteration relation
, where
n is an integer.
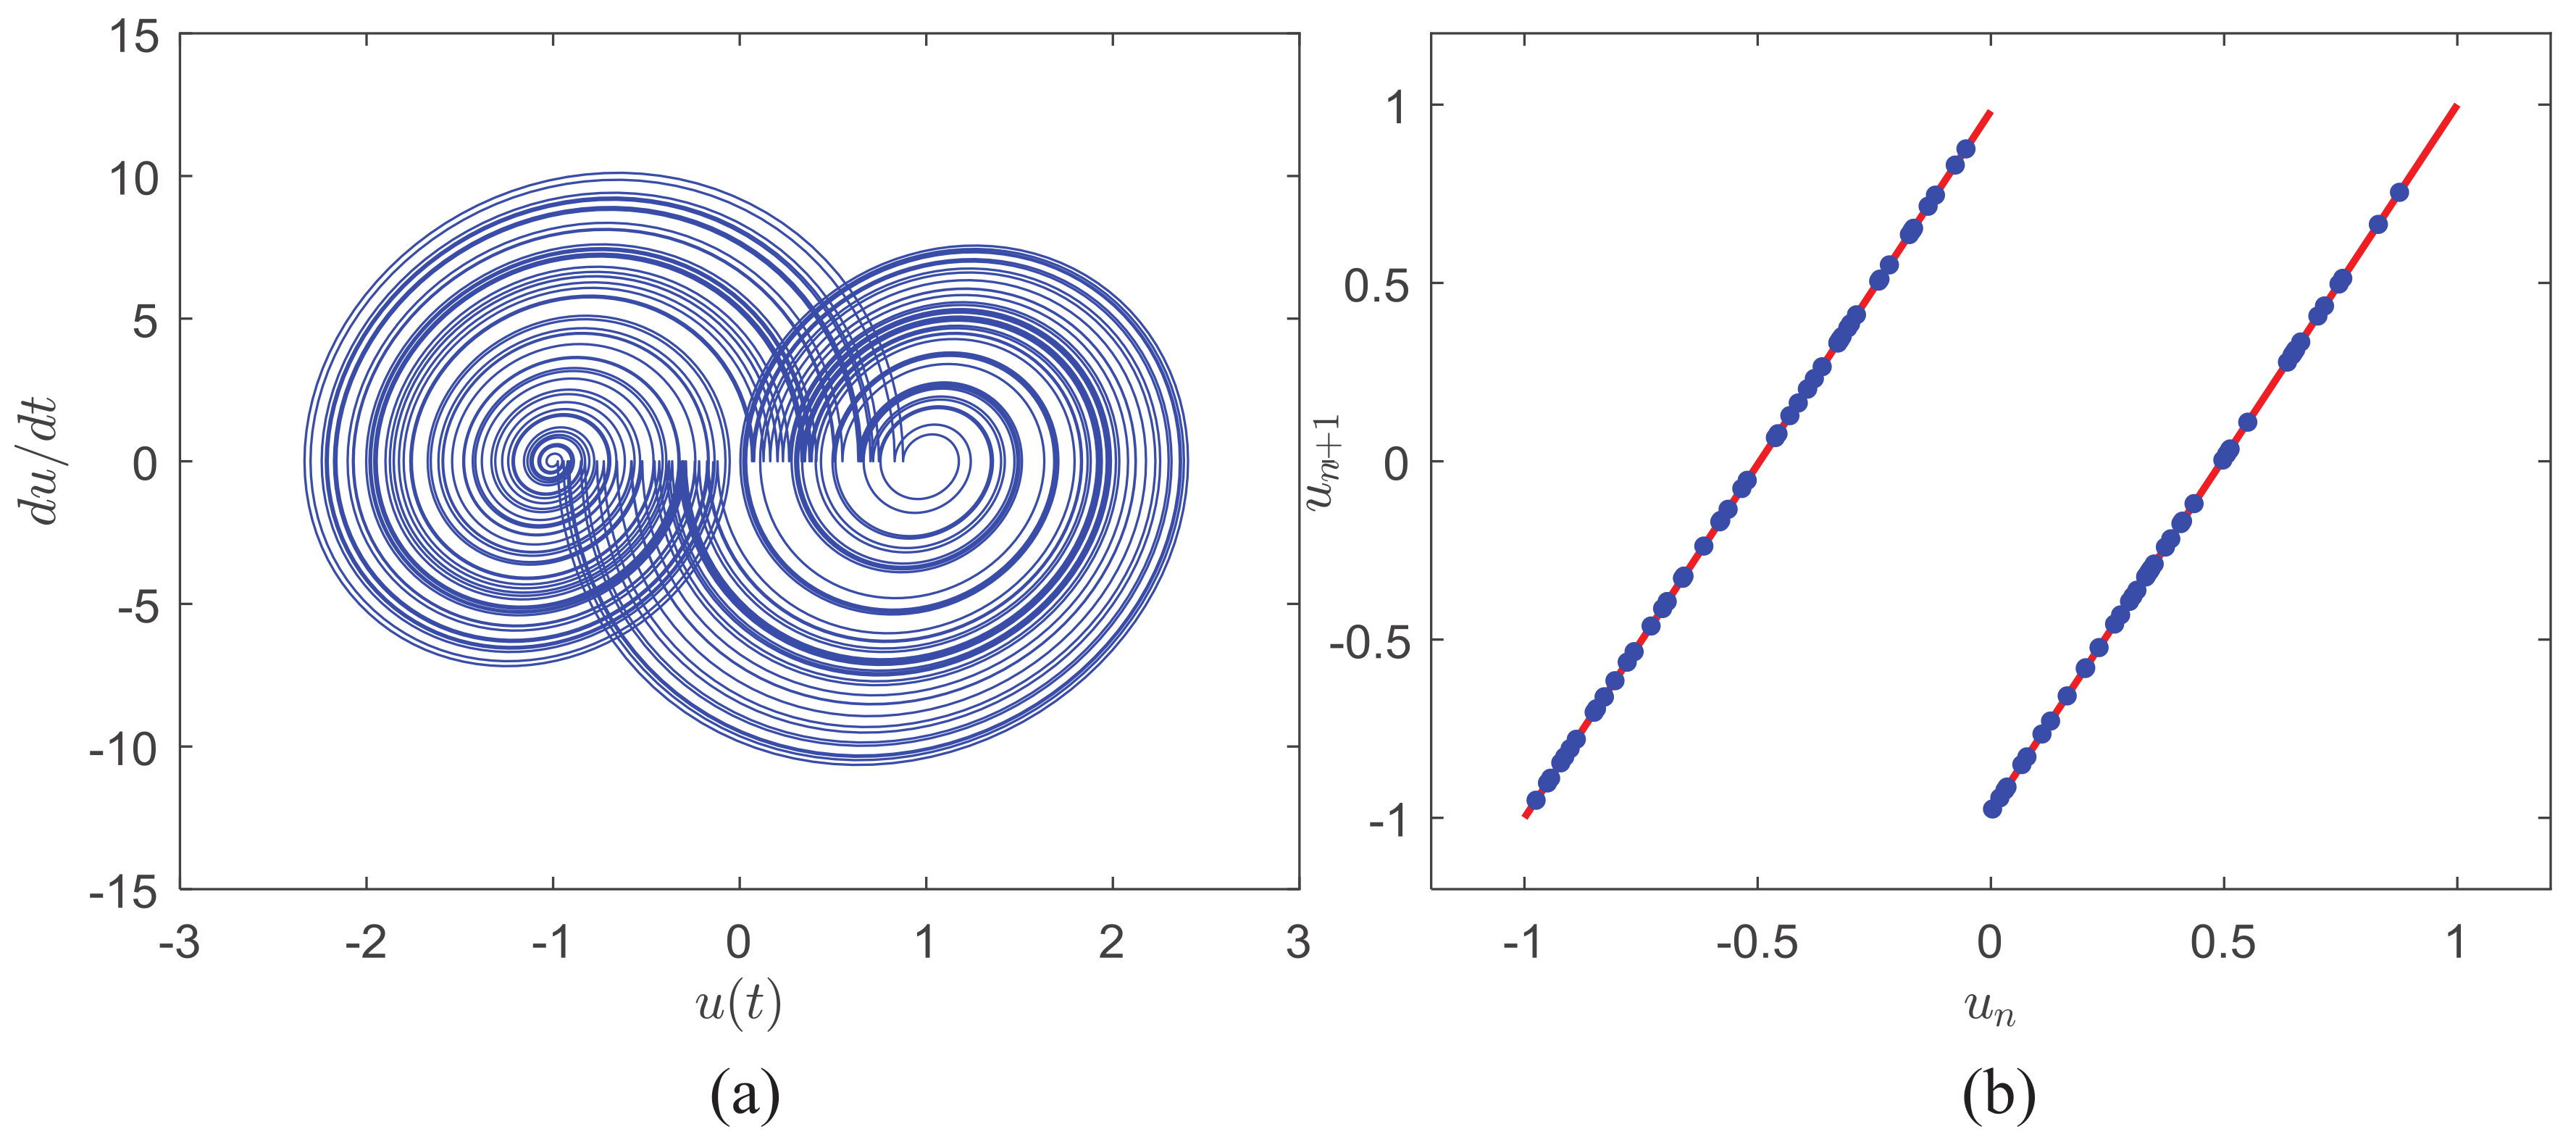
Figure 1 shows the corresponding phase-space projection and the return map of the iterated shift relation at regular return times
where
n is an integer. The system parameters are
and
. As
Figure 1a suggests, ASCS has an attractor topologically similar to the well-known Lorenz attractor. As
Figure 1b shows, the sampled values at
are divided into two groups by the binary symbol sequence
and follow the standard iteration relation lines with the fixed slope of
. Hence, the piecewise linear return map implies the dynamical system generated from Equation (
1) is chaotic with Lyapunov exponent
.
Based on the iteration relation of ASCS, the
Nth return point
and its former symbols determine the initial value
, which is given by
From the analytic solution Equation (
3),
can be derived as a linear convolution of a basis function and a binary symbol sequence when
N approaches to infinity:
where
m is an integer and the basis function
is defined as
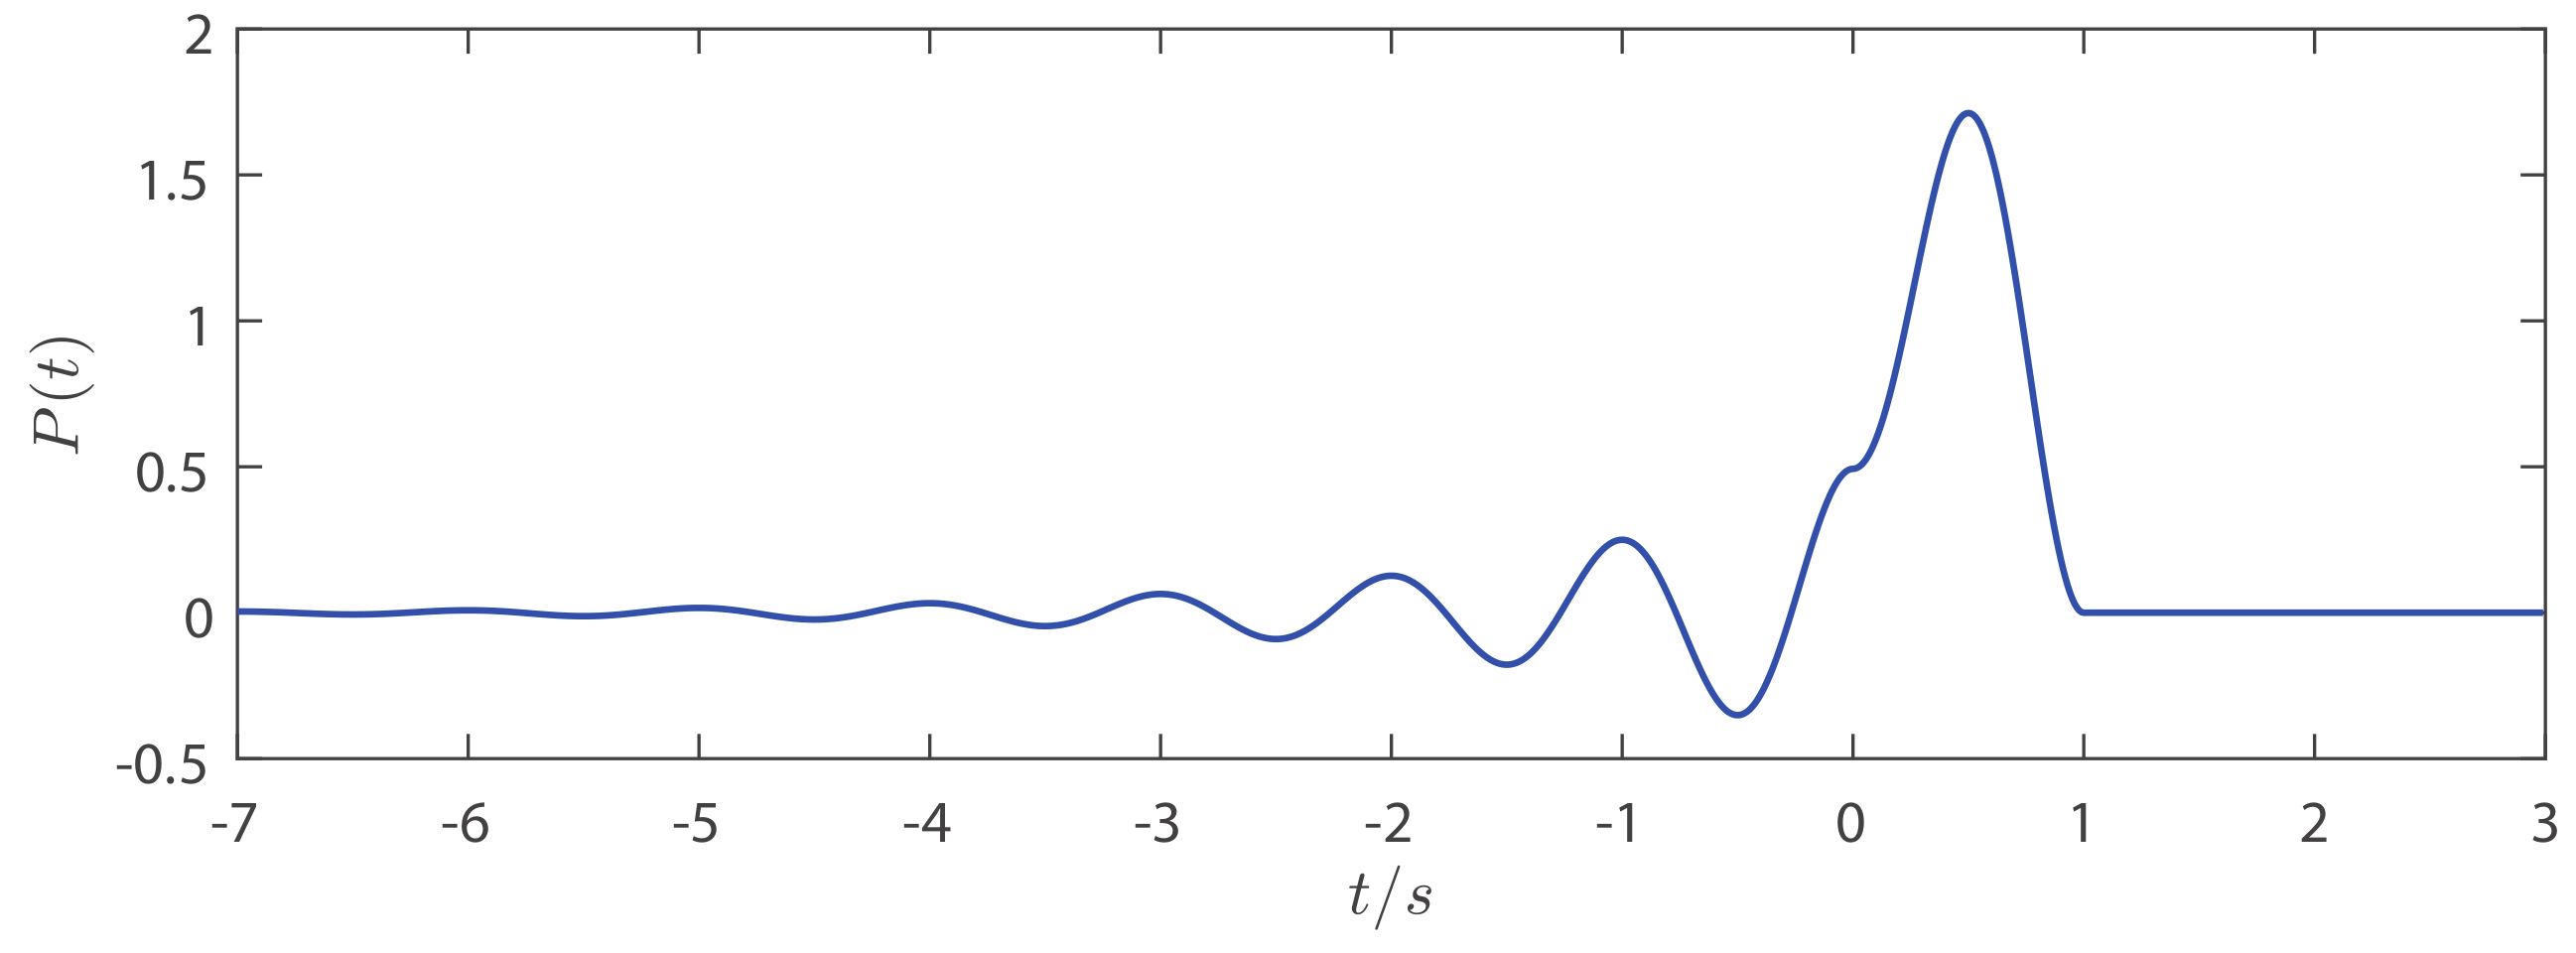
Figure 2 shows the shape of the basis function
for
and
. As Equation (
5) implies, the continuous waveform of
can be generated by the sum of binary symbols and the time delayed basis function
. Thus, binary symbols can be encoded into the continuous chaotic waveform
.
4. Symbol Detection with a Difference-Integral Detector
At the friendly receiver of ASCS, the symbols are recovered with a coherent matched-filter-based detector which requires precise knowledge of the frequency parameter f and the damping coefficient . However, the parameter , which is related to the linear part of the ASCS system, is difficult to estimate since the received signal is severely contaminated by noise. In this section, we propose a DI detector to incoherently retrieve the binary symbols that the chaotic signal is conveying, which requires only the frequency parameter estimation.
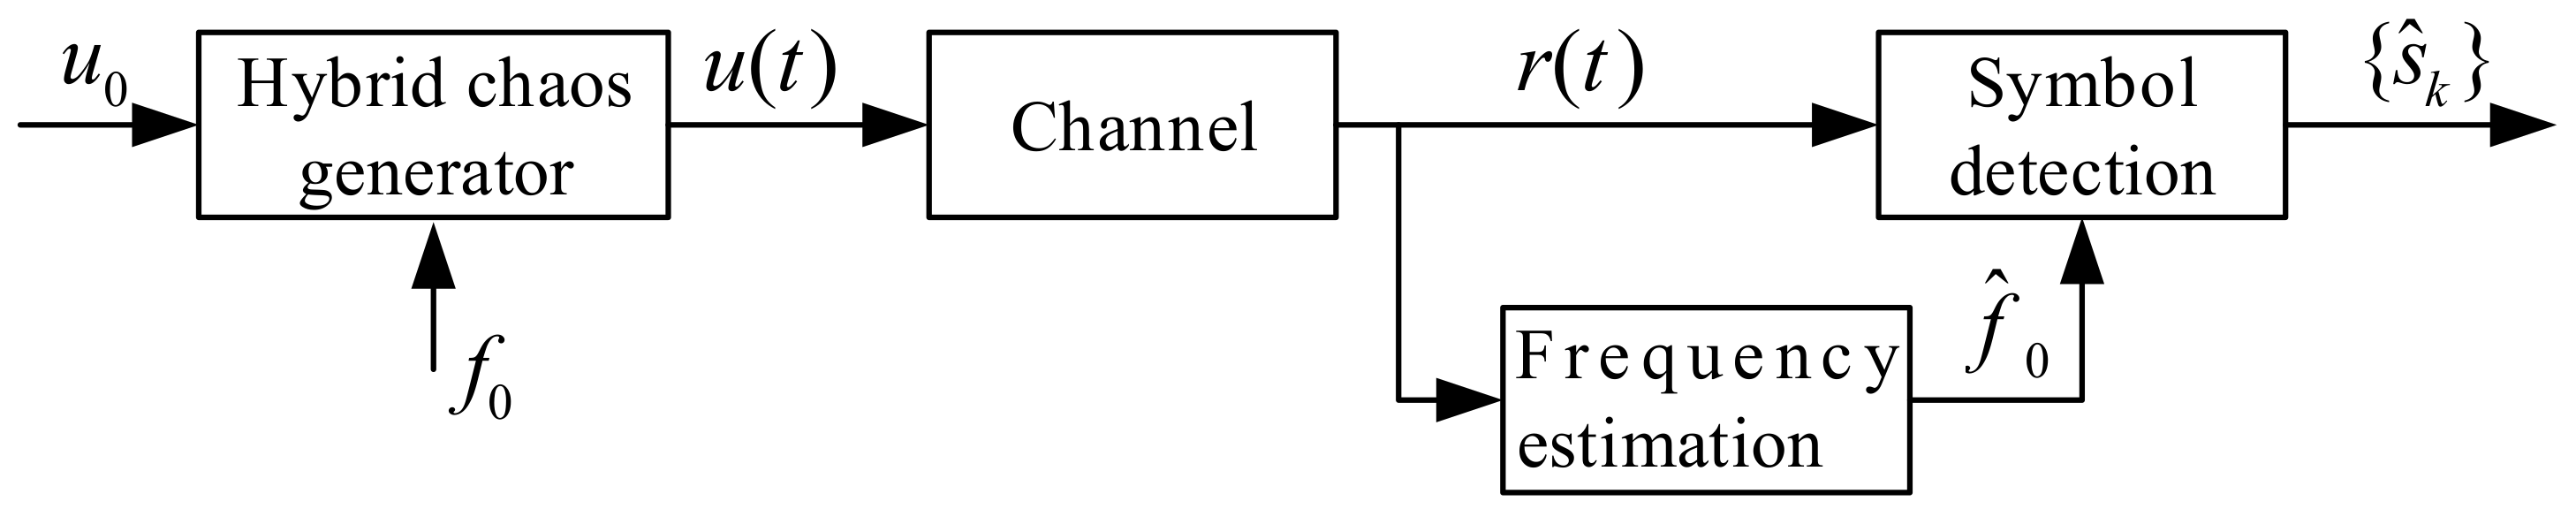
The whole process of the frequency estimation and symbol detection is described in
Figure 5. The chaotic signal is generated by the ASCS oscillator with the initial value
and the basis frequency
. After transmitting in the channel, the chaotic signal is contaminated by the noise. Then we conduct a blind frequency estimation from the received signal and obtain the estimated basis frequency
. With the estimated frequency
, the binary symbols that the chaotic signal conveying can be retrieved by a DI detector.
As mentioned above, the main characteristic of ASCS is that this class of chaotic signal can be described by a weighted sum of basis functions. Note that continuous waveform contains the relations among binary symbols. Hence, the symbols conveyed in the ASCS waveform can be retrieved directly from the received signal by utilizing this feature.
The block diagram of the DI detector scheme is shown in
Figure 6. Assume a segment of continuous chaotic signal
carries a sequence of binary symbols
. The intermediate state
is obtained by differencing the received signal
and the delayed one
. Then
is sent to the integrator. The integral output
is computed numerically by
. Note that the practical signal generated from the chaotic oscillator is not infinite in length. Suppose the received signal transmit
N symbols and thus the time duration is
. Then the whole integral region is from 0 to
. By extracting the integral output at sampling time
, we compare the samples
with a flexible threshold
, calculated with the previously recovered symbols to detect the polarity, which is given by
. If the
is larger than
, then the estimated symbol is 1. Otherwise, the estimated symbol is
. Hence, the estimated symbol sequence is expressed as
. In the following, we provide detailed derivations of the proposed detector.
The received signal in the AWGN channel is modeled as
where the white Gaussian noise term
has zero mean and power density
. The difference between the received signal and its time-shift version can be expressed in a convolution form as
Define an integral from 0 to
t as
where
is noise term;
is computed as
where
;
;
;
To guarantee the accuracy of the integral, the integral step should be small and thus the sampling rate of the received signal
is supposed to be high. The sample of
at
is derived as
where the upper term is the cumulative interference caused by the previous symbols; the bottom term is the interference caused by the future symbols. Hence, we can rewrite the samples as
where
is the sampled noise term
in Equation (
28
) and it follows a Gaussian distribution with zero mean and
variance;
is the inter-symbol interference defined as
where
represents the intersymbol interference of the past symbols;
represents the intersymbol interference of the future symbols. Since
can be calculated but
is unavailable, we use
as the detection threshold and the detection process is described as
with
as the threshold.
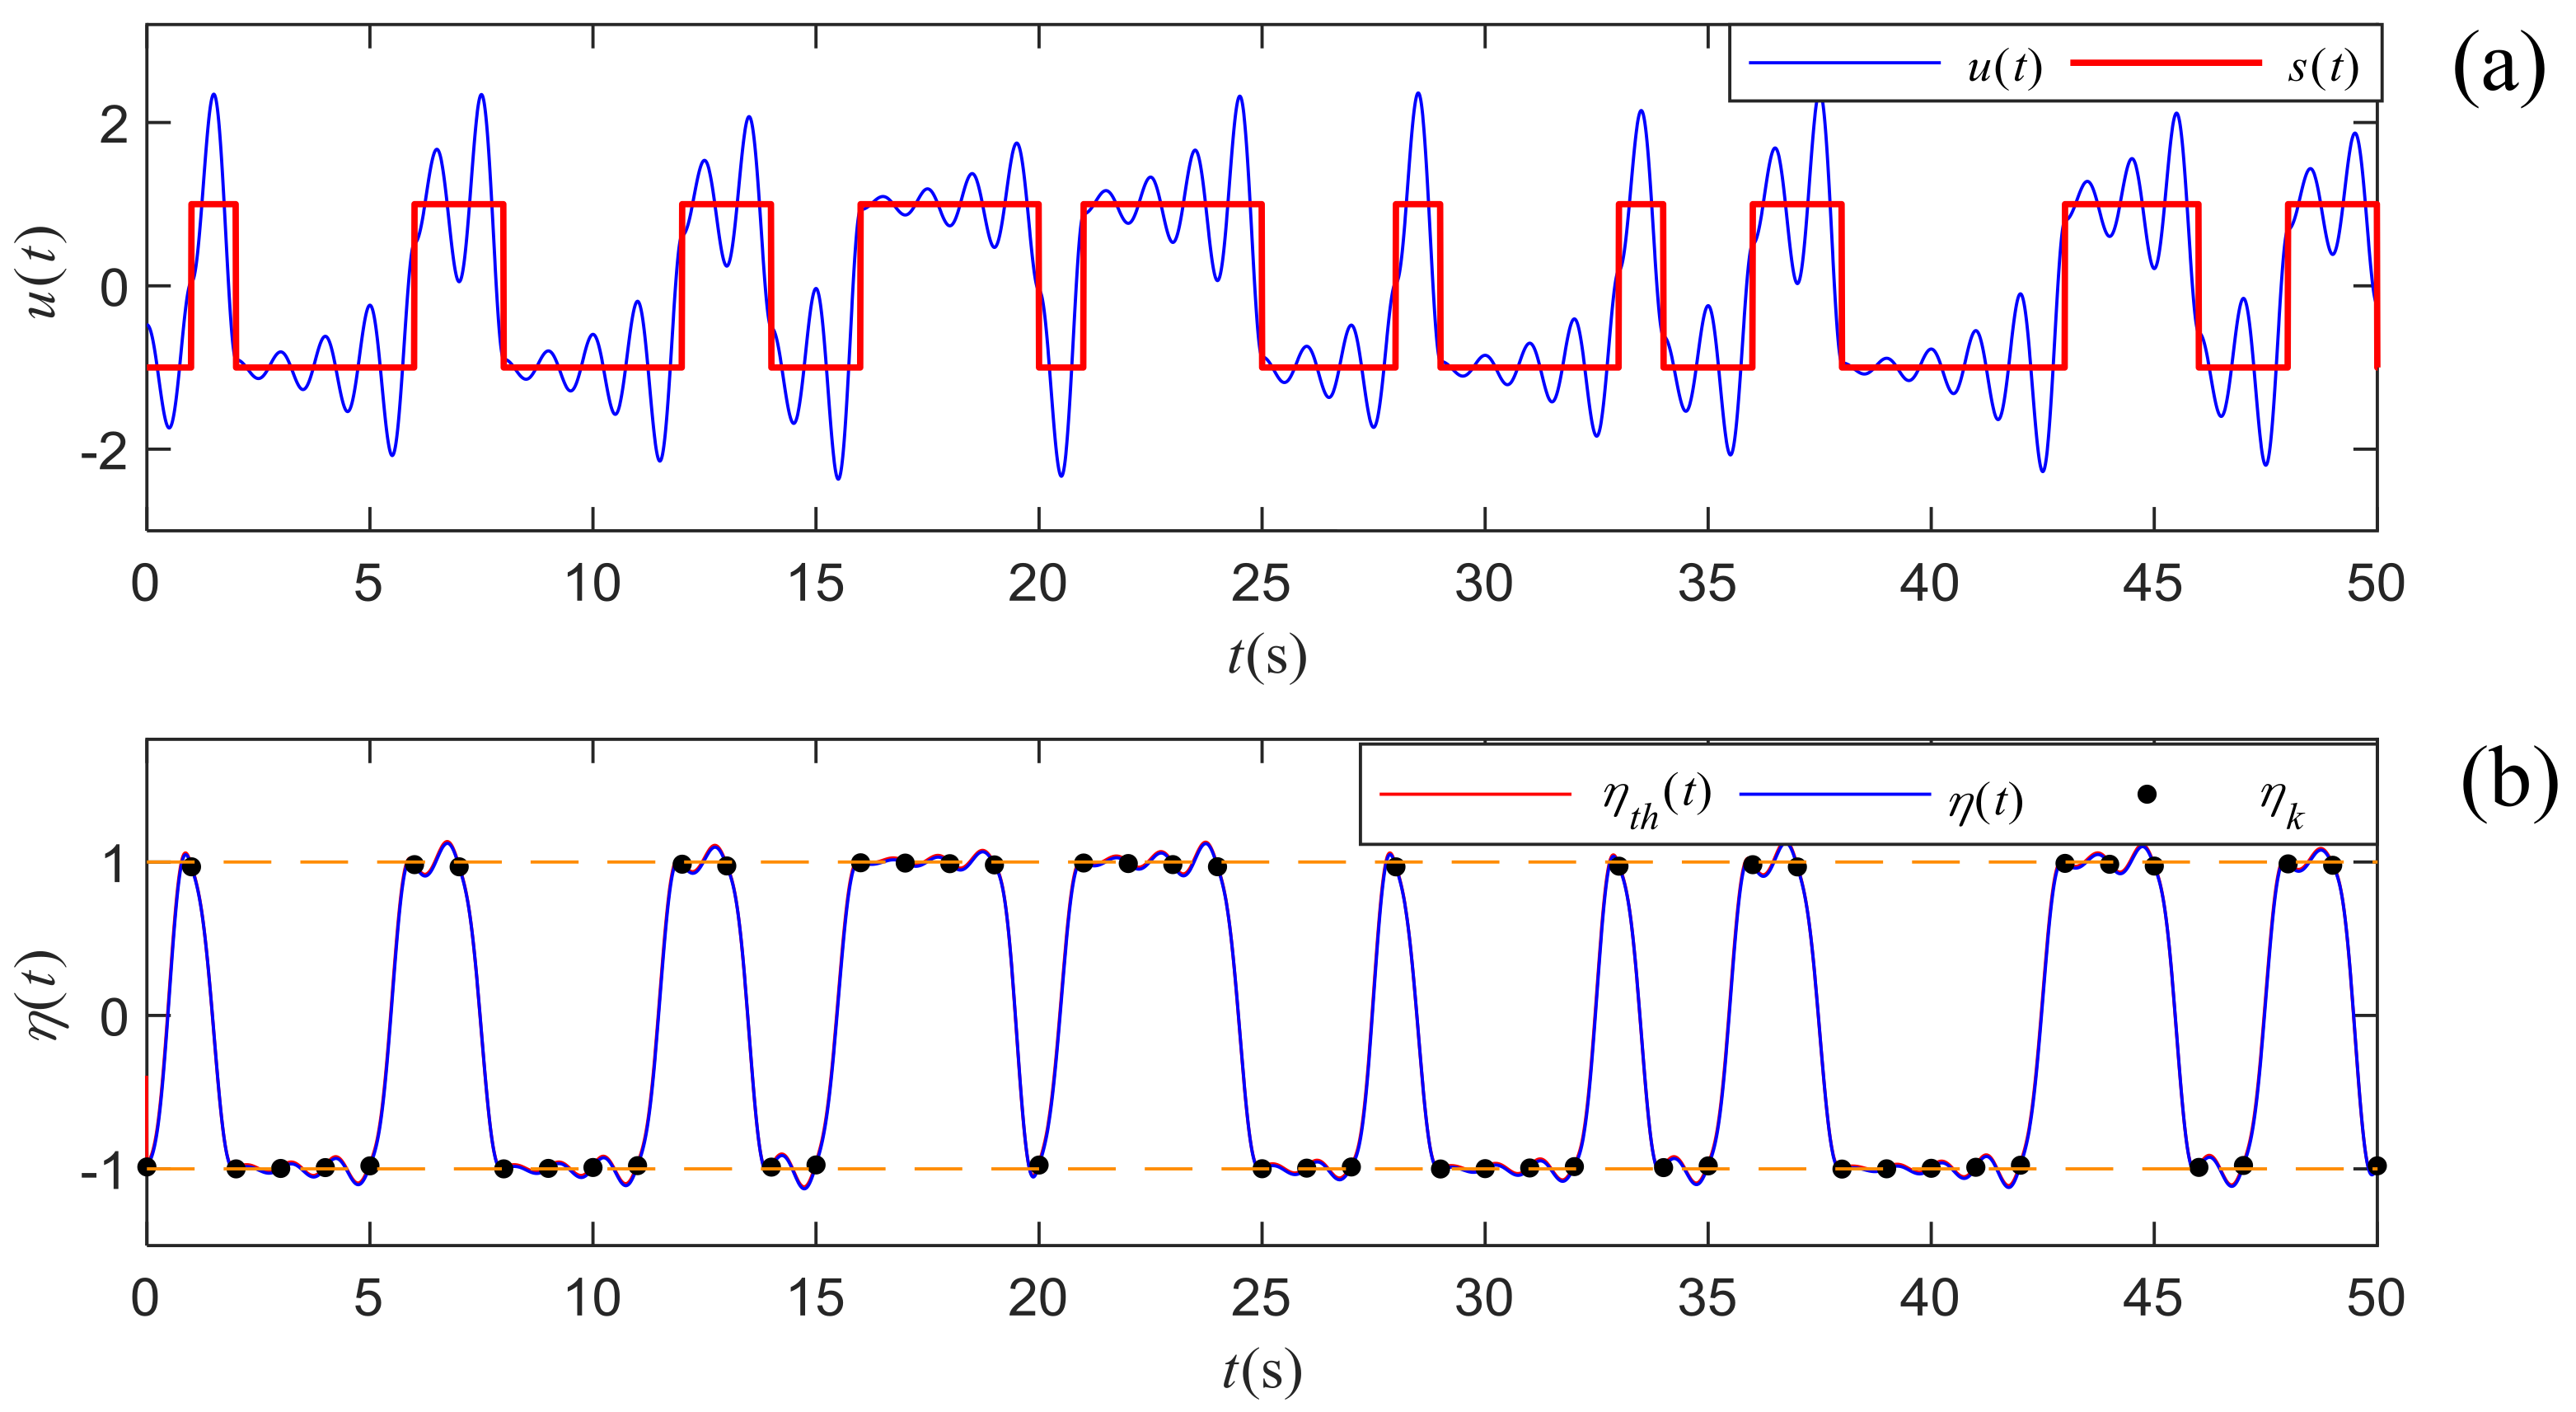
To illustrate the detection process above, we generate a segment of chaotic signal with
m truncated at 50 and the period
T is set as 1 s, where the chaotic signal is not contaminated by noise. The continuous waveform and symbol sequence are depicted in
Figure 7a. Both the numerical
and theoretical
integrals are calculated and compared in
Figure 7b, where the sampling rate is 0.01 s. From the comparison of the waveforms, we find that the theoretical integral computed by Equation (
29) is quite close to the numerical integral result, proving that the previous calculation and approximation are reasonable. The samples
of the numerical integral result
stay around
which are depicted with two horizontal dash lines. Hence, the symbol sequence can be easily retrieved by Equation (
33). Compared with the original symbol sequence provided in
Figure 7a, the extracted one is exactly the same.
5. Performance Evaluation and Simulation
In this section, we first evaluated the symbol error performance theoretically and derived an exact closed-form expression of error probability in the symbol detection. Then the robustness of the DI detector was verified by numerical simulations with various errors in parameter estimation.
Under the noise background, errors in symbol detection occur with rising probability as the variance of noise increases. Hence, it is necessary to evaluate the error performance for symbol detection with different SNR levels. In this paper, we define the BER as the ratio of the number of errors to the total number of detected symbols. As implied in Equation (
33), the detection is a classical hypothesis test. Then the probability of detecting an incorrect bit is
Note that the source symbols
are sent with equal probability, that is,
. Assume that “+1” and “
” in the future symbols distribute with the equal probability of
, then
follows a uniform distribution in the range given by
. Note that the term
decreases rapidly as
k increases, then we have the approximate upper bound as
and the upper bound as
. Thus, the error probability for
can be expressed as
where
denotes the complementary error function;
. Consider that
decreases rapidly as
k increases, we have the approximate
. The integral is computed as
where
;
.
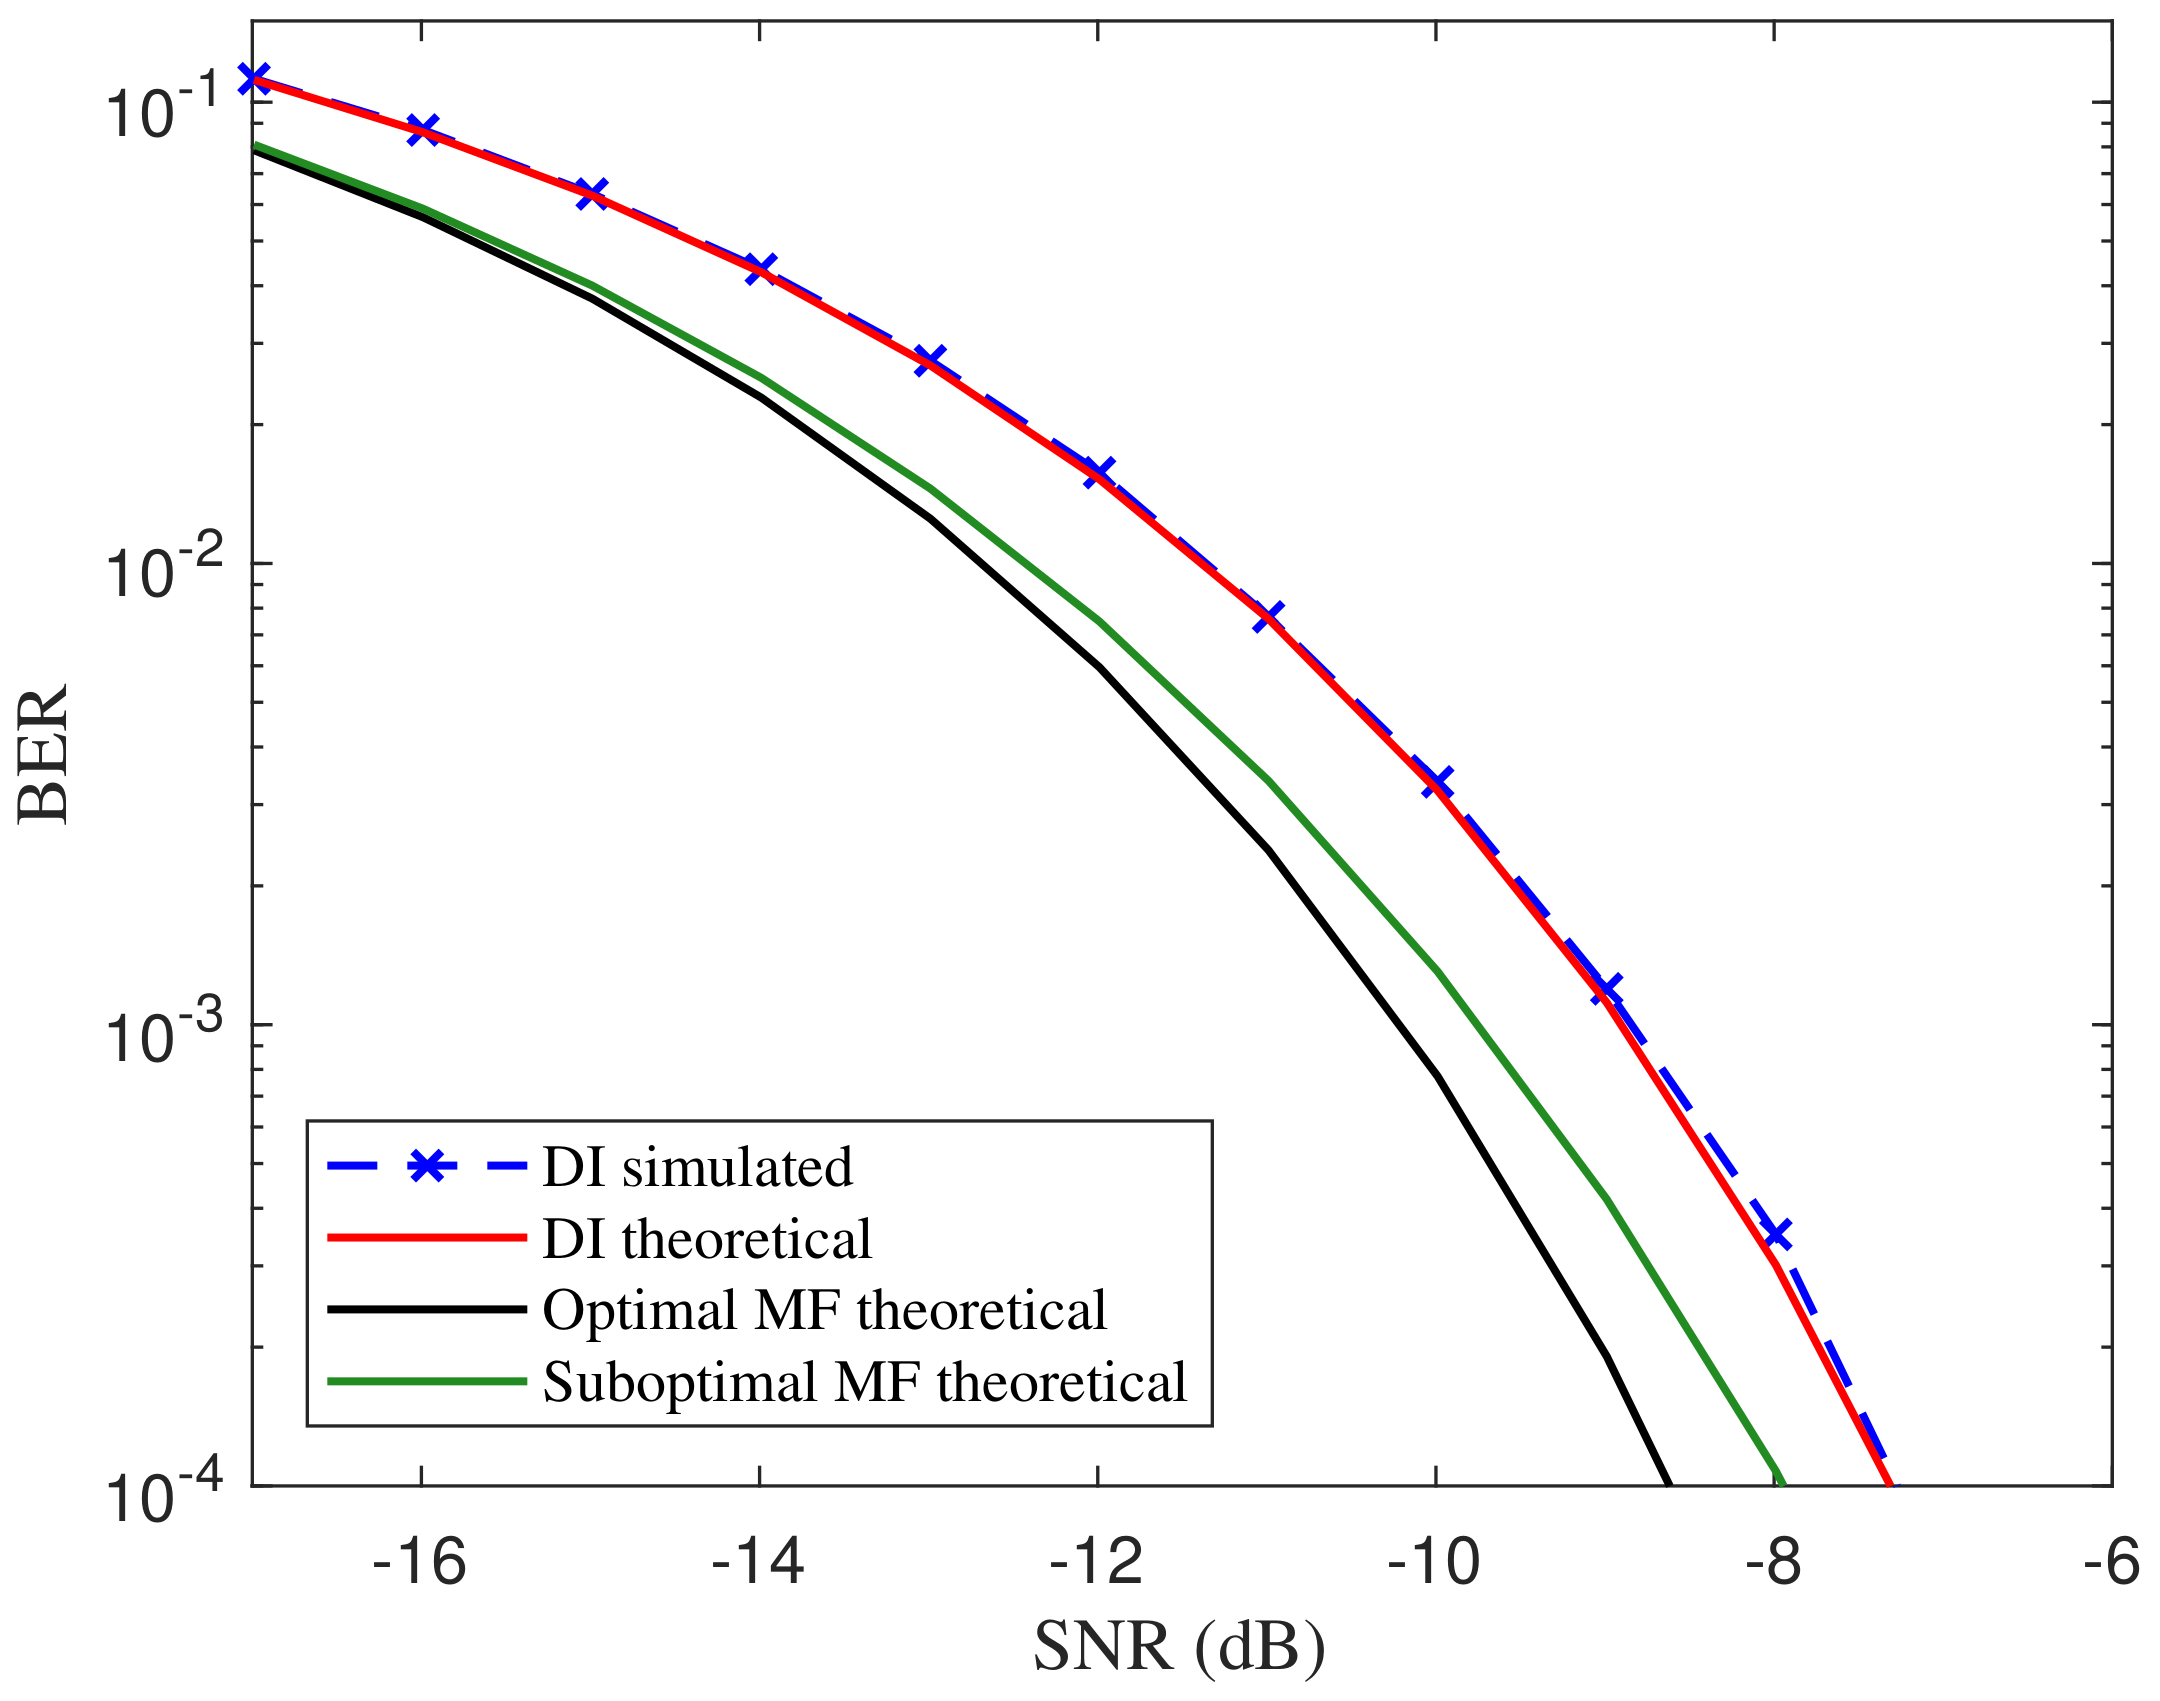
We implement our symbol detecting method in different frequency settings and illustrate the BER curves in
Figure 8. The theoretical BER curves of the symbol detecting method with optimal and suboptimal matched filter introduced in References [
4,
16] are also depicted as a reference. The SNR is defined as the ratio of the power of the ASCS signal to the noise power, where the sample rate is 100 times faster than the symbol rate. In fact, the relative SNR calculated with in-band noise should be the actual SNR added to
dB. As can be noticed, the simulated curve for the proposed DI detector matches the theoretical one well. Compared with the theoretical error performance of the suboptimal matched-filter-based detector, our method performs a degradation around 1 dB. Nevertheless, it is acceptable for an attacker or an eavesdropper to obtain enough information.
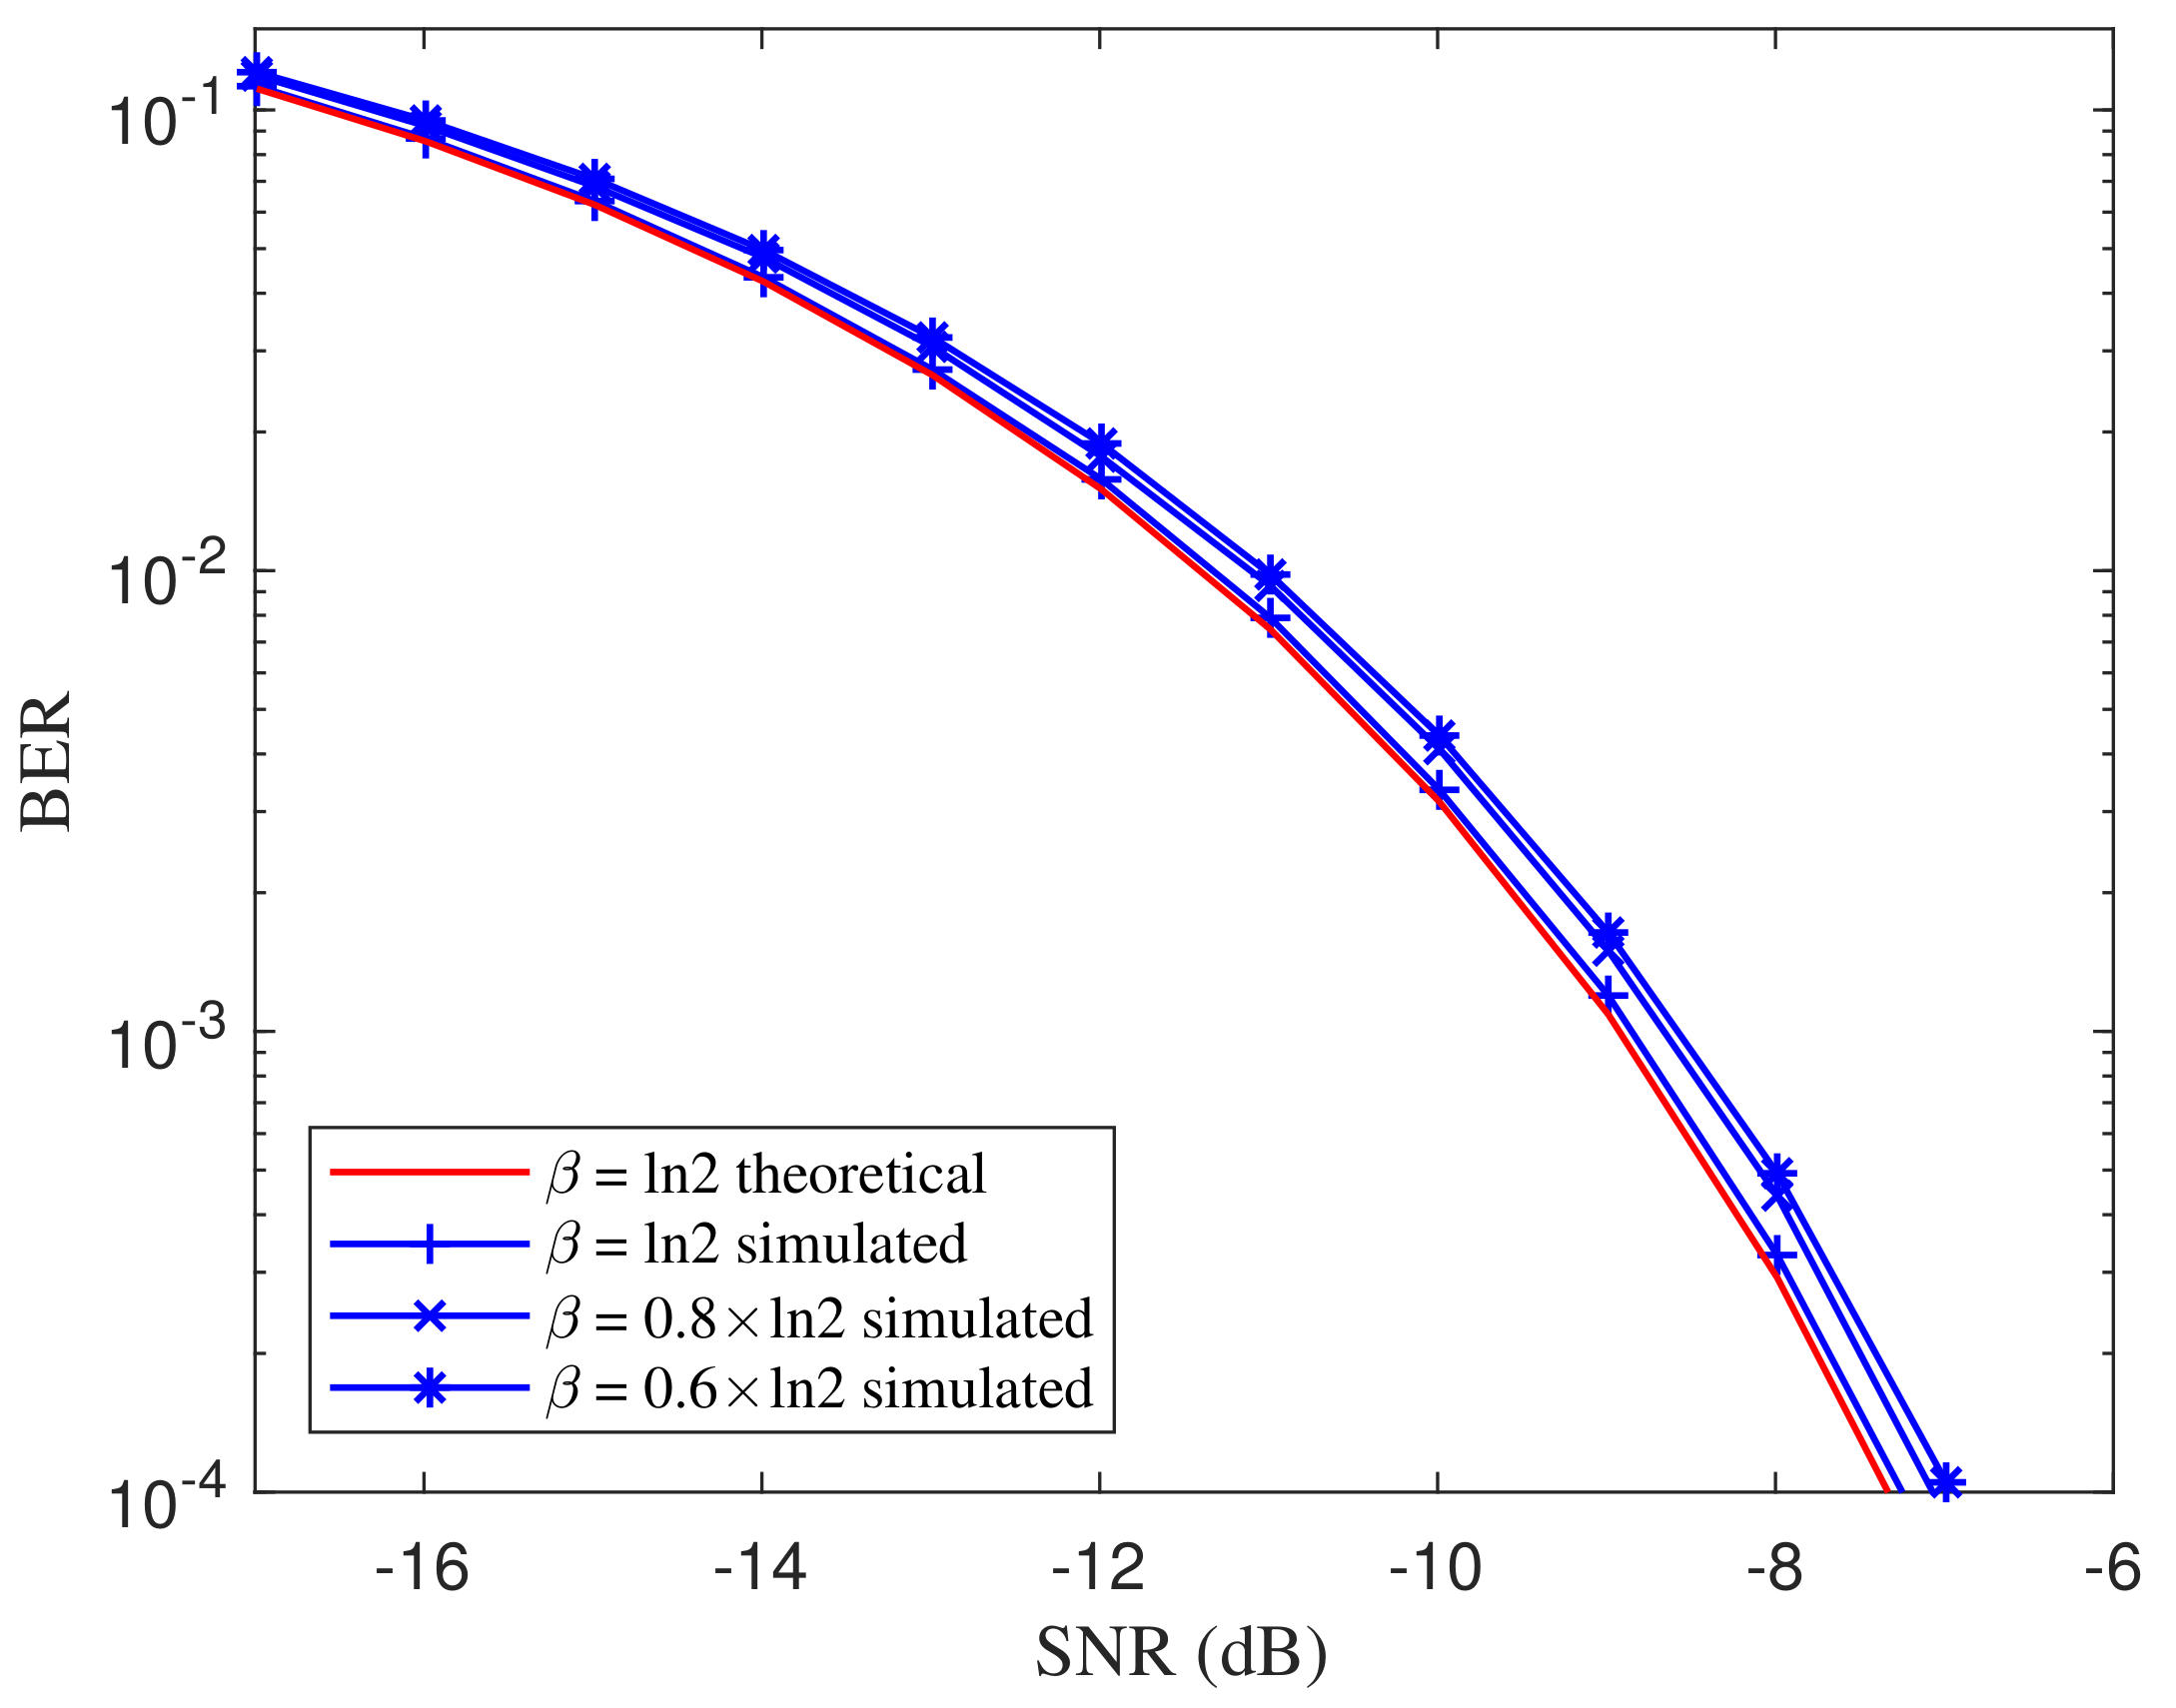
As implied in the theoretical BER expression Equation (
36), the BER is related to the damping coefficient
. To evaluate the BER performance under different damping coefficients, we set the damping coefficient as
where the coefficient
. The simulated BER curves of the proposed DI-HCC over different damping coefficients are shown in
Figure 9. The theoretical BER for
is depicted as a reference. From the comparisons of BER curves over different settings, the BER performance of the DI detector slightly degrades as the damping coefficient
decreases. However, the deterioration is not significant since
has a limited impact on the constant values in Equation (
36). Hence, the proposed DI detector is robust to the damping coefficient of the ASCS. Since the samples are extracted at the integer multiplies of
T, the imprecise sampling time is supposed to have effects on the BER performance. Assume that the integral
are sampled at
, where
is the sampling lag.
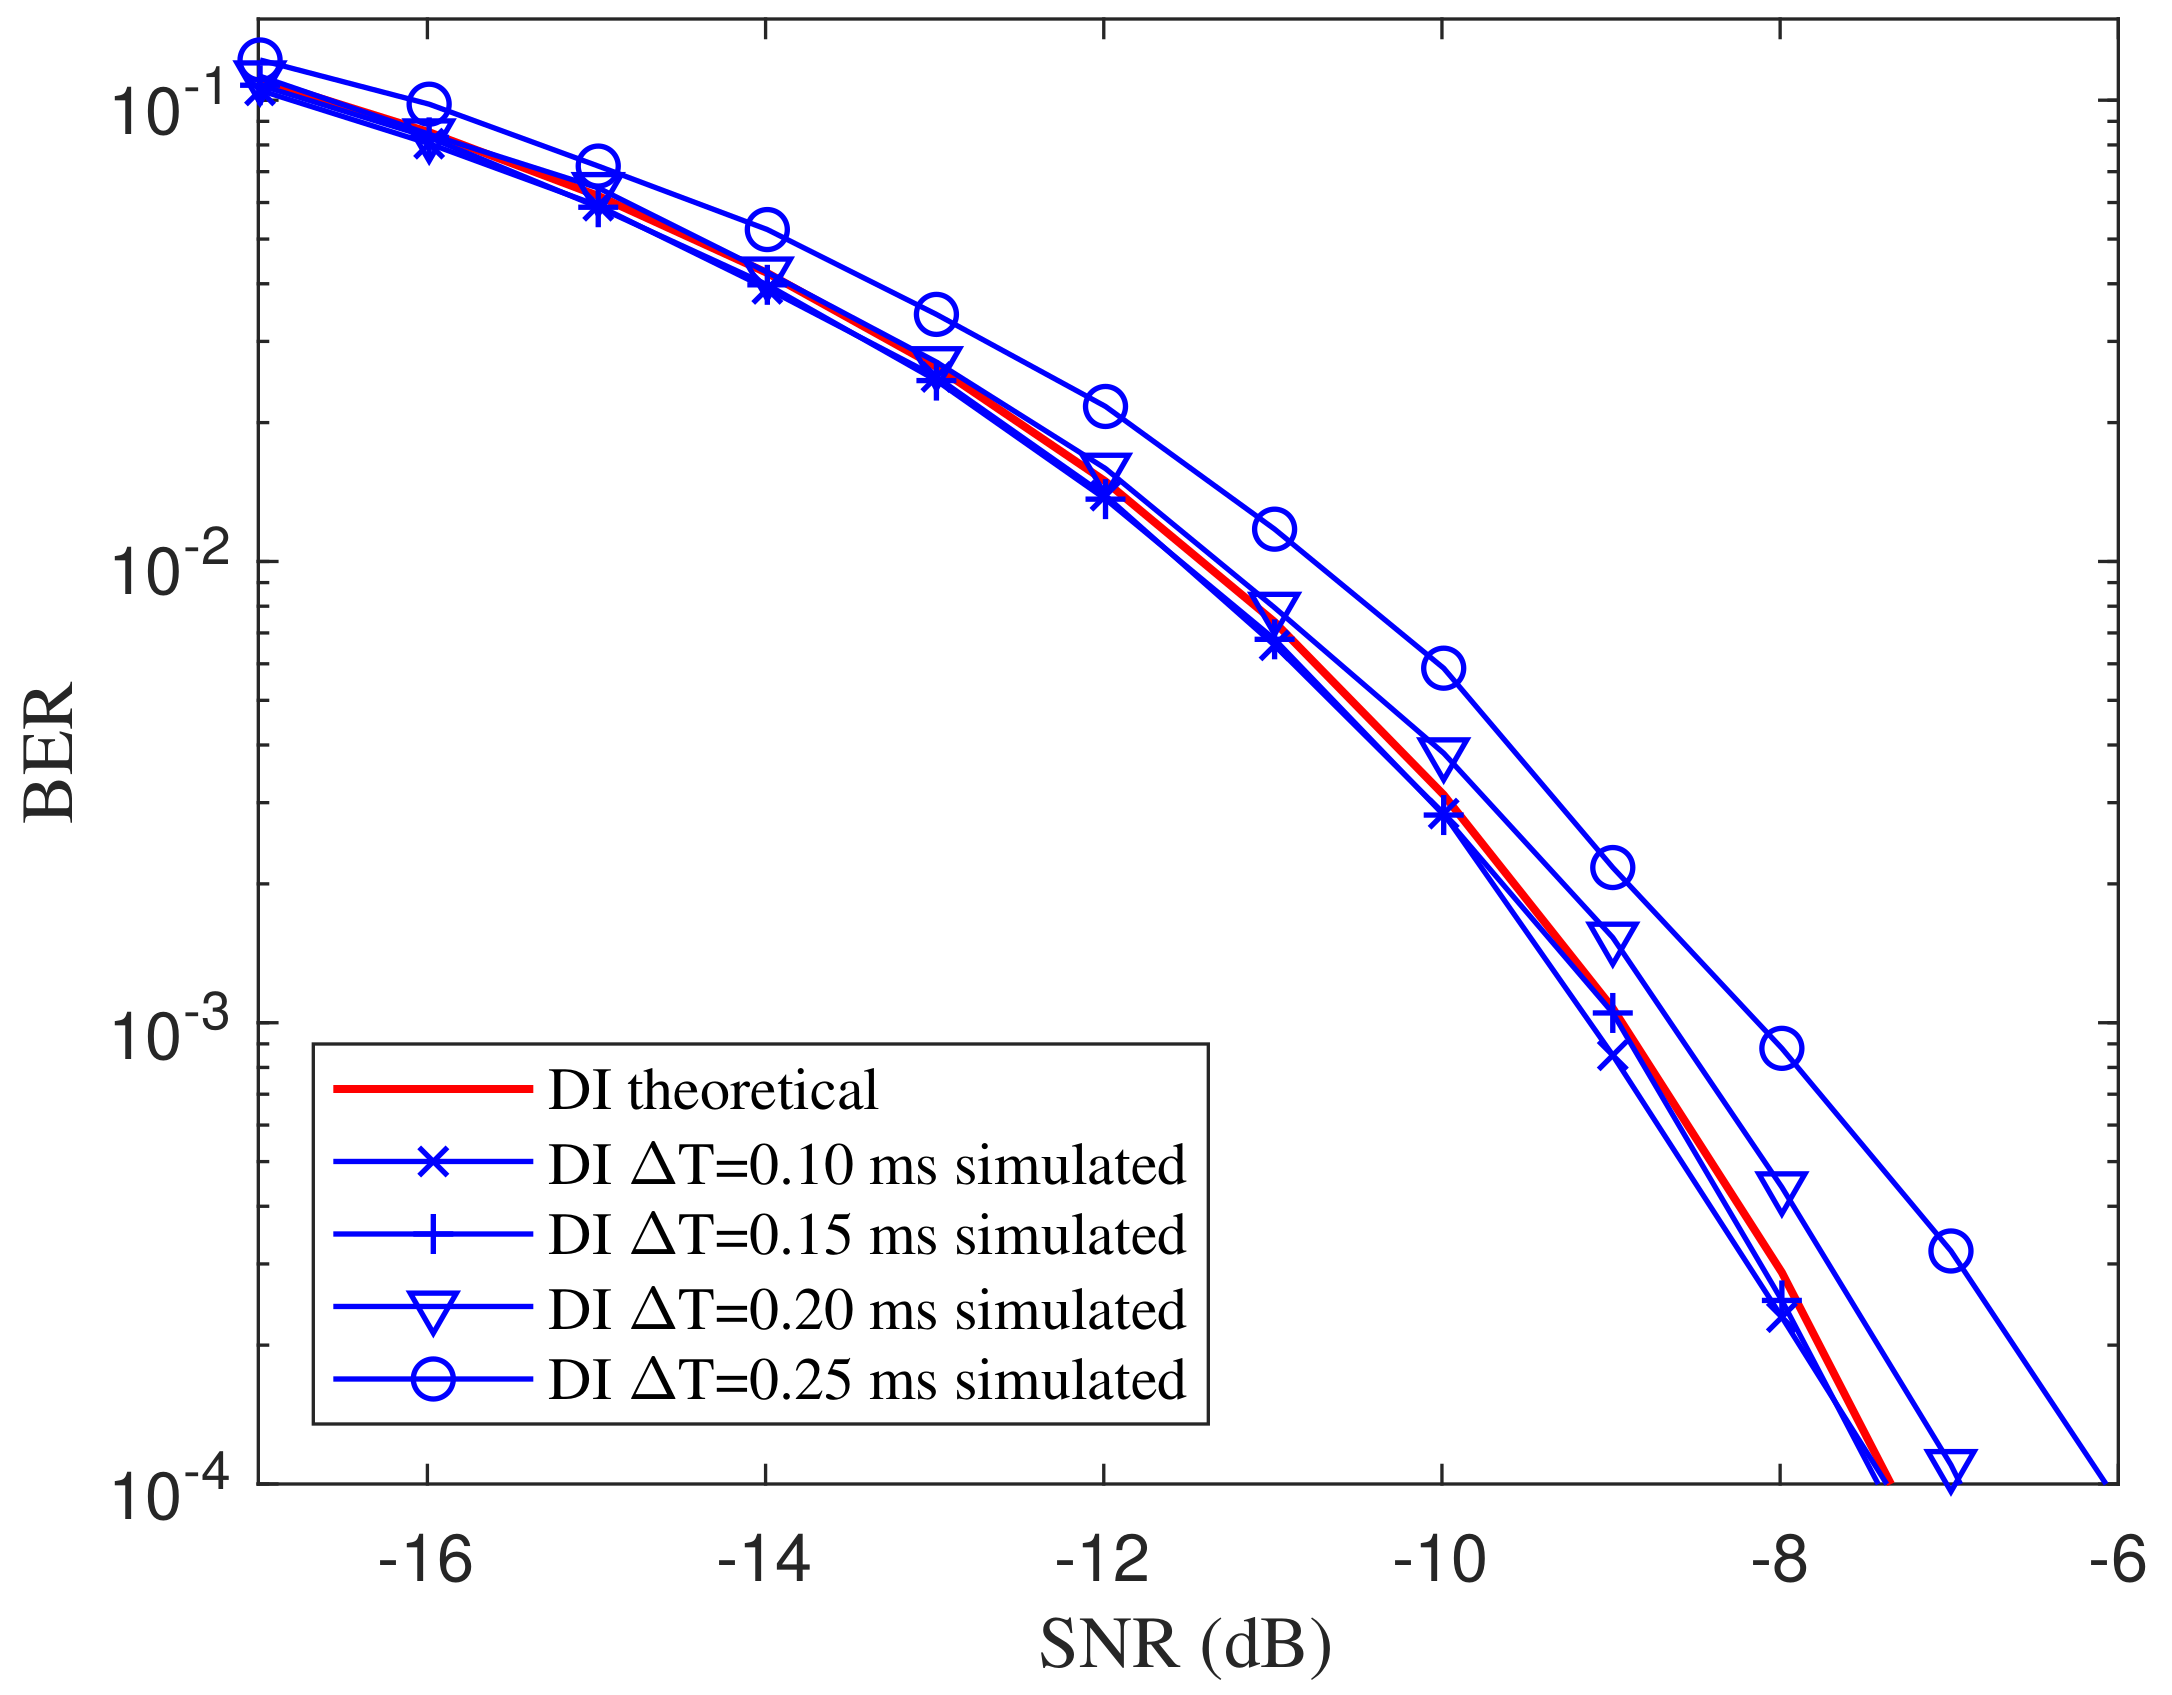
Figure 10 shows the BER curves over different sampling lags with
ms where the basis frequency of the ASCS is set as 1 kHz. From the comparison of the curves, the performance deteriorates gradually as the lag increases. However, the deterioration is slight when the lag is less than 0.15 ms, meaning the proposed detector keeps valid within a limited range of sampling lag.
The key parameter in symbol detection is the symbol period
T, which is defined as
and the basis frequency
is estimated by the FFT-based MLE. Unavoidably, the frequency estimation error has a negative impact on the symbol detection.
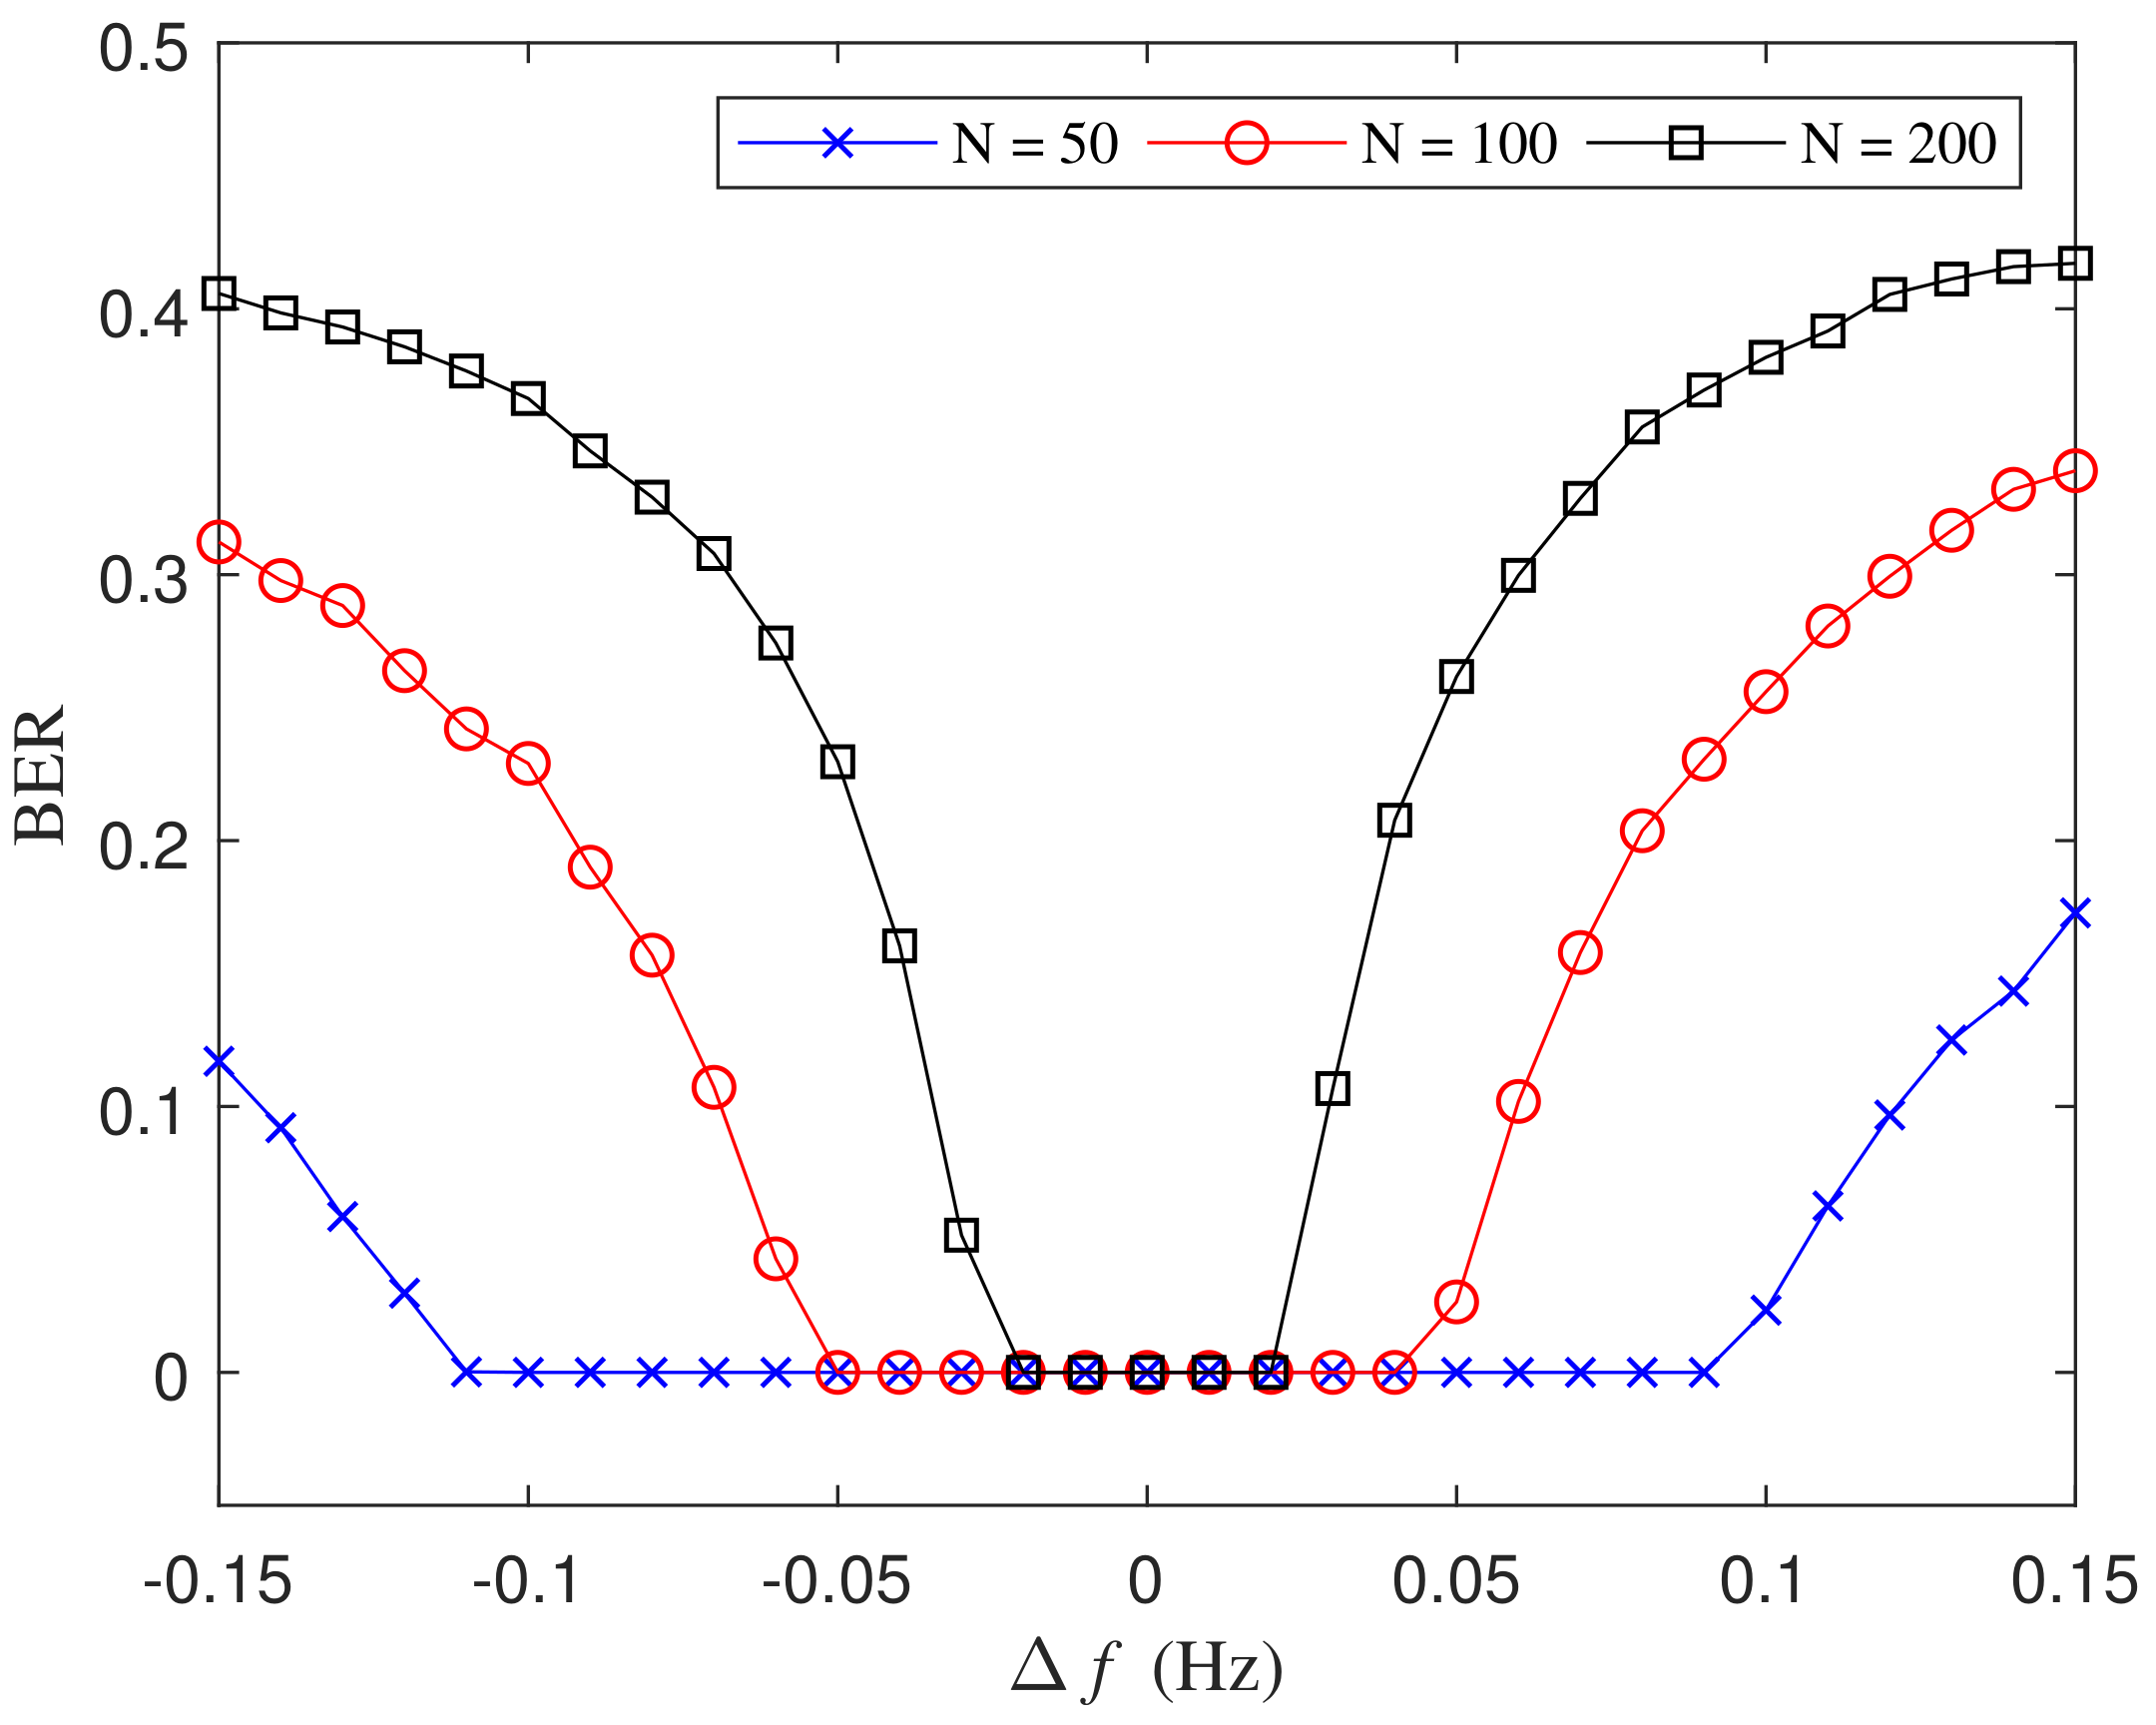
Figure 11 illustrates BERs for various estimation error
with different numbers of symbols in the received signal with a fixed SNR as
dB, where the basis frequency is set as
Hz and the estimated frequency is
. As the absolute value of the frequency estimation error increases, the symbol detection error probability is larger when
N is 200 while almost no error is seen for
and
in the tested estimation error range. It can be explained that the DI detection is a process with error accumulation over time. As time passes, the sampling time will gradually deviate from the original exact sampling positions, which brings deterioration to the symbol detection. Assume the difference between the estimated symbol period
and the exact period
T is
. Suppose the error of sampling time increases to the half of
T after
N symbols, then we have
and the estimation error of the frequency is correspondingly
. Hence, the maximum of the absolute value of the frequency estimation error should be less than
. In the simulation in
Figure 11, as derived theoretically, the absolute value of
should be controlled within 0.025, 0.05, and 0.1 for
N is set as 200, 100, 50 respectively, to avoid the accumulated error. The obtained BERs show that the theoretical bounds of the frequency estimation error for different
N match the simulated results well. In the practical implementation of the proposed method, the frequency estimation error can be evaluated by CRLB with the known SNR level. With the theoretical frequency estimation error, we can compute the upper bound of
N. Then the received signal is divided into segments with the limited time length of
to avoid error caused by the accumulation effect.


