A New Deep Learning Based Multi-Spectral Image Fusion Method

Abstract
1. Introduction
- (1)
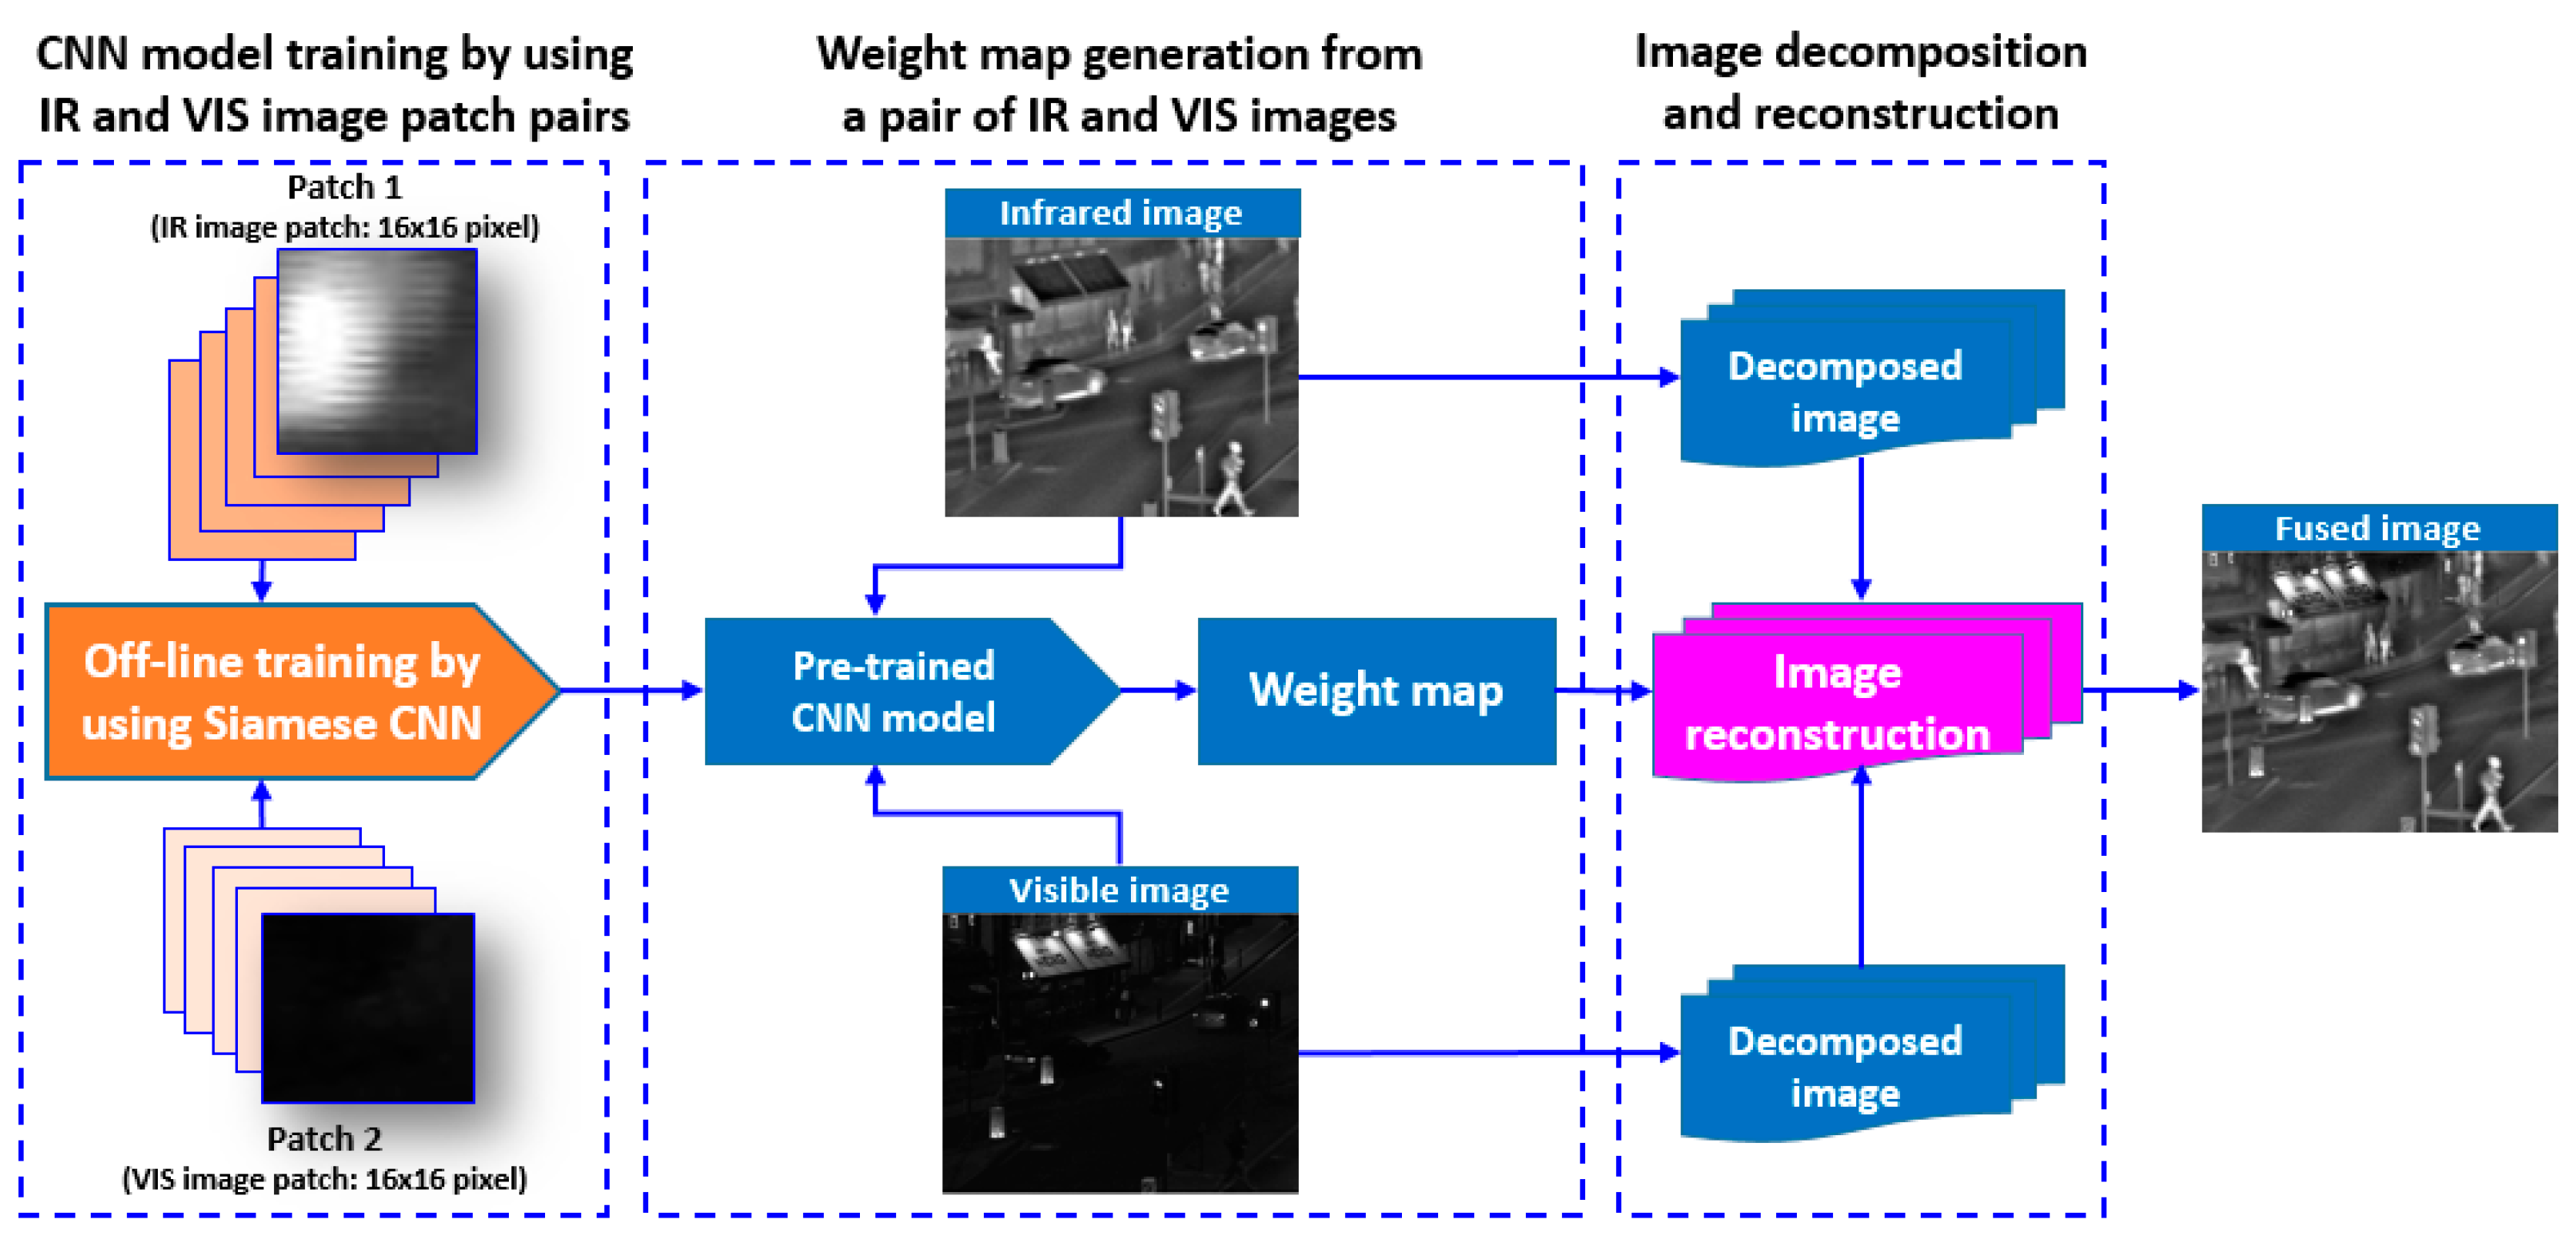
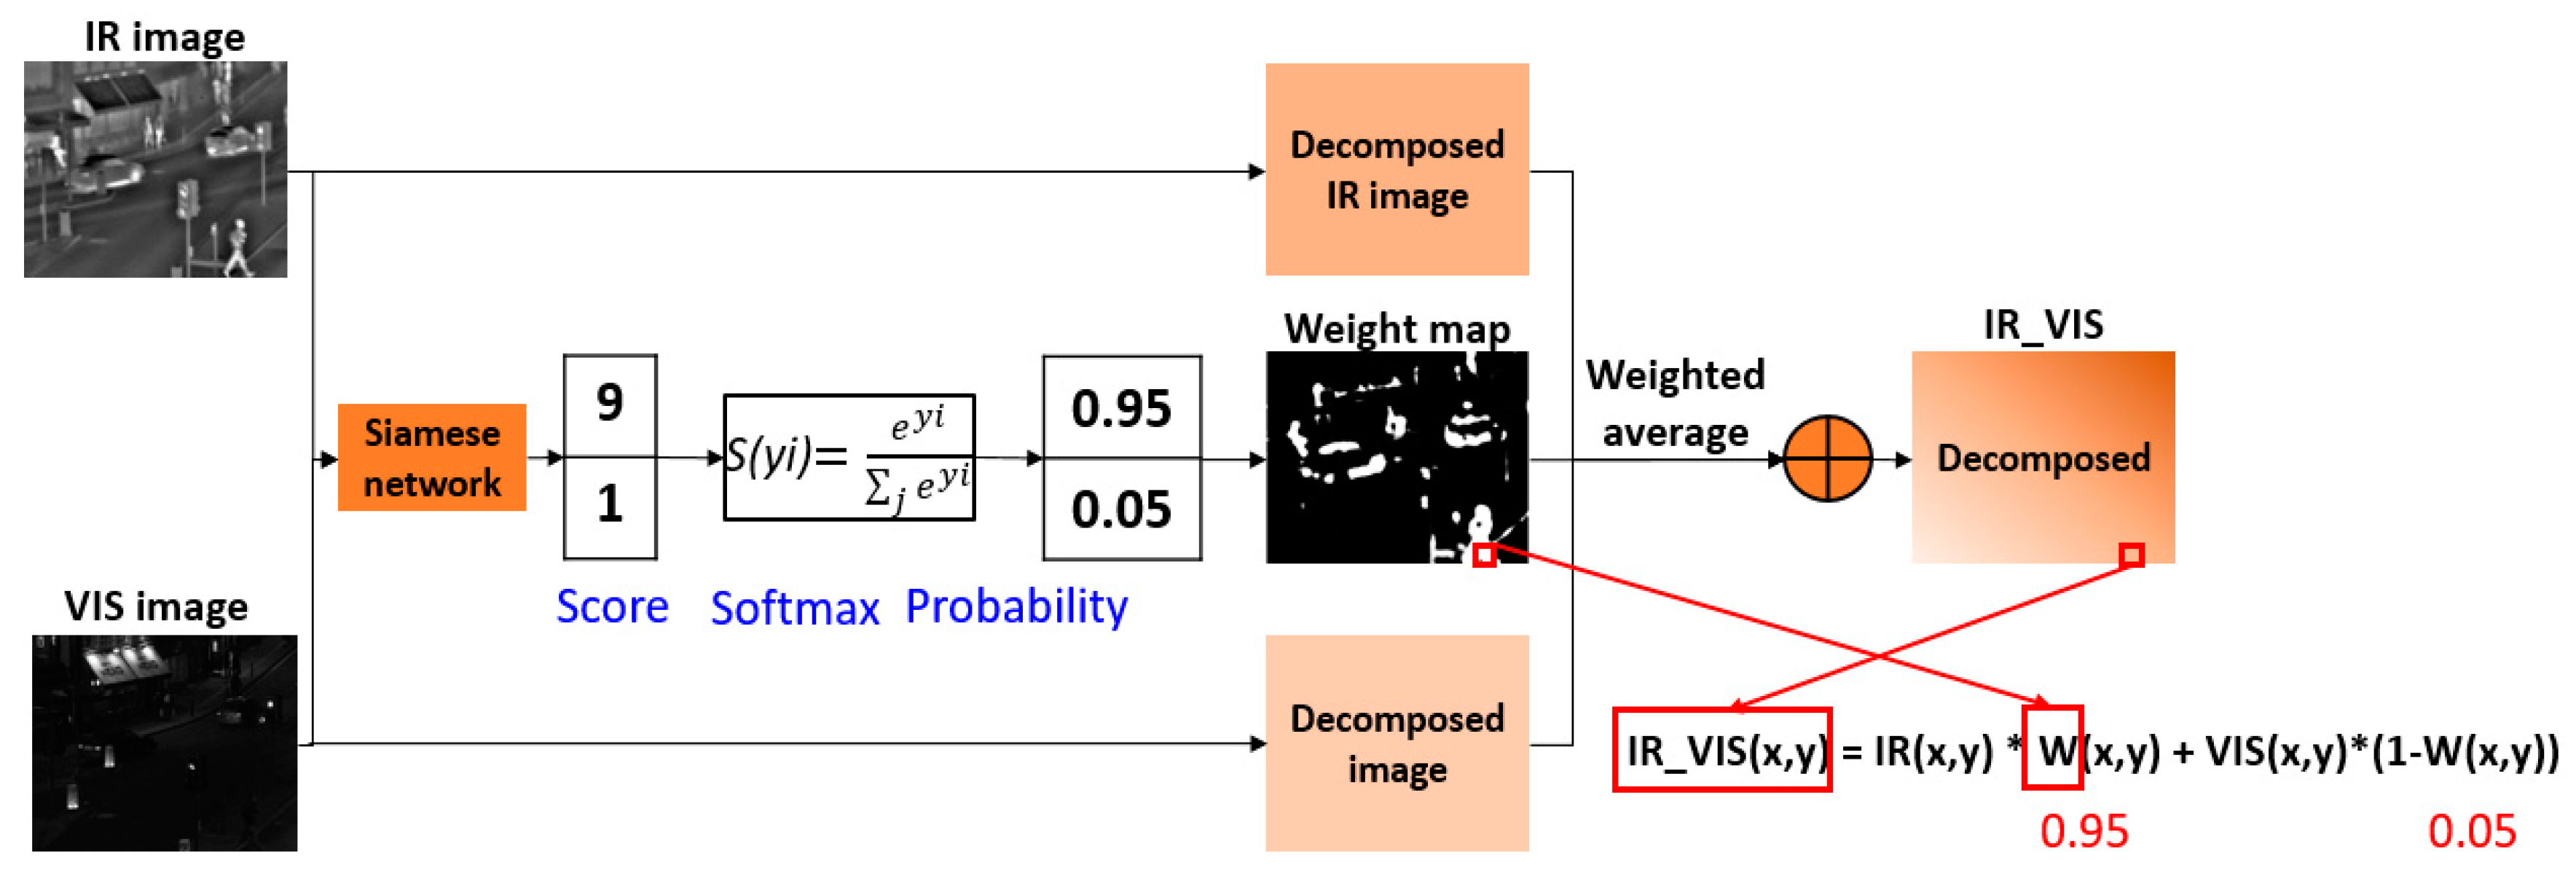
- We designed a CNN based learning scheme to measure the activity measurement and to generate the weight map automatically according to the saliency property of each pixel in the source image pair.
- (2)
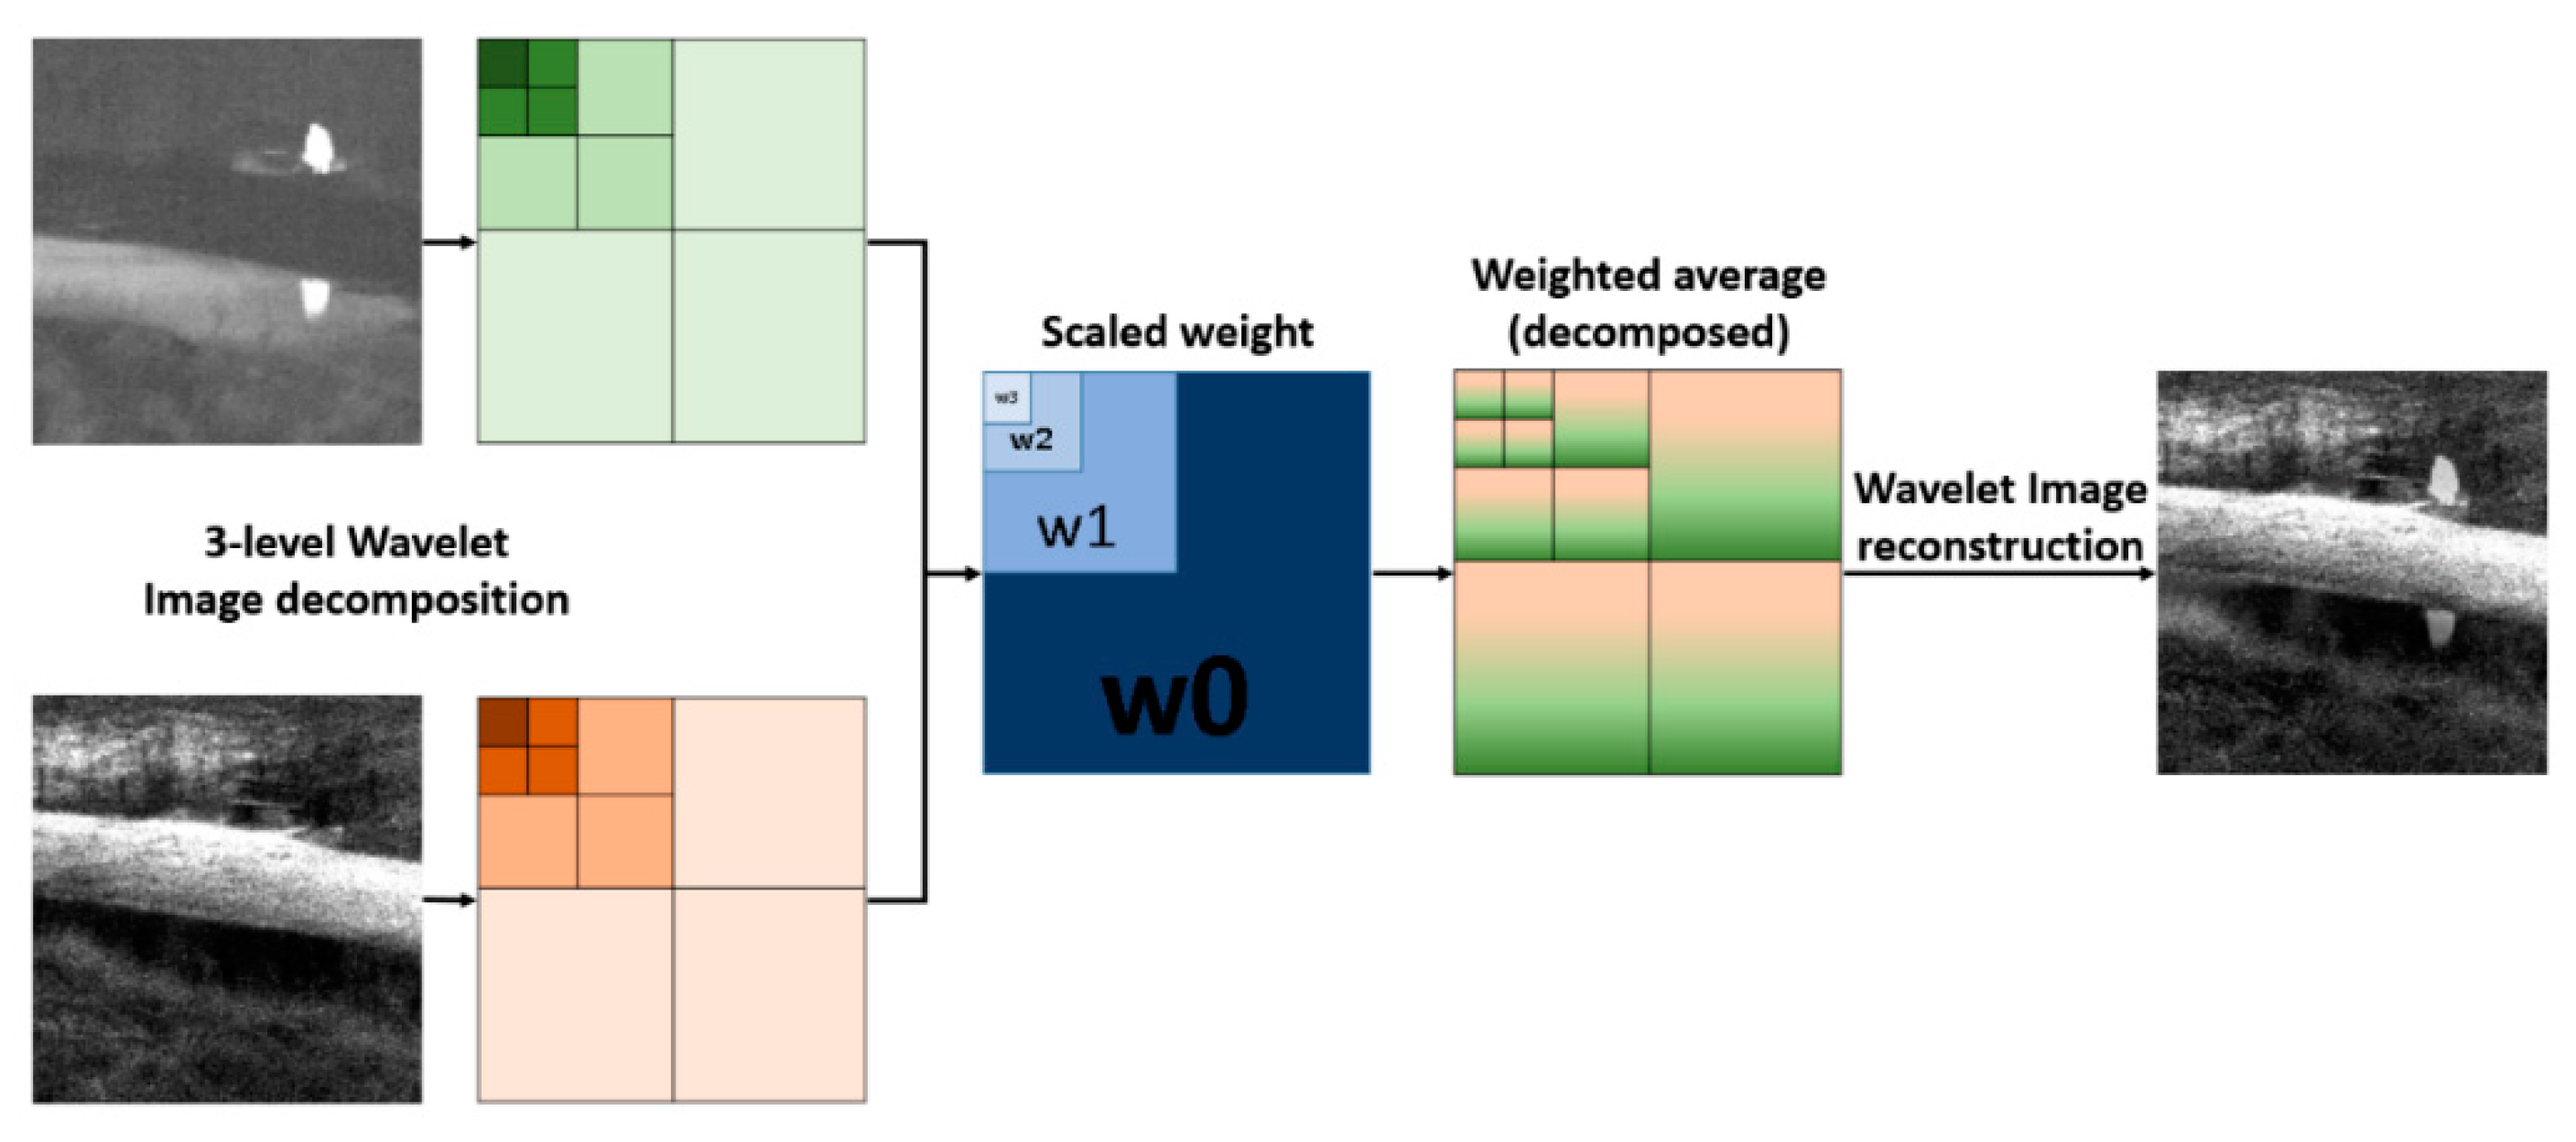
- The source image pairs were decomposed into low and high-frequency sub-bands by using a 3-level wavelet transform, and the fused image was obtained by reconstructing wavelet images with the scaled weight maps. It produced fewer undesirable artifacts for good consistency with human visual perception.
- (3)
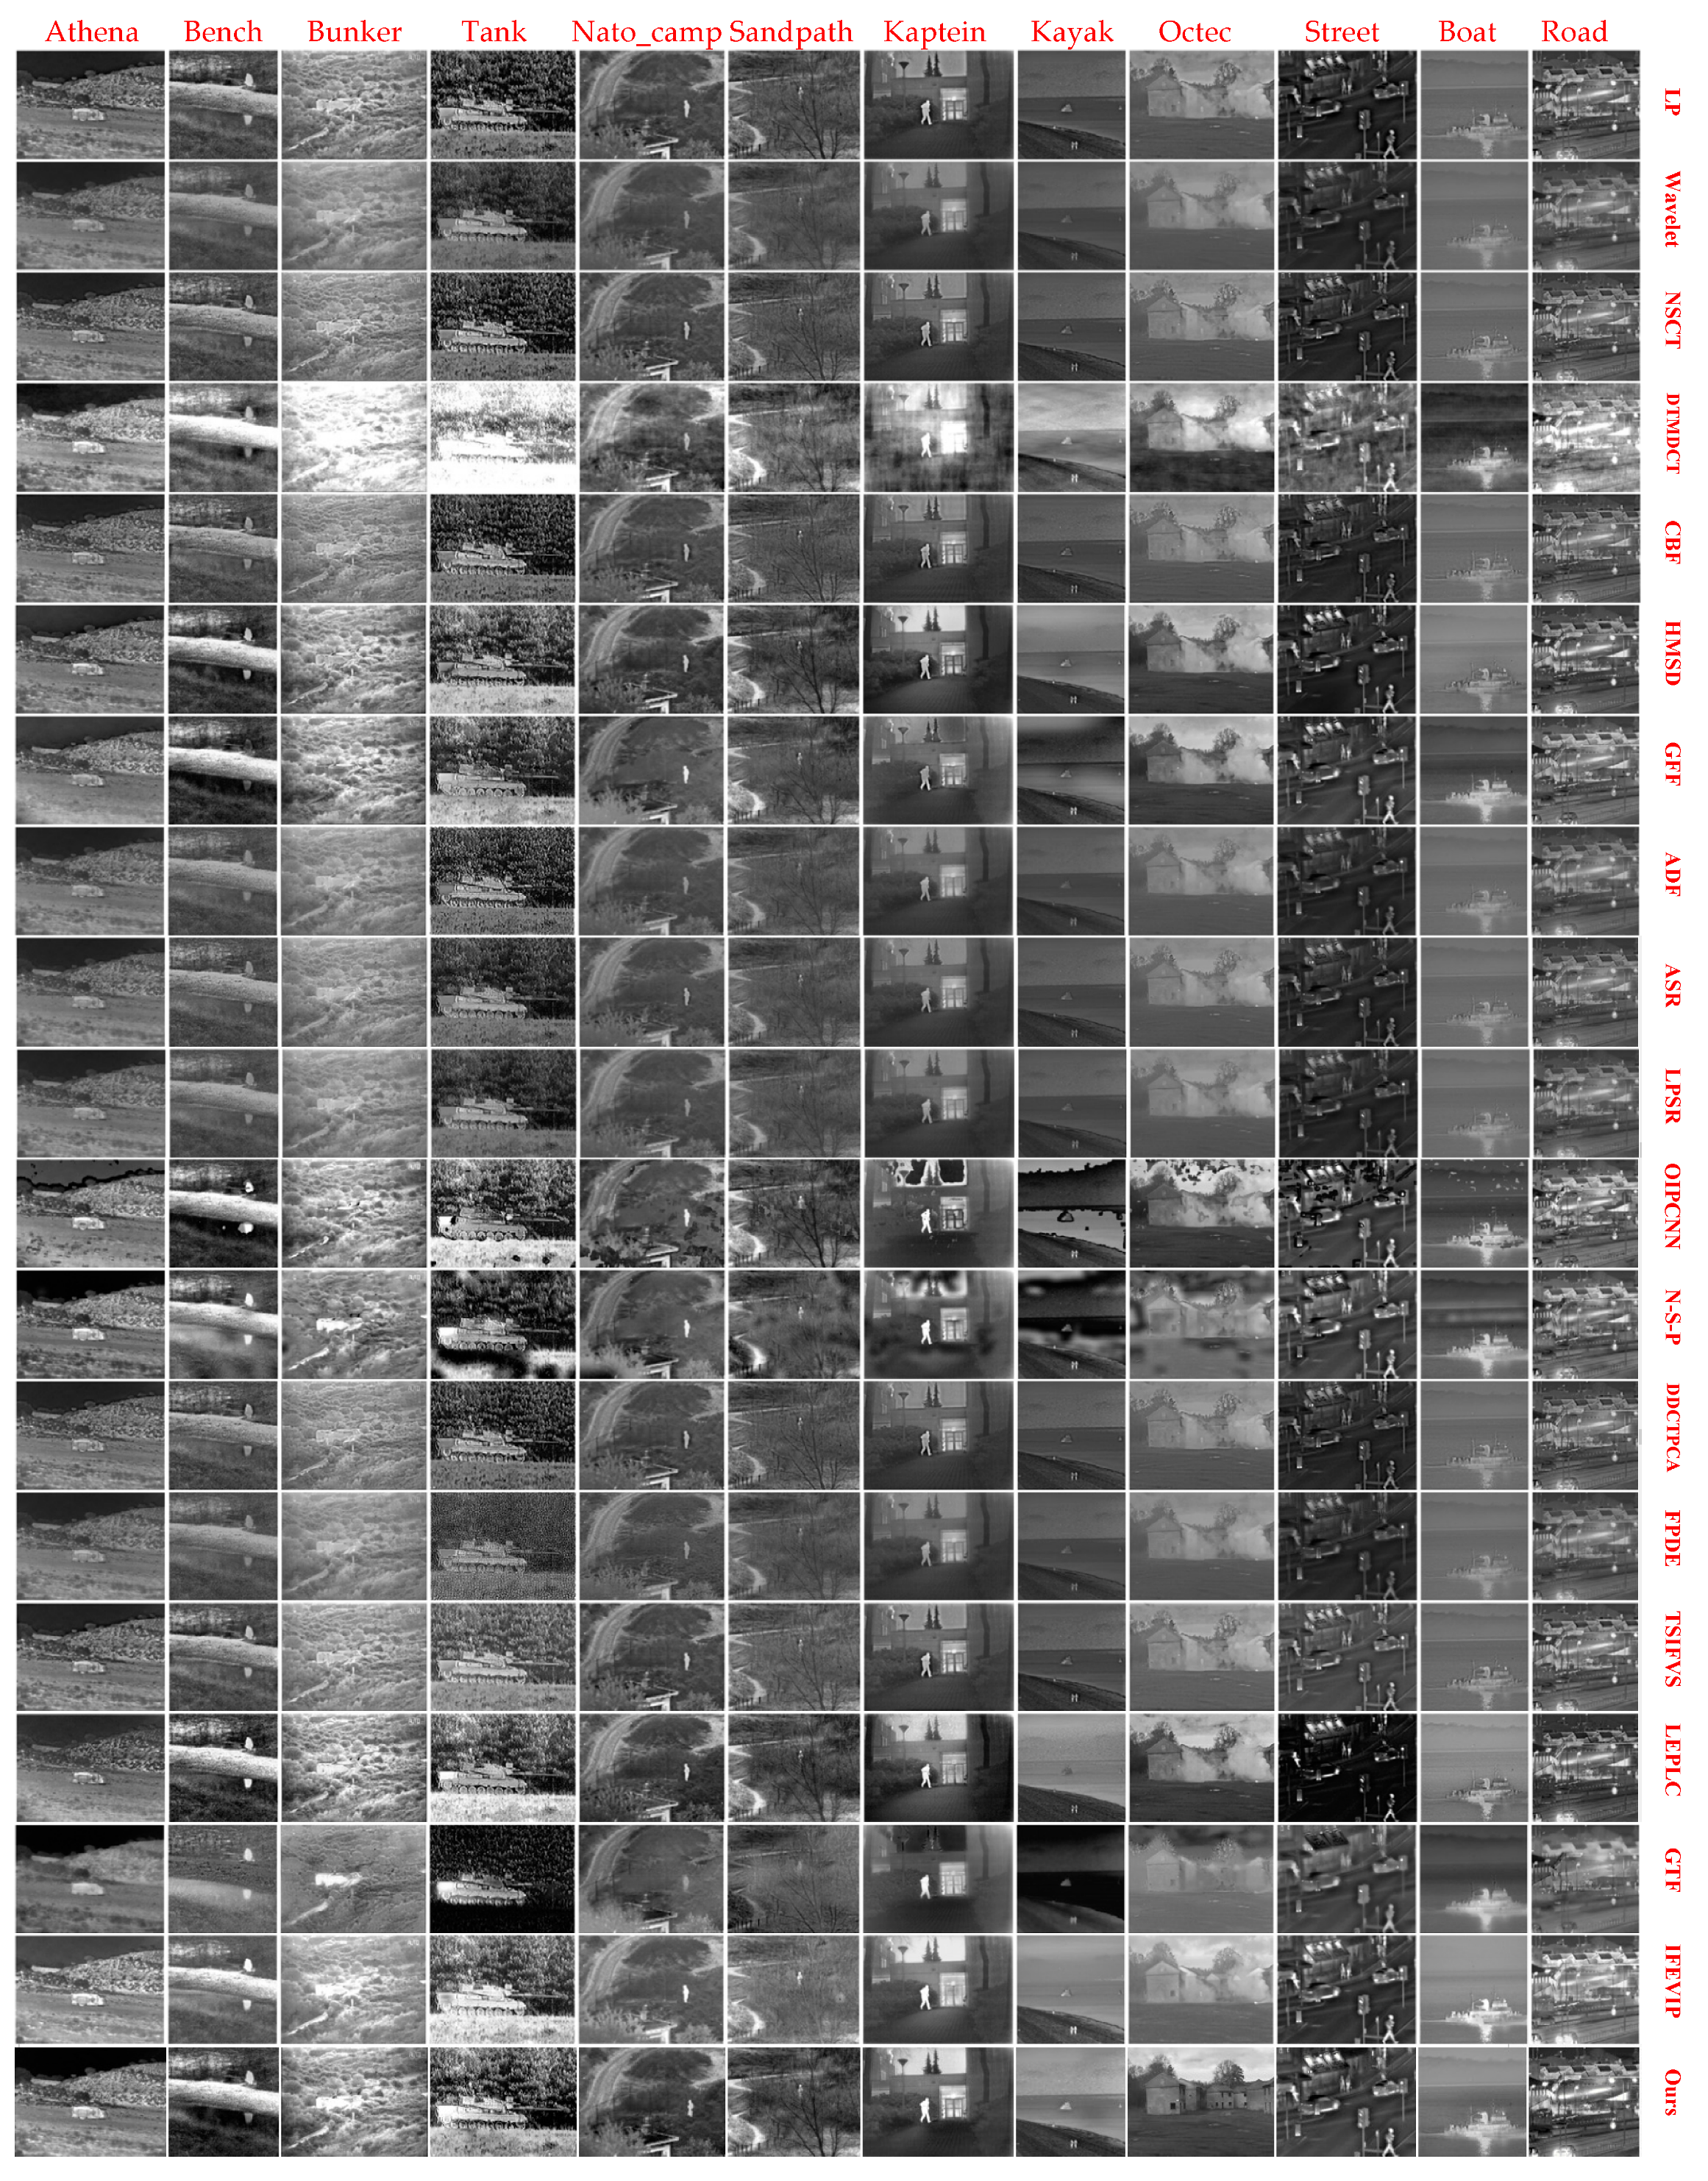
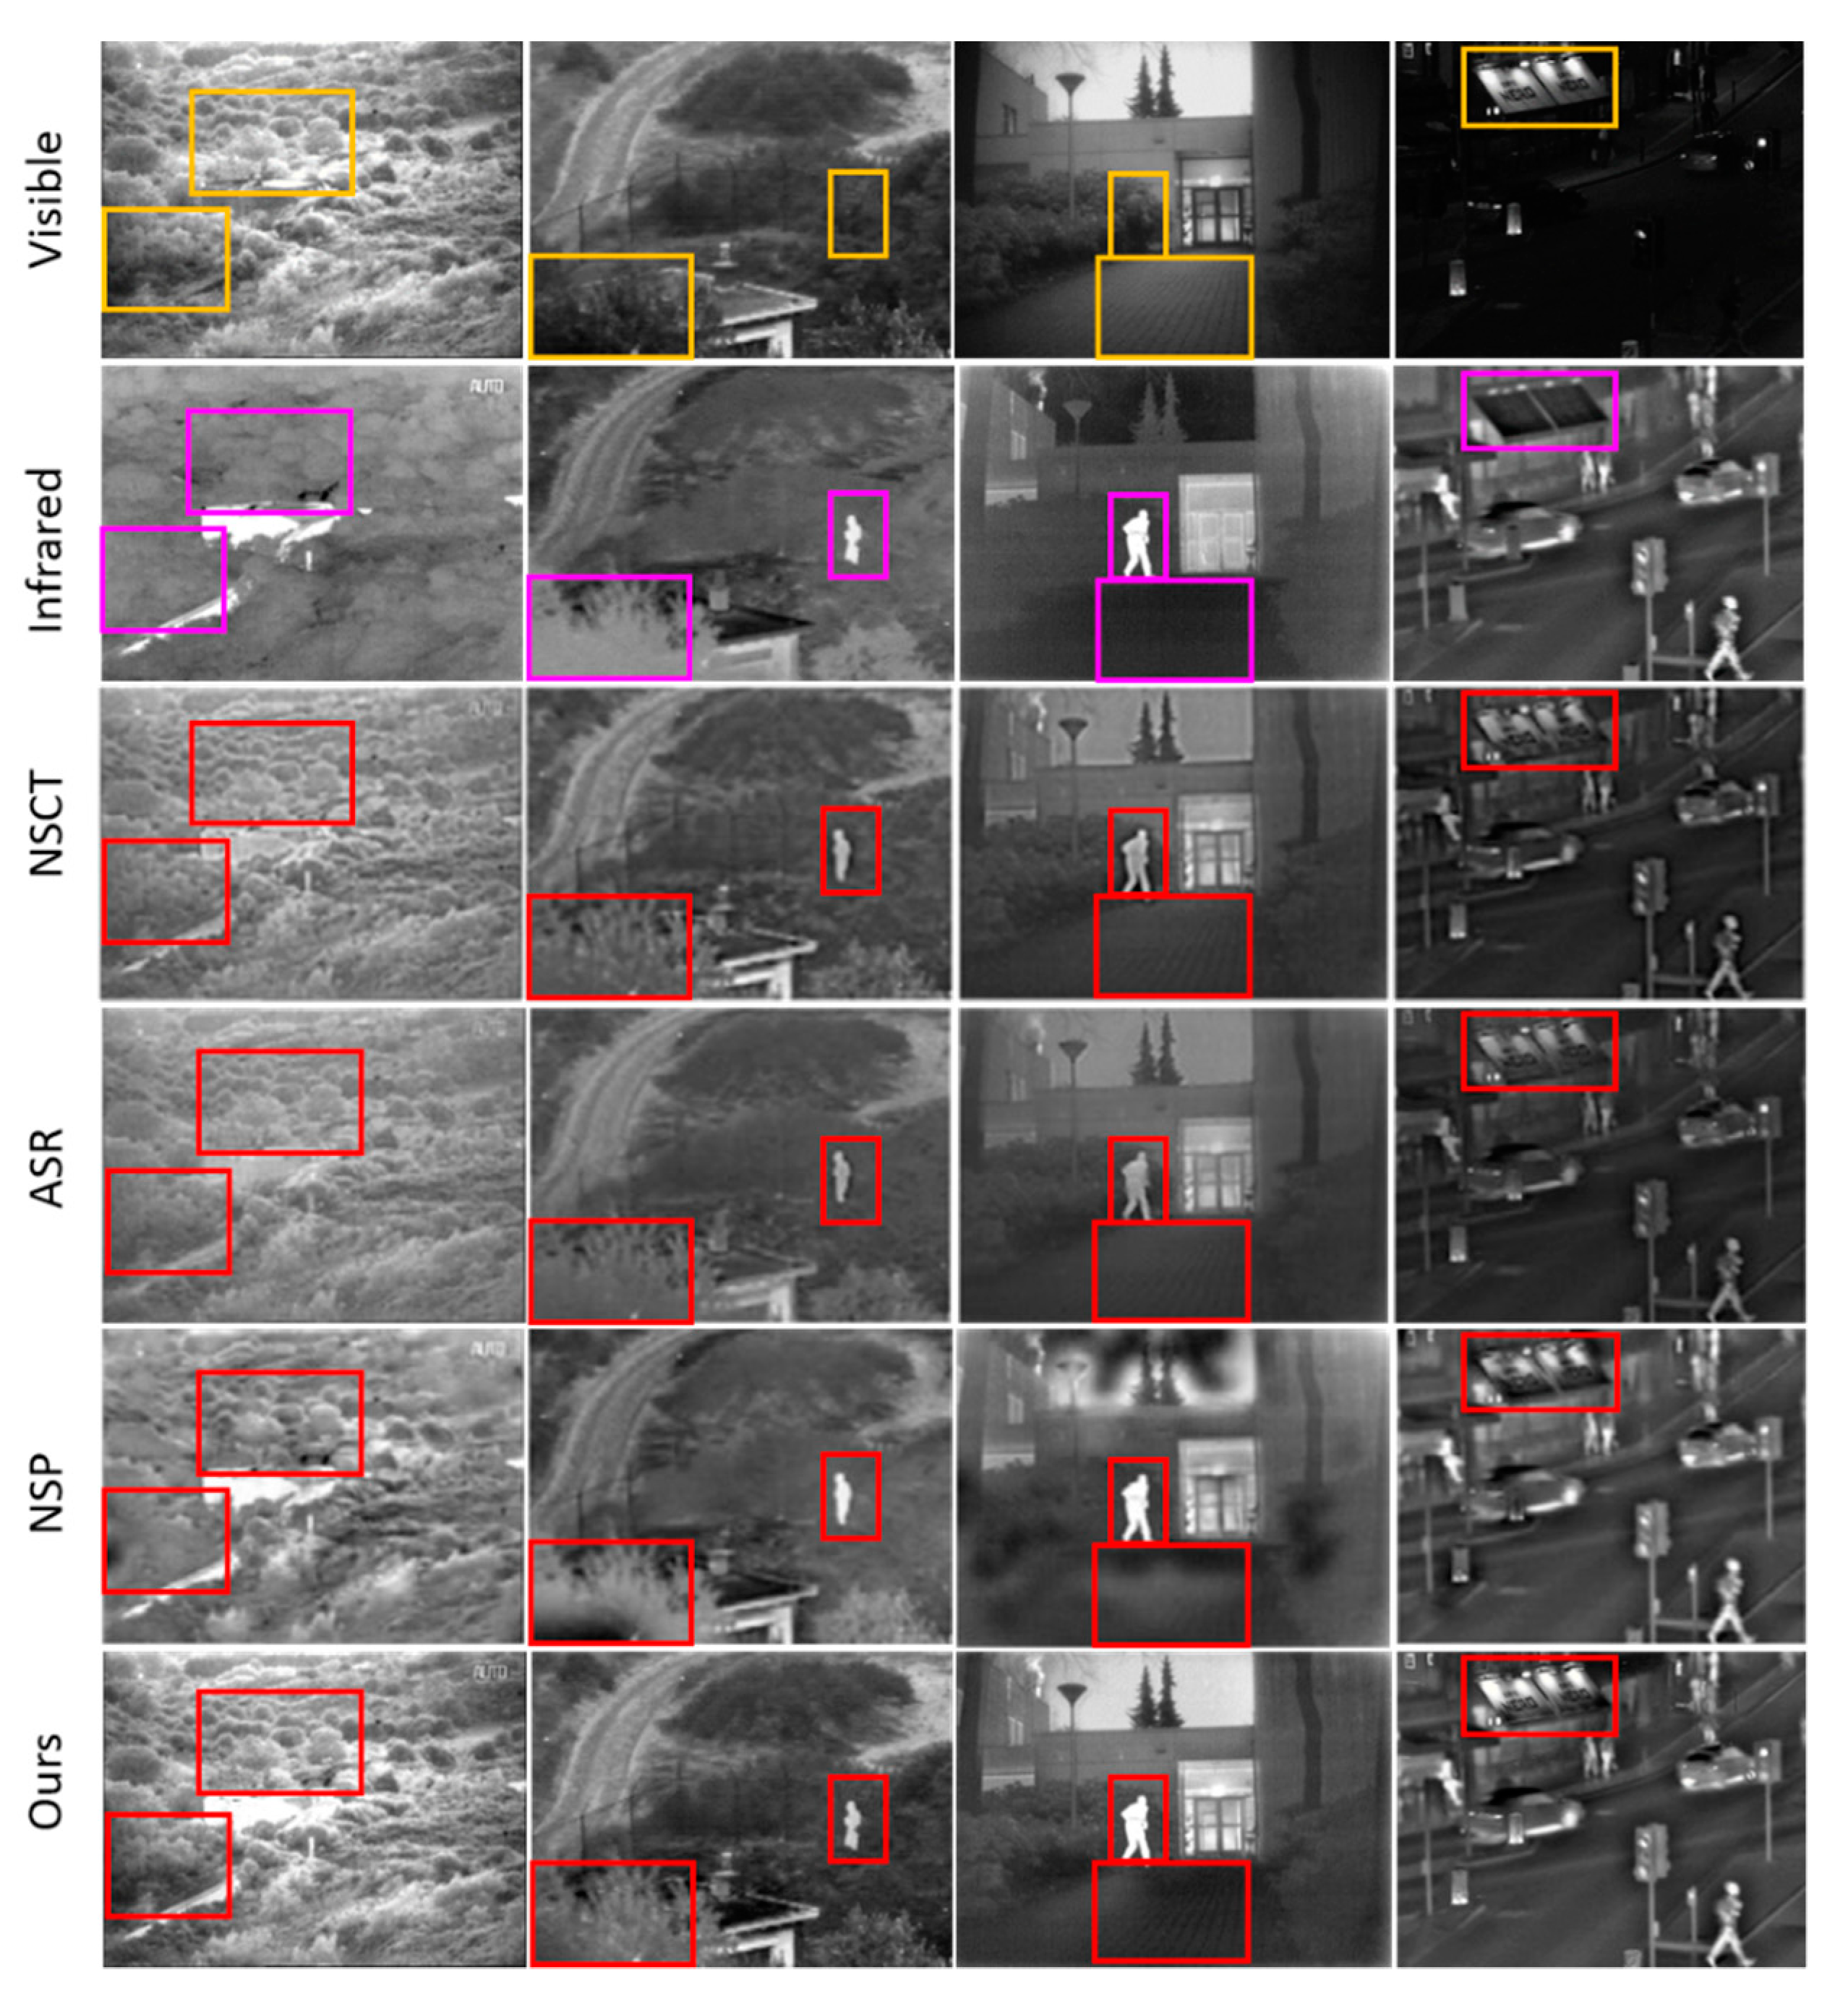
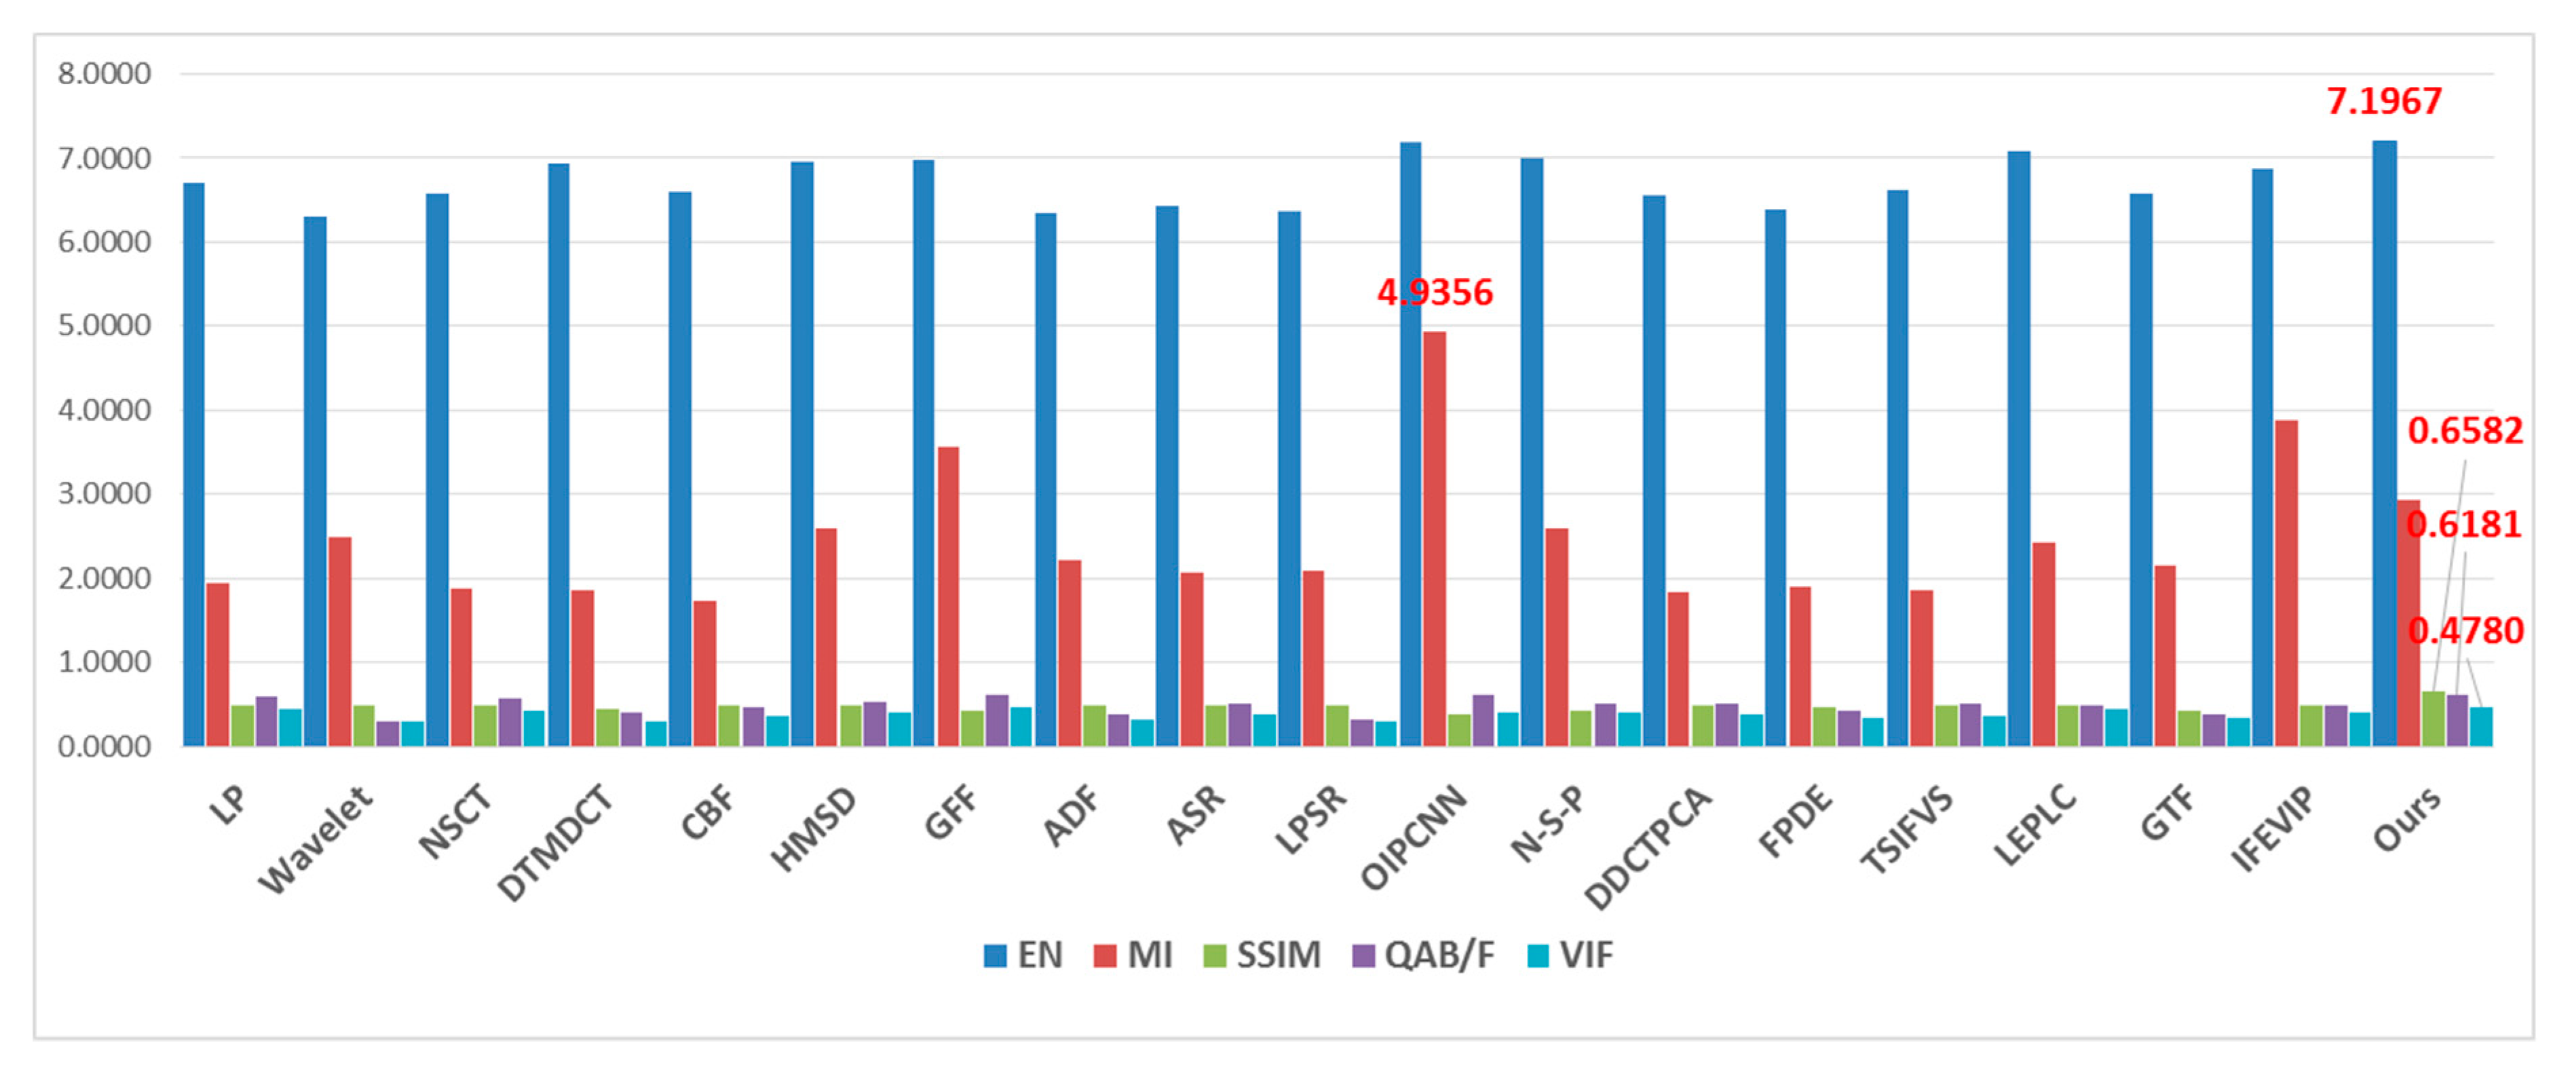
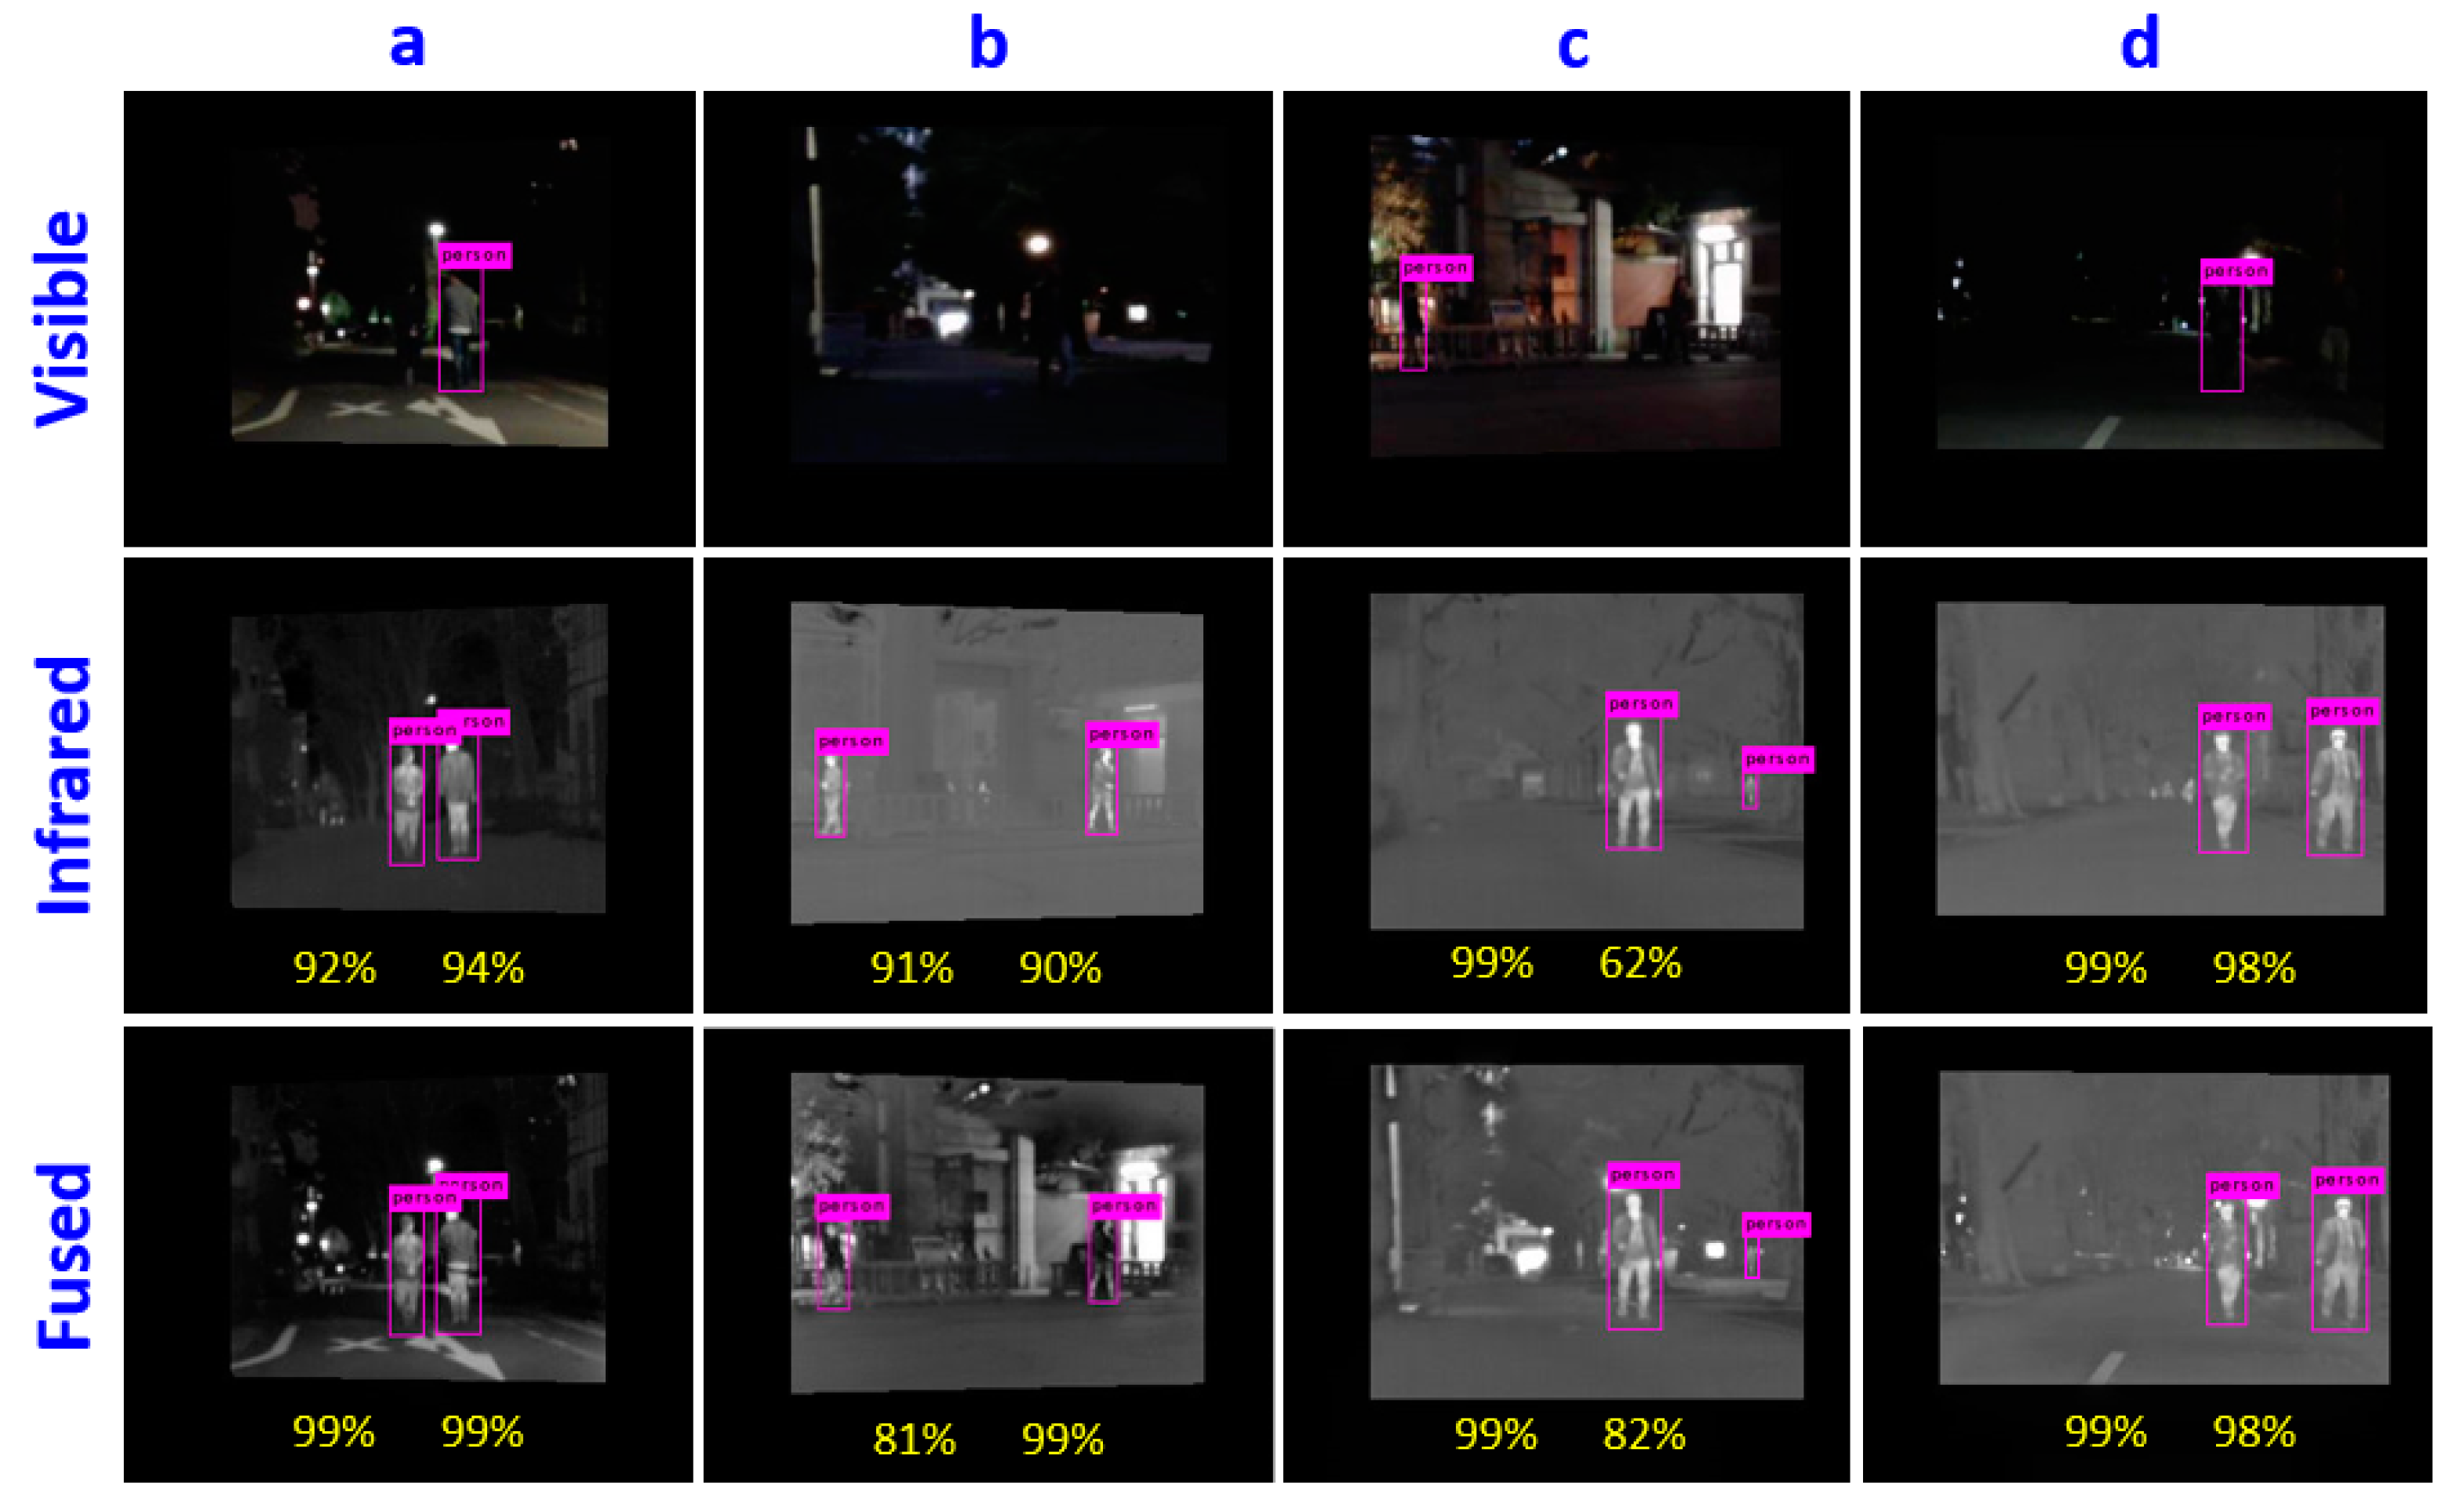
- We analyzed the experimental results systematically on both quantity and quality point of view. Quantitative assessment was carried out on twelve benchmark data, and the results were compared with those of eighteen representative prior art methods. In addition, the visual qualitative effectiveness of the proposed fusion method was evaluated by comparing pedestrian detection results after fusion by using YOLOv3 object detector on a public benchmark dataset.
2. Related Works
3. Fusion Scheme Based on Automatic Activity Level Measurement and Weight Map Generation
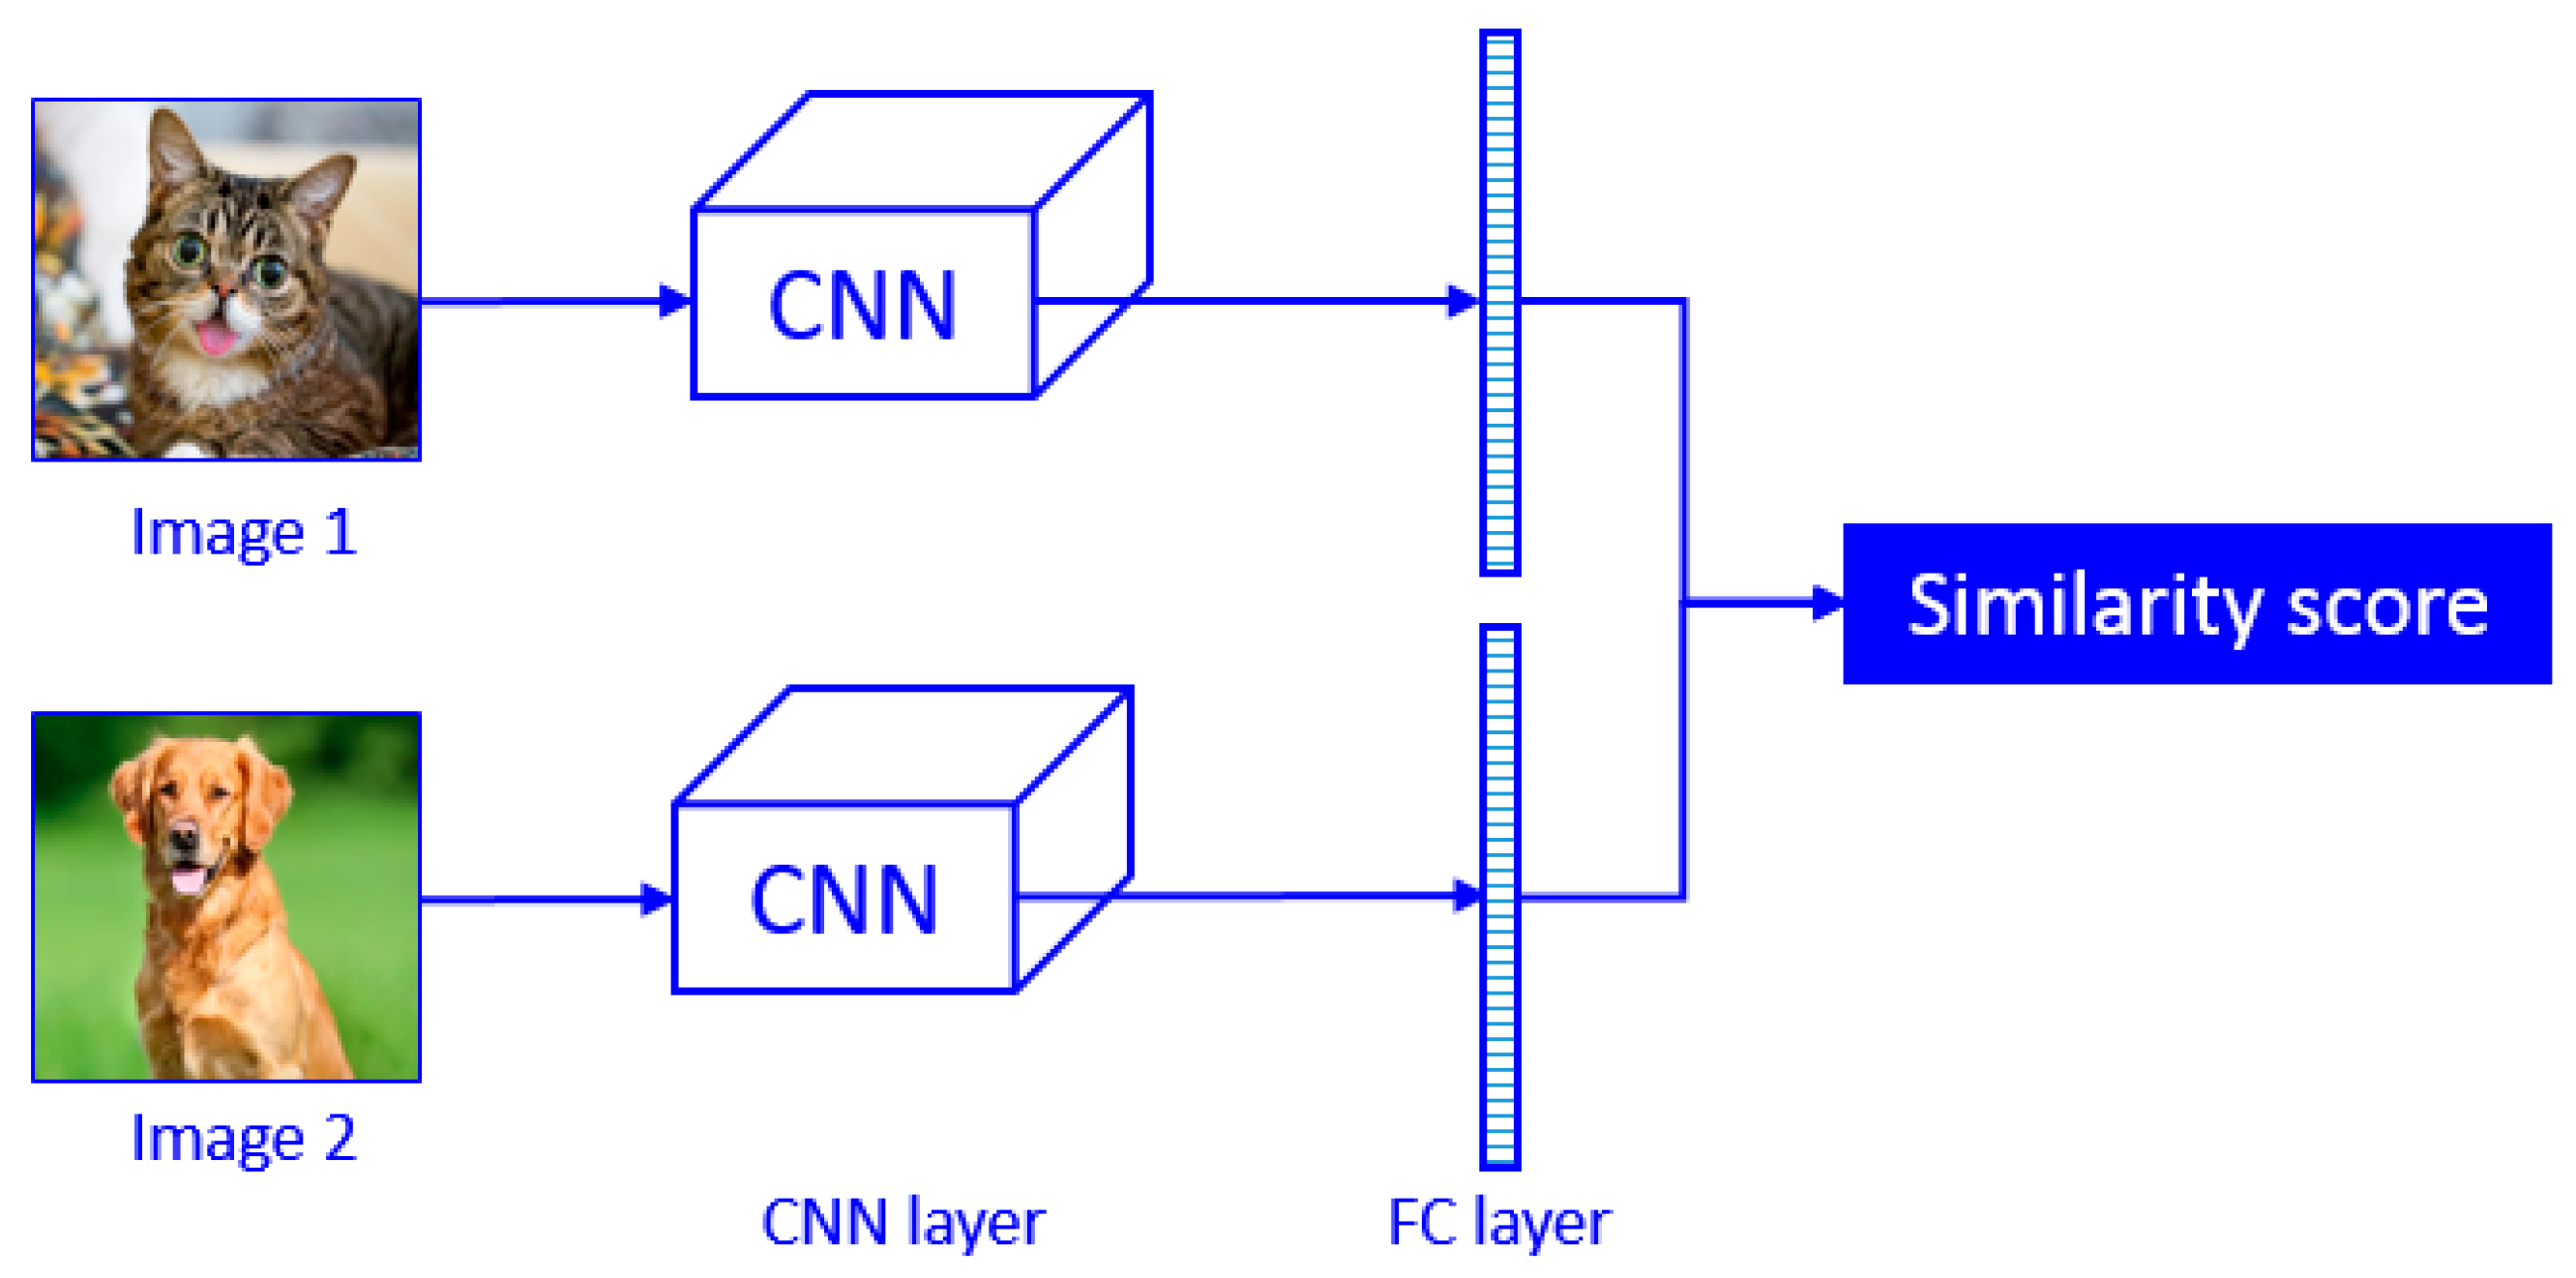
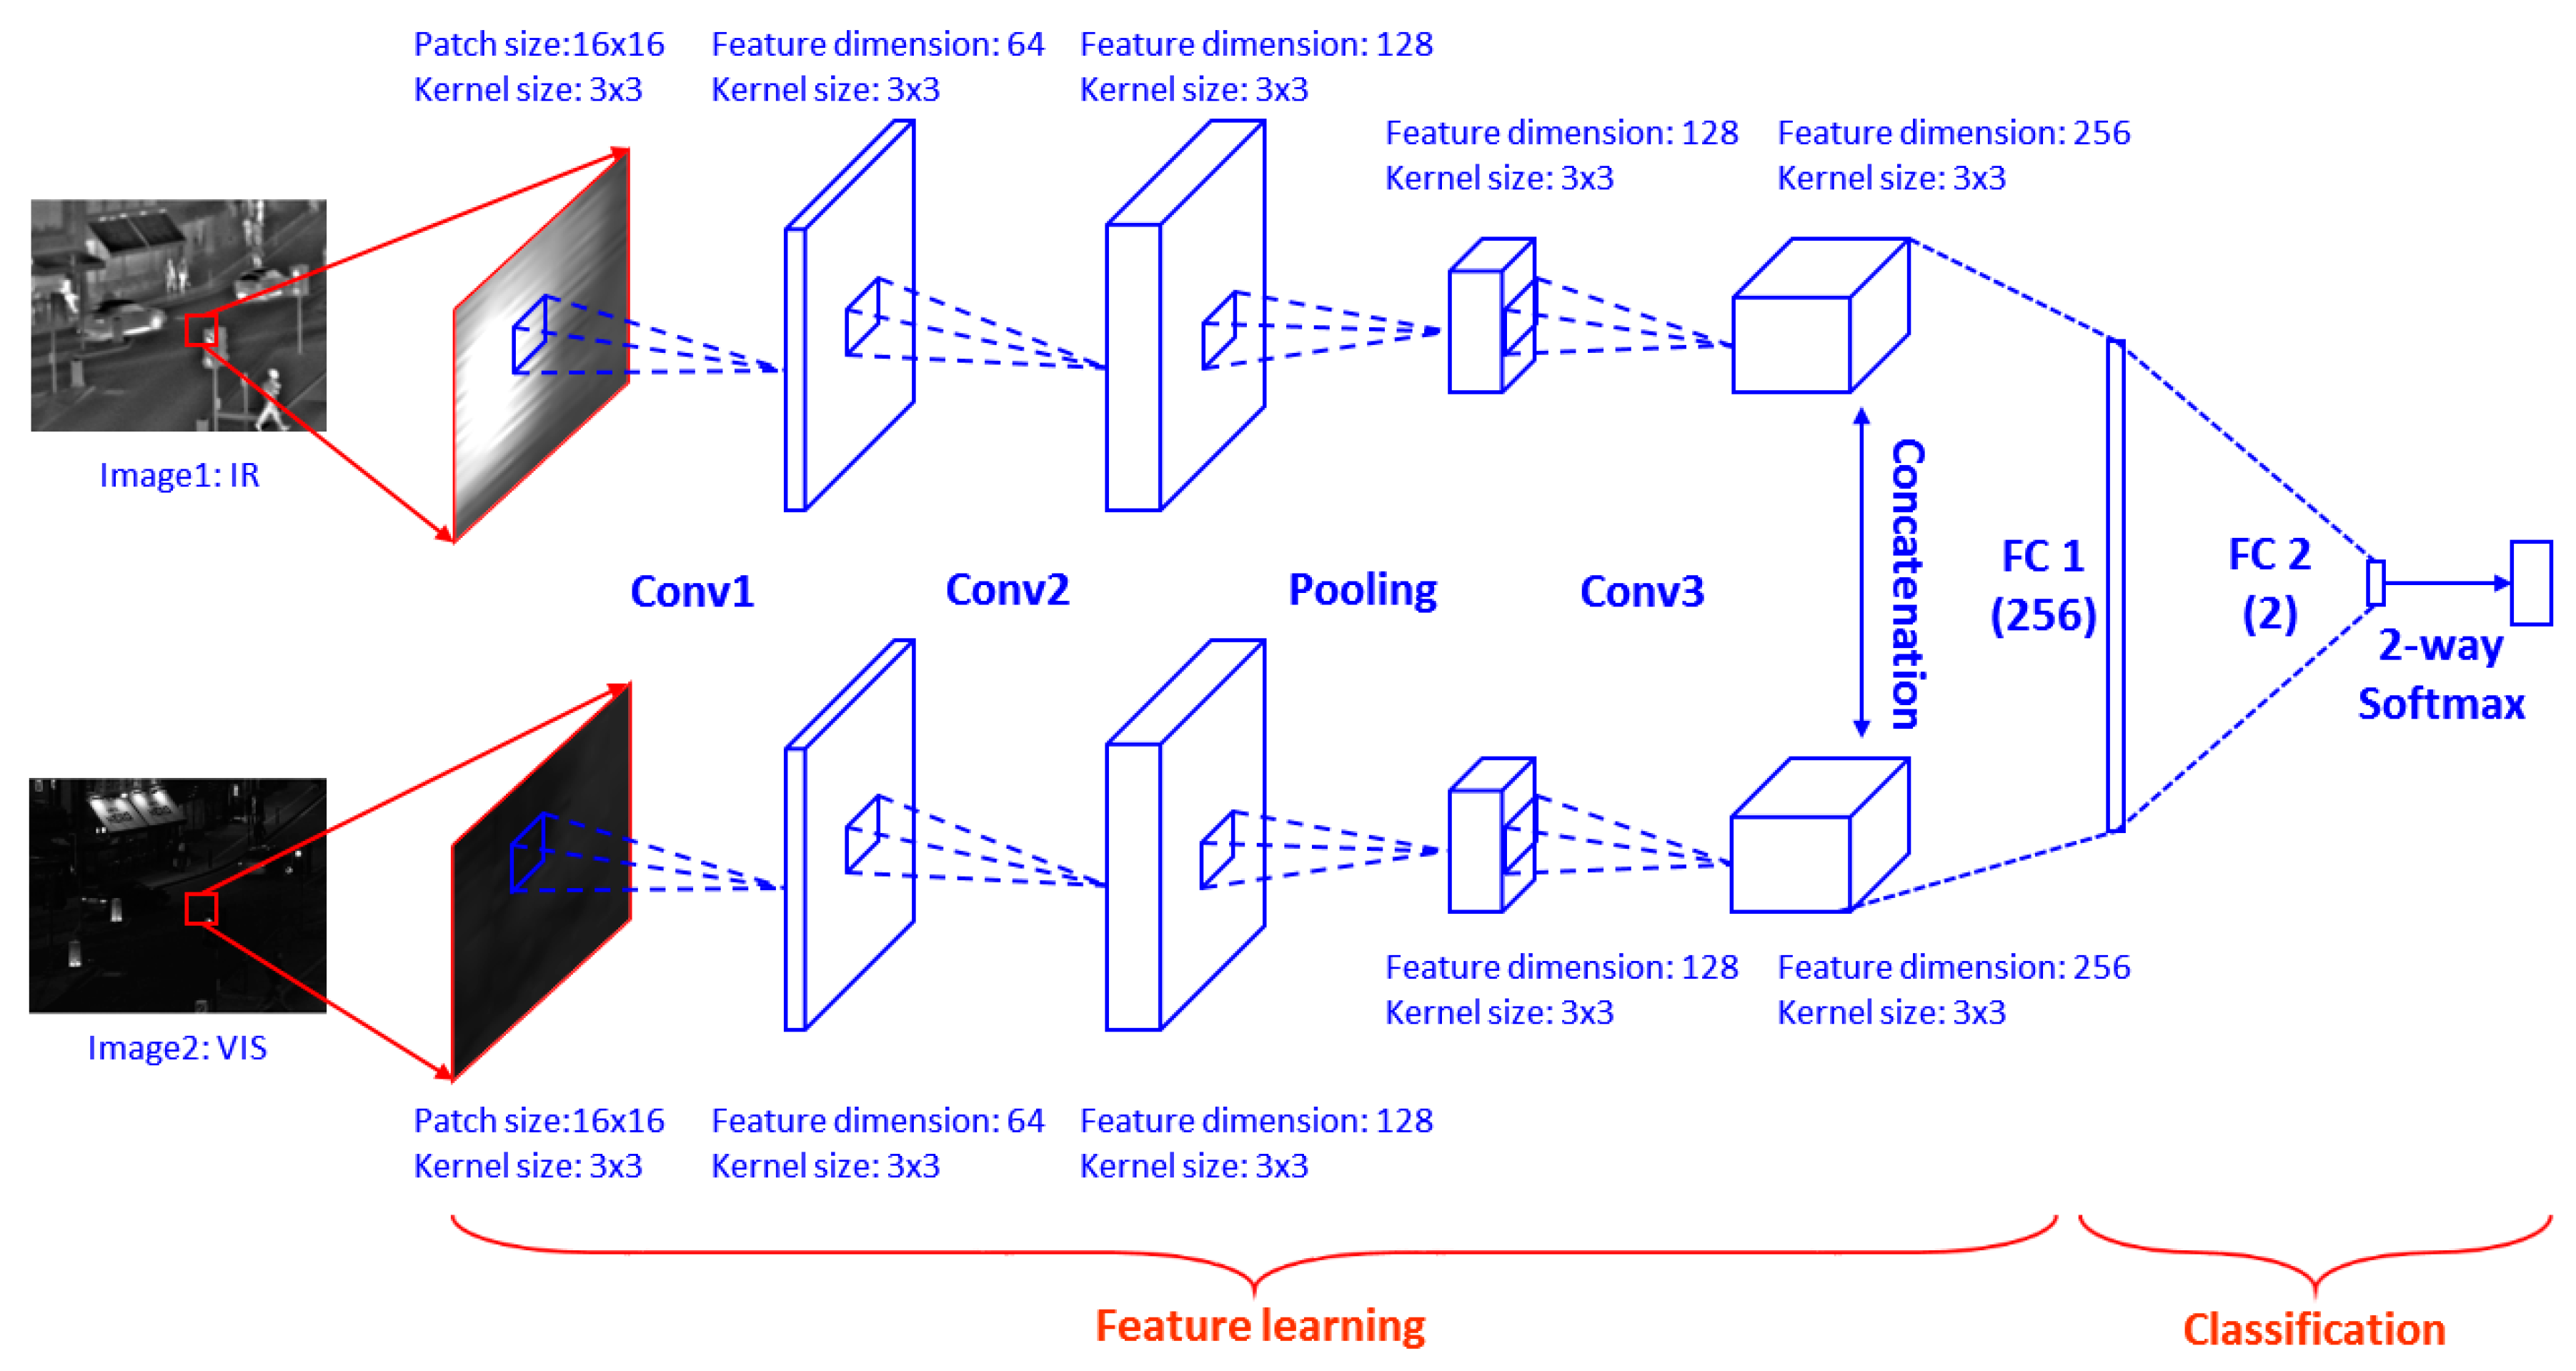
3.1. CNN Design
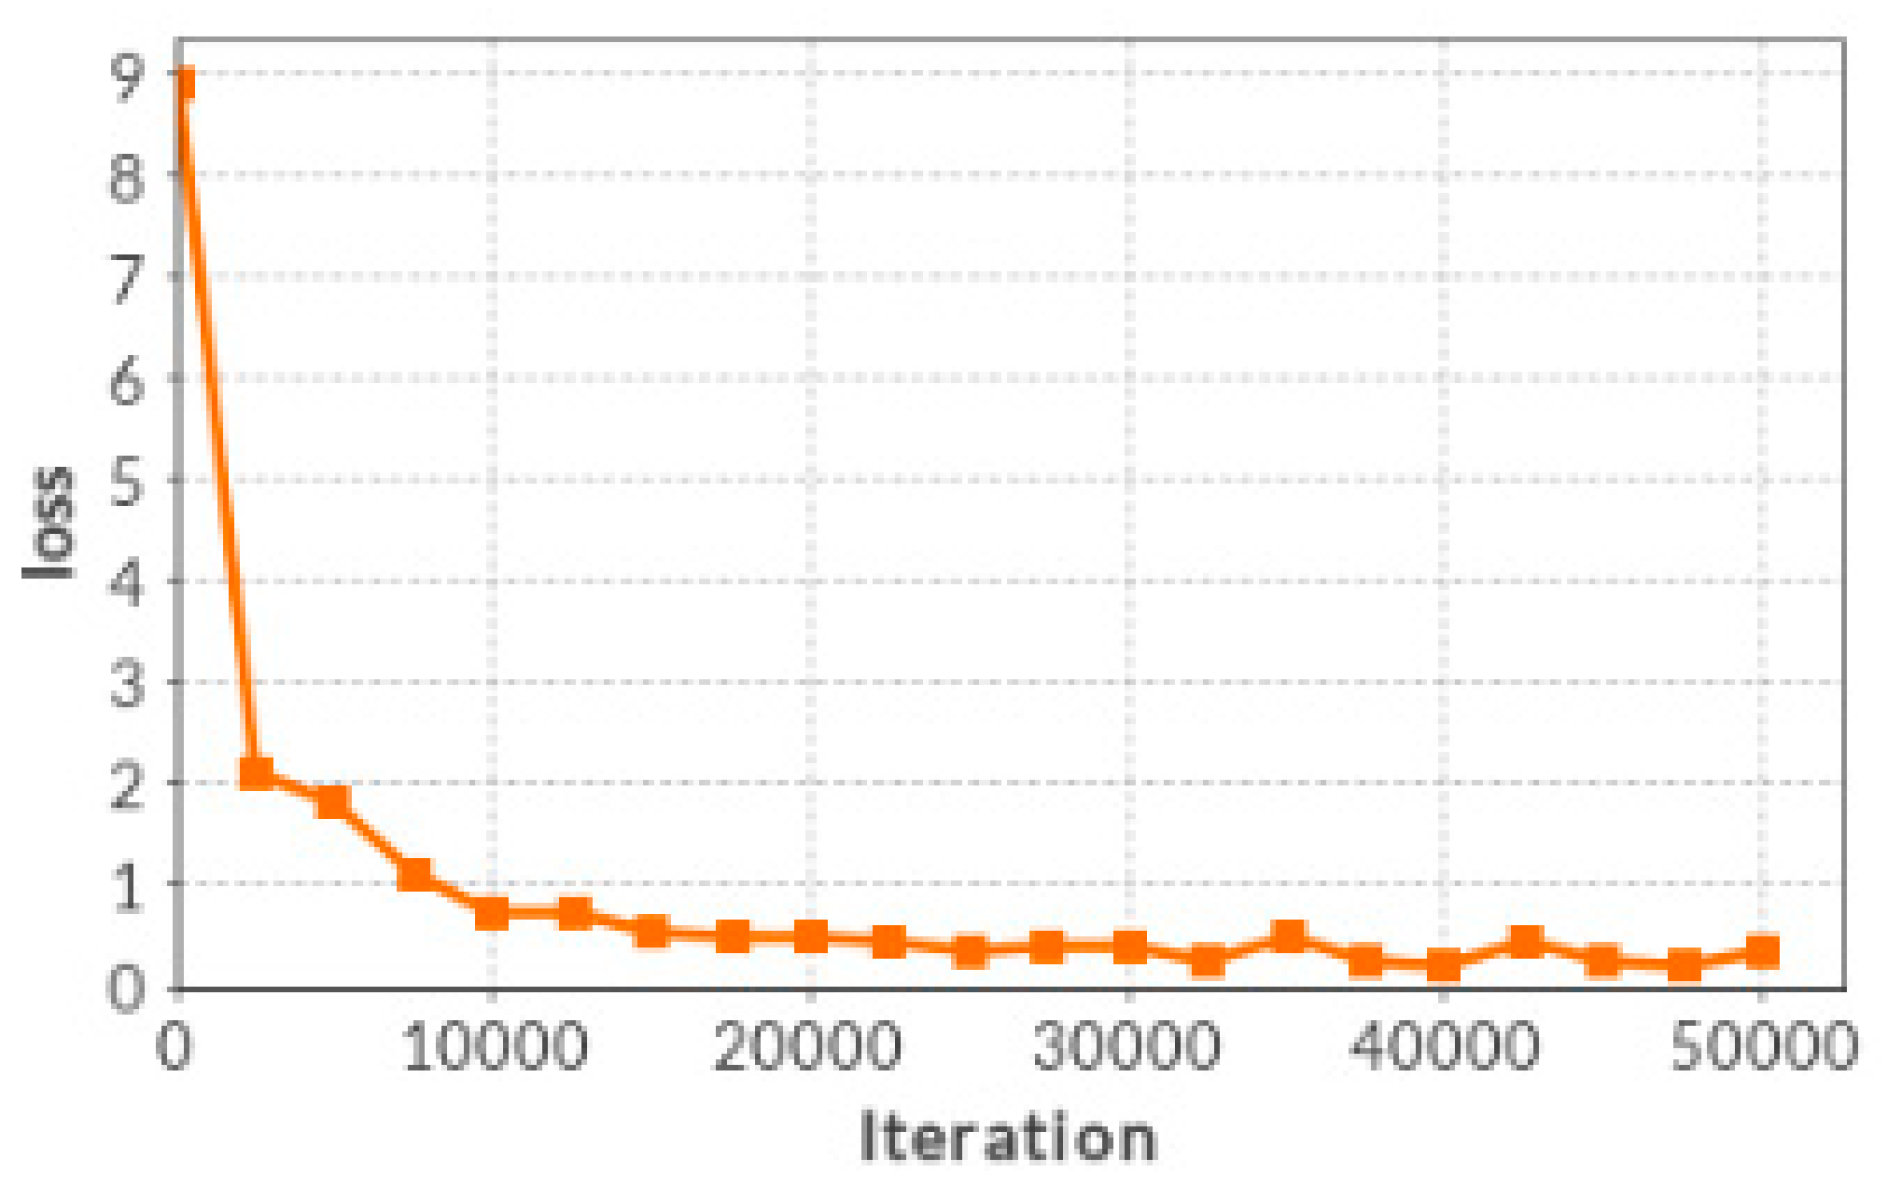
3.2. Training
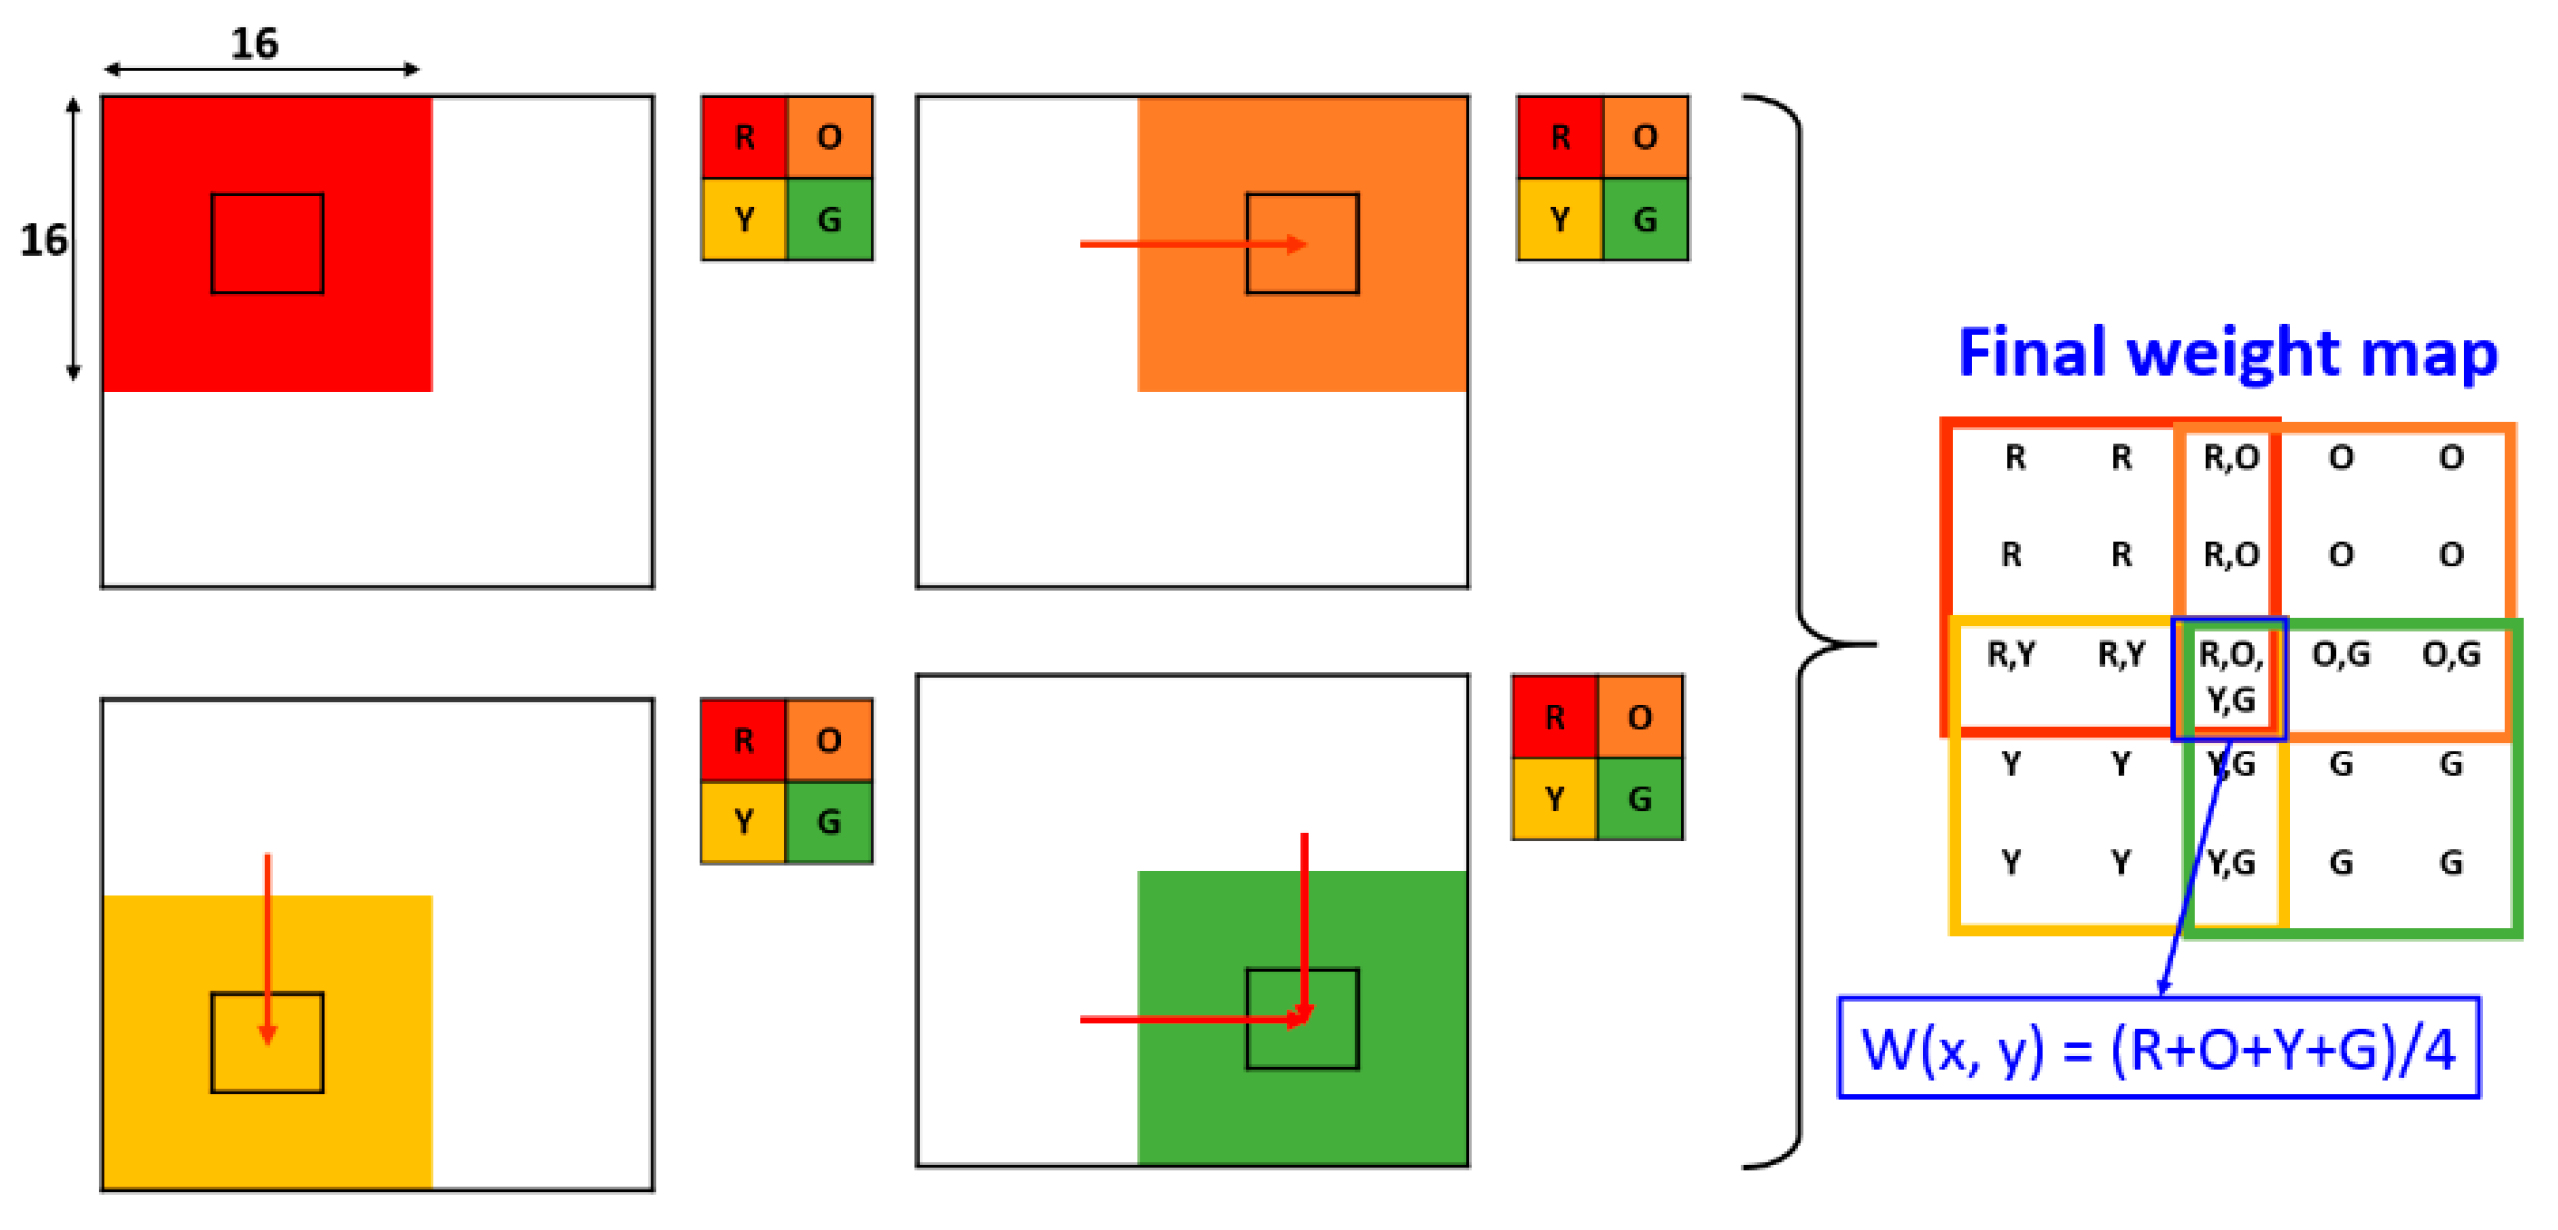
3.3. Final Weight Map Generation and Fusion Scheme
4. Experimental Results
4.1. Benchmark Dataset and Experiment Environment
4.2. Performance Assessment
4.3. Results Analysis
5. Conclusions
Author Contributions
Funding
Conflicts of Interest
References
- Zhang, B.; Lu, X.; Pei, H.; Zhao, Y. A fusion algorithm for infrared and visible images based on saliency analysis and non-subsampled Shearlet transform. Infrared Phys. Technol. 2015, 73, 286–297. [Google Scholar] [CrossRef]
- Jin, H.; Wang, Y. A fusion method for visible and infrared images based on contrast pyramid with teaching learning based optimization. Infrared Phys. Technol. 2014, 64, 134–142. [Google Scholar] [CrossRef]
- Cui, G.; Feng, H.; Xu, Z.; Li, Q.; Chen, Y. Detail preserved fusion of visible and infrared images using regional saliency extraction and multi-scale image decomposition. Opt. Commun. 2015, 341, 199–209. [Google Scholar] [CrossRef]
- Fan, X.; Shi, P.; Ni, J.; Li, M. A thermal infrared and visible images fusion based approach for multi target detection under complex environment. Math. Probl. Eng. 2015. [Google Scholar] [CrossRef]
- Du, J.; Li, W.; Xiao, B.; Nawaz, Q. Union Laplacian pyramid with multiple features for medical image fusion. Neurocomputing 2016, 194, 326–339. [Google Scholar] [CrossRef]
- Toet, A. A morphological pyramidal image decomposition. Pattern Recognit. Lett. 1989, 9, 255–261. [Google Scholar] [CrossRef]
- Singh, R.; Khare, A. Fusion of multimodal medical images using Daubechies complex wavelet transform c a multiresolution approach. Inf. Fusion 2014, 19, 49–60. [Google Scholar] [CrossRef]
- Li, H.; Manjunath, B.; Mitra, S. Multi sensor image fusion using the wavelet transform. Graph. Models Image Process. 1995, 57, 235–245. [Google Scholar] [CrossRef]
- Lewis, J.; Callaghan, O.; Nikolov, S.; Bull, D.; Canagarajah, N. Pixel- and region-based image fusion with complex wavelets. Inf. Fusion 2007, 8, 119–130. [Google Scholar] [CrossRef]
- Yang, L.; Guo, B.; Ni, W. Multimodality medical image fusion based on multiscale geometric analysis of contourlet transform. Neurocomputing 2008, 72, 203–211. [Google Scholar] [CrossRef]
- Zheng, L.; Bhatnagar, G.; Wu, Q. Directive contrast based multimodal medical image fusion in nsct domain. IEEE Trans. Multimedia 2013, 15, 1014–1024. [Google Scholar]
- Wang, L.; Li, B.; Tan, L. Multimodal medical volumetric data fusion using 3-d discrete shearlet transform and global-to-local rule. IEEE Trans. Biomed. Eng. 2014, 61, 197–206. [Google Scholar] [CrossRef]
- Yang, B.; Li, S. Pixel-level image fusion with simultaneous orthogonal matching pursuit. Inf. Fusion 2012, 13, 10–19. [Google Scholar] [CrossRef]
- Li, S.; Yin, H.; Fang, L. Group-sparse representation with dictionary learning for medical image denoising and fusion. IEEE Trans. Biomed. Eng. 2012, 59, 3450–3459. [Google Scholar] [CrossRef]
- Liu, Y.; Wang, Z. Simultaneous image fusion and denosing with adaptive sparse representation. IET Image Process. 2015, 9, 347–357. [Google Scholar] [CrossRef]
- Ma, J.; Yu, W.; Liang, P.; Li, C.; Jiang, J. FusionGAN: A generative adversarial network for infrared and visible image fusion. Inf. Fusion 2019, 48, 11–26. [Google Scholar] [CrossRef]
- Shen, R.; Cheng, I.; Basu, A. Cross-scale coefficient selection for volumetric medical image fusion. IEEE Trans. Biomed. Eng. 2013, 60, 1069–1079. [Google Scholar] [CrossRef]
- Liu, Y.; Liu, S.; Wang, Z. A general framework for image fusion based on multi-scale transform and sparse representation. Inf. Fusion 2015, 24, 147–164. [Google Scholar] [CrossRef]
- LeCun, Y.; Bottou, L.; Bengio, Y.; Haffner, P. Gradient-based leaning applied to document recognition. Proc. IEEE 1998, 86, 2278–2324. [Google Scholar] [CrossRef]
- Jin, X.; Jiang, Q.; Yao, S.; Zhou, D.; Nie, R.; Hai, J.; He, K. A survey of infrared and visible image fusion methods. Infrared Phys. Technol. 2017, 85, 478–501. [Google Scholar] [CrossRef]
- DLP: Deep Learning Platform. Available online: http://www.ai-dlp.com/ (accessed on 1 March 2019).
- Glorot, X.; Bengio, Y. Understanding the difficulty of training deep feedforward neural networks. In Proceedings of the thirteenth International Conference on Artificial Intelligence and Statistics, Sardinia, Italy, 13–15 May 2010. [Google Scholar]
- Liu, J.; Yin, Q.; Guo, P. A New Strategy to Improve Image Fusion Effect. In Proceedings of the 2016 International Conference on Machine Learning and Cybernetics, Dalian, China, 13–16 August 2006; pp. 3770–3775. [Google Scholar]
- FigShare. Available online: https://figshare.com/articles/TNO_Image_Fusion_Dataset/1008029 (accessed on 1 March 2019).
- OTCBVS Benchmark Dataset Collection. Available online: http://vcipl-okstate.org/pbvs/bench/ (accessed on 1 March 2019).
- Multispectral Object Detection Dataset. Available online: https://www.mi.t.u-tokyo.ac.jp/projects/mil_multispectral/ (accessed on 1 March 2019).
- YOLO: Real-Time Object Detection. Available online: https://pjreddie.com/darknet/yolo/ (accessed on 1 March 2019).
- Han, Y.; Cai, Y.; Cao, Y.; Xu, X. A new image fusion performance metric based on visual information fidelity. Inf. Fusion 2013, 14, 127–135. [Google Scholar] [CrossRef]
- Chen, Y.; Blum, R. A new automated quality assessment algorithm for image fusion. Image Vis. Comput. 2009, 27, 1421–1432. [Google Scholar] [CrossRef]
- Roberts, J.; Van Aardt, J.; Ahmed, F. Assessment of image fusion procedures using entropy, image quality, and multispectral classification. J. Appl. Remote Sens. 2008, 2, 023522. [Google Scholar]
- Qu, G.; Zhang, D.; Yan, P. Information measure for performance of image fusion. Electron. Lett. 2002, 38, 313–315. [Google Scholar] [CrossRef]
- Wang, Z.; Bovik, A. A universal image quality index. IEEE Signal Process. Lett. 2002, 9, 81–84. [Google Scholar] [CrossRef]
- Ma, J.; Ma, Y.; Li, C. Infrared and visible image fusion methods and applications: A survey. Inf. Fusion 2019, 14, 153–178. [Google Scholar] [CrossRef]


| Layer | Patch Size | Kernel Size | Stride | Feature Dimension |
|---|---|---|---|---|
| Conv 1 | 16 × 16 | 3 × 3 | 1 | 64 |
| Conv 2 | 16 × 16 | 3 × 3 | 1 | 128 |
| Max-Pooling | 8 × 8 | 3 × 3 | 2 | 128 |
| Conv 3 | 8 × 8 | 3 × 3 | 1 | 256 |
| Concatenation | 8 × 8 | N/A | N/A | 512 |
| FC 1 | 8 × 8 | 8 × 8 | N/A | 256 |
| FC 2 | 8 × 8 | 8 × 8 | N/A | 2 |
| EN | MI | SSIM | QAB/F | VIF | |
|---|---|---|---|---|---|
| Athena | 7.2536 | 3.1623 | 0.6704 | 0.5797 | 0.8248 |
| Bench | 7.5477 | 4.4664 | 0.5558 | 0.7107 | 0.3162 |
| Bunker | 7.4693 | 3.2233 | 0.6282 | 0.6597 | 0.3683 |
| Tank | 7.7237 | 2.5543 | 0.4161 | 0.5280 | 0.2060 |
| Nato_camp | 7.1018 | 1.9957 | 0.7068 | 0.5042 | 0.4695 |
| Sandpath | 7.1106 | 2.5651 | 0.6540 | 0.5067 | 0.3771 |
| Kaptein | 7.1012 | 2.0924 | 0.7304 | 0.5565 | 0.4297 |
| Kayak | 6.9795 | 2.9931 | 0.6734 | 0.7590 | 0.5534 |
| Octec | 6.9670 | 4.2087 | 0.7733 | 0.7125 | 0.5512 |
| Street | 6.7090 | 2.6521 | 0.6409 | 0.6627 | 0.6720 |
| Steamboat | 6.9728 | 2.4326 | 0.8365 | 0.6042 | 0.3413 |
| Road | 7.4247 | 2.9362 | 0.6127 | 0.6338 | 0.6275 |
| Average | 7.1967 | 2.9402 | 0.6582 | 0.6181 | 0.4781 |
| EN | MI | SSIM | QAB/F | VIF | |
|---|---|---|---|---|---|
| LP | 6.7053 | 1.9353 | 0.4938 | 0.6011 | 0.4363 |
| Wavelet | 6.3003 | 2.4895 | 0.4869 | 0.2939 | 0.3028 |
| NSCT | 6.5850 | 1.8830 | 0.4945 | 0.5753 | 0.4213 |
| DTMDCT | 6.9425 | 1.8486 | 0.4431 | 0.3952 | 0.2956 |
| CBF | 6.5989 | 1.7220 | 0.4843 | 0.4752 | 0.3696 |
| HMSD | 6.9609 | 2.6005 | 0.4891 | 0.5284 | 0.3943 |
| GFF | 6.9890 | 3.5612 | 0.4344 | 0.6180 | 0.4681 |
| ADF | 6.3511 | 2.2094 | 0.4786 | 0.3823 | 0.3270 |
| ASR | 6.4384 | 2.0770 | 0.4898 | 0.5125 | 0.3767 |
| LPSR | 6.3580 | 2.0916 | 0.4856 | 0.3199 | 0.2910 |
| OIPCNN | 7.1803 | 4.9356 | 0.3906 | 0.6106 | 0.4069 |
| N-S-P | 6.9947 | 2.6022 | 0.4312 | 0.5015 | 0.4060 |
| DDCTPCA | 6.5567 | 1.8382 | 0.4851 | 0.5068 | 0.3927 |
| FPDE | 6.3974 | 1.9024 | 0.4617 | 0.4167 | 0.3338 |
| TSIFVS | 6.6270 | 1.8646 | 0.4898 | 0.5059 | 0.3632 |
| LEPLC | 7.0770 | 2.4172 | 0.4943 | 0.4810 | 0.4569 |
| GTF | 6.5819 | 2.1623 | 0.4236 | 0.3804 | 0.3440 |
| IFEVIP | 6.8685 | 3.8723 | 0.4865 | 0.4805 | 0.4061 |
| Ours | 7.1967 | 2.9402 | 0.6582 | 0.6181 | 0.4780 |
| Method | Nato_Camp | Duine | ||||
|---|---|---|---|---|---|---|
| LP | 0.004 | ± | 0.0007 | 0.0044 | ± | 0.0002 |
| Wavelet | 0.155 | ± | 0.0382 | 0.1592 | ± | 0.0018 |
| NSCT | 1.439 | ± | 0.0092 | 1.4402 | ± | 0.0096 |
| DTMDCT | 0.035 | ± | 0.0018 | 0.0337 | ± | 0.0019 |
| CBF | 6.143 | ± | 0.0213 | 6.1211 | ± | 0.0304 |
| HMSD | 0.544 | ± | 0.0558 | 0.5492 | ± | 0.0328 |
| GFF | 0.087 | ± | 0.0067 | 0.0927 | ± | 0.0091 |
| ADF | 0.177 | ± | 0.0031 | 0.1730 | ± | 0.0075 |
| ASR | 94.638 | ± | 0.3782 | 94.6380 | ± | 0.3199 |
| LPSR | 0.011 | ± | 0.0026 | 0.0087 | ± | 0.0005 |
| OIPCNN | 0.400 | ± | 0.0021 | 0.3995 | ± | 0.0018 |
| N-S-P | 72.047 | ± | 0.2027 | 72.0280 | ± | 0.1884 |
| DDCTPCA | 36.901 | ± | 0.1771 | 37.1020 | ± | 0.1162 |
| FPDE | 0.092 | ± | 0.0040 | 0.0925 | ± | 0.0043 |
| TSIFVS | 0.010 | ± | 0.0019 | 0.0102 | ± | 0.0014 |
| LEPLC | 0.149 | ± | 0.0085 | 0.1575 | ± | 0.0056 |
| GTF | 0.992 | ± | 0.0609 | 1.3706 | ± | 0.1052 |
| IFEVIP | 0.052 | ± | 0.0012 | 0.0542 | ± | 0.0015 |
| Proposed | 19.773 | ± | 0.178 | 19.1633 | ± | 0.132 |
© 2019 by the authors. Licensee MDPI, Basel, Switzerland. This article is an open access article distributed under the terms and conditions of the Creative Commons Attribution (CC BY) license (http://creativecommons.org/licenses/by/4.0/).
Share and Cite
Piao, J.; Chen, Y.; Shin, H. A New Deep Learning Based Multi-Spectral Image Fusion Method. Entropy 2019, 21, 570. https://doi.org/10.3390/e21060570
Piao J, Chen Y, Shin H. A New Deep Learning Based Multi-Spectral Image Fusion Method. Entropy. 2019; 21(6):570. https://doi.org/10.3390/e21060570
Chicago/Turabian StylePiao, Jingchun, Yunfan Chen, and Hyunchul Shin. 2019. "A New Deep Learning Based Multi-Spectral Image Fusion Method" Entropy 21, no. 6: 570. https://doi.org/10.3390/e21060570
APA StylePiao, J., Chen, Y., & Shin, H. (2019). A New Deep Learning Based Multi-Spectral Image Fusion Method. Entropy, 21(6), 570. https://doi.org/10.3390/e21060570