Recurrence Networks in Natural Languages

Abstract
1. Introduction
2. Methods
2.1. Recurrence Networks
2.2. Network Metrics
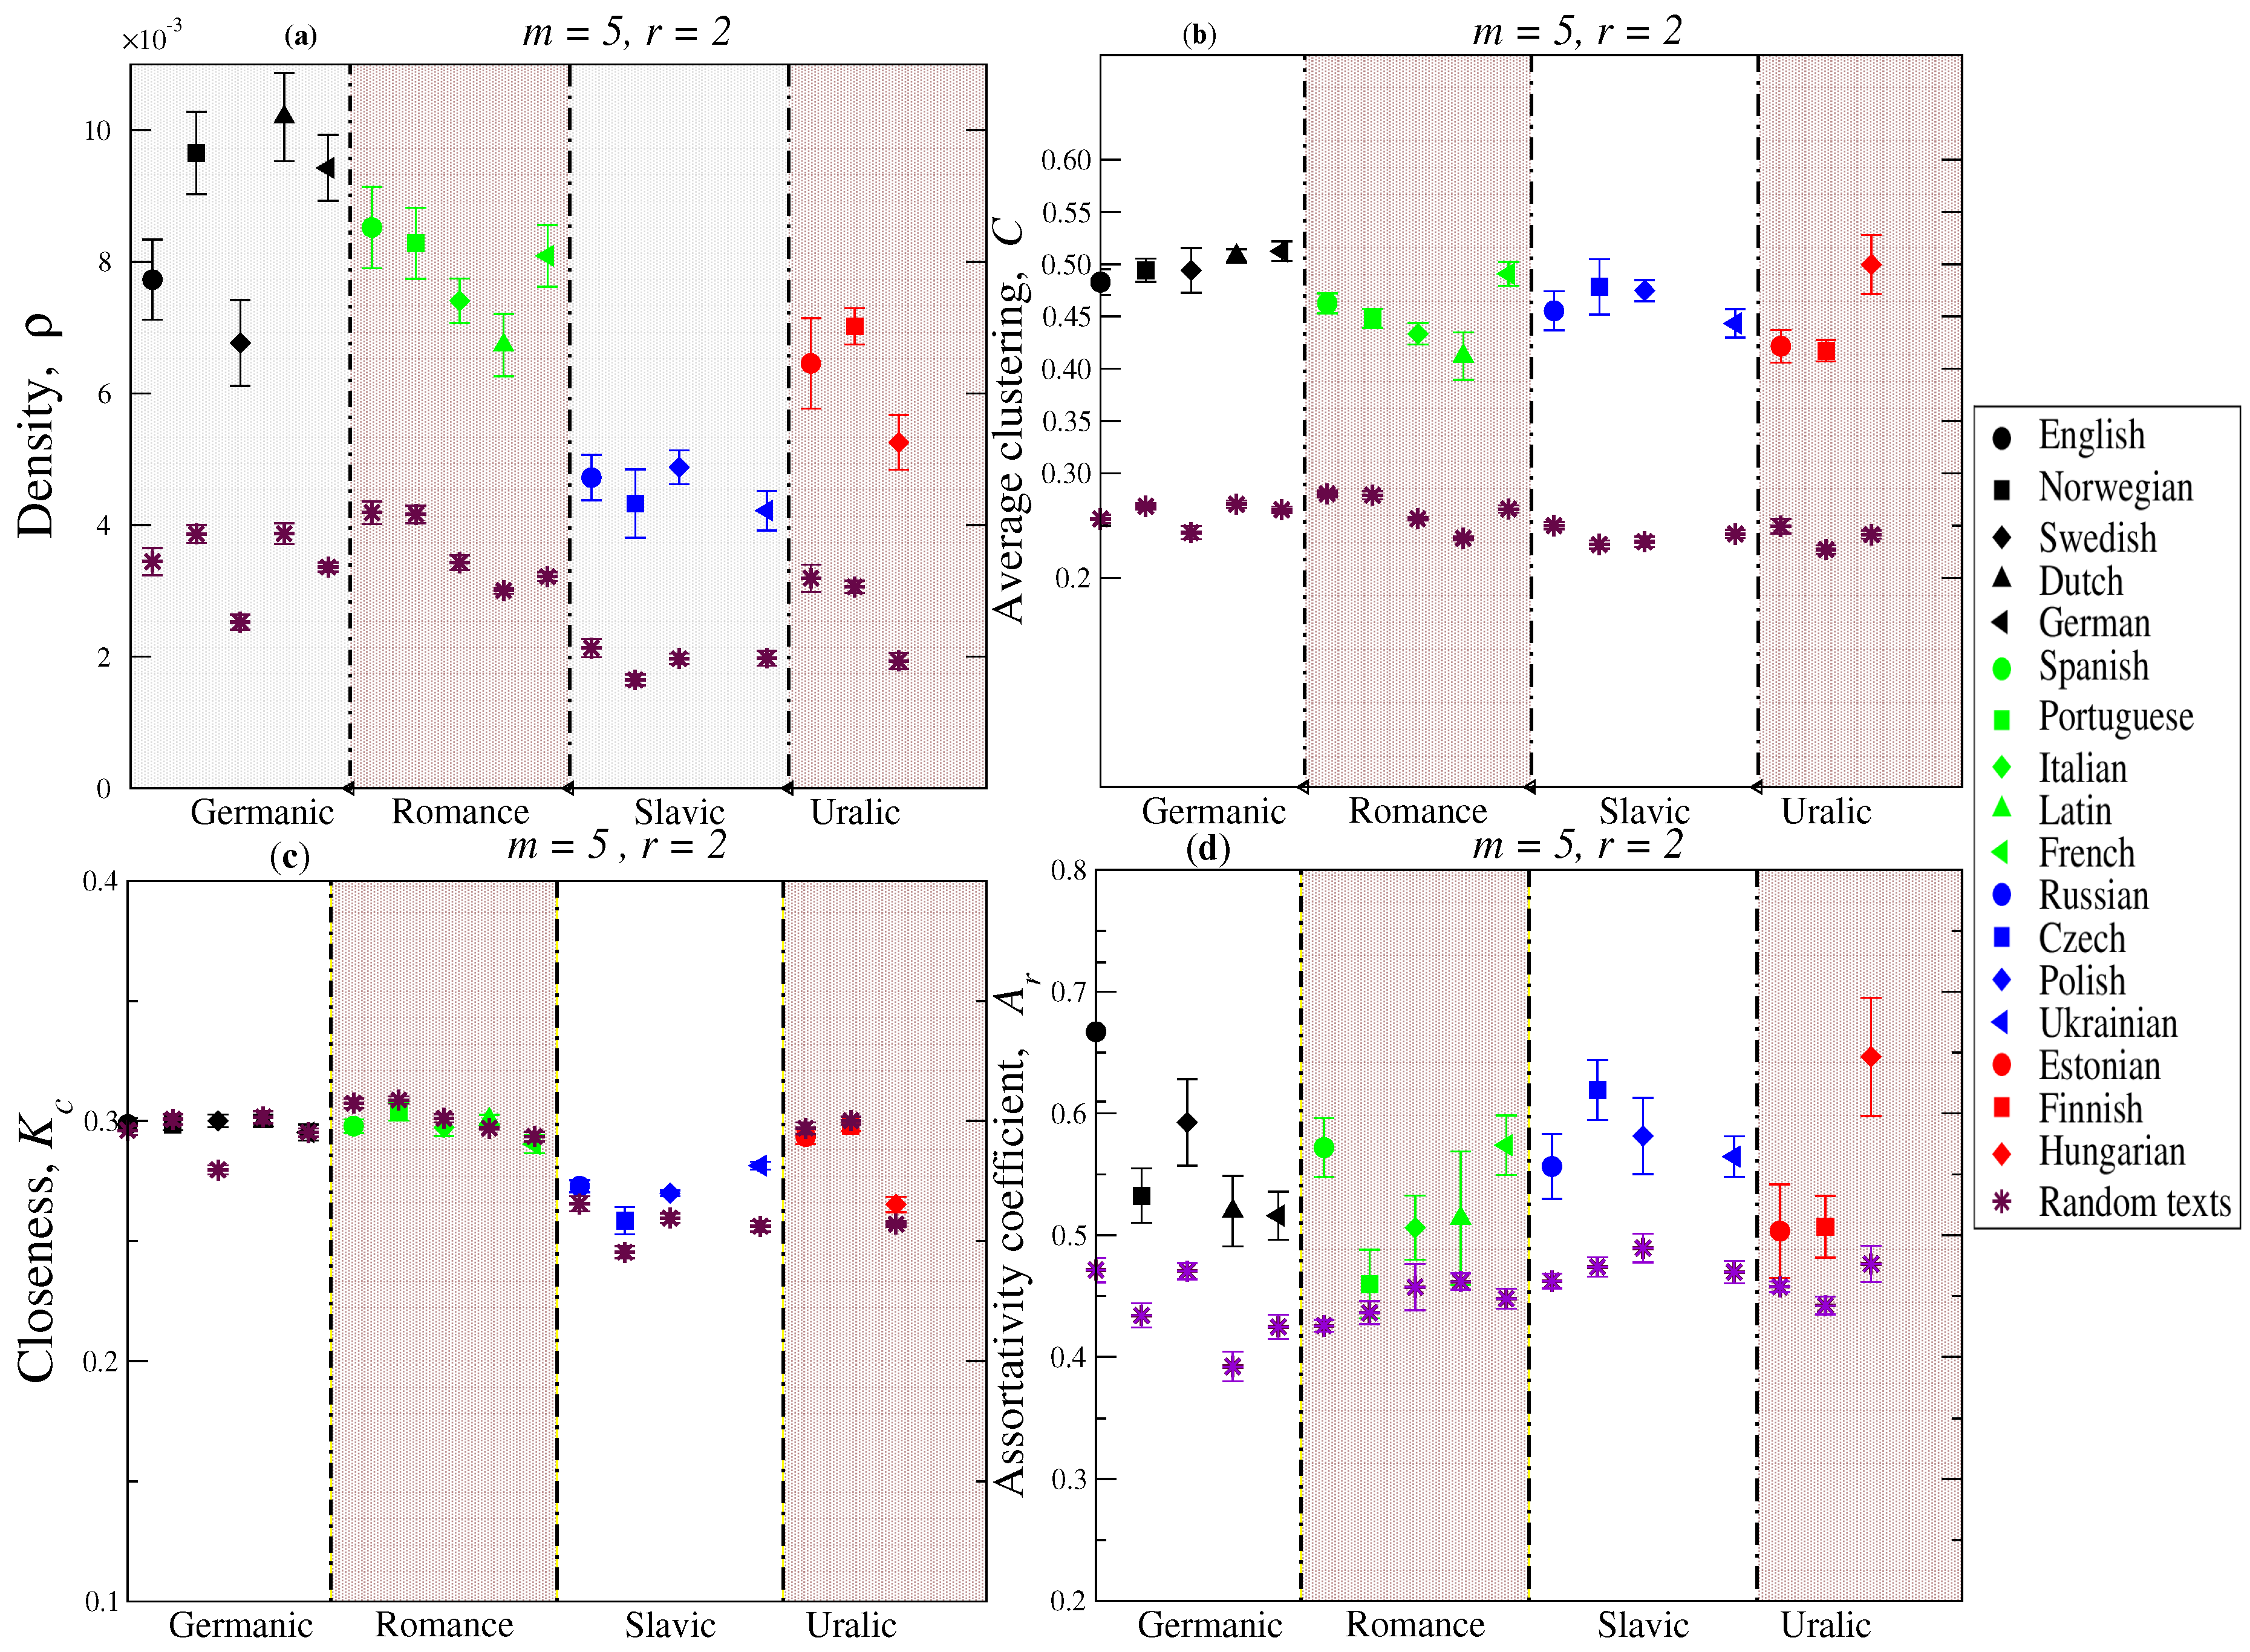
- Density (): The density of a network is defined as:with g the number of actual connections and n is the number of nodes (patterns). A value of close to 1 denotes an almost complete graph and close to 0 indicates a poorly connected network.
- Closeness centrality (): Measures the centrality of a given node in the network, defined as the reciprocal of the sum of the length of the shortest paths between the node and all other nodes in the graph [29],where denotes the distance from node i to node j.
- Clustering coefficient (): Measures the degree of transitivity in connectivity amongstamong the nearest neighbors of a node i [29]. In recurrence terms, represents the extent to which neighbors of a node (pattern) i are also recurrent amongstamong themselves. Specifically, is given by,where is the number of links between the neighbors of the node i.
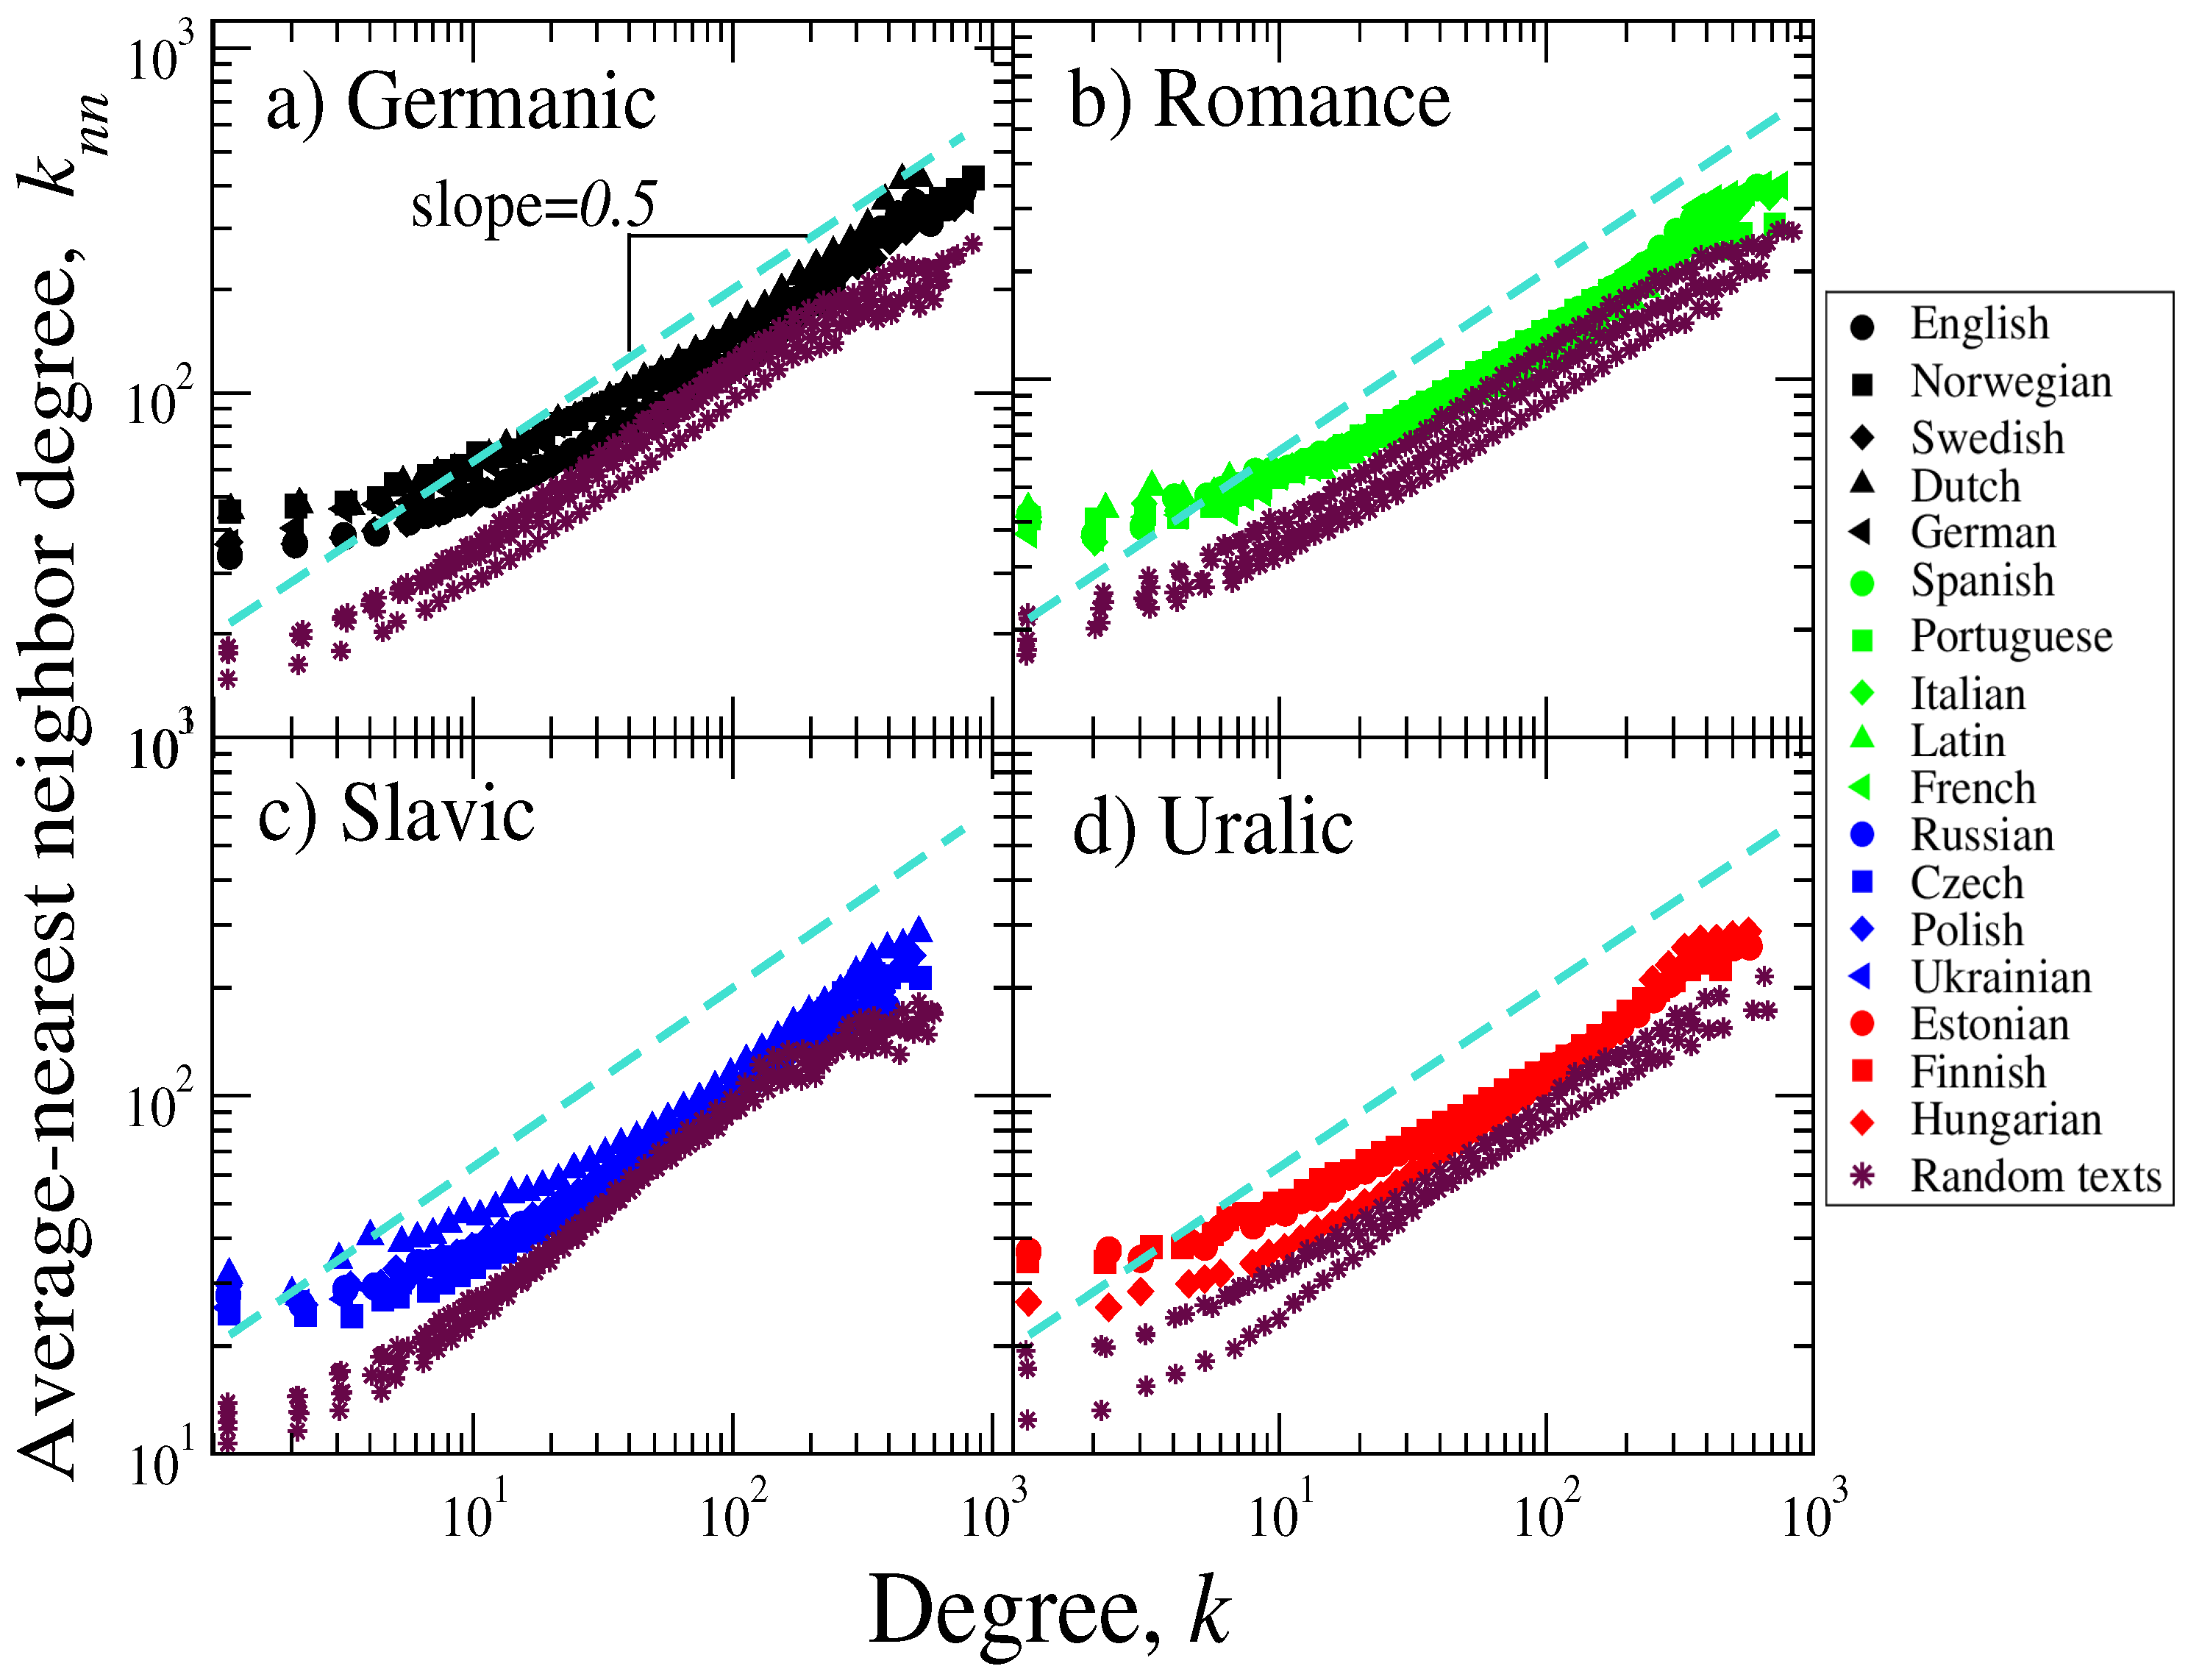
- Average nearest-neighbor degree (): This measure allows us to see the mean preference in connectivity of a given node [30,31,32]. The behavior of this quantity as a function of the node’s degree, reveals whether high-degree nodes connect with other equally high-degree ones (assortativity), or high-degree nodes preferentially connect to low-degree ones (dissortativity) [29]. For unweighted networks, is calculated as:where is the node’s degree, represents the adjacency matrix and N is the number of nodes.
- Assortative mixing coefficient by degree (): This measure quantifies the tendency observed in networks that nodes with many connections are connected to other nodes with many (or a few) connections [33]. Formally, the coefficient is given by,where . For perfectly assortative networks, the coefficient reaches a maximum value of 1, whereas a minimum value of is observed for perfectly dissortative ones.
3. Results
4. Discussion and Conclusions
Author Contributions
Funding
Conflicts of Interest
References
- Zipf, G.K. The Psycho-Biology of Language: An Introduction to Dynamic Philology; Houghton Mifflin: Boston, MA, USA, 1935. [Google Scholar]
- Grzybek, P. History and methodology of word length studies. In Contributions to the Science of Text and Language. Text, Speech and Language Technology; Grzybek, P., Ed.; Springer: Dordrecht, The Netherlands, 2006; Volume 31, pp. 15–90. [Google Scholar]
- Piantadosi, S.T.; Tily, H.; Gibson, E. Word lengths are optimized for efficient communication. Proc. Natl. Acad. Sci. USA 2011, 108, 3526–3529. [Google Scholar] [CrossRef]
- Solé, R.V.; Corominas-Murtra, B.; Valverde, S.; Steels, L. Language networks: Their structure, function, and evolution. Complexity 2010, 15, 20–26. [Google Scholar] [CrossRef]
- Seoane, L.F.; Solé, R. The morphospace of language networks. Sci. Rep. 2018, 8, 10465. [Google Scholar] [CrossRef]
- Rêgo, H.H.A.; Braunstein, L.A.; D’Agostino, G.; Stanley, H.E.; Miyazima, S. When a Text Is Translated Does the Complexity of Its Vocabulary Change? Translations and Target Readerships. PLoS ONE 2014, 9, e110213. [Google Scholar] [CrossRef]
- Kosmidis, K.; Kalampokis, A.; Argyrakis, P. Language time series analysis. Physica A 2006, 370, 808–816. [Google Scholar] [CrossRef]
- Lacasa, L.; Luque, B.; Ballesteros, F.; Luque, J.; Nuño, J.C. From time series to complex networks: The visibility graph. Proc. Natl. Acad. Sci. USA 2008, 105, 4972–4975. [Google Scholar] [CrossRef]
- Luque, B.; Lacasa, L.; Ballesteros, F.; Luque, J. Horizontal visibility graphs: Exact results for random time series. Phys. Rev. E 2009, 80, 046103. [Google Scholar] [CrossRef] [PubMed]
- Ausloos, M. Generalized Hurst exponent and multifractal function of original and translated texts mapped into frequency and length time series. Phys. Rev. E 2012, 86, 031108. [Google Scholar] [CrossRef]
- Donner, R.V.; Zou, Y.; Donges, J.F.; Marwan, N.; Kurths, J. Recurrence networks—a novel paradigm for nonlinear time series analysis. New J. Phys. 2010, 12, 033025. [Google Scholar] [CrossRef]
- Rodriguez, E.; Aguilar-Cornejo, M.; Femat, R.; Alvarez-Ramirez, J. Scale and time dependence of serial correlations in word-length time series of written texts. Physica A 2014, 414, 378–386. [Google Scholar] [CrossRef]
- Arbesman, S.; Strogatz, S.H.; Vitevitch, M.S. Comparative Analysis of Networks of Phonologically Similar Words in English and Spanish. Entropy 2010, 12, 327. [Google Scholar] [CrossRef]
- De Arruda, H.F.; Marinho, V.Q.; Costa, L.d.F.; Amancio, D.R. Paragraph-based representation of texts: A complex networks approach. Inf. Process. Manag. 2019, 56, 479–494. [Google Scholar] [CrossRef]
- Susuki, S.; Hirata, Y.; Aihara, K. Definition of distance for marked point process data and its application to recurrence plot-based analysis of exchange tick data of foreign currencies. Int. J. Bifurcat. Chaos 2010, 20, 3699–3708. [Google Scholar] [CrossRef]
- Trulla, L.; Giuliani, A.; Zbilut, J.; Webber, C., Jr. Recurrence quantification analysis of the logistic equation with transients. Phys. Lett. A 1996, 223, 255–260. [Google Scholar] [CrossRef]
- Marwan, N.; Donges, J.F.; Zou, Y.; Donner, R.V.; Kurths, J. Complex network approach for recurrence analysis of time series. Phys. Lett. A 2009, 373, 4246–4254. [Google Scholar] [CrossRef]
- Zou, Y.; Donner, R.V.; Marwan, N.; Donges, J.F.; Kurths, J. Complex network approaches to nonlinear time series analysis. Phys. Rep. 2019, 787, 1–97. [Google Scholar] [CrossRef]
- Liu, H.; Cong, J. Language clustering with word co-occurrence networks based on parallel texts. Sci. Bull. 2013, 58, 1139–1144. [Google Scholar] [CrossRef]
- Abramov, O.; Mehler, A. Automatic Language Classification by means of Syntactic Dependency Networks. J. Quant. Linguist. 2011, 18, 291–336. [Google Scholar] [CrossRef]
- Martinčić-Ipšić, S.; Margan, D.; Meštrović, A. Multilayer network of language: A unified framework for structural analysis of linguistic subsystems. Physica A 2016, 457, 117–128. [Google Scholar] [CrossRef]
- Montemurro, M.A.; Zanette, D.H. Universal Entropy of Word Ordering across Linguistic Families. PLoS ONE 2011, 6, e19875. [Google Scholar] [CrossRef]
- Altmann, E.G.; Pierrehumbert, J.B.; Motter, A.E. Beyond Word Frequency: Bursts, Lulls, and Scaling in the Temporal Distributions of Words. PLoS ONE 2009, 4, e7678. [Google Scholar] [CrossRef]
- Doxas, I.; Dennis, S.; Oliver, W.L. The dimensionality of discourse. Proc. Natl. Acad. Sci. USA 2010, 107, 4866–4871. [Google Scholar] [CrossRef]
- Grassberger, P. Generalized dimensions of strange attractors. Phys. Lett. A 1983, 97, 227–230. [Google Scholar] [CrossRef]
- Hernández-Gómez, C.; Basurto-Flores, R.; Obregón-Quintana, B.; Guzmán-Vargas, L. Evaluating the Irregularity of Natural Languages. Entropy 2017, 19, 521. [Google Scholar] [CrossRef]
- Pincus, S.M. Approximate entropy as a measure of system complexity. Proc. Natl. Acad. Sci. USA 1991, 88, 2297–2301. [Google Scholar] [CrossRef]
- Richman, J.S.; Moorman, J.R. Physiological time-series analysis using approximate entropy and sample entropy. Am. J. Physiol. Heart Circ. Physiol. 2000, 278, H2039–H2049. [Google Scholar] [CrossRef]
- Newman, M.E.J. Networks: An Introduction; Oxford University Press: Oxford, UK, 2010. [Google Scholar]
- Pastor-Satorras, R.; Vázquez, A.; Vespignani, A. Dynamical and Correlation Properties of the Internet. Phys. Rev. Lett. 2001, 87, 258701. [Google Scholar] [CrossRef]
- Maslov, S.; Sneppen, K. Specificity and Stability in Topology of Protein Networks. Science 2002, 296, 910–913. [Google Scholar] [CrossRef] [PubMed]
- Barrat, A.; Barthélemy, M.; Pastor-Satorras, R.; Vespignani, A. The architecture of complex weighted networks. Proc. Natl. Acad. Sci. USA 2004, 101, 3747–3752. [Google Scholar] [CrossRef]
- Newman, M.E.J. Mixing patterns in networks. Phys. Rev. E 2003, 67, 026126. [Google Scholar] [CrossRef]
- Available online: https://figshare.com/articles/Recurrence_networks_in_natural_languages/7885376 (accessed on 23 May 2019).
- Marwan, N.; Wessel, N.; Meyerfeldt, U.; Schirdewan, A.; Kurths, J. Recurrence-plot-based measures of complexity and their application to heart-rate-variability data. Phys. Rev. E 2002, 66, 026702. [Google Scholar] [CrossRef]
- Kalimeri, M.; Constantoudis, V.; Papadimitriou, C.; Karamanos, K.; Diakonos, F.K.; Papageorgiou, H. Entropy analysis of word-length series of natural language texts: Effects of text language and genre. Int. J. Bifurcat. Chaos 2012, 22, 1250223. [Google Scholar] [CrossRef]
- Kalimeri, M.; Constantoudis, V.; Papadimitriou, C.; Karamanos, K.; Diakonos, F.K.; Papageorgiou, H. Word-length Entropies and Correlations of Natural Language Written Texts. J. Quant. Linguist. 2015, 22, 101–118. [Google Scholar] [CrossRef]
- Guzmán-Vargas, L.; Obregón-Quintana, B.; Aguilar-Velázquez, D.; Hernández-Pérez, R.; Liebovitch, L. Word-length correlations and memory in large texts: A visibility network analysis. Entropy 2015, 17, 7798–7810. [Google Scholar] [CrossRef]
- Watts, D.J.; Strogatz, S.H. Collective dynamics of ‘small-world’ networks. Nature 1998, 393, 440–442. [Google Scholar] [CrossRef]
- Newman, M.E.J. Assortative Mixing in Networks. Phys. Rev. Lett. 2002, 89, 208701. [Google Scholar] [CrossRef]
- Fisher, R.A. The use of multiple measurements in taxonomic problems. Ann. Eugen. 1936, 7, 179–188. [Google Scholar] [CrossRef]
- Vitevitch, M.S. What Can Graph Theory Tell Us About Word Learning and Lexical Retrieval? J. Speech Lang. Hear. Res. 2008, 51, 408–422. [Google Scholar] [CrossRef]
- Arbesman, S.; Strogatz, S.H.; Vitevitch, M.S. The structure of phonological networks across multiple languages. Int. J. Bifurcat. Chaos 2010, 20, 679–685. [Google Scholar] [CrossRef]
- Chan, K.Y.; Vitevitch, M.S. Network Structure Influences Speech Production. Cogn. Sci. 2010, 34, 685–697. [Google Scholar] [CrossRef]


| To_ | o_b | _be | be_ | e_o | _or | or_ | r_n | _no | not | ot_ | t_t | _to | to_ | ob_ | _be | |
|---|---|---|---|---|---|---|---|---|---|---|---|---|---|---|---|---|
| To_ | 1 | 0 | 0 | 1 | 0 | 1 | 1 | 0 | 0 | 1 | 1 | 1 | 0 | 1 | 0 | 0 |
| o_b | 0 | 1 | 0 | 0 | 1 | 0 | 1 | 1 | 0 | 0 | 1 | 1 | 0 | 0 | 1 | 0 |
| _be | 0 | 0 | 1 | 0 | 0 | 1 | 0 | 0 | 1 | 0 | 0 | 0 | 1 | 0 | 0 | 1 |
| be_ | 1 | 0 | 0 | 1 | 0 | 0 | 1 | 0 | 0 | 0 | 1 | 0 | 0 | 1 | 0 | 0 |
| e_o | 0 | 1 | 0 | 0 | 1 | 0 | 0 | 1 | 1 | 0 | 0 | 1 | 1 | 0 | 1 | 0 |
| _or | 0 | 0 | 1 | 0 | 0 | 1 | 0 | 0 | 1 | 1 | 0 | 0 | 1 | 1 | 0 | 1 |
| or | 1 | 1 | 0 | 1 | 0 | 0 | 1 | 0 | 0 | 0 | 1 | 0 | 0 | 1 | 1 | 0 |
| r_n | 0 | 1 | 0 | 0 | 1 | 0 | 0 | 1 | 0 | 0 | 0 | 1 | 0 | 0 | 1 | 0 |
| _no | 0 | 0 | 1 | 0 | 1 | 1 | 0 | 0 | 1 | 0 | 0 | 0 | 1 | 0 | 0 | 1 |
| not | 1 | 0 | 0 | 0 | 0 | 1 | 0 | 0 | 0 | 1 | 0 | 1 | 0 | 1 | 0 | 0 |
| ot_ | 1 | 1 | 0 | 1 | 0 | 0 | 1 | 0 | 0 | 0 | 1 | 0 | 1 | 1 | 1 | 0 |
| t_t | 1 | 1 | 0 | 0 | 1 | 0 | 0 | 1 | 0 | 0 | 0 | 1 | 0 | 1 | 1 | 0 |
| _to | 0 | 0 | 1 | 0 | 1 | 1 | 0 | 0 | 1 | 0 | 0 | 0 | 1 | 0 | 0 | 1 |
| to_ | 1 | 0 | 0 | 1 | 0 | 1 | 1 | 0 | 0 | 1 | 1 | 1 | 0 | 1 | 0 | 0 |
| o_b | 0 | 1 | 0 | 0 | 1 | 0 | 1 | 1 | 0 | 0 | 1 | 1 | 0 | 0 | 1 | 0 |
| _be | 0 | 0 | 1 | 0 | 0 | 1 | 0 | 0 | 1 | 0 | 0 | 0 | 1 | 0 | 0 | 1 |
© 2019 by the authors. Licensee MDPI, Basel, Switzerland. This article is an open access article distributed under the terms and conditions of the Creative Commons Attribution (CC BY) license (http://creativecommons.org/licenses/by/4.0/).
Share and Cite
Baeza-Blancas, E.; Obregón-Quintana, B.; Hernández-Gómez, C.; Gómez-Meléndez, D.; Aguilar-Velázquez, D.; Liebovitch, L.S.; Guzmán-Vargas, L. Recurrence Networks in Natural Languages. Entropy 2019, 21, 517. https://doi.org/10.3390/e21050517
Baeza-Blancas E, Obregón-Quintana B, Hernández-Gómez C, Gómez-Meléndez D, Aguilar-Velázquez D, Liebovitch LS, Guzmán-Vargas L. Recurrence Networks in Natural Languages. Entropy. 2019; 21(5):517. https://doi.org/10.3390/e21050517
Chicago/Turabian StyleBaeza-Blancas, Edgar, Bibiana Obregón-Quintana, Candelario Hernández-Gómez, Domingo Gómez-Meléndez, Daniel Aguilar-Velázquez, Larry S. Liebovitch, and Lev Guzmán-Vargas. 2019. "Recurrence Networks in Natural Languages" Entropy 21, no. 5: 517. https://doi.org/10.3390/e21050517
APA StyleBaeza-Blancas, E., Obregón-Quintana, B., Hernández-Gómez, C., Gómez-Meléndez, D., Aguilar-Velázquez, D., Liebovitch, L. S., & Guzmán-Vargas, L. (2019). Recurrence Networks in Natural Languages. Entropy, 21(5), 517. https://doi.org/10.3390/e21050517