Predicting Student Performance and Deficiency in Mastering Knowledge Points in MOOCs Using Multi-Task Learning


Abstract
1. Introduction
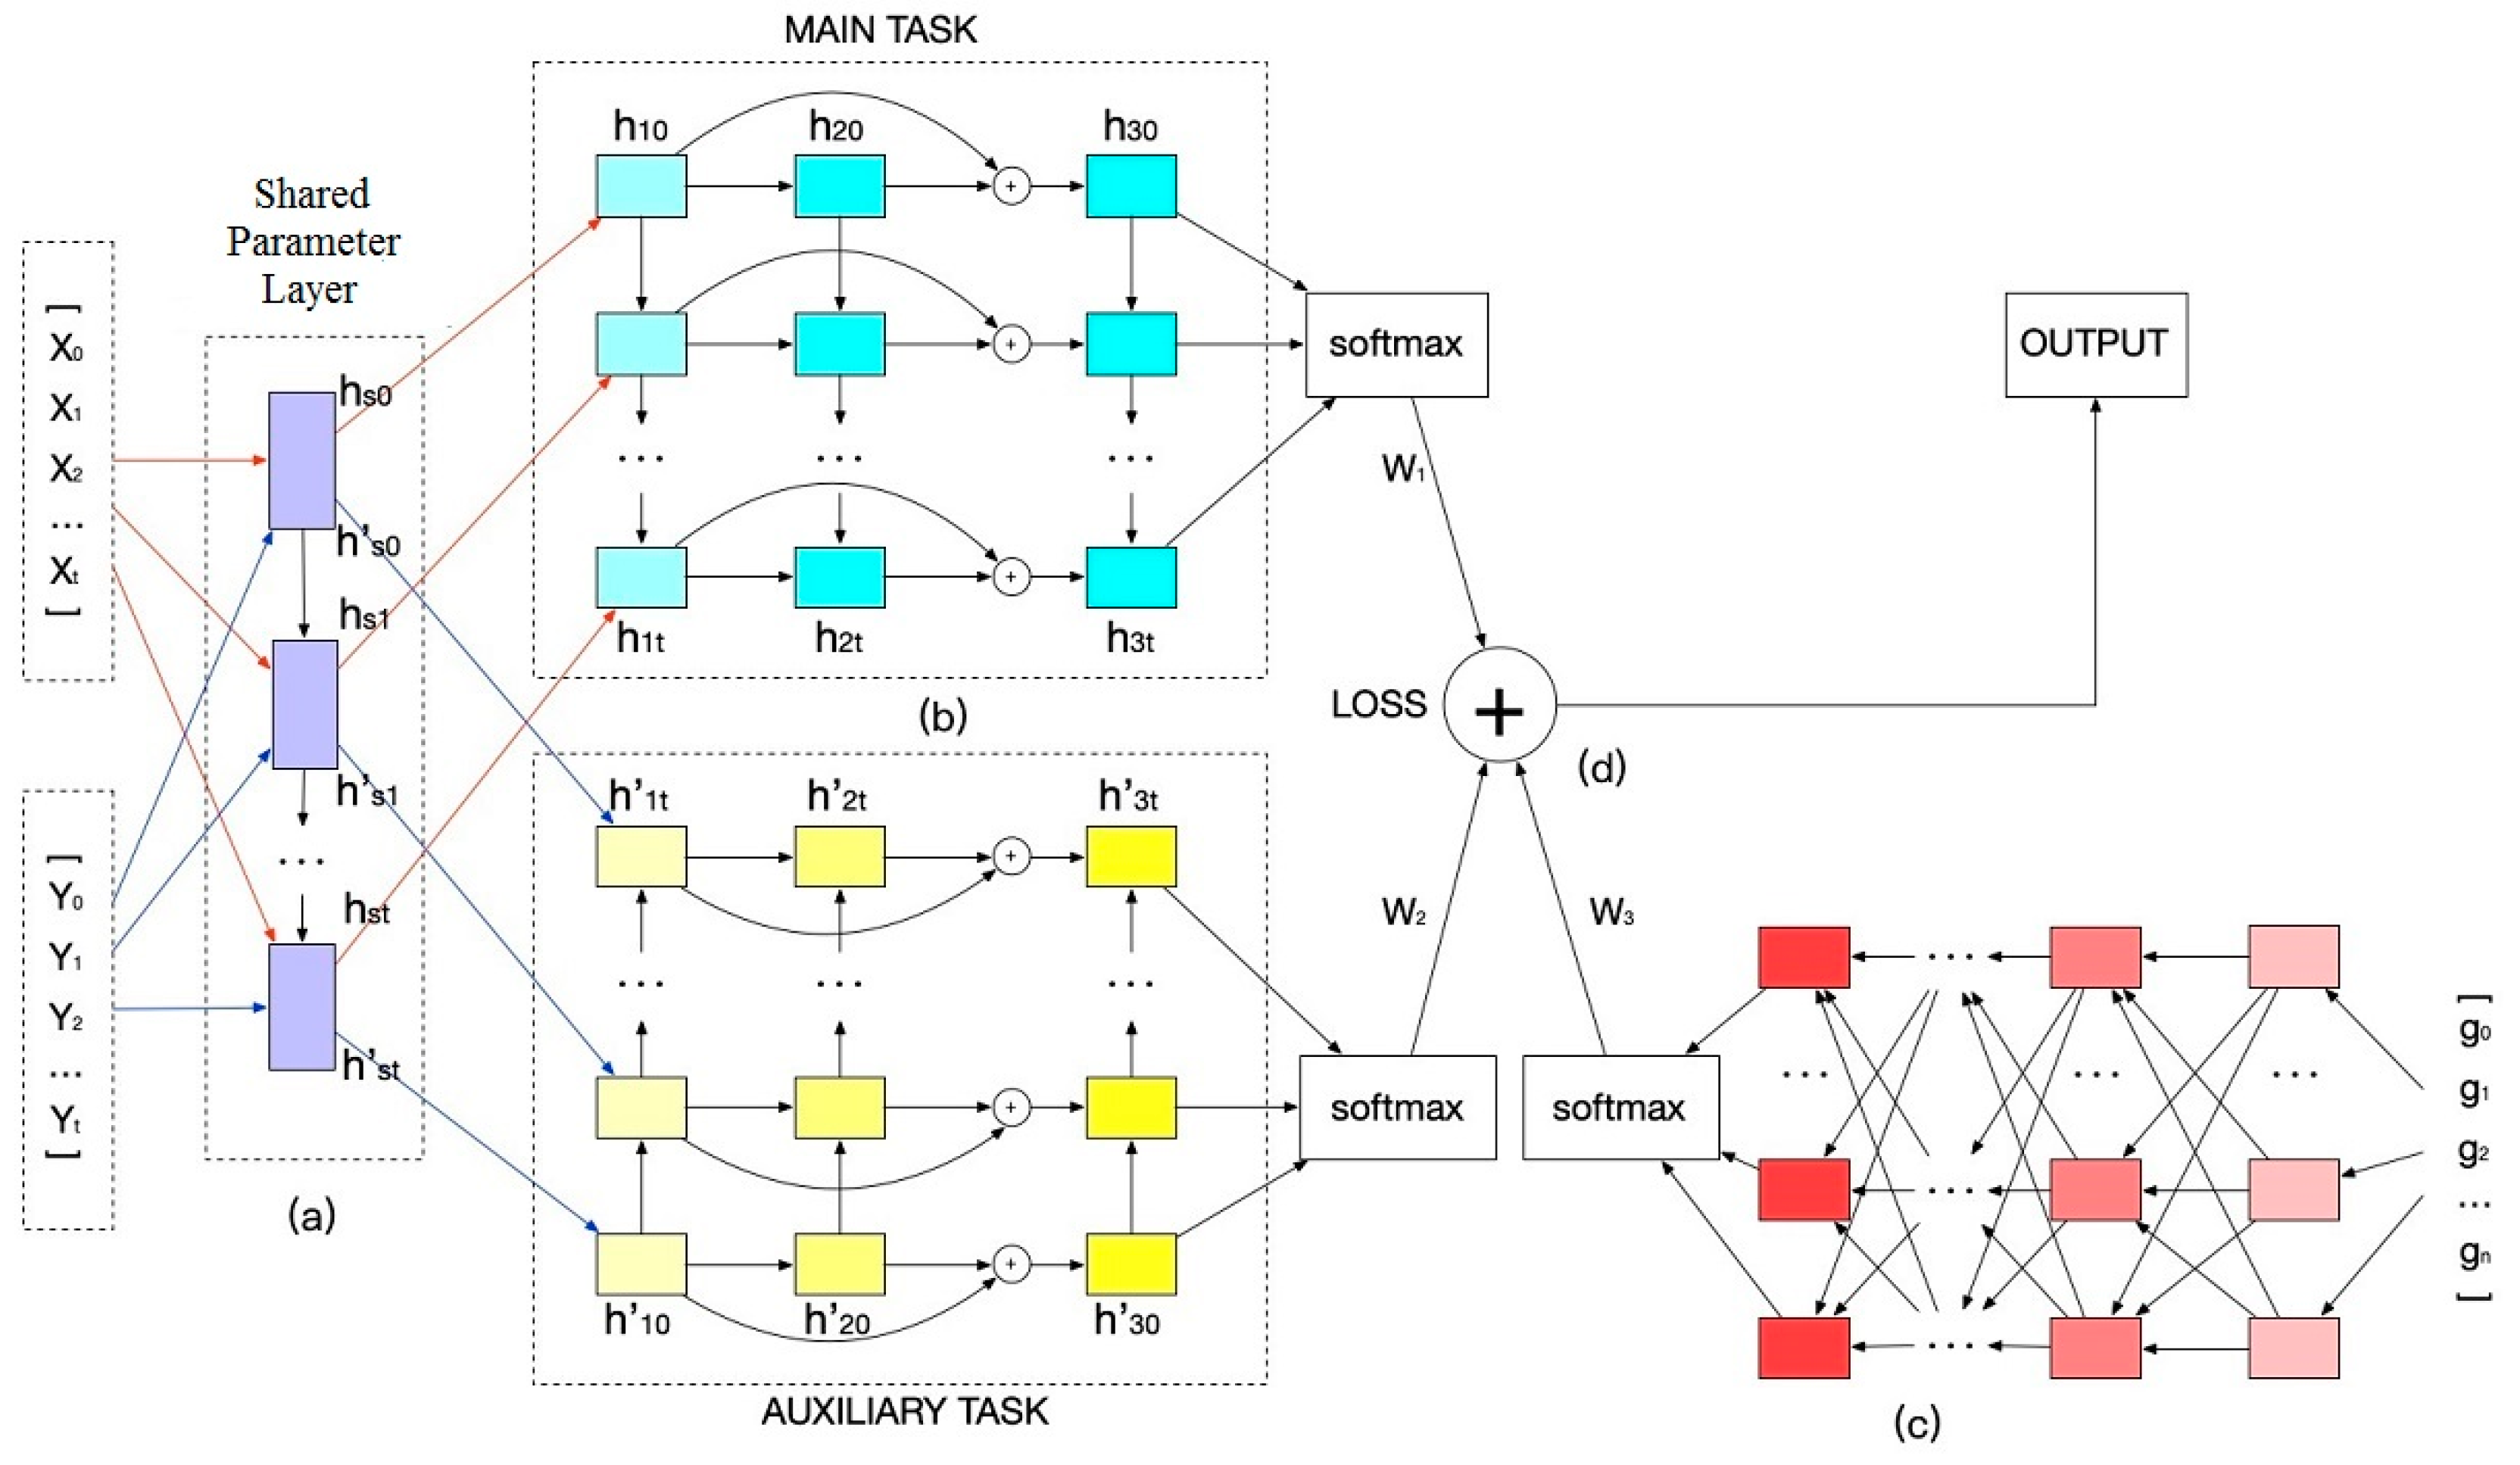
- We propose a multi-task learning framework that is based on a multi-layer LSTM network to predict whether the students will pass the final exam as well as their mastery of knowledge points. Our framework combined multi-task prediction and comprehensive prediction with attention mechanism, which can mix multi-dimension knowledge and improve the prediction accuracy.
- We present an attention-based multi task LSTM neural network method that incorporates a shared parameters layer. The multi task architecture with shared parameters can avoid overfitting and improve the prediction. The LSTM neural network with attention mechanism adjusts the importance of temporal individual features, temporal grouping features, and it could reflect students’ learning behaviors well.
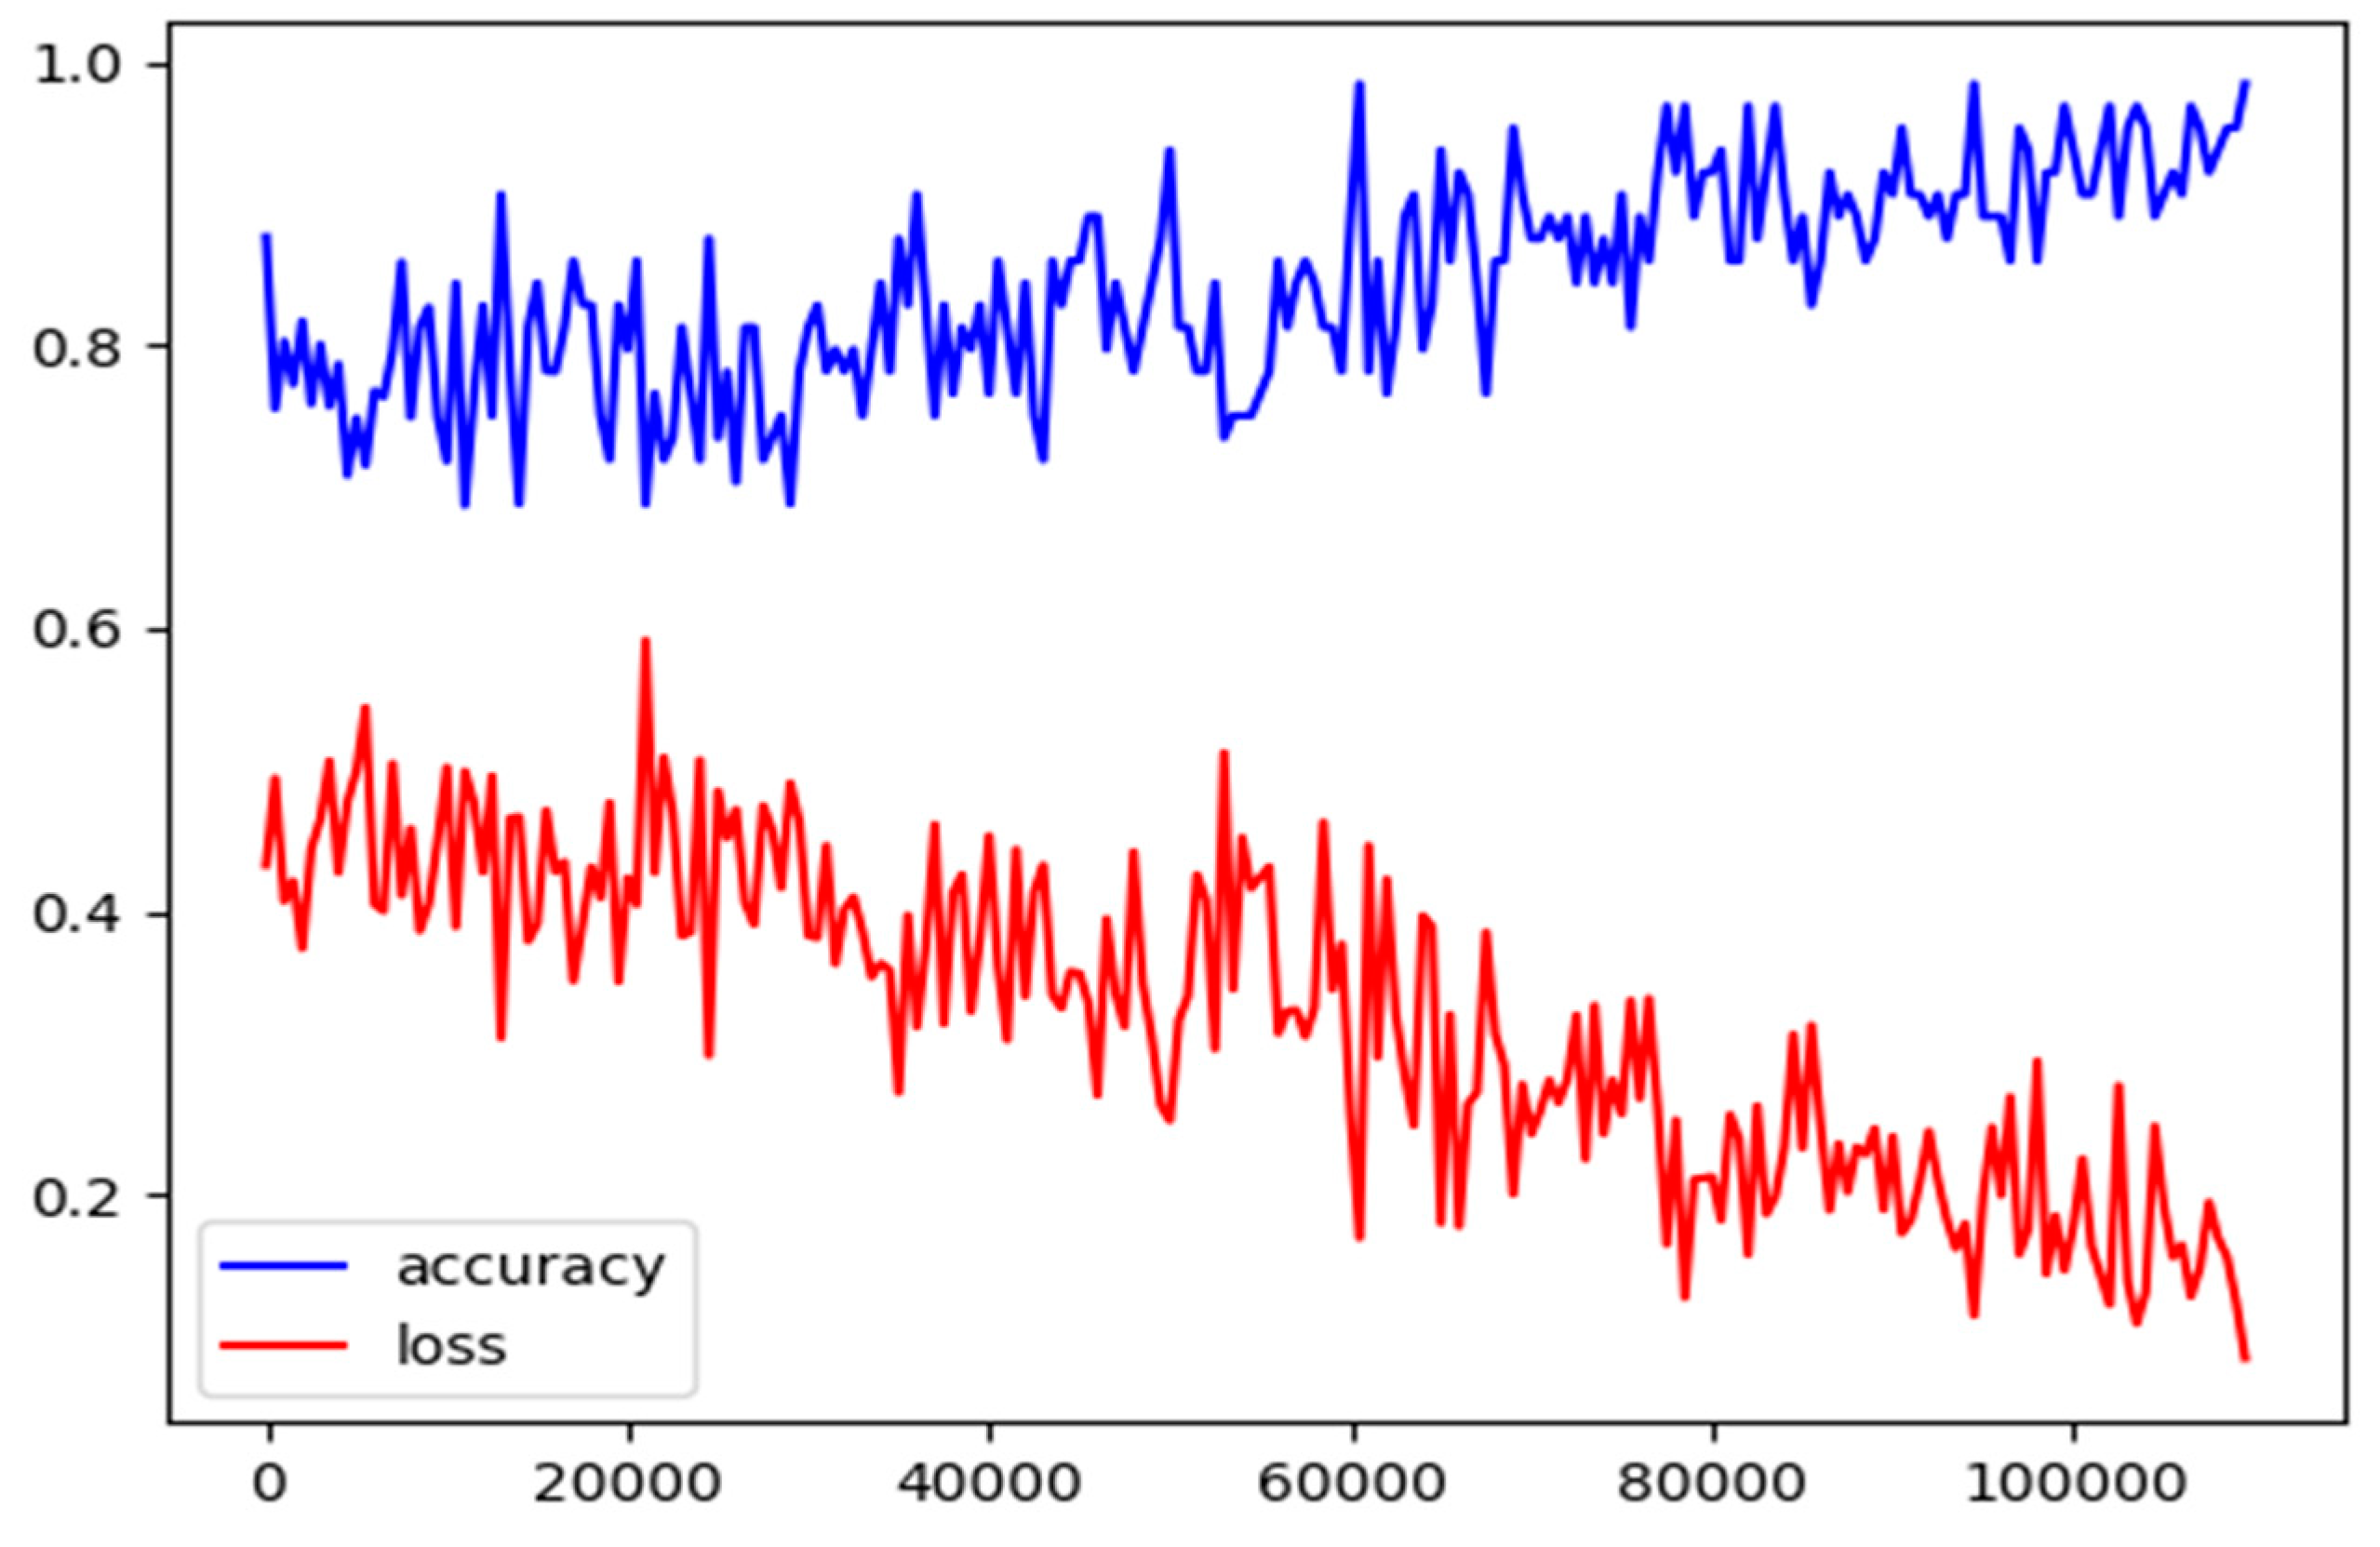
- The results demonstrate that our method is superior to other existing multi-task-based LSTM methods. Our framework can predict students’ performance with 92.52% accuracy and students’ mastery of knowledge points with 99.58% accuracy on the experimental dataset.
2. Related Work
2.1. Prediction in MOOCs
2.2. Multitask Learning
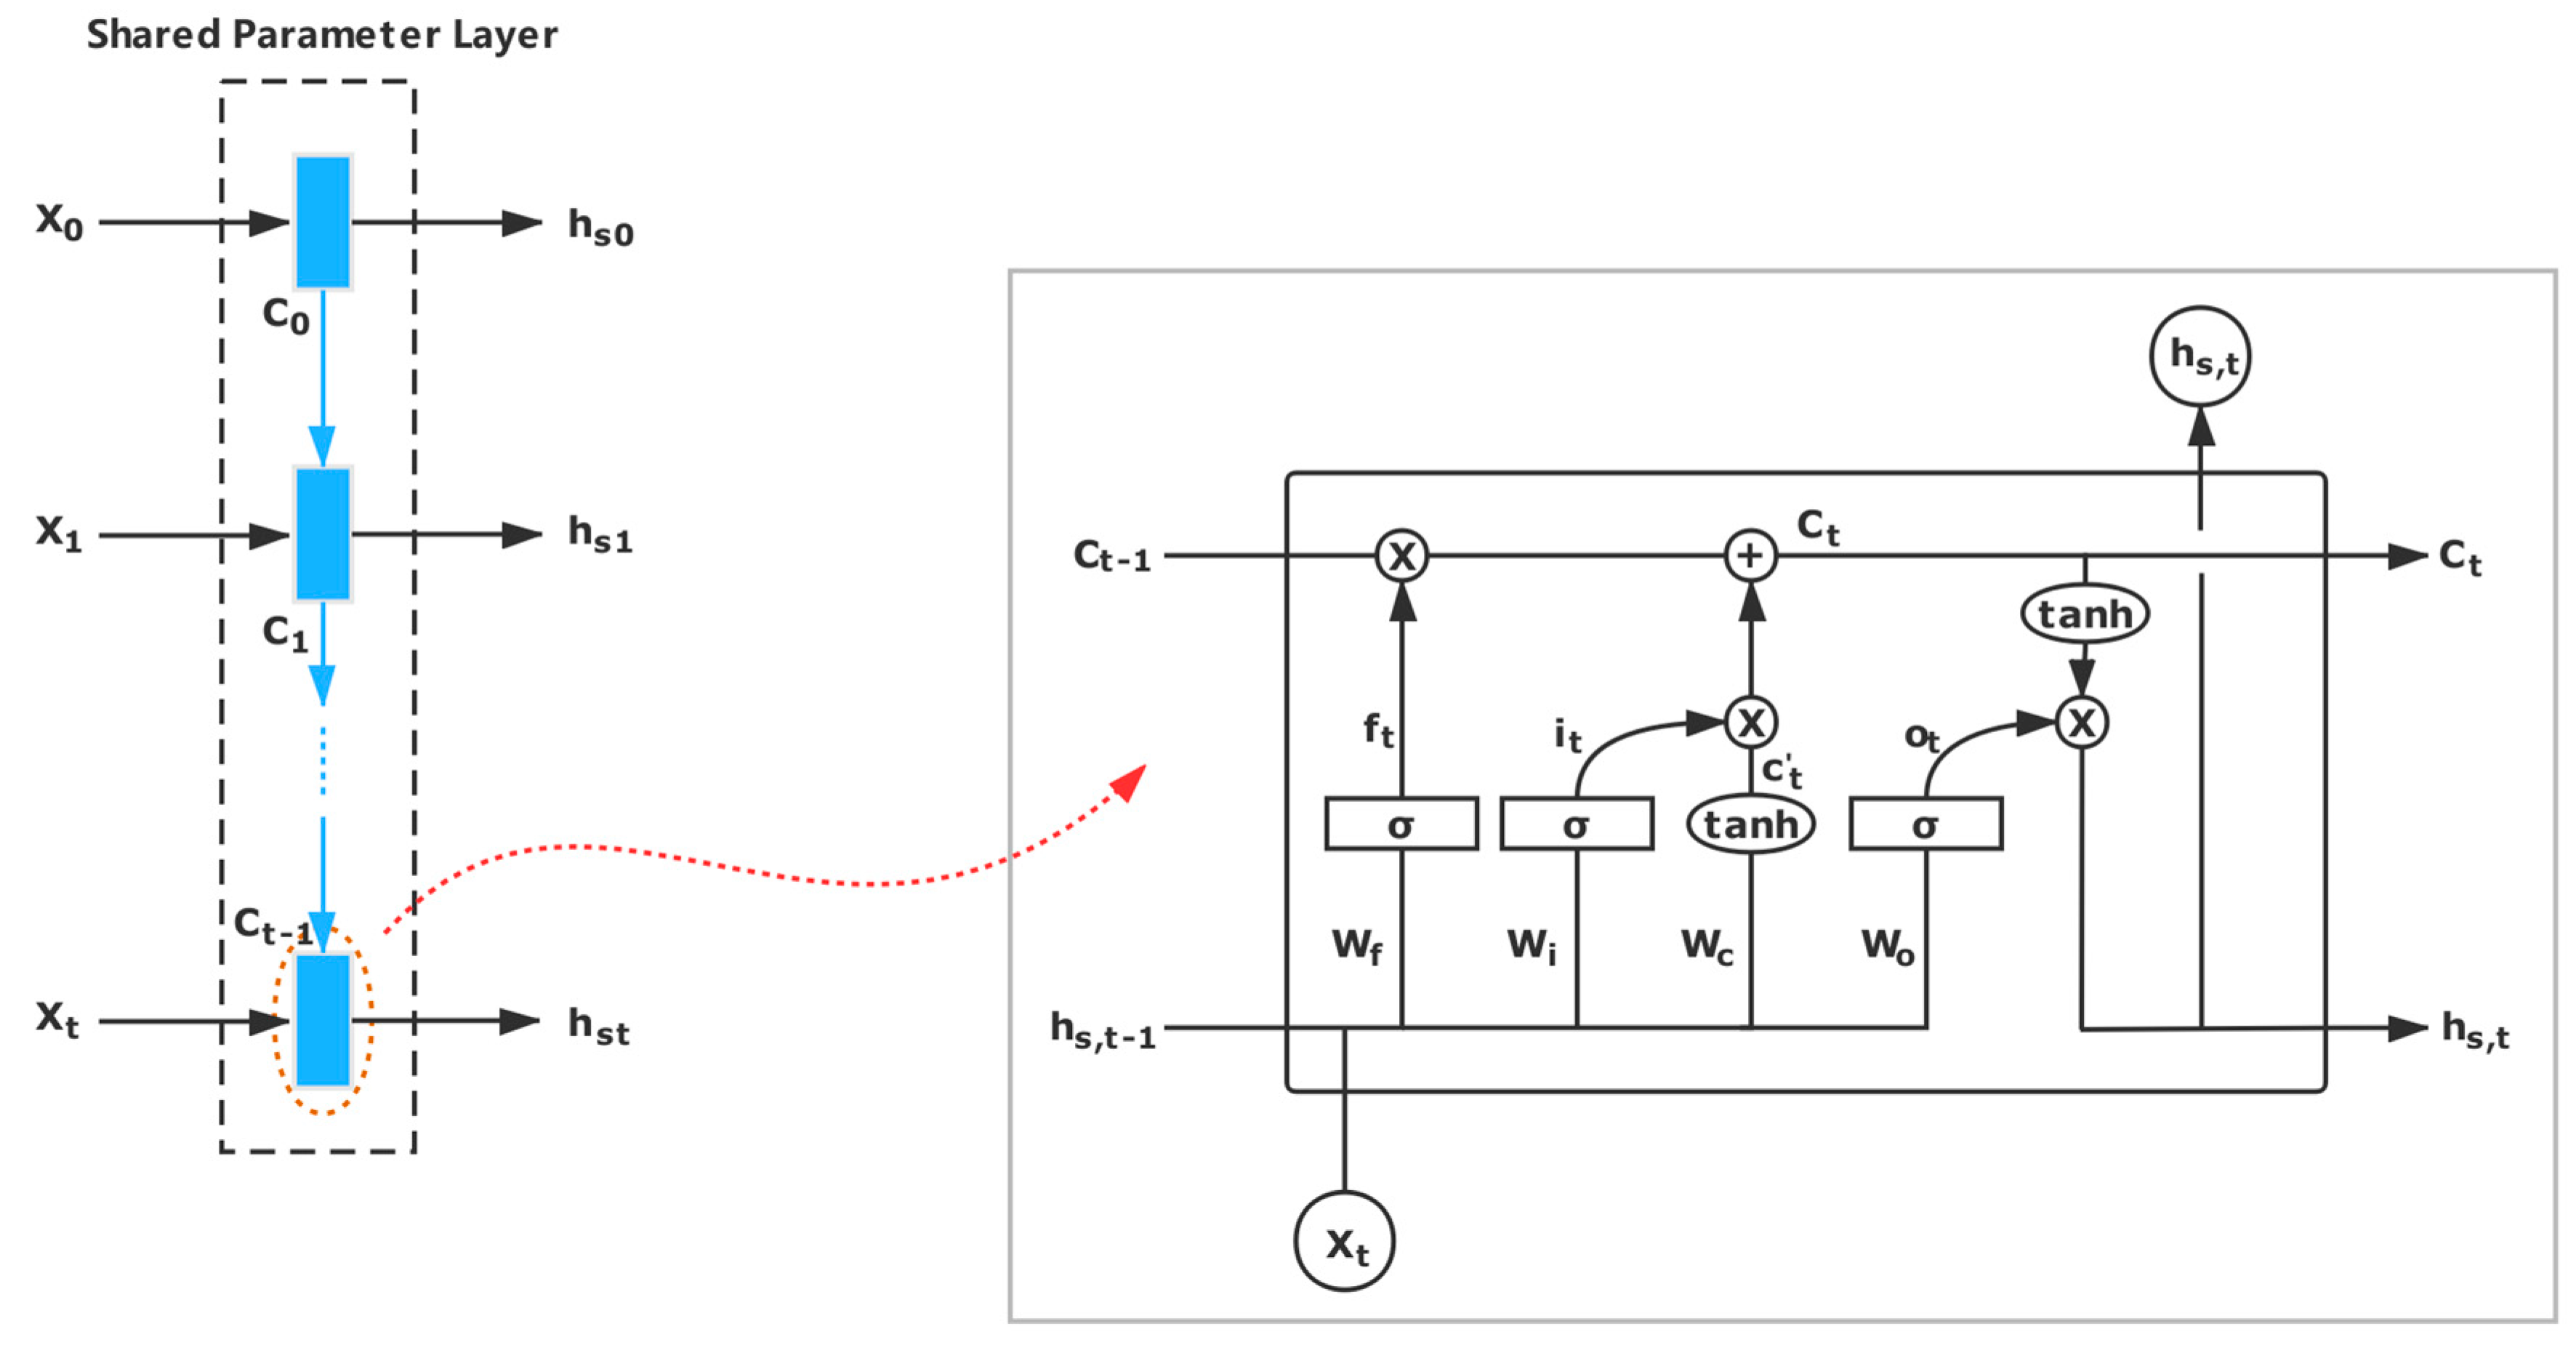
2.3. LSTM
3. Method
3.1. Framework
3.2. Multi-Task Learning
3.2.1. Fully-Connected Multi-Layer LSTM Neural Network
3.2.2. Shared Parameters Layer
3.2.3. Attention Mechanism
3.3. Loss Function with Cross Entropy
3.3.1. Loss Function
3.3.2. Training
4. Experiment
4.1. Data
4.2. Baselines
4.3. Evaluation Metrics
4.4. Experimental Details
4.5. Result
5. Conclusions
Author Contributions
Funding
Conflicts of Interest
Appendix A


| ID | Public | Test Input | Test Output | Time Limitation | Memory Limitation | Weight |
|---|---|---|---|---|---|---|
| 1 | Yes | 3, 4, 5 | Yes | 1 s | 0KB | 1 |
| 2 | Yes | 1, 4, 6 | No | 1 s | 0KB | 1 |
| 3 | Yes | −1, 2, 3 | Error Input | 1 s | 0KB | 1 |
| 4 | Yes | 3, 6, 6 | Yes | 1 s | 0KB | 1 |
| 5 | No | 3, 3, 3 | Yes | 1 s | 0KB | 1 |
| 6 | No | −5, 7, 9 | Error Input | 1 s | 0KB | 1 |
| 7 | No | 1, 4, 9 | No | 1 s | 0KB | 1 |
| Feature | Meaning |
|---|---|
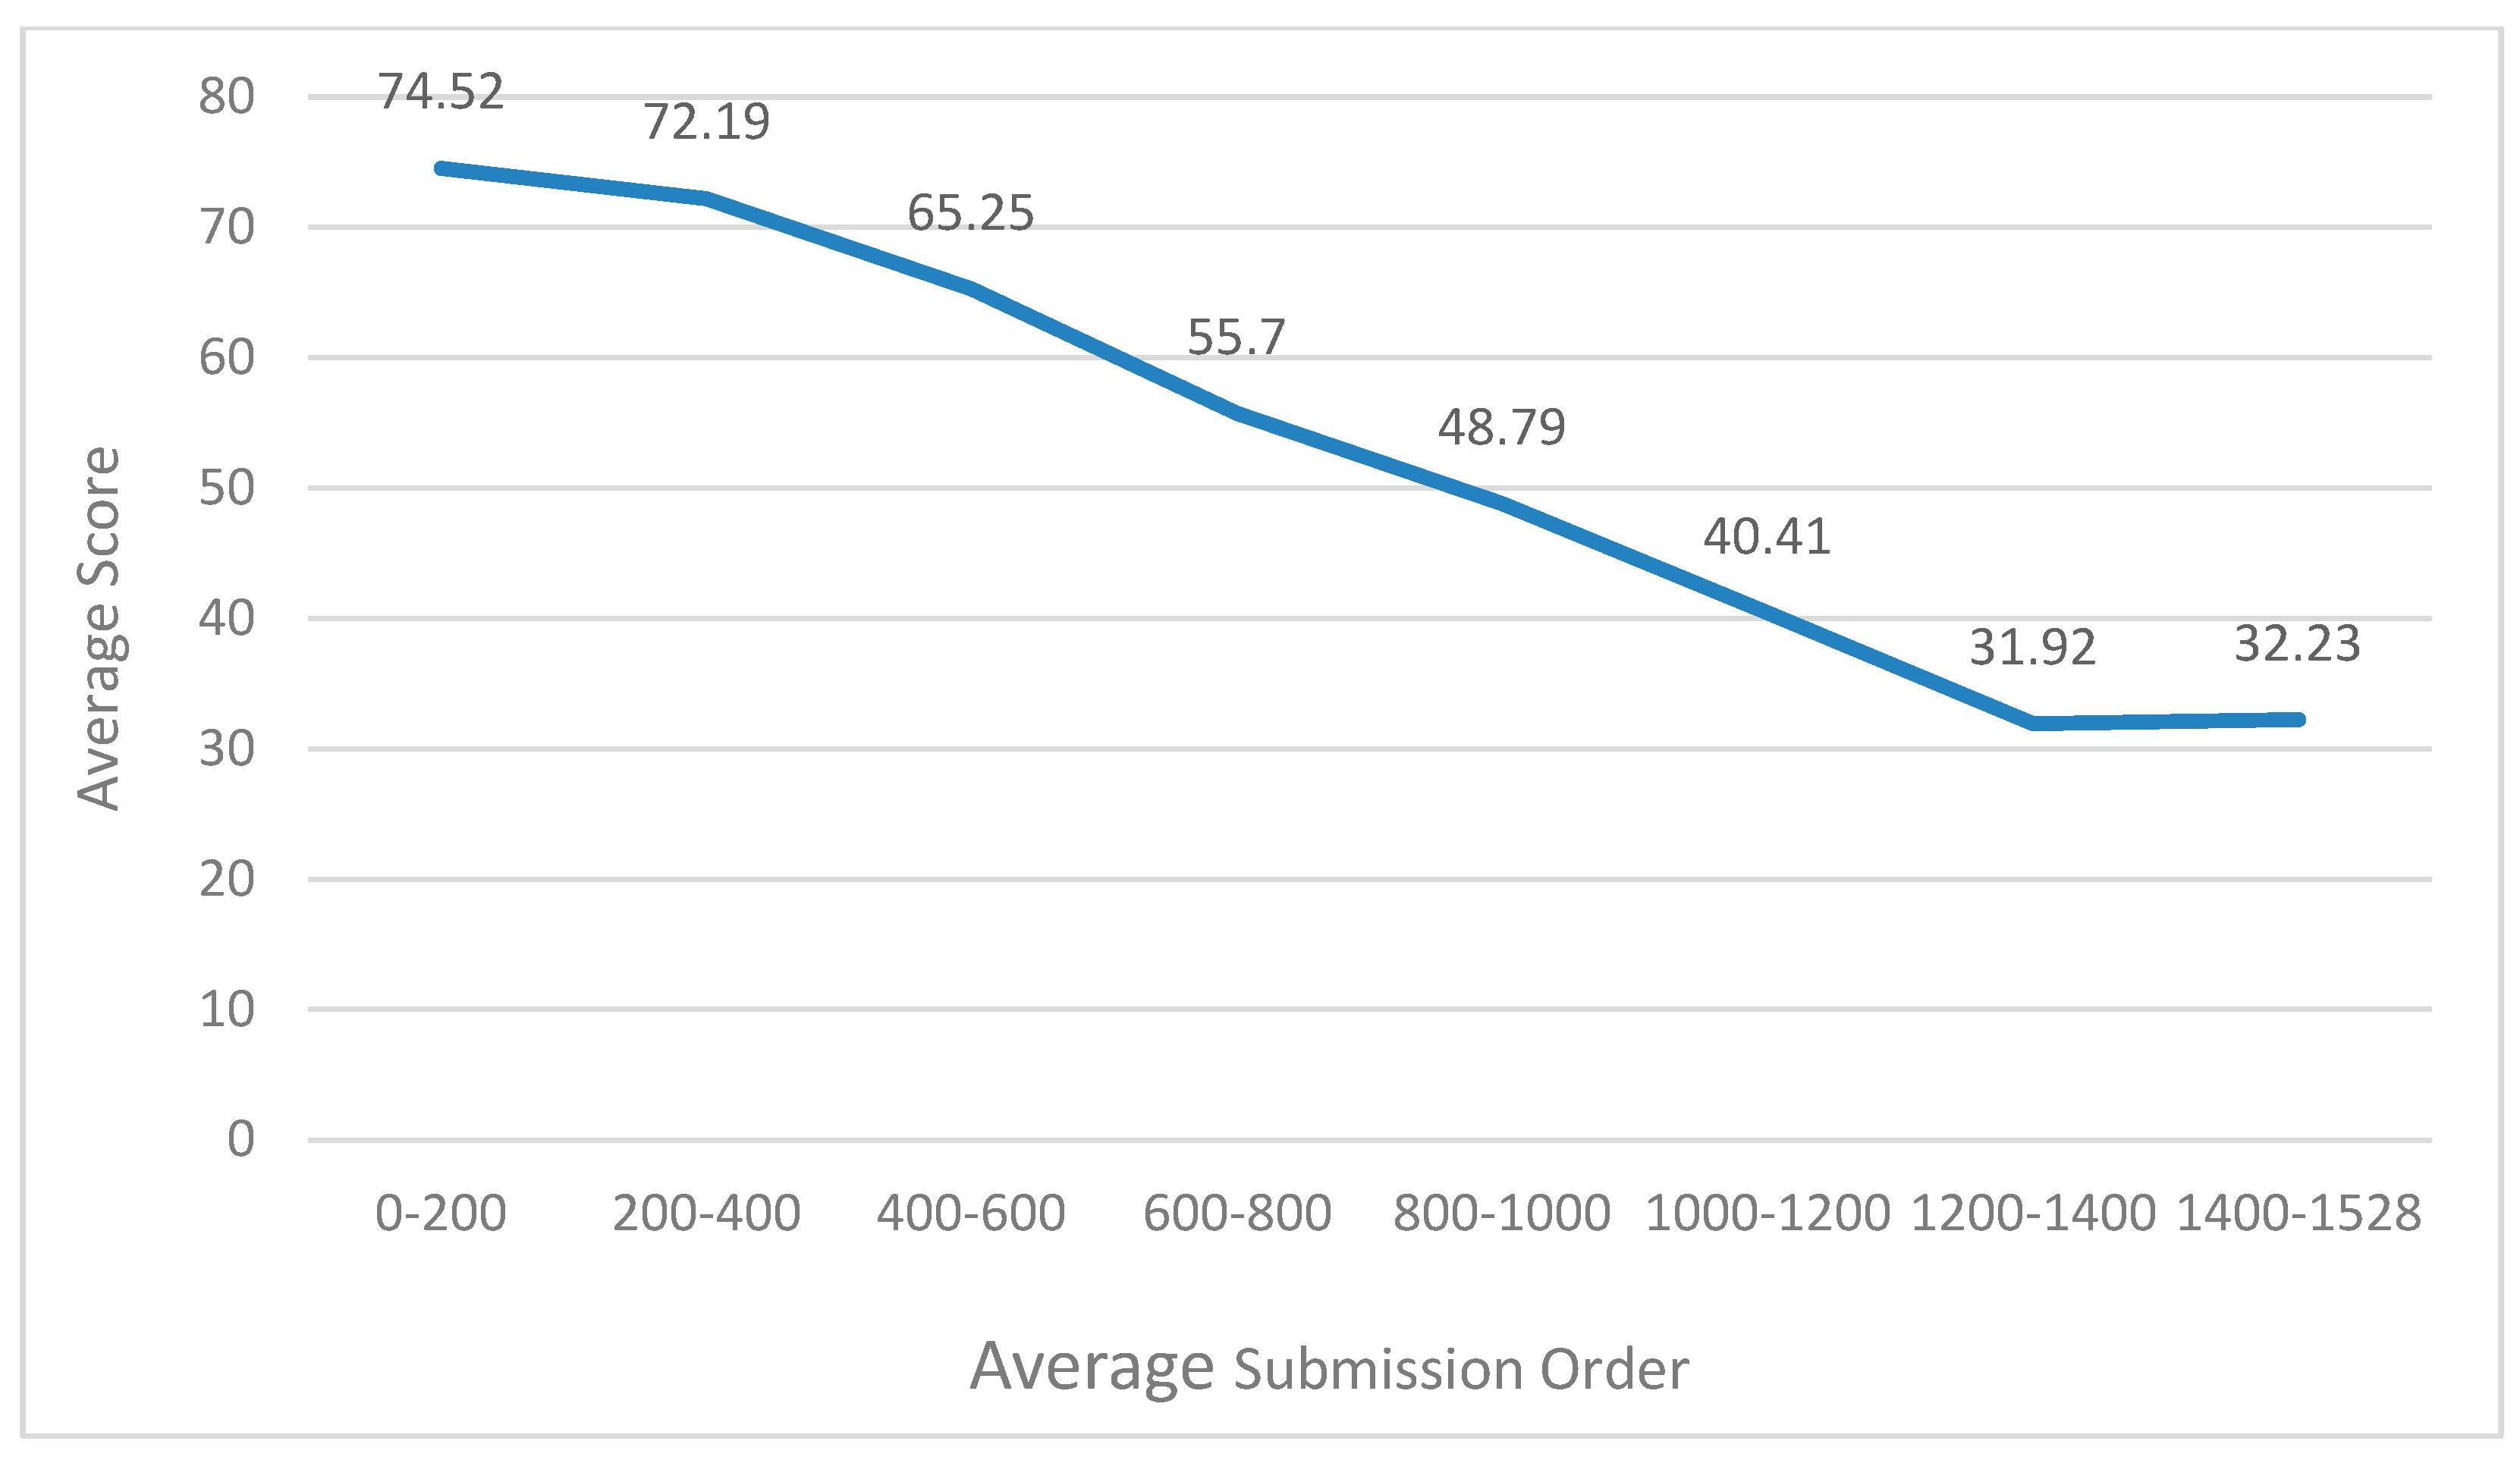
| Average First Submission Order | Order of submitting one assignment to the website for the first-time |
| Average Submission Times | Average value of submission times for all assignments |
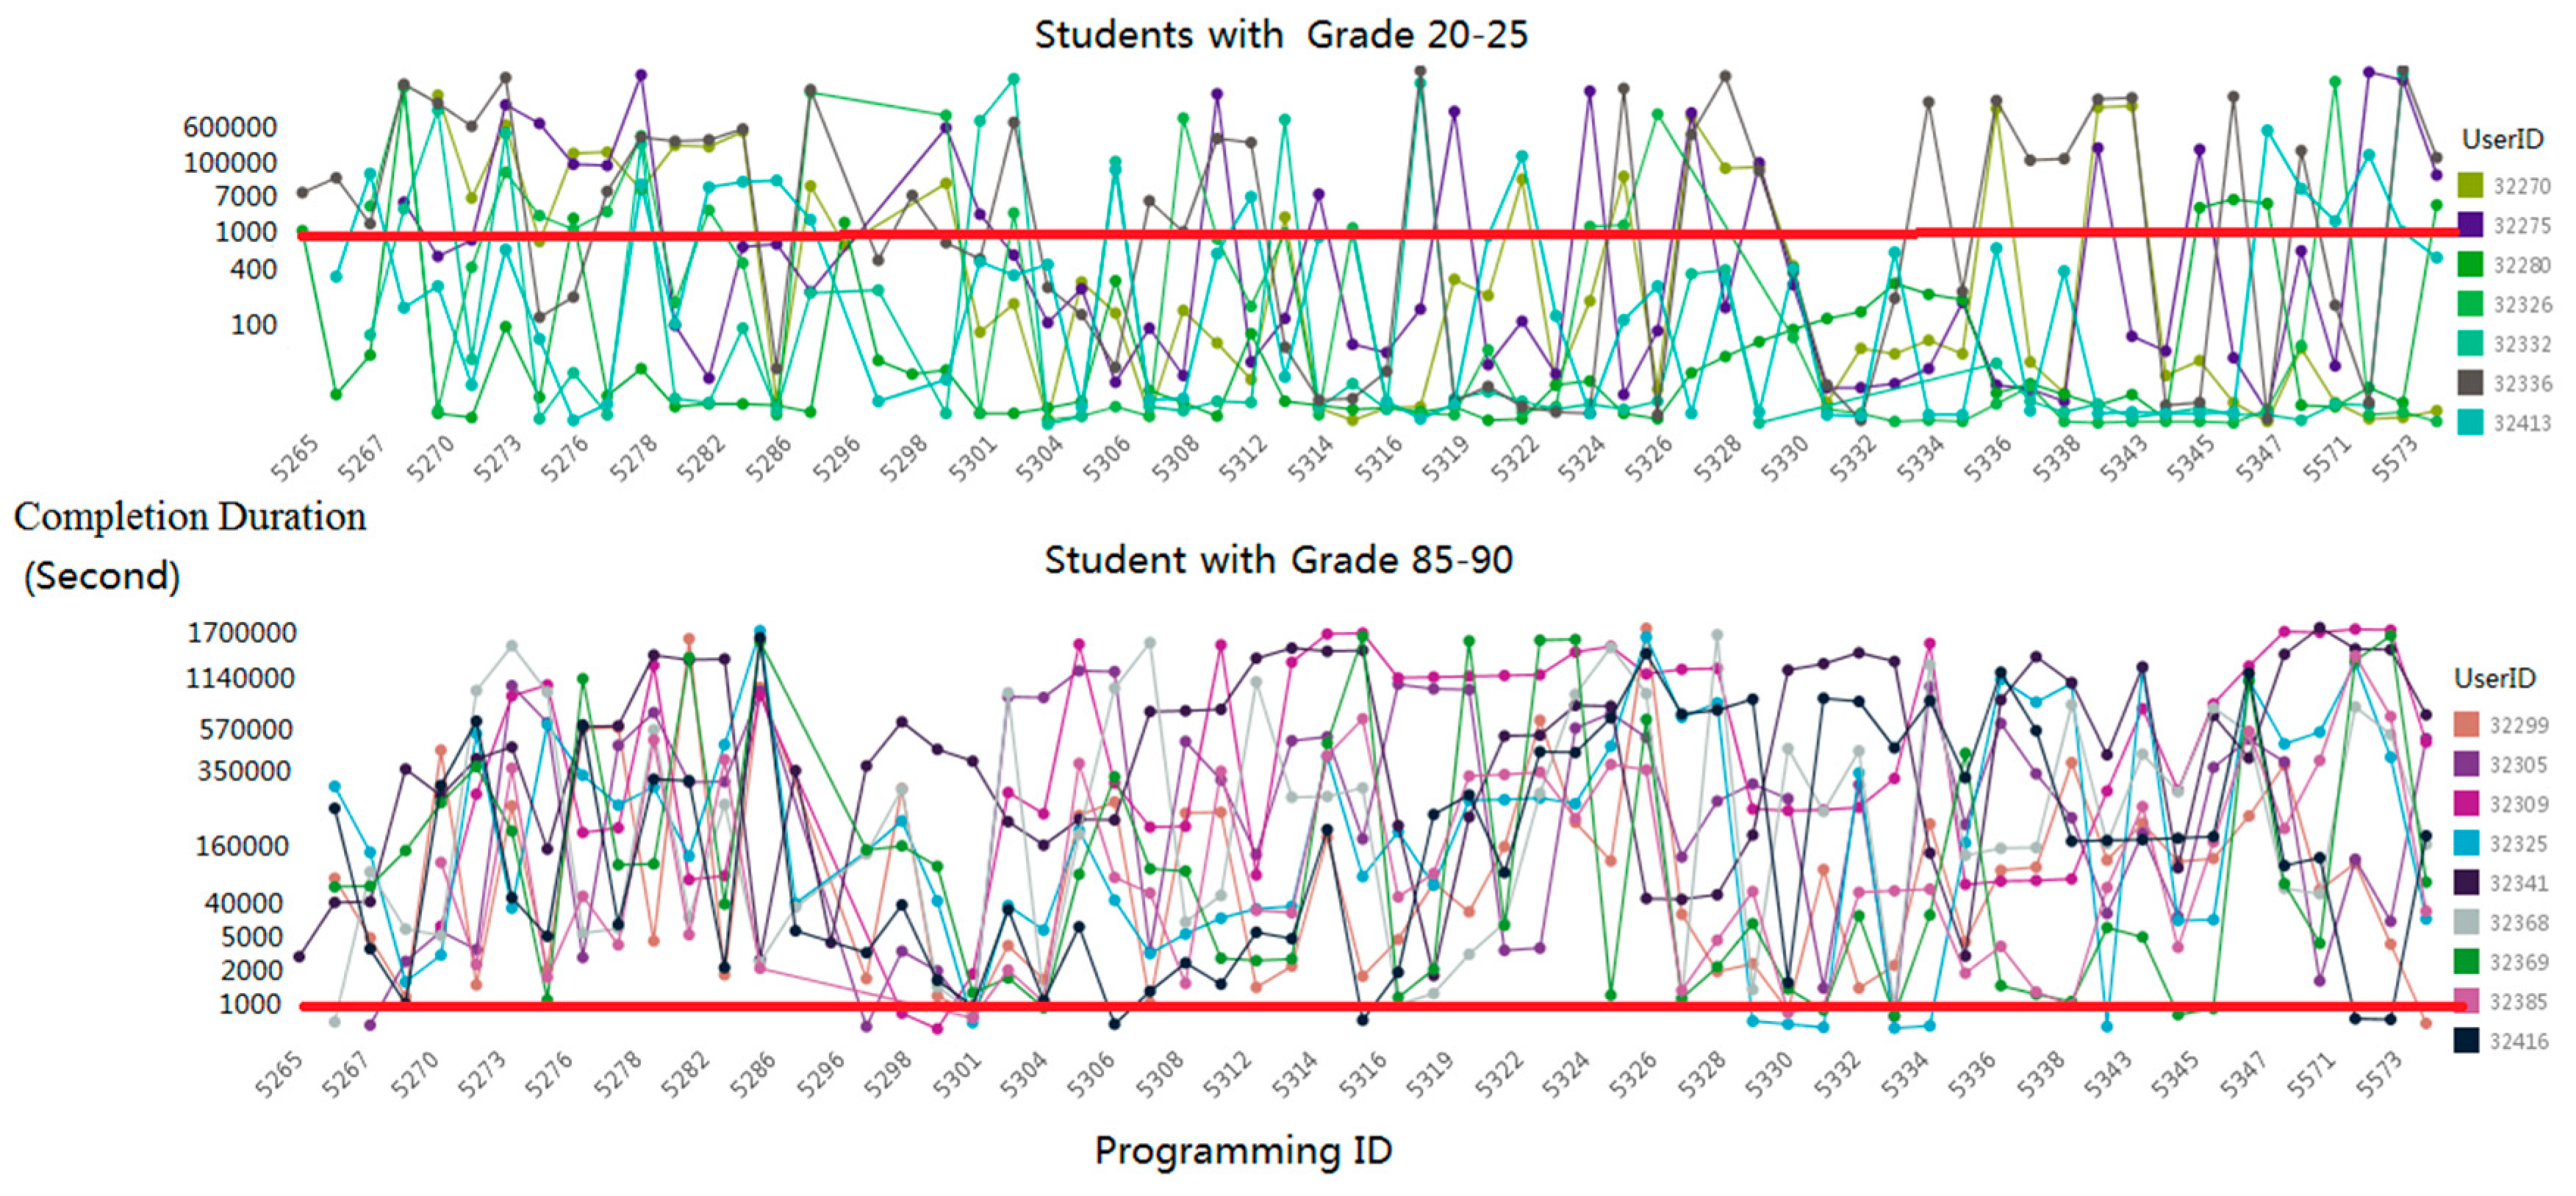
| Average Completion Duration | Average value of completion duration for all assignments |
| One-Time Pass Number | Number passing all cases for one submission in all assignments |
| Quick Submission Times | Quick submission times of all assignments |
| Completion time | The time when a student submitted an assignment |
References
- Smith, M. Opening education. Science 2009, 323, 89–93. [Google Scholar] [CrossRef] [PubMed]
- d’Oliveira, C.; Carson, S.; James, K.; Lazarus, J. MIT OpenCourseWare: Unlocking knowledge, empowering minds. Science 2010, 329, 525–526. [Google Scholar] [CrossRef] [PubMed][Green Version]
- Peter, B.J.; Fronmueller, M.P. MOOCs and the future of higher education. J. Higher Ed. Theory Pract. 2013, 34, 36–43. [Google Scholar]
- Christensen, G.; Steinmetz, A.; Alcorn, B.; Bennett, A.; Woods, D.; Emanuel, E. The MOOC phenomenon: Who takes massive open online courses and why? SSRN Electron. J. 2014. [Google Scholar] [CrossRef]
- Ho, A.; Ho, A.; Reich, J.; Nesterko, S.; Seaton, D.; Mullaney, T.; Waldo, J.; Chuang, I. HarvardX and MITx: The first year of open online courses, fall 2012-summer 2013. SSRN Electron. J. 2014. [Google Scholar] [CrossRef]
- Martin, F. Will massive open online courses change how we teach? Commun. ACM 2012, 55, 26–28. [Google Scholar] [CrossRef]
- Romero, C.; Ventura, S.; García, E. Data mining in course management systems: Moodle case study and tutorial. Comput. Ed. 2008, 51, 368–384. [Google Scholar] [CrossRef]
- Cerezo, R.; Sánchez-Santillán, M.; Paule-Ruiz, M.; Núñez, J. Students’ LMS interaction patterns and their relationship with achievement: A case study in higher education. Comput. Ed. 2016, 96, 42–54. [Google Scholar] [CrossRef]
- Wayne, B.; Janie, G.; Suzanne, C. Implementing technology to prevent online cheating: A case study at a small southern regional university (SSRU). MERLOT J. Online Learn. Teach. 2009, 2, 230–238. [Google Scholar]
- Pang, Y.; Song, M.; Jin, Y.; Zhang, Y. Survey of MOOC related research. In Proceedings of the International Conference on Database Systems for Advanced Applications, Hanoi, Vietnam, 20–23 April 2015; pp. 181–189. [Google Scholar]
- Romero, C.; Ventura, S. Educational data science in massive open online courses. Wiley Interdiscip. Rev Data Min. Knowl. Discov. 2016, 7, e1187. [Google Scholar] [CrossRef]
- Qu, S.; Li, K.; Zhang, S.; Wang, Y. Predicting Achievement of Students in Smart Campus. IEEE Access 2018, 6, 60264–60273. [Google Scholar] [CrossRef]
- Conijn, R.; Van den Beemt, A.; Cuijpers, P. Predicting student performance in a blended MOOC. J. Comput. Assist. Learn. 2018, 34, 615–628. [Google Scholar] [CrossRef]
- Meier, Y.; Xu, J.; Atan, O.; Schaar, M. Personalized grade prediction: A data mining approach. In Proceedings of the 2015 IEEE International Conference on Data Mining, Atlantic City, NJ, USA, 14–17 November 2015. [Google Scholar]
- Kahan, T.; Soffer, T.; Nachmias, R. Types of participant behavior in a massive open online course. Int. Rev. Res. Open Distribut. Learn. 2017, 18. [Google Scholar] [CrossRef]
- Rodrigues, R.L.; Ramos, J.L.C.; Silva, J.C.S.; Gomes, A.S. Discovery engagement patterns MOOCs through cluster analysis. IEEE Lat. Am. Trans. 2016, 14, 4129–4135. [Google Scholar] [CrossRef]
- Brinton, C.; Buccapatnam, S.; Chiang, M.; Poor, H. Mining MOOC clickstreams: Video-watching behavior vs. in-video quiz performance. IEEE Trans. Signal Proc. 2016, 64, 3677–3692. [Google Scholar] [CrossRef]
- Northcutt, C.; Ho, A.; Chuang, I. Detecting and preventing “multiple-account” cheating in massive open online courses. Comput. Ed. 2016, 100, 71–80. [Google Scholar] [CrossRef]
- Alexandron, G.; Ruipérez-Valiente, J.; Chen, Z.; Muñoz-Merino, P.; Pritchard, D. Copying@Scale: Using harvesting accounts for collecting correct answers in a MOOC. Comput. Ed. 2017, 108, 96–114. [Google Scholar] [CrossRef]
- Zhang, Y.; Yang, Q. An overview of multi-task learning. Natl. Sci. Rev. 2017, 5, 30–43. [Google Scholar] [CrossRef]
- Baxter, J. A Bayesian/information theoretic model of learning to learn via multiple task sampling. Mach. Learn. 1997, 28, 7–39. [Google Scholar] [CrossRef]
- Duong, L.; Cohn, T.; Bird, S.; Cook, P. Low Resource Dependency Parsing: Cross-lingual Parameter Sharing in a Neural Network Parser. In Proceedings of the 53rd Annual Meeting of the Association for Computational Linguistics and the 7th International Joint Conference on Natural Language Processing (Volume 2: Short Papers), Beijing, China, 26–31 July 2015. [Google Scholar]
- Yang, Y.; Hospedales, T. Trace Norm Regularised Deep Multi-Task Learning. arXiv 2016, arXiv:1606.04038. [Google Scholar]
- Hashimoto, K.; Xiong, C.; Tsuruoka, Y.; Socher, R. A joint many-task model: Growing a neural network for multiple NLP tasks. In Proceedings of the 2017 Conference on Empirical Methods in Natural Language Processing, Copenhagen, Denmark, 9–11 September 2017. [Google Scholar]
- Kendall, A.; Gal, Y.; Cipolla, R. Multi-task learning using uncertainty to weigh losses for scene geometry and semantics. In Proceedings of the 2018 IEEE Computer Society Conference on Computer Vision and Pattern Recognition, Salt Lake City, UT, USA, 18–23 June 2018; pp. 7482–7491. [Google Scholar]
- Zhang, Z.; Luo, P.; Loy, C.; Tang, X. Facial landmark detection by deep multi-task learning. In Proceedings of the Computer Vision—ECCV 2014, Zurich, Switzerland, 6–12 September 2014; pp. 94–108. [Google Scholar]
- Caruana, R. Multitask learning. Mach. Learn. 1997, 28, 41–75. [Google Scholar] [CrossRef]
- Hochreiter, S.; Schmidhuber, J. Long short-term memory. Neural Comput. 1997, 9, 1735–1780. [Google Scholar] [CrossRef] [PubMed]
- Gers, F.A.; Schmidhuber, J.; Cummins, F. Learning to forget: Continual prediction with LSTM. Neural Comput. 2000, 12, 2451–2471. [Google Scholar] [CrossRef] [PubMed]
- Song, S.; Lan, C.; Xing, J.; Zeng, W.; Liu, J. Spatio-temporal attention-based LSTM networks for 3D action recognition and detection. IEEE Trarns. Image Proc. 2018, 99, 3459–3471. [Google Scholar] [CrossRef] [PubMed]
- Trigeorgis, G.; Ringeval, F.; Brueckner, R.; Marchi, E.; Nicolaou, M.A.; Schuller, B.; Zafeiriou, S. Adieu features? End-to-end speech emotion recognition using a deep convolutional recurrent network. In Proceedings of the 2016 IEEE International Conference on Acoustics, Speech and Signal Processing (ICASSP), Shanghai, China, 20–25 March 2016; pp. 5200–5204. [Google Scholar]
- Alahi, A.; Goel, K.; Ramanathan, V.; Robicquet, A.; Fei-Fei, L.; Savarese, S. Social lstm: Human trajectory prediction in crowded spaces. In Proceedings of the 2016 IEEE Conference on Computer Vision and Pattern Recognition, Las Vegas, NV, USA, 26 June–1 July 2016; pp. 961–971. [Google Scholar]
- Huang, Z.; Xia, J.; Li, F.; Li, Z.; Li, Q. A Peak Traffic Congestion Prediction Method Based on Bus Driving Time. Entropy 2019, 21, 709. [Google Scholar] [CrossRef]
- Duch, W.; Wieczorek, T.; Biesiada, J.; Blachnik, M. Comparison of Feature Ranking Methods Based on Information Entropy. In Proceedings of the 2004 IEEE International Joint Conference on Neural Networks (IEEE Cat. No. 04CH37541), Budapest, Hungary, 25–29 July 2004; Volume 2, pp. 1415–1419. [Google Scholar]
- Hu, Q.; Guo, M.; Yu, D.; Liu, J. Information entropy for ordinal classification. Sci. China Inf. Sci. 2010, 53, 1188–1200. [Google Scholar] [CrossRef]
- Robinson, D.W. Entropy and uncertainty. Entropy 2008, 10, 493–506. [Google Scholar] [CrossRef]
- Rubinstein, R. The Cross-Entropy Method for Combinatorial and Continuous Optimization. Methodol. Comput. Appl. Probab. 1999, 1, 127–190. [Google Scholar] [CrossRef]
- Almgren, K.; Krishna, M.; Aljanobi, F.; Lee, J. AD or Non-AD: A Deep Learning Approach to Detect Advertisements from Magazines. Entropy 2018, 20, 982. [Google Scholar] [CrossRef]
- Wang, C.; Yang, H.; Meinel, C. Image captioning with deep bidirectional LSTMs and multi-task learning. ACM Trans. Multimed. Comput. Commun. Appl. 2018, 14, 40. [Google Scholar] [CrossRef]
- Dong, X.; Chowdhury, S.; Qian, L.; Li, X.; Guan, Y.; Yang, J.; Yu, Q. Deep learning for named entity recognition on Chinese electronic medical records: Combining deep transfer learning with multitask bi-directional LSTM RNN. PLoS ONE 2019, 14, e0216046. [Google Scholar] [CrossRef] [PubMed]


| Description | Number of Assignments |
|---|---|
| Basic knowledge | 7 |
| Drawing figure | 13 |
| Computational problems | 14 |
| Recursive structure | 8 |
| Case structure (if/else) | 4 |
| Loop structure (for and loop) | 6 |
| String operation | 9 |
| File operation | 2 |
| Sorting | 2 |
| Comprehensive calculation | 4 |
| Precision | Recall | |
|---|---|---|
| LR | 0.729 | 0.7163 |
| SVM | 0.7452 | 0.7065 |
| NB | 0.7437 | 0.7366 |
| MLP | 0.7539 | 0.7536 |
| LSTM | 0.8019 | 0.9283 |
| Precision | Recall | |
|---|---|---|
| LR | 0.7218 | 0.7190 |
| SVM | 0.7338 | 0.6582 |
| NB | 0.7290 | 0.7222 |
| MLP | 0.7372 | 0.7333 |
| LSTM | 0.8201 | 0.9865 |
| Method | Precision | Recall | F1 Score (95% CI) | |
|---|---|---|---|---|
| LSTM | Performance | 0.8019 | 0.9283 | 0.8605(0.8564–0.8646) |
| Knowledge Point | 0.8201 | 0.9865 | 0.8956(0.8896–0.9017) | |
| M-F-LSTM [39] | Performance | 0.9126 | 0.9285 | 0.9205(0.9173–0.9236) |
| Knowledge Point | 0.9733 | 0.9852 | 0.9792(0.9771–0.9814) | |
| M-S-LSTM [40] | Performance | 0.9248 | 0.9456 | 0.9351(0.9310–0.9392) |
| Knowledge Point | 0.9928 | 0.9896 | 0.9912(0.9888–0.9935) | |
| The proposed method | Performance | 0.9252 | 0.9468 | 0.9359(0.9347–0.9371) |
| Knowledge Point | 0.9958 | 0.9914 | 0.9936(0.9920–0.9951) | |
© 2019 by the authors. Licensee MDPI, Basel, Switzerland. This article is an open access article distributed under the terms and conditions of the Creative Commons Attribution (CC BY) license (http://creativecommons.org/licenses/by/4.0/).
Share and Cite
Qu, S.; Li, K.; Wu, B.; Zhang, X.; Zhu, K. Predicting Student Performance and Deficiency in Mastering Knowledge Points in MOOCs Using Multi-Task Learning. Entropy 2019, 21, 1216. https://doi.org/10.3390/e21121216
Qu S, Li K, Wu B, Zhang X, Zhu K. Predicting Student Performance and Deficiency in Mastering Knowledge Points in MOOCs Using Multi-Task Learning. Entropy. 2019; 21(12):1216. https://doi.org/10.3390/e21121216
Chicago/Turabian StyleQu, Shaojie, Kan Li, Bo Wu, Xuri Zhang, and Kaihao Zhu. 2019. "Predicting Student Performance and Deficiency in Mastering Knowledge Points in MOOCs Using Multi-Task Learning" Entropy 21, no. 12: 1216. https://doi.org/10.3390/e21121216
APA StyleQu, S., Li, K., Wu, B., Zhang, X., & Zhu, K. (2019). Predicting Student Performance and Deficiency in Mastering Knowledge Points in MOOCs Using Multi-Task Learning. Entropy, 21(12), 1216. https://doi.org/10.3390/e21121216