Abstract
Fault prediction is an important research area that aids software development and the maintenance process. It is a field that has been continuously improving its approaches in order to reduce the fault resolution time and effort. With an aim to contribute towards building new approaches for fault prediction, this paper proposes Entropy Churn Metrics (ECM) based on History Complexity Metrics (HCM) and Churn of Source Code Metrics (CHU). The study also compares performance of ECM with that of HCM. The performance of both these metrics is compared for 14 subsystems of 5different software projects: Android, Eclipse, Apache Http Server, Eclipse C/C++ Development Tooling (CDT), and Mozilla Firefox. The study also analyses the software subsystems on three parameters: (i) distribution of faults, (ii) subsystem size, and (iii) programming language, to determine which characteristics of software systems make HCM or ECM more preferred over others.
1. Introduction
With growing research in the field of software engineering, many fault prediction approaches have been developed. Predicting faults in software helps software developers and maintainers to focus on more fault-prone entities. More time and effort is expended on fault-prone software components during software development and the maintenance process. Software metrics are used to measure the degree to which a software system possesses a certain characteristic [1]. Fault prediction is also usually based on certain characteristics of the software development process (i.e., software metrics are used to predict faults in a software system). For instance, Chidamber and Kemerer (CK) metrics are a set of popular software metrics used for fault prediction [2]. Also, Khoshgoftaar et al. devised a metric suite for prediction offault-prone modules based on the amount of past modifications done in the code files [3]. Bernstein et al. employed temporal features such as number of changes and number of reported issues for predicting number of faults in future releases of the software [4].
There are many software metrics proposed for predicting faults in software systems and D’Ambros et al. conducted a broad comparison of popular fault prediction approaches, namely, Change Metrics, Previous Defects, Source Code Metrics, Entropy of Changes, Churn of Source Code Metrics, and Entropy of Source Code Metrics [5]. D’Ambros et al. extended their study and provided an open source benchmark dataset for fault prediction, for evaluation of a variety of fault prediction approaches [6]. The benchmark dataset consisted of metrics for five open source software systems. Source code metrics and churn of source code metrics are both popular metrics for fault prediction. Churn of source code metrics were shown to perform better than source code metrics for fault prediction [6]. Entropy of software system is another metric which is used for fault prediction, but the concept of churn of entropy has not yet been proposed and evaluated. With this motivation, this paper proposes Entropy Churn Metrics (ECM) for prediction of faults in software systems. Its performance is compared with History Complexity Metrics (HCM), which model entropy of changes in software subsystems [7]. Both these metrics are based on the concept of entropy of software change. HCM is based on absolute value of entropy, whereas ECM models the change in entropy. In this study, ECM is evaluated to determine whether churn-of-entropy-based metrics can be used for efficient prediction of faults in a software system. The study also aims to determine when it is better to use churn of entropy (ECM) over entropy (HCM) for predicting faults in a software subsystem and vice versa. The fault prediction performance of both these metrics is evaluated on 14 software subsystems from 5software projects, namely Android, Eclipse, Apache Http Server, Eclipse C/C++ Development Tooling (CDT), and Mozilla Firefox. The software subsystems chosen for the study are of different sizes, are written in different programming languages, and have varying distribution of faults. This would help in analyzing and determining the tendency of certain types of subsystems to favor a particular metric over another.
The rest of the paper is organized as: Section 2 discusses related work in the area of fault prediction and entropy; Section 3 proposes ECM and describes other related metrics. Research materials and methods are described in Section 4 and results are presented and analyzed in Section 5. Results are discussed in Section 6, while Section 7 discusses threats to the validity of the study. Finally, in Section 8, the study is concluded.
2. Related Work
Entropy is used to measure the degree of randomness or uncertainty in the system. Apart from thermodynamics and information theory, entropy measures are being used in a variety of other areas. Gou et al. have used hesitant fuzzy linguistic entropy and cross-entropy measures for multiple criteria decision making [8]. The hesitant fuzzy linguistic entropy and cross-entropy measures are used to determine the weights for the multiple criteria, so that a ranking of alternatives is obtained. Pramanik et al. have also used cross-entropy measures of bipolar and interval bipolar neutrosophic sets to develop two approaches for multiattribute decision making [9]. Entropy measures also have applications for water monitoring. Keum et al. [10] review and summarize the applications of entropy for water monitoring network design, such as usage of entropy weight method to measure the water quality [11]. Wu et al. [12], employ a joint entropy-based learning model for optimizing image retrieval. Thus entropy has applications in many fields, including fields like the stock market [13]. In fact, Baldwin has used maximum entropy modelling to determine distribution and habitat selection for various wildlife species [14]. In this study, an entropy-based metric (i.e., ECM) is proposed to model churn of entropy of software code changes. The proposed metric (i.e., ECM) is used for predicting faults in software systems and its performance is compared with HCM.
Fault prediction is an active research area in the field of software engineering. Many techniques and metrics have been developed to improve fault prediction performance. D’Ambros et al. have compared popular fault prediction approaches for software systems [6], namely, process metrics [15], previous faults [16], source code metrics [17], entropy of changes [7], churn of source code metrics [18], and entropy of source code metrics [6]. Nagappan and Ball proposed a technique for prediction of defect density of the system using relative code churn measures and compared its performance with absolute churn metrics [19]. Hassan proposed absolute entropy metrics or HCM that modelled the complexity of code changes and validated its use for fault prediction [7]. In this study, it is proposed to extend entropy metrics and predict faults on the basis of change in entropy (ECM) rather than absolute value of entropy (HCM). The concept of churn of entropy had not been established earlier, thereby making its evaluation essential to fault prediction research.
Fault prediction is based not only on the current characteristics of the software, but on the entire software evolution history. Historical data stored in software repositories has been time and again used for fault prediction. For instance, Raja et al. presented a time series analysis of software faults from eight different open source software (OSS) projects [20]. It was found that the time series model accurately predicted the software evolution faults for all of the eight OSS projects. Wu et al. also conducted a study that used time series analysis for prediction of fault numbers [21]. The study compared three different approaches for time series analysis on bug data from Debian software. Faults are closely related to changes made in the software systems and studying the changes that take place during software evolution is also important. Yazdi et al. studied the evolution of changes in the software systems using reverse-engineered class diagrams from nine open source Java projects [22]. It was observed that only discrete Pareto, Waring, Yule, and Beta-Negative Binomial distributions were able to satisfactorily describe the observed evolution of changes. Further, Yazdi et al. proposed a framework that captured the changes between model revisions [23]. Forecasting and simulation performance of different time series models were also tested. In this study also, the software changes are analyzed to compute ECM and HCM that are used for predicting faults.
Entropy-based measures have been used for various purposes in software engineering research. For instance, Trienekens et al. used the concept of internal and external entropy to model the level of disorder in the system and its environment, and then based process improvement on these suggested directions [24]. Allen et al. also proposed measures for size, complexity, and coupling of software using entropy and information theory concepts [25]. Ma combined fractal and entropy measures to determine self-similarity and structural ordering in software [26]. Kaur et al. evaluated entropy-based fault prediction using neural-network-based regression [27] and locally weighted regression [28]. Kaur et al. also studied and compared machine learning techniques for entropy-based fault prediction without reference to churn of entropy [29]. In this paper, a new metric Entropy Churn Metric (ECM) based on History Complexity Metric (HCM) is proposed. It takes into account the complexity of code changes for fault prediction and calculates its churn. ECM is calculated using HCM similar to Source Code Churn Metrics [18], which calculated the churn of source code metrics.
Researchers have been conducting studies to review and compare existing fault prediction approaches. Comparison of approaches leads to better understanding of performance of various approaches on different types of software projects. Radjenovic et al. conducted a review on fault prediction metrics which identified and analyzed the applicability of various fault prediction metrics [30]. The review not only discussed the applicability of fault prediction metrics, but also reported the datasets on which these metrics had been evaluated. It also tried to determine the correlation between the software development phase of the project and the fault prediction metric used. Similarly in this study, ECM and HCM are not only compared, but an effort is made to establish a relation between choice of entropy metric, that is, ECM (churn of entropy) and HCM (absolute entropy), and characteristics of the software system.
D’Ambros et al. conducted a study for evaluating various fault prediction approaches [6]. They not only evaluated the performance of different fault prediction metrics, but also provided a benchmark dataset for other researchers. It was concluded that the difference in results obtained by churn of source code and entropy metrics was not statistically significant. The main intuition for proposing churn of entropy is that degree of change in entropy will better model the faults rather than the absolute value of entropy.
Canfora et al. empirically evaluated the relationship between complexity of source code and entropy of code changes based on four factors, namely, refactoring activities, number of developers working on a file, involvement of classes in design patterns, and type of change [31]. Their study tried to understand whether different types of changes produce a different magnitude of change in entropy. It was observed that for different types of changes, the difference in change in entropy was also statistically significant. In this study, ECM is used to model change in entropy, with an intuition that it is the change in entropy, rather than the absolute value of entropy, which leads to an indication of the number of faults in the software system.
Our study proposes a new fault prediction metric, that is, Entropy Churn Metric (ECM) based on HCM and churn of source code metric. It also compares the performance of the proposed metric (i.e., ECM with that of HCM). This will help determine whether it is better to use entropy of changes or churn of entropy of changes. The study not only proposes a new metric for fault prediction based on entropy of changes, but also investigates which metric is more suitable for what type of software systems. The software systems are characterized based on three parameters: (i) distribution of faults, (ii) system size, and (iii) programming language, to determine when it is preferable to use ECM over HCM and vice versa.
3. Entropy Churn Metrics
Entropy Churn Metrics (ECM) are derived from History Complexity Metrics (HCM). ECM combines concepts of entropy of changes and churn of source code metrics. Before proposing the new metric for fault prediction (i.e., ECM), the following subsections describe HCM and churn of source code metrics.
3.1. History Complexity Metrics
HCM was given by Hassan [7]. Hassan measured the complexity of source code changes and quantified it using entropy of changes [7]. Entropy of changes for a particular time period (taken as one year for this study) is calculated using Shannon entropy [32], as defined in Equation (1).
where n denotes number of files in the software system and Pf is the probability of changes in file f during the time period under consideration.
To account for different numbers of files in different software systems, the entropy defined in Equation (1) is normalized to give normalized entropy as defined in Equation (2).
This entropy of changes is used to calculate the History Complexity Metric (HCM). HCM of a file b is calculated using Equation (3).
where, {i,…,j} denotes the set of evolution periods and HCPFk(b) denotes the History Complexity Period Factor of file b for time period k. HCPF for file b is calculated using Equation (4).
where Normalized Entropyk is the value of normalized entropy for the time period k, Mk is the set of files modified in period k, and Complexitykb has the following three definitions:
- HCM1: Complexitykb = 1, Complexity associated with file b in period k is equal to one and HCPF is equal to the value of Normalized Entropy.
- HCM2: Complexitykb = Pb, Complexity is equal to the probability of changes in file b in period k for files modified in that period. Otherwise, it is equal to zero.
- HCM3: Complexitykb = 1/|Mk|, Complexity is equal to reciprocal of number of files modified in period k for files modified in that period. Otherwise, it is equal to zero.
HCM for a subsystem S over the set of evolution periods {i,…,j} is defined as the sum of HCM for all files in the subsystem as given in Equation (5).
3.2. Churn of Source Code Metrics
Churn of source code metrics were first used by Nikora and Munson [18]. In [6], Dambros et al. compared this metric with other popular fault prediction metrics. The intuition behind use of churn of source code metrics was that it may provide better results than simple source code metrics like number of added and deleted lines of code. To calculate churn of source code metrics, the source code history needs to be sampled over every predefined period of time, say, two weeks, one month, or a year. If a class does notexist in a particular version, then its metric value is set to −1 (default value). The delta value of the source code metrics is calculated for each consecutive pair of samples using Equation (6).
where vx is the value of metric at sample x and vy is the value of metric at sample y; x and y are consecutive samples.
The churn value is then calculated using Equation (7).
where C is the number of samples. Thus churn is the summation of values of delta over all the samples excluding the samples where delta value is −1.
3.3. Entropy Churn Metrics (ECM)
The proposed Entropy Churn Metrics (ECM) enhance the History Complexity Metrics (HCM) by calculating the churn of entropy of code changes. This is done with the intuition that churn of entropy (i.e., churn of HCM) may provide better results than a simple entropy metric (i.e., HCM). The major motivation for proposing ECM is that, rather than absolute value of entropy, it may be the change in entropy that is a better predictor of faults.
HCM and HCPF values for all files in the selected system/subsystem are computed using Equations (1)–(4). The Entropy Churn (ECHU) for a file b for period j is computed using Equation (8).
where denotes the value of HCM metric of file b until period j.
The ECM for a subsystem is calculated as the sum of ECHU for all files in the subsystem as depicted in Equation (9).
Similar to HCM, ECM has three variants, namely, ECM1, ECM2, and ECM3. The three variants of ECM are depicted in Figure 1.
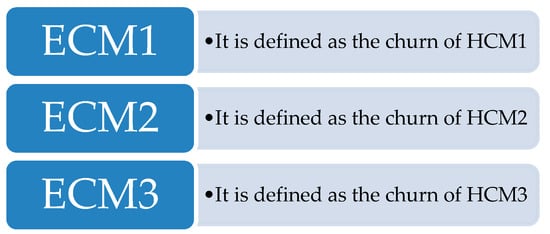
Figure 1.
Three variants of ECM.
In the next section, the detailed steps used for carrying out the research are described along with the datasets on which the ECM are evaluated.
4. Research Methodology
The process used for carrying out this study is depicted in Figure 2. The research was carried out in the following stages:
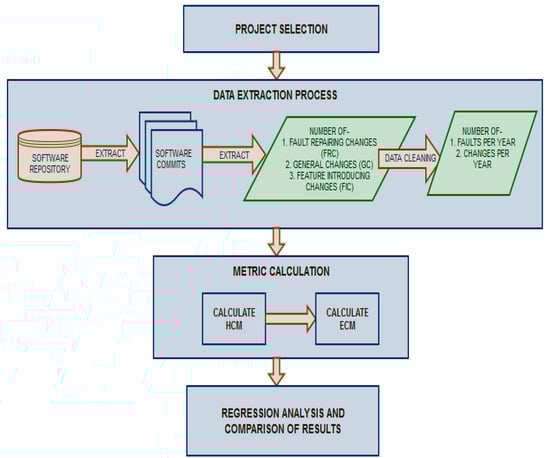
Figure 2.
Research Methodology.
- Project Selection: The first step was to determine the software projects and subsystems to be studied. The details of the software projects considered in this study are given in Section 4.1.
- Data Extraction: The second step was to collect the number of changes per year and the number of faults per year in the selected subsystems of the software projects under study. This was done by first extracting the commits from software repositories and then analyzing the commits to determine the type of change done in the commit. The data regarding the number of changes of each type was then cleaned to determine the number of changes and faults per year. The data extraction process along with metric calculation is described in detail in Section 4.2.
- Metric Calculation: The third step was metric calculation, which used the data collected in step two for calculating HCM and ECM. The data extraction and metric calculation processes are explained in Section 4.2.
- Regression Analysis and Comparison of Results: In the next step, the two metrics (i.e., ECM and HCM) were compared for fault prediction using regression analysis. Finally, the results were analyzed and the study was concluded. The results are analyzed and discussed in Section 5 and Section 6, respectively.
4.1. Selected Software Projects and Subsystems
Five software projects were selected to conduct the study, namely, Android, Eclipse, Apache Http Server, Eclipse C/C++ Development Tooling (CDT), and Mozilla Firefox. Three subsystems each of Android, Apache Http Server, Eclipse C/C++ Development Tooling (CDT), and Mozilla Firefox were examined in the study and two subsystems of Eclipse were examined. The details of these subsystems and repositories are given in Table 1. Mozilla data was collected from Mozilla Central [33], whereas data for all other software projects was collected from GitHub [34]. These subsystems were chosen on the basis of following criteria:

Table 1.
Software Projects and Subsystems studied.
- Size and Lifetime: The selected software subsystems included representatives from small-, medium-, and large-sized systems. The selected subsystems included both systems that had been released for several years as well as new systems that had been released only a few years ago. This criterion enabled us to determine the impact of size of the system on the prediction power of HCM and ECM.
- Programming Language: The selected software subsystems were programmed using different programming languages, namely, Java, C, and C++. Subsystems with different programming languages were selected so that the impact of programming language of the subsystem on prediction performance of ECM and HCM could be studied.
- Availability of Data: All data regarding the changes in the software subsystems was extracted from open source software repositories that are accessible to all.
4.2. Data Extraction and Metrics Calculation
Data required for computation of HCM and ECM was extracted from Mozilla Central and GitHub using a programmed tool [35]. The commits of each file in a subsystem were extracted using regular expression matching [36]. The extracted commits were then analyzed by the tool and the number of changes per year of each type was calculated. Similar to Hassan [7], the extracted changes are classified as follows:
- Fault Repairing Changes (FRCs): the changes that are made to the software system for removing a bug/fault. These changes usually represent the fault resolution process and do not represent the code change process.
- General Changes (GCs): the changes that are done for maintenance purposes and do not reflect any changed feature in the code. Examples of general changes include changes to copyright files and reindentation of the code.
- Feature-Introducing Changes (FICs): the changes that are done with the intention of enhancing the features of the software system. These changes truly reflect the code change process.
The tool returned data regarding the number of changes per year of each type in a particular file of the software system. Hassan used the number of FRCs to validate the study, as they represent the fault resolution process rather than the code change process and hence do not impact the complexity of code changes [7]. The number of GCs was also not used to calculate the complexity of code changes as GCs are only maintenance-related changes that do not impact features of the code. The number of FICs were used to calculate the complexity of code changes, as these changes truly reflect the code change process. Similarly, in this study, only FICs were used to model the complexity of code changes, FRCs were used for validating the number of faults, and GCs were discarded.
After extracting the number of changes per year in each file of the software subsystem, the probability of change was calculated for every file of the subsystem. HCM and ECM were then calculated using Equations (1)–(5), (8) and (9) as described in Section 3. Figure 3, Figure 4 and Figure 5 depict the box plots for HCM1, HCM2, and HCM3 metrics, respectively, for the 14 selected datasets. ECM1, ECM2, and ECM3 metrics for the 14 datasets are depicted in Figure 6, Figure 7 and Figure 8.
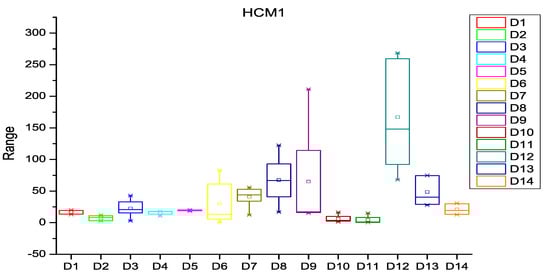
Figure 3.
Box plot for HCM1.
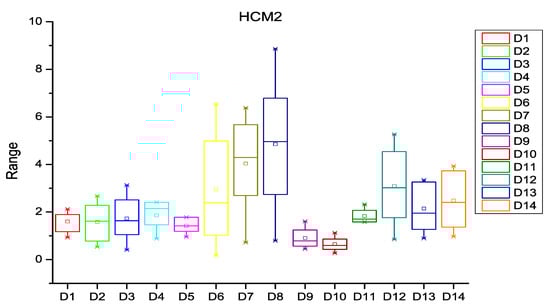
Figure 4.
Box plot for HCM2.
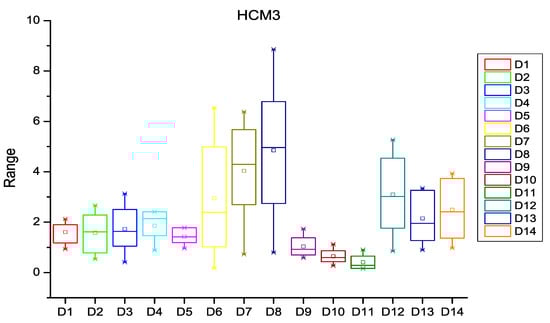
Figure 5.
Box plot for HCM3.
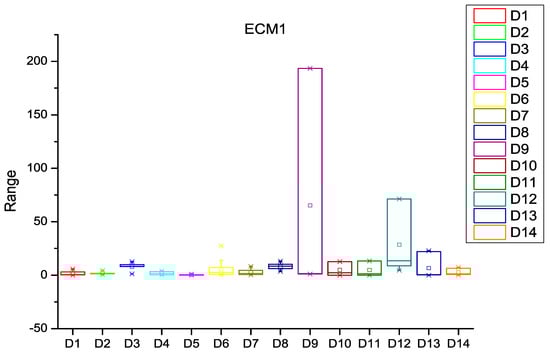
Figure 6.
Box plot for ECM1.
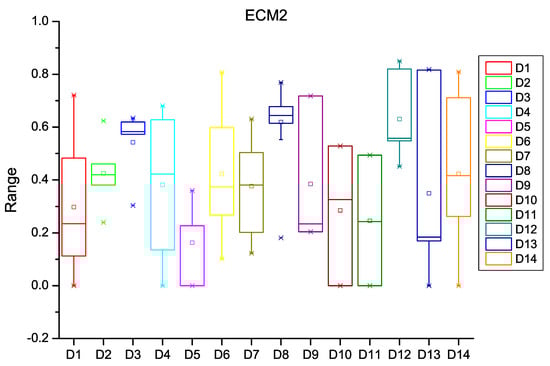
Figure 7.
Box plot for ECM2.
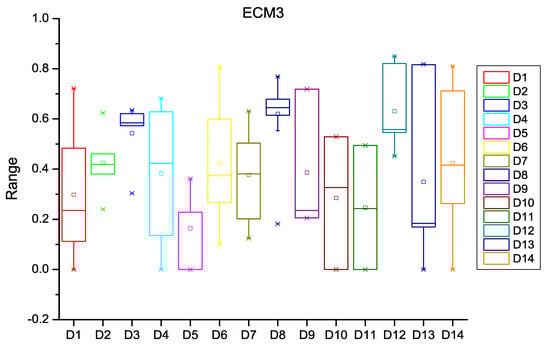
Figure 8.
Box plot for ECM3.
5. Results
The performance of ECM was compared with that of HCM. Linear regressionwas employed for the comparison of prediction power of both these metrics [37]. Rapid Miner Studio [38] was used for performing linear regression with number of faults as the dependent variable and HCM/ECM metric as independent variable. The following parameters were used for the Linear Regression operation:
- Feature selection method: M5 Prime
- Eliminate collinear features: TRUE
- Minimum tolerance: 0.05
- Use bias: TRUE
- Ridge: 1.0 × 10⁻⁸
Table 2 lists the Root Mean Square Error (RMSE) [39] observed for each metric.
Table 2.
RMSE of each metric.
The Friedman test was used to compare performance of the metrics over 14 datasets that were selected for this study [40]. The Friedman test ranks the performance of metrics for each dataset separately. The best performing metric gets rank one, the second best metric gets rank two, and so on; in case of ties, average rank is assigned. The results of the Friedman Test are depicted in Table 3.
Table 3.
Results of Friedman Test.
The Friedman test revealed that there was no statistically significant difference in prediction errors reported by the six metrics (Chi-Square= 10.190, significance = 0.070). Hence, it can be said that all the six metrics perform equally well for fault prediction, that is, there is no difference between ECM and HCM metrics. However, from Table 2, it can be observed that ECM performed better for 4 out of 14 datasets, HCM performed better for 6 out of 14 datasets, while both ECM and HCM gave equal results for 4 out of 14 datasets. This makes it essential to analyze the characteristics of the datasets in order to determine which metrics should be used with which datasets. For this purpose, we analyzed the datasets/software subsystems on the following parameters:
- Distribution of number of faults per year
- No. of files in the subsystem
- Programming language
These three parameters of the datasets and performance of ECM and HCM with respect to these parameters are analyzed in the following subsections.
5.1. Distribution of Faults
In this subsection, the datasets were classified based on whether the distribution of number of faults per year in a software subsystem was normal or non-normal. A dataset is said to be normally distributed if the curve is symmetric around the mean, otherwise, it has non-normal distribution. We used the Shapiro–Wilk Test to determine whether the distribution was normal or non-normal [41]. Table 4 depicts the distribution of number of faults for the 14 datasets.
Table 4.
Distribution of faults per year.
It was observed that for normal distribution of number of faults per year, either of the two metrics may perform better. But when number of faults per year has a non-normal distribution, HCM always performs better than or equal to ECM. Hence, it can be concluded that HCM is better suited for subsystems having non-normal distribution of faults per year.
5.2. System Size
A software subsystem/system can be classified according to the number of files in the subsystem. A subsystem can be classified as small, medium, or large according to the criteria shown in Figure 9. A subsystem is considered small-sized if the number of files in the subsystem is less than 150. It is considered to be medium-sized if the number of files in the subsystem is between 150 and 1000. A subsystem is considered large if it contains more than 1000 files.
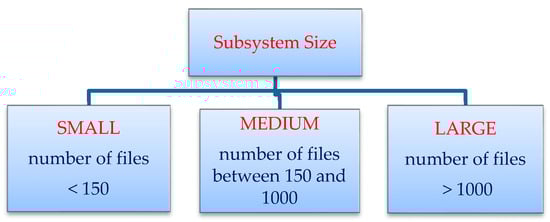
Figure 9.
Classification of subsystems according to number of files.
Table 5 specifies the classification of the 14 datasets based on size. It can be observed that for small-sized subsystems, HCM gave better or comparable results to ECM. But for medium-sized and large-sized subsystems, ECM provided better results. Hence, it can be inferred that for medium-sized and large-sized subsystems, it is better to use ECM, and for small-sized subsystems, it is better to use HCM. In other words, ECM is a better predictor when dealing with systems having large coupling between files.
Table 5.
Classification of subsystems based on size.
5.3. Language
Programming language of the 14 datasets were analyzed in order to determine which metric (i.e., ECM or HCM) is better suited for software systems programmed using which language. The 14 datasets were programmed using C, C++, or Java, as shown in Table 6.
Table 6.
Programming language of the software subsystems.
It can be observed that for subsystems programmed using C and C++, HCM performed better or comparable to ECM, whereas for software subsystems programmed using Java, either of ECM and HCM may give better results. Hence, it can be suggested that HCM should be preferred for software subsystems/systems programmed using C and C++.
6. Discussion
Comparison of ECM and HCM revealed that there is no statistically significant difference between the prediction errors obtained using both the metrics. This implies that both ECM and HCM have comparable performance and both of these metrics can be used for predicting faults in software systems.
In order to analyze which metric should be preferred for a particular software system, the results were analyzed based on three characteristics (distribution of faults, system size, and programming language) of the software system. The analysis of results leads to the following observations:
- It was observed that for normal distribution of faults, sometimes ECM performed better and sometimes HCM gave better results. But for non-normal distribution of faults, HCM always gave better or comparable results to ECM. Thus, while any of ECM and HCM may be used for prediction when using the distribution of faults, HCM should be the preferred metric when the distribution is non-normal.
- When the performance of HCM and ECM was analyzed with respect to the size of the system, it was observed that for small-sized systems, HCM gave better or comparable results to ECM, but for medium- and large-sized systems, ECM outperformed HCM. Thus it can be recommended to use ECM for medium- and large-sized systems and HCM for small-sized systems.
- Lastly, on analyzing the performance of ECM and HCM with regard to the programming language of the system, it was observed that when the programming language of the subsystem was C/C++, the results obtained using HCM were always better or comparable to those obtained using ECM. It was also observed that when the programming language of the system was Java, either of ECM and HCM gave better results. Hence, it can be suggested that for systems programmed in C/C++, the preferred metric should be HCM, while for systems programmed in Java, either of ECM and HCM may be preferred.
7. Threats to Validity
Fault prediction studies are predisposed to factors that influence the accuracy and reliability of the results. These are called threats to validity of a study. Comprehensively, there are two types of threats to validity: internal and external threats.
7.1. Threats to Internal Validity
Threats to internal validity happen if there is error in representation of causes that influence the outcomes of the study. One such validity threat is that this study uses FRCs for validating the study. The study does not contemplate the faults that are reported but not removed while counting the year-wise number of faults. Since there are scarcely any faults that are not removed, the results of this study are justified.
Another concern is regarding accuracy of classification of changes. The tool used for this purpose is not artificially intelligent, that is, it does not exhibit human-like intelligence and relies on simple rules to determine the reason of change for the commits extracted from the software repository. However, the tool utilizes a basic yet powerful keyword-matching algorithm to classify the commits with minimum odds of misclassification.
7.2. Threats to External Validity
Threats to external validity refer to concerns associated with generalization of the findings of the study. For this reason, even though the study was conducted on 14 software subsystems from five different software projects, the study should be replicated for other software systems also.
Another threat to validity is that although the study was conducted on 14 subsystems of different size, of different programming language, and having different distribution of faults, they are from open source software projects only, and these subsystems cannot be considered as representations of subsystems of industrial software projects. Further studies should be carried out to check the applicability of ECM for industrial software projects also.
8. Conclusion
The paper proposed a new metric for fault prediction based on churn of entropy (i.e., ECM). ECM was compared with HCM for 14 software subsystems. The subsystems were selected from popular software projects: Android, Eclipse, Apache Http Server, Eclipse C/C++ Development Tooling (CDT), and Mozilla Firefox. The results revealed that there was no statistically significant difference between the performance of HCM and ECM. Thus both the metrics can be used for fault prediction in software systems by analyzing its change history.
While ECM gave better results for 4 out of 14 datasets, HCM gave better results for 6 out of 14 datasets, and both ECM and HCM gave equal results for 4 out of 14 datasets. The study further analyzed the characteristics of the software subsystems in order to determine which metrics were better suited for what type of software systems. The subsystems were analyzed based on three parameters, namely, (a) distribution of number of faults per year, (b) number of files, and (c) programming language. It was inferred from the analysis that, (a) HCM metric are more appropriate for software systems/subsystems having a non-normal distribution of faults per year, (b) ECM metrics are better suited for medium-sized and large-sized software systems/subsystems, and (c) HCM metrics are a better choice for software subsystems/systems programmed using C and C++.
A major conclusion that can be drawn from the study is that entropy metrics are dependent on subsystem size. Simple entropy metrics (i.e., HCM) are better predictors of faults than ECM when the system size is small. As the system sizes increases, the coupling between files becomes large and it becomes difficult for programmers to efficiently organize the files. It was observed that under such circumstances (i.e., large-sized systems with large coupling), ECM or churn of entropy is a better predictor of faults. However, further studies specially using proprietary software projects and a comparison with popular fault prediction metrics other than HCM should be done to explore the applicability of ECM.
Author Contributions
Conceptualization—D.C.; Data curation—D.C.; Methodology—A.K. and D.C.; Supervision—A.K.; Validation—A.K. and D.C.; Writing—original draft—D.C.; Writing—review & editing—A.K. and D.C.
Funding
This research received no external funding.
Acknowledgments
The authors would like to thank the Visvesaraviya PhD scheme of Ministry of IT and Electronics, Government of India for providing scholarship for facilitating the research work of the candidates.
Conflicts of Interest
The authors declare no conflict of interest.
References
- Fenton, N.; Bieman, J. Software Metrics: ARigorous and Practical Approach, 3rd ed.; CRC Press: Boca Raton, FL, USA, 2014; ISBN 9781439838235. [Google Scholar]
- Chidamber, S.R.; Kemerer, C.F. A metrics suite for object oriented design. IEEE Transa.Softw.Eng. 1994, 20, 476–493. [Google Scholar] [CrossRef]
- Khoshgoftaar, T.M.; Allen, E.B.; Goel, N.; Nandi, A.; McMullan, J. Detection of software modules with high debug code churn in a very large legacy system. In Proceedings of the Seventh International Symposium on Software Reliability Engineering, White Plains, NY, USA, 30 October–2 November 1996; pp. 364–371. [Google Scholar]
- Bernstein, A.; Ekanayake, J.; Pinzger, M. Improving defect prediction using temporal features and nonlinear models. In Proceedings of the Ninth International Workshop on Principles of Software Evolution (IWPSE 2007) in Conjunction with the 6th ESEC/FSE Joint Meeting, Dubrovnik, Croatia, 3–4 September 2007; ACM: New York, NY, USA, 2007; pp. 11–18. [Google Scholar]
- D’Ambros, M.; Lanza, M.; Robbes, R. An extensive comparison of bug prediction approaches. In Proceedings of the 7th IEEE Working Conference on Mining Software Repositories (MSR), Cape Town, South Africa, 2–3 May 2010; pp. 31–41. [Google Scholar]
- D’Ambros, M.; Lanza, M.; Robbes, R. Evaluating defect prediction approaches: A benchmark and an extensive comparison. Empir. Softw. Eng. 2012, 17, 531–577. [Google Scholar] [CrossRef]
- Hassan, A.E. Predicting faults using the complexity of code changes. In Proceedings of the 31st International Conference on Software Engineering, Vancouver, BC, Canada, 16–24 May 2009; IEEE Computer Society: Washington, DC, USA, 2009; pp. 78–88. [Google Scholar]
- Gou, X.; Xu, Z.; Liao, H. Hesitant fuzzy linguistic entropy and cross-entropy measures and alternative queuing method for multiple criteria decision making. Inf. Sci. 2017, 388, 225–246. [Google Scholar] [CrossRef]
- Pramanik, S.; Dey, P.P.; Smarandache, F.; Ye, J. Cross Entropy Measures of Bipolar and Interval Bipolar Neutrosophic Sets and Their Application for Multi-Attribute Decision-Making. Axioms 2018, 7, 21. [Google Scholar] [CrossRef]
- Keum, J.; Kornelsen, K.; Leach, J.; Coulibaly, P. Entropy applications to water monitoring network design: A review. Entropy 2017, 19, 613. [Google Scholar] [CrossRef]
- Sahoo, M.M.; Patra, K.C.; Swain, J.B.; Khatua, K.K. Evaluation of water quality with application of Bayes’ rule and entropy weight method. Eur. J. Environ. Civil Eng. 2017, 21, 730–752. [Google Scholar] [CrossRef]
- Wu, H.; Li, Y.; Bi, X.; Zhang, L.; Bie, R.; Wang, Y. Joint entropy based learning model for image retrieval. J. Vis. Commun. Image Represent. 2018, 55, 415–423. [Google Scholar] [CrossRef]
- Gu, R. Multiscale Shannon entropy and its application in the stock market. Phys. A Stat. Mech. Appl. 2017, 484, 215–224. [Google Scholar] [CrossRef]
- Baldwin, R. Use of maximum entropy modeling in wildlife research. Entropy 2009, 11, 854–866. [Google Scholar] [CrossRef]
- Moser, R.; Pedrycz, W.; Succi, G. A comparative analysis of the efficiency of change metrics and static code attributes for defect prediction. In Proceedings of the 30th International Conference on Software Engineering, Leipzig, Germany, 10–18 May 2008; ACM: New York, NY, USA, 2008; pp. 181–190. [Google Scholar]
- Kim, S.; Zimmermann, T.; Whitehead, E.J.; Zeller, A. Predicting faults from cached history. In Proceedings of the 29th International Conference on Software Engineering, Minneapolis, MN, USA, 20–26 May 2007; IEEE Computer Society: Washington, DC, USA, 2007; pp. 489–498. [Google Scholar]
- Basili, V.R.; Briand, L.C.; Melo, W.L. A validation of object-oriented design metrics as quality indicators. IEEE Trans. Softw. Eng. 1996, 22, 751–761. [Google Scholar] [CrossRef]
- Nikora, A.P.; Munson, J.C. Developing fault predictors for evolving software systems. In Proceedings of the 5th International Workshop on Enterprise Networking and Computing in Healthcare Industry, Sydney, NSW, Australia, 5 September 2004; pp. 338–350. [Google Scholar]
- Nagappan, N.; Ball, T. Use of relative code churn measures to predict system defect density. In Proceedings of the 27th International Conference on Software Engineering, St. Louis, MO, USA, 15–21 May 2005; ACM: New York, NY, USA, 2005; pp. 284–292. [Google Scholar]
- Raja, U.; Hale, D.P.; Hale, J.E. Modeling software evolution defects: a time series approach. J. Softw. Maint. Evol. Res. Pract. 2009, 21, 49–71. [Google Scholar] [CrossRef]
- Wu, W.; Zhang, W.; Yang, Y.; Wang, Q. Time series analysis for bug number prediction. In Proceedings of the 2nd International Conference on Software Engineering and Data Mining (SEDM), Chengdu, China, 23–25 June 2010; pp. 589–596. [Google Scholar]
- Yazdi, H.S.; Pietsch, P.; Kehrer, T.; Kelter, U. Statistical Analysis of Changes for Synthesizing Realistic Test Models. Softw. Eng. Conf. 2013, 225–238. [Google Scholar]
- Yazdi, H.S.; Angelis, L.; Kehrer, T.; Kelter, U. A framework for capturing, statistically modeling and analyzing the evolution of software models. J. Syst. Softw. 2016, 118, 176–207. [Google Scholar] [CrossRef]
- Trienekens, J.J.; Kusters, R.; Kriek, D.; Siemons, P. Entropy based software processes improvement. Softw. Qual. J. 2009, 17, 231–243. [Google Scholar] [CrossRef]
- Allen, E.B.; Gottipati, S.; Govindarajan, R. Measuring size, complexity, and coupling of hypergraph abstractions of software: An information-theory approach. Softw. Qual. J. 2007, 15, 179–212. [Google Scholar] [CrossRef]
- Ma, Z. Analyzing Large-Scale OO Software by Joining Fractal and Entropy Measures. In Proceedings of the 2016 International Conference on Computational Science and Computational Intelligence (CSCI), Las Vegas, NV, USA, 15–17 December 2016; pp. 1310–1314. [Google Scholar]
- Kaur, A.; Kaur, K.; Chopra, D. Entropy based bug prediction using neural network based regression. In Proceedings of the 2015 International Conference on Computing, Communication & Automation (ICCCA), Noida, India, 15–16 May 2015; pp. 168–174. [Google Scholar]
- Kaur, A.; Kaur, K.; Chopra, D. Application of Locally Weighted Regression for Predicting Faults Using Software Entropy Metrics. In Proceedings of the Second International Conference on Computer and Communication Technologies, Hyderabad, India, 24–26 July 2015; Springer: New Delhi, India, 2015; pp. 257–266. [Google Scholar]
- Kaur, A.; Kaur, K.; Chopra, D. An empirical study of software entropy based bug prediction using machine learning. Int. J. Syst. Assur. Eng. Manag. 2017, 8, 599–616. [Google Scholar] [CrossRef]
- Radjenović, D.; Heričko, M.; Torkar, R.; Živkovič, A. Software fault prediction metrics: A systematic literature review. Inf. Softw. Technol. 2013, 55, 1397–1418. [Google Scholar] [CrossRef]
- Canfora, G.; Cerulo, L.; Cimitile, M.; Di Penta, M. How changes affect software entropy: an empirical study. Empir. Softw. Eng. 2014, 19, 1–38. [Google Scholar] [CrossRef]
- Shannon, C.E. A mathematical theory of communication. Bell Syst. Tech. J. 1948, 27, 379–423. [Google Scholar] [CrossRef]
- Mozilla Mercurial Repository. Available online: https://hg.mozilla.org/mozilla-central/ (accessed on 27 July 2018).
- GitHub Repository. Available online: https://github.com/ (accessed on 27 July 2018).
- Kaur, A.; Chopra, D. GCC-Git Change Classifier for Extraction and Classification of Changes in Software Systems. In Proceedings of the Internet of Things for Technical Development (IoT4D 2017) Lecture Notes in Networks and Systems Intelligent Communication and Computational Technologies, Gujarat, India, 1–2 April 2017; Springer: Singapore, 2017; Volume 19, pp. 259–267. [Google Scholar]
- Hyman, M.; Vaddadi, P. Mike and Phani’s Essential C++ Techniques; Apress: Berkeley, CA, USA, 1999; Regular Expression Matching; pp. 213–224. ISBN 978-1-893115-04-0. [Google Scholar]
- Seber, G.A.; Lee, A.J. Linear Regression Analysis, 2nd ed.; John Wiley & Sons: Hoboken, NJ, USA, 2012; ISBN 978-1-118-27442-2. [Google Scholar]
- RapidMiner Studio. Available online: https://rapidminer.com/products/studio/ (accessed on 2 August 2018).
- Hyndman, R.J.; Koehler, A.B. Another look at measures of forecast accuracy. Int. J. Forecast. 2006, 22, 679–688. [Google Scholar] [CrossRef]
- Demšar, J. Statistical comparisons of classifiers over multiple data sets. J. Mach. Learn. Res. 2006, 7, 1–30. [Google Scholar]
- Shapiro, S.S.; Wilk, M.B. An analysis of variance test for normality (complete samples). Biometrika 1965, 52, 591–611. [Google Scholar] [CrossRef]


© 2018 by the authors. Licensee MDPI, Basel, Switzerland. This article is an open access article distributed under the terms and conditions of the Creative Commons Attribution (CC BY) license (http://creativecommons.org/licenses/by/4.0/).