Influence of Failure Probability Due to Parameter and Anchor Variance of a Freeway Dip Slope Slide—A Case Study in Taiwan † †


Abstract
:1. Introduction
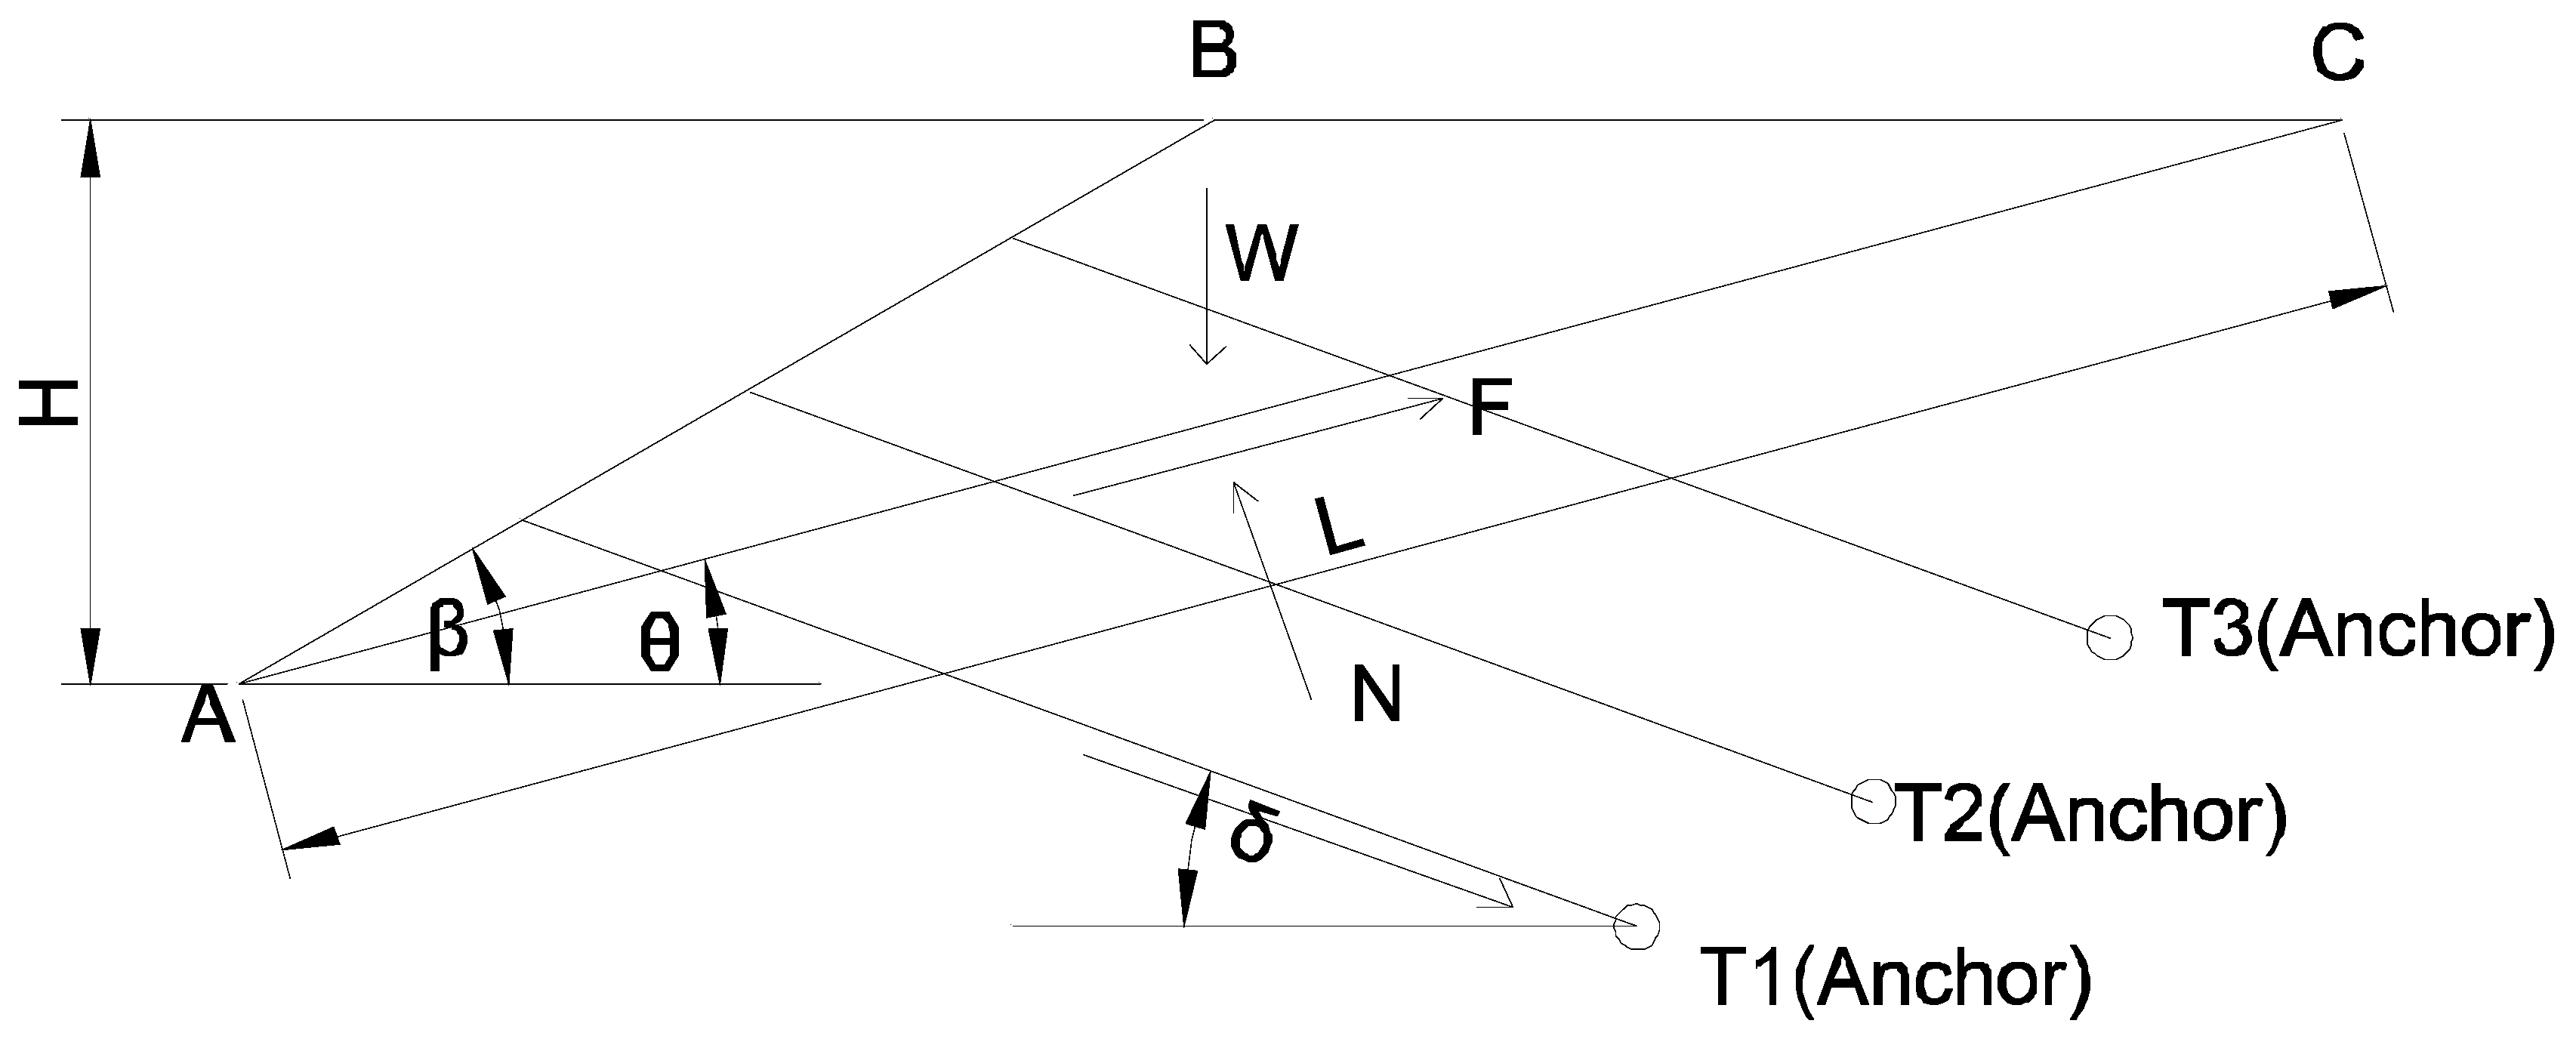
2. Case Description and Performance Function
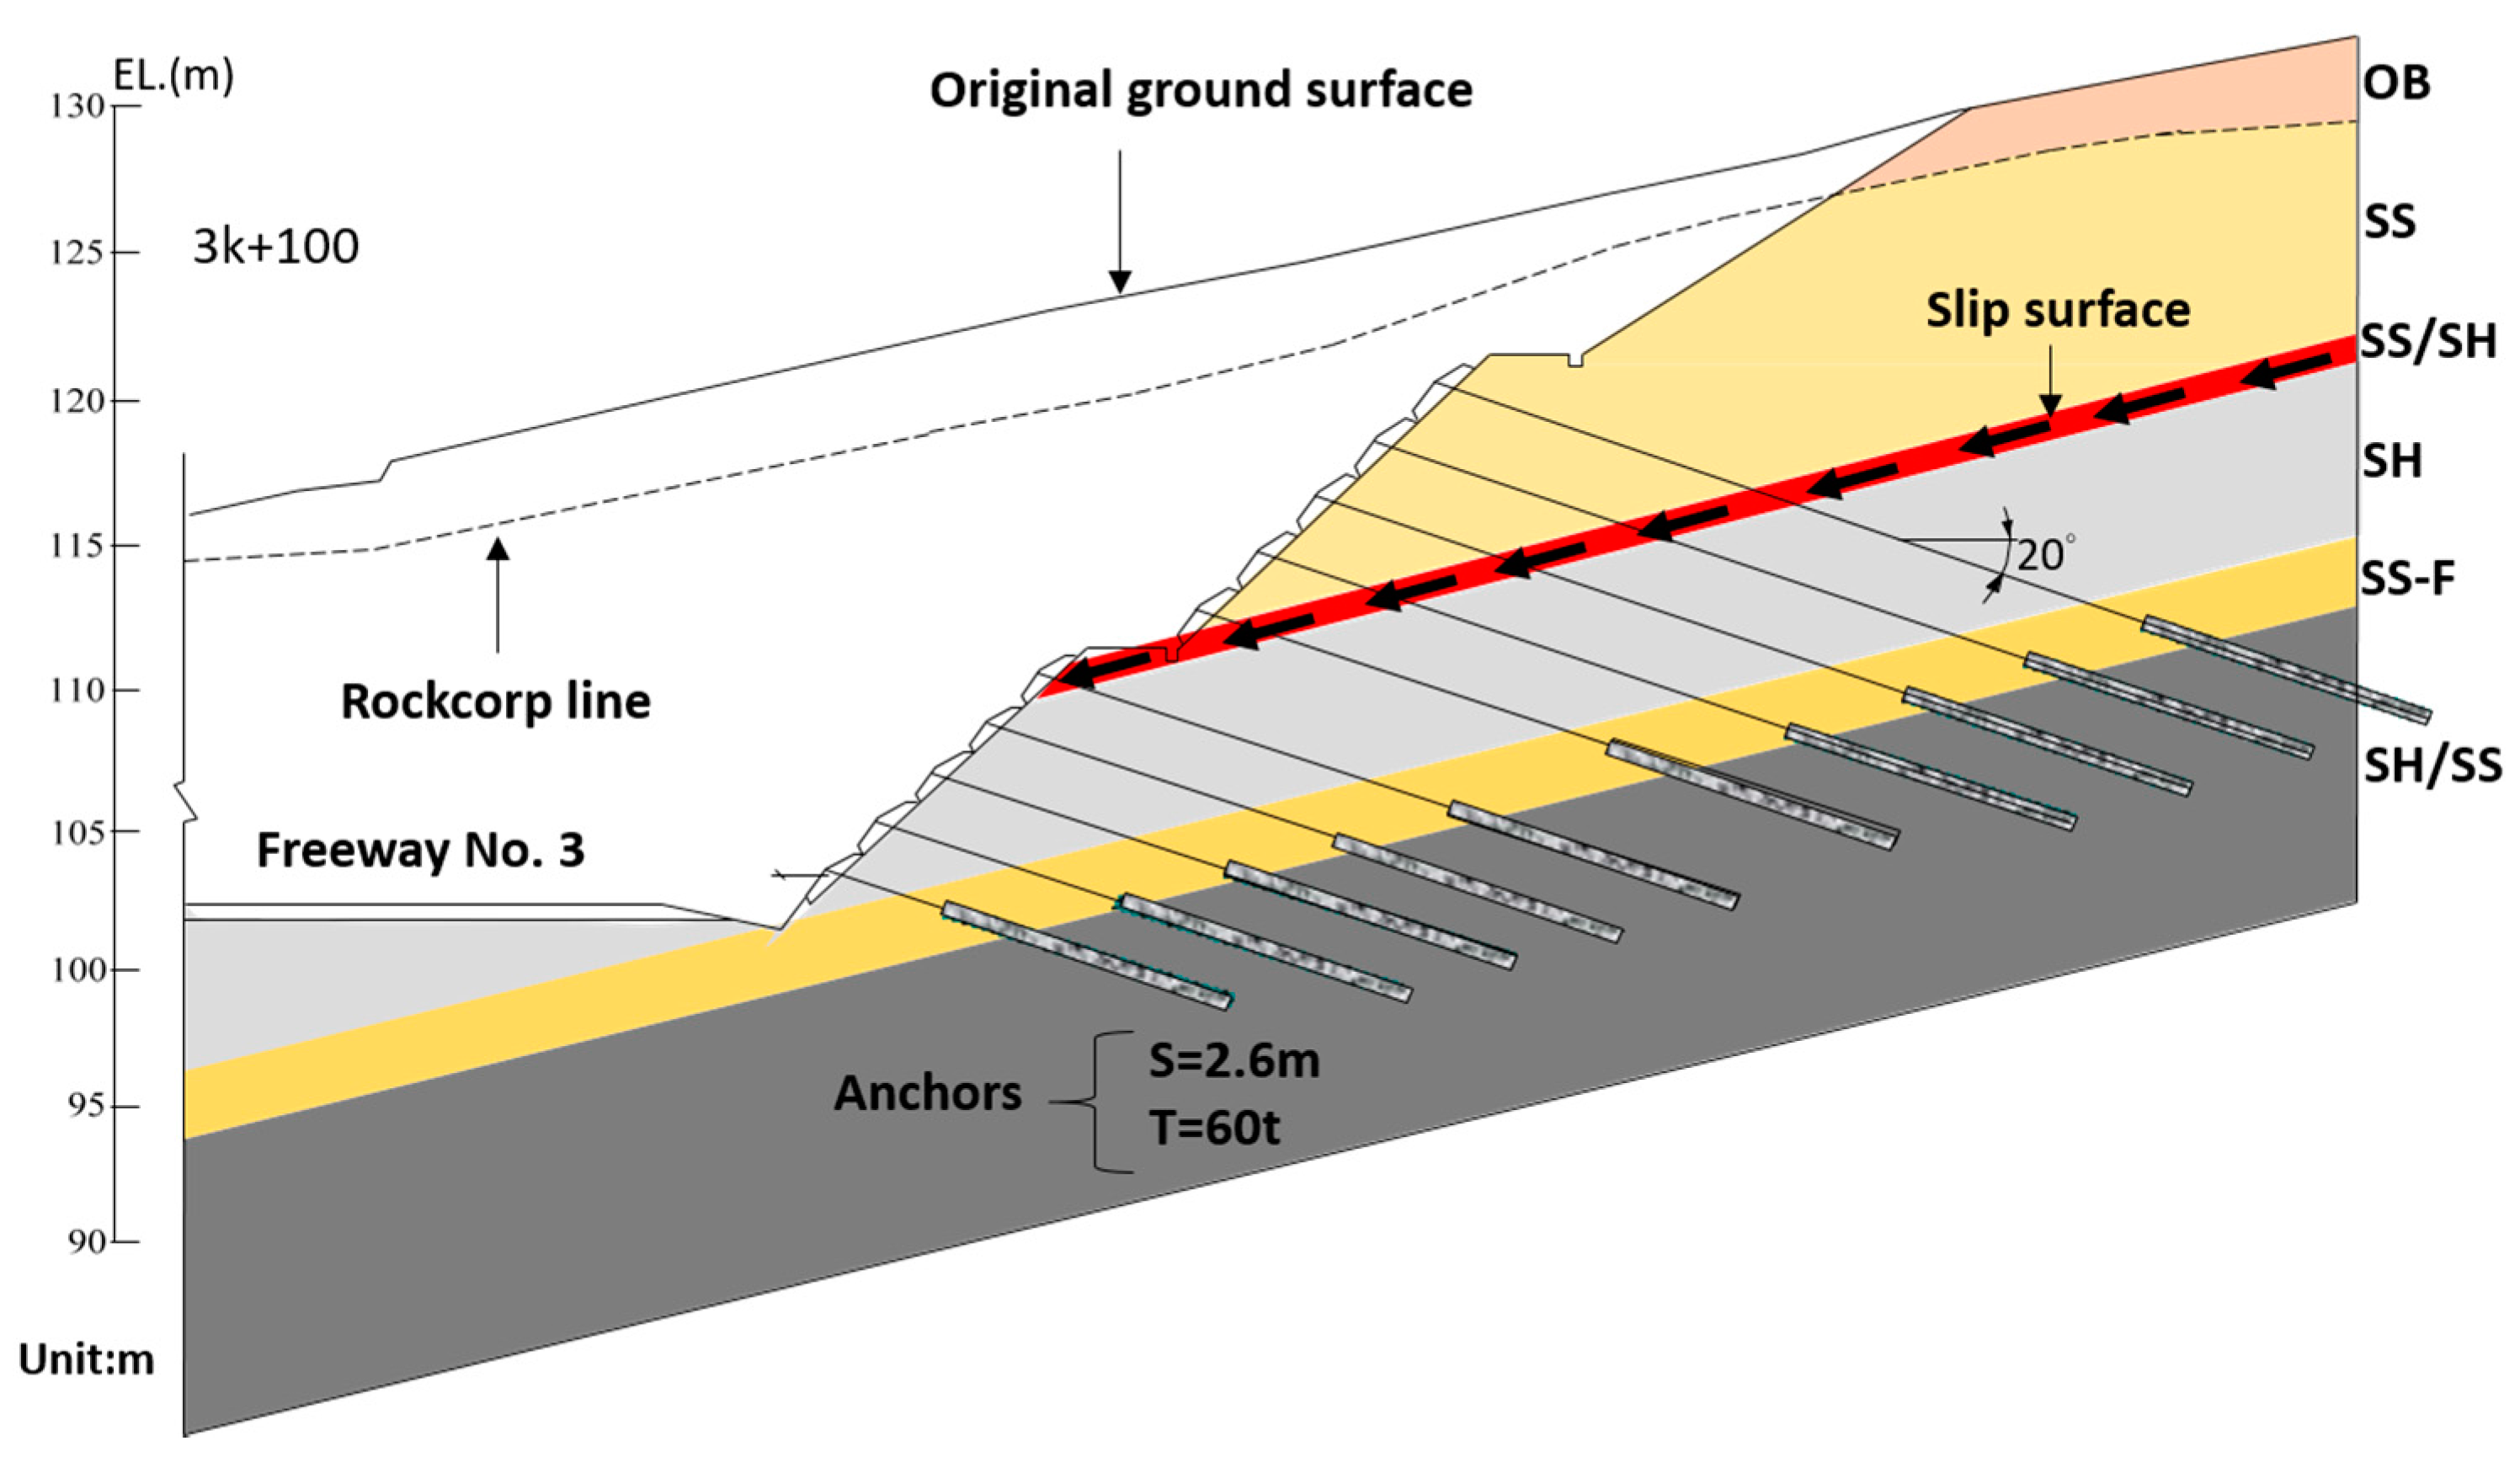
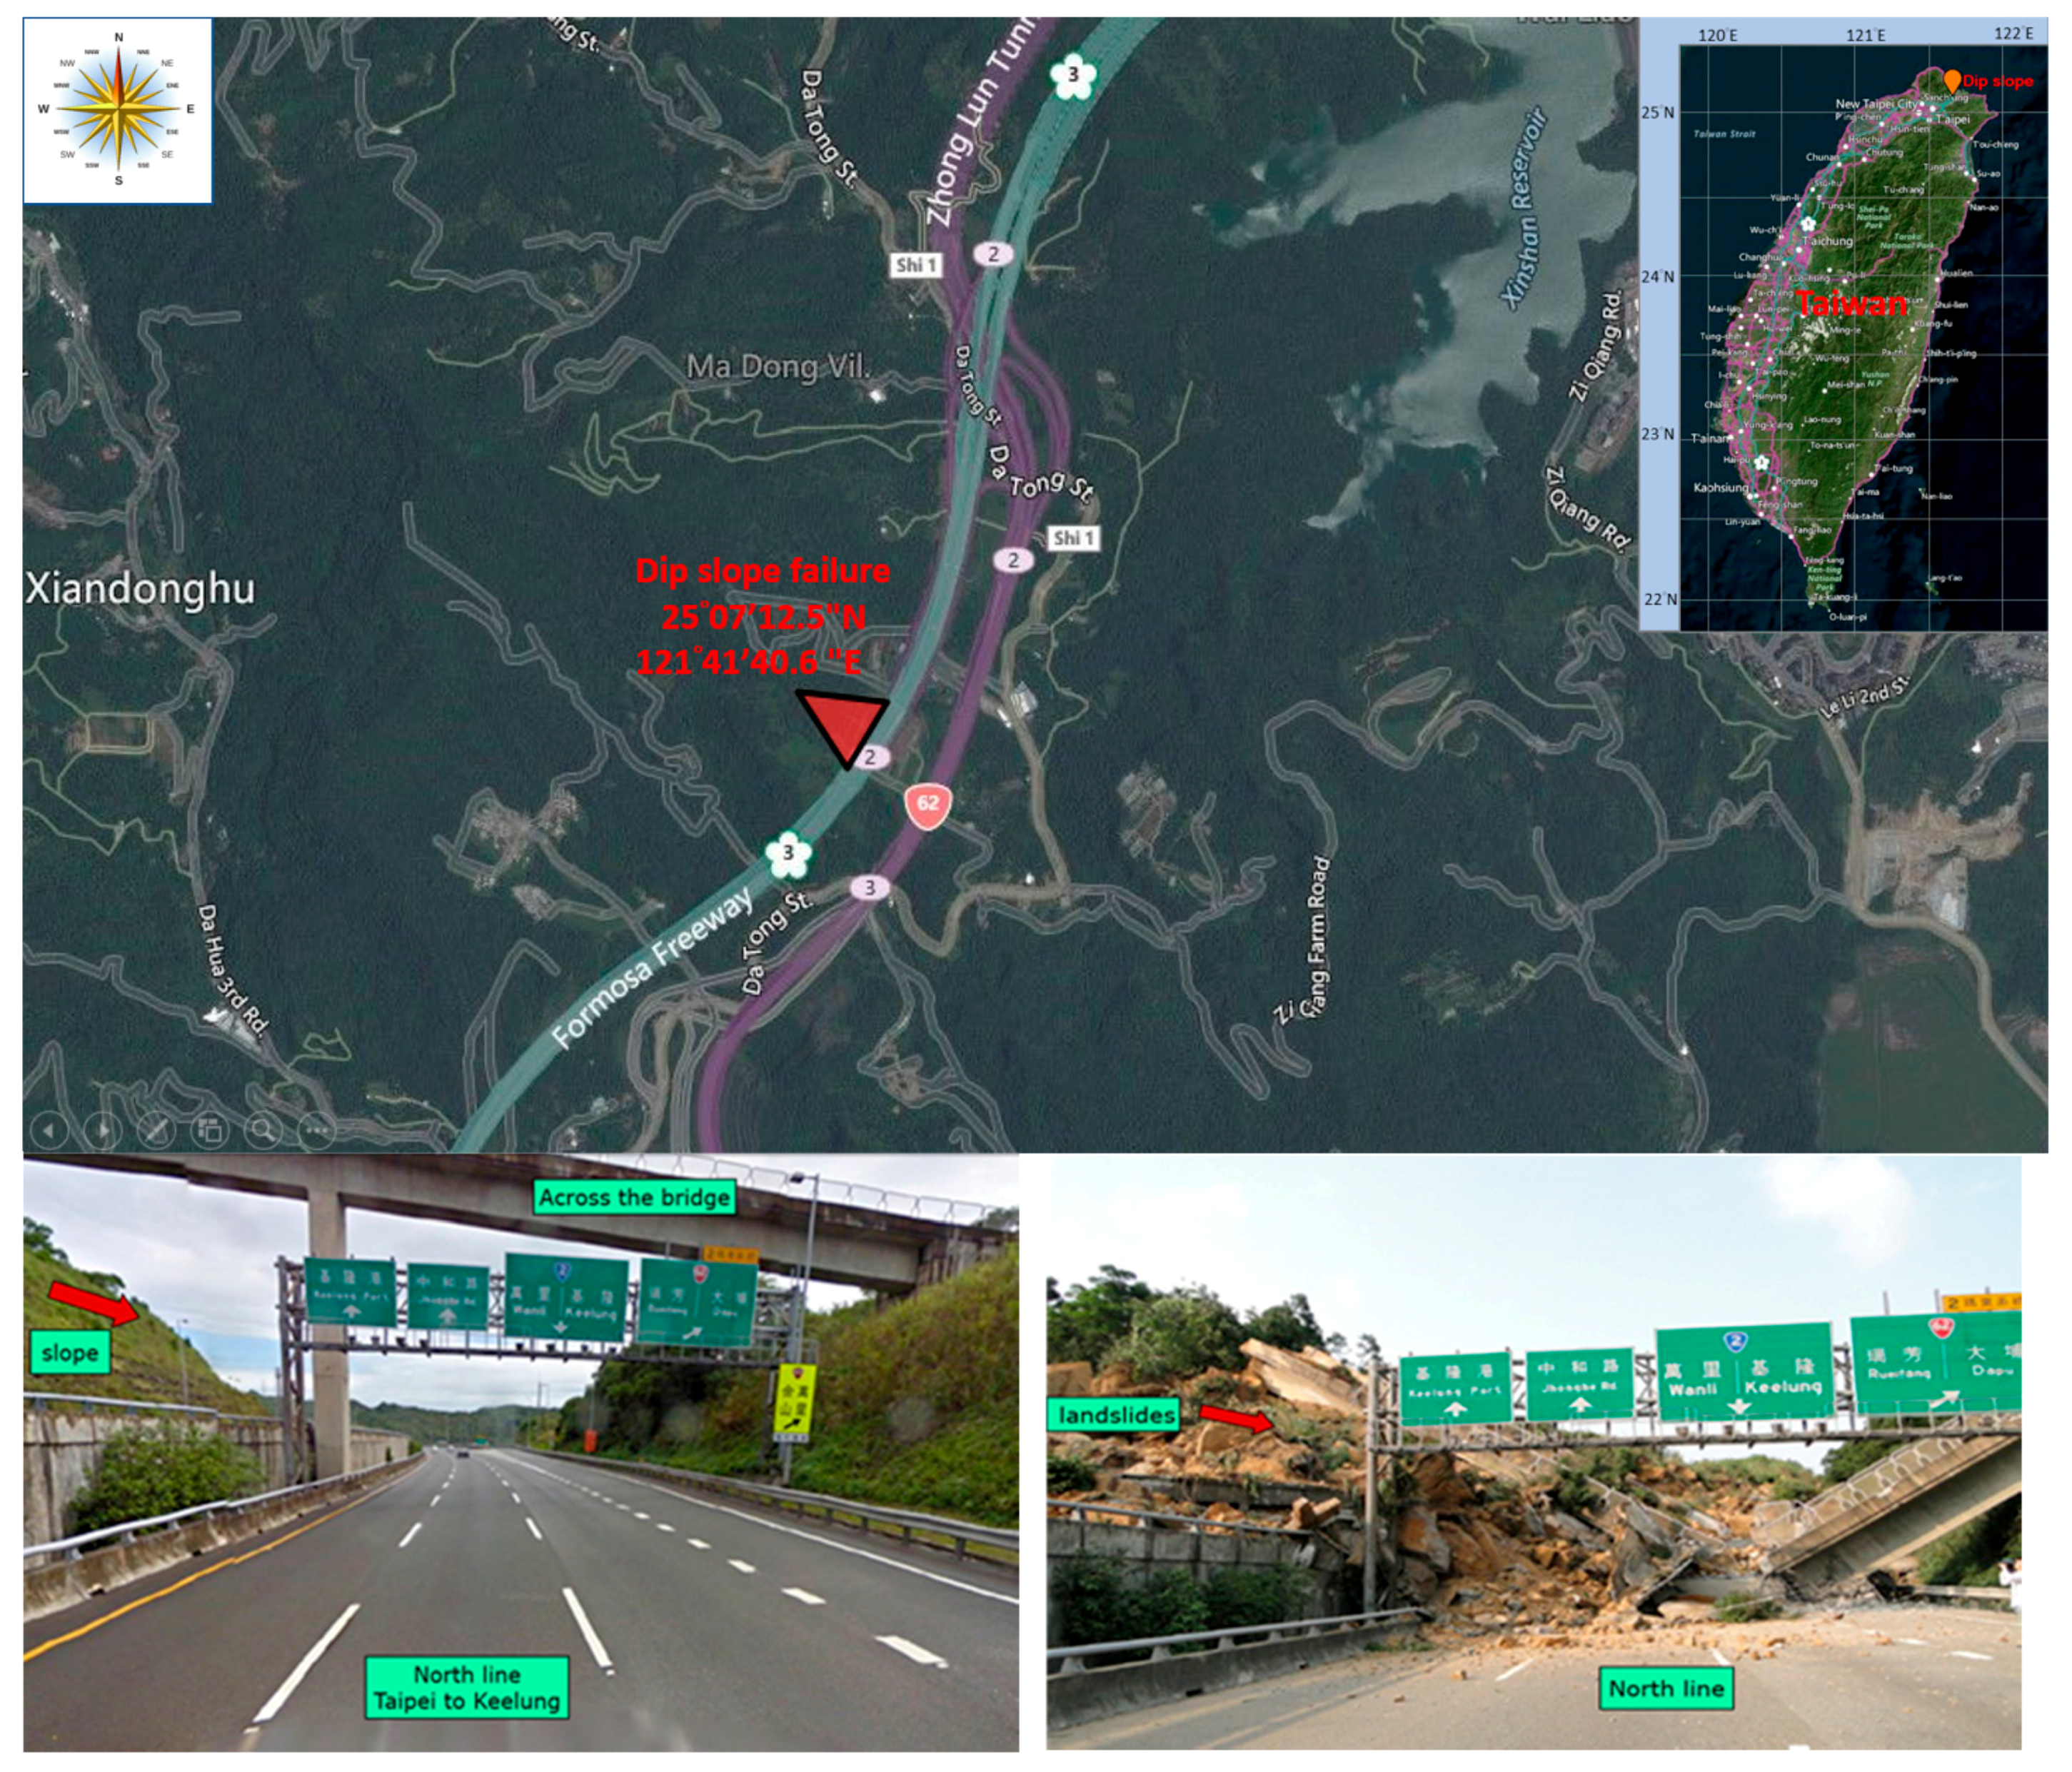
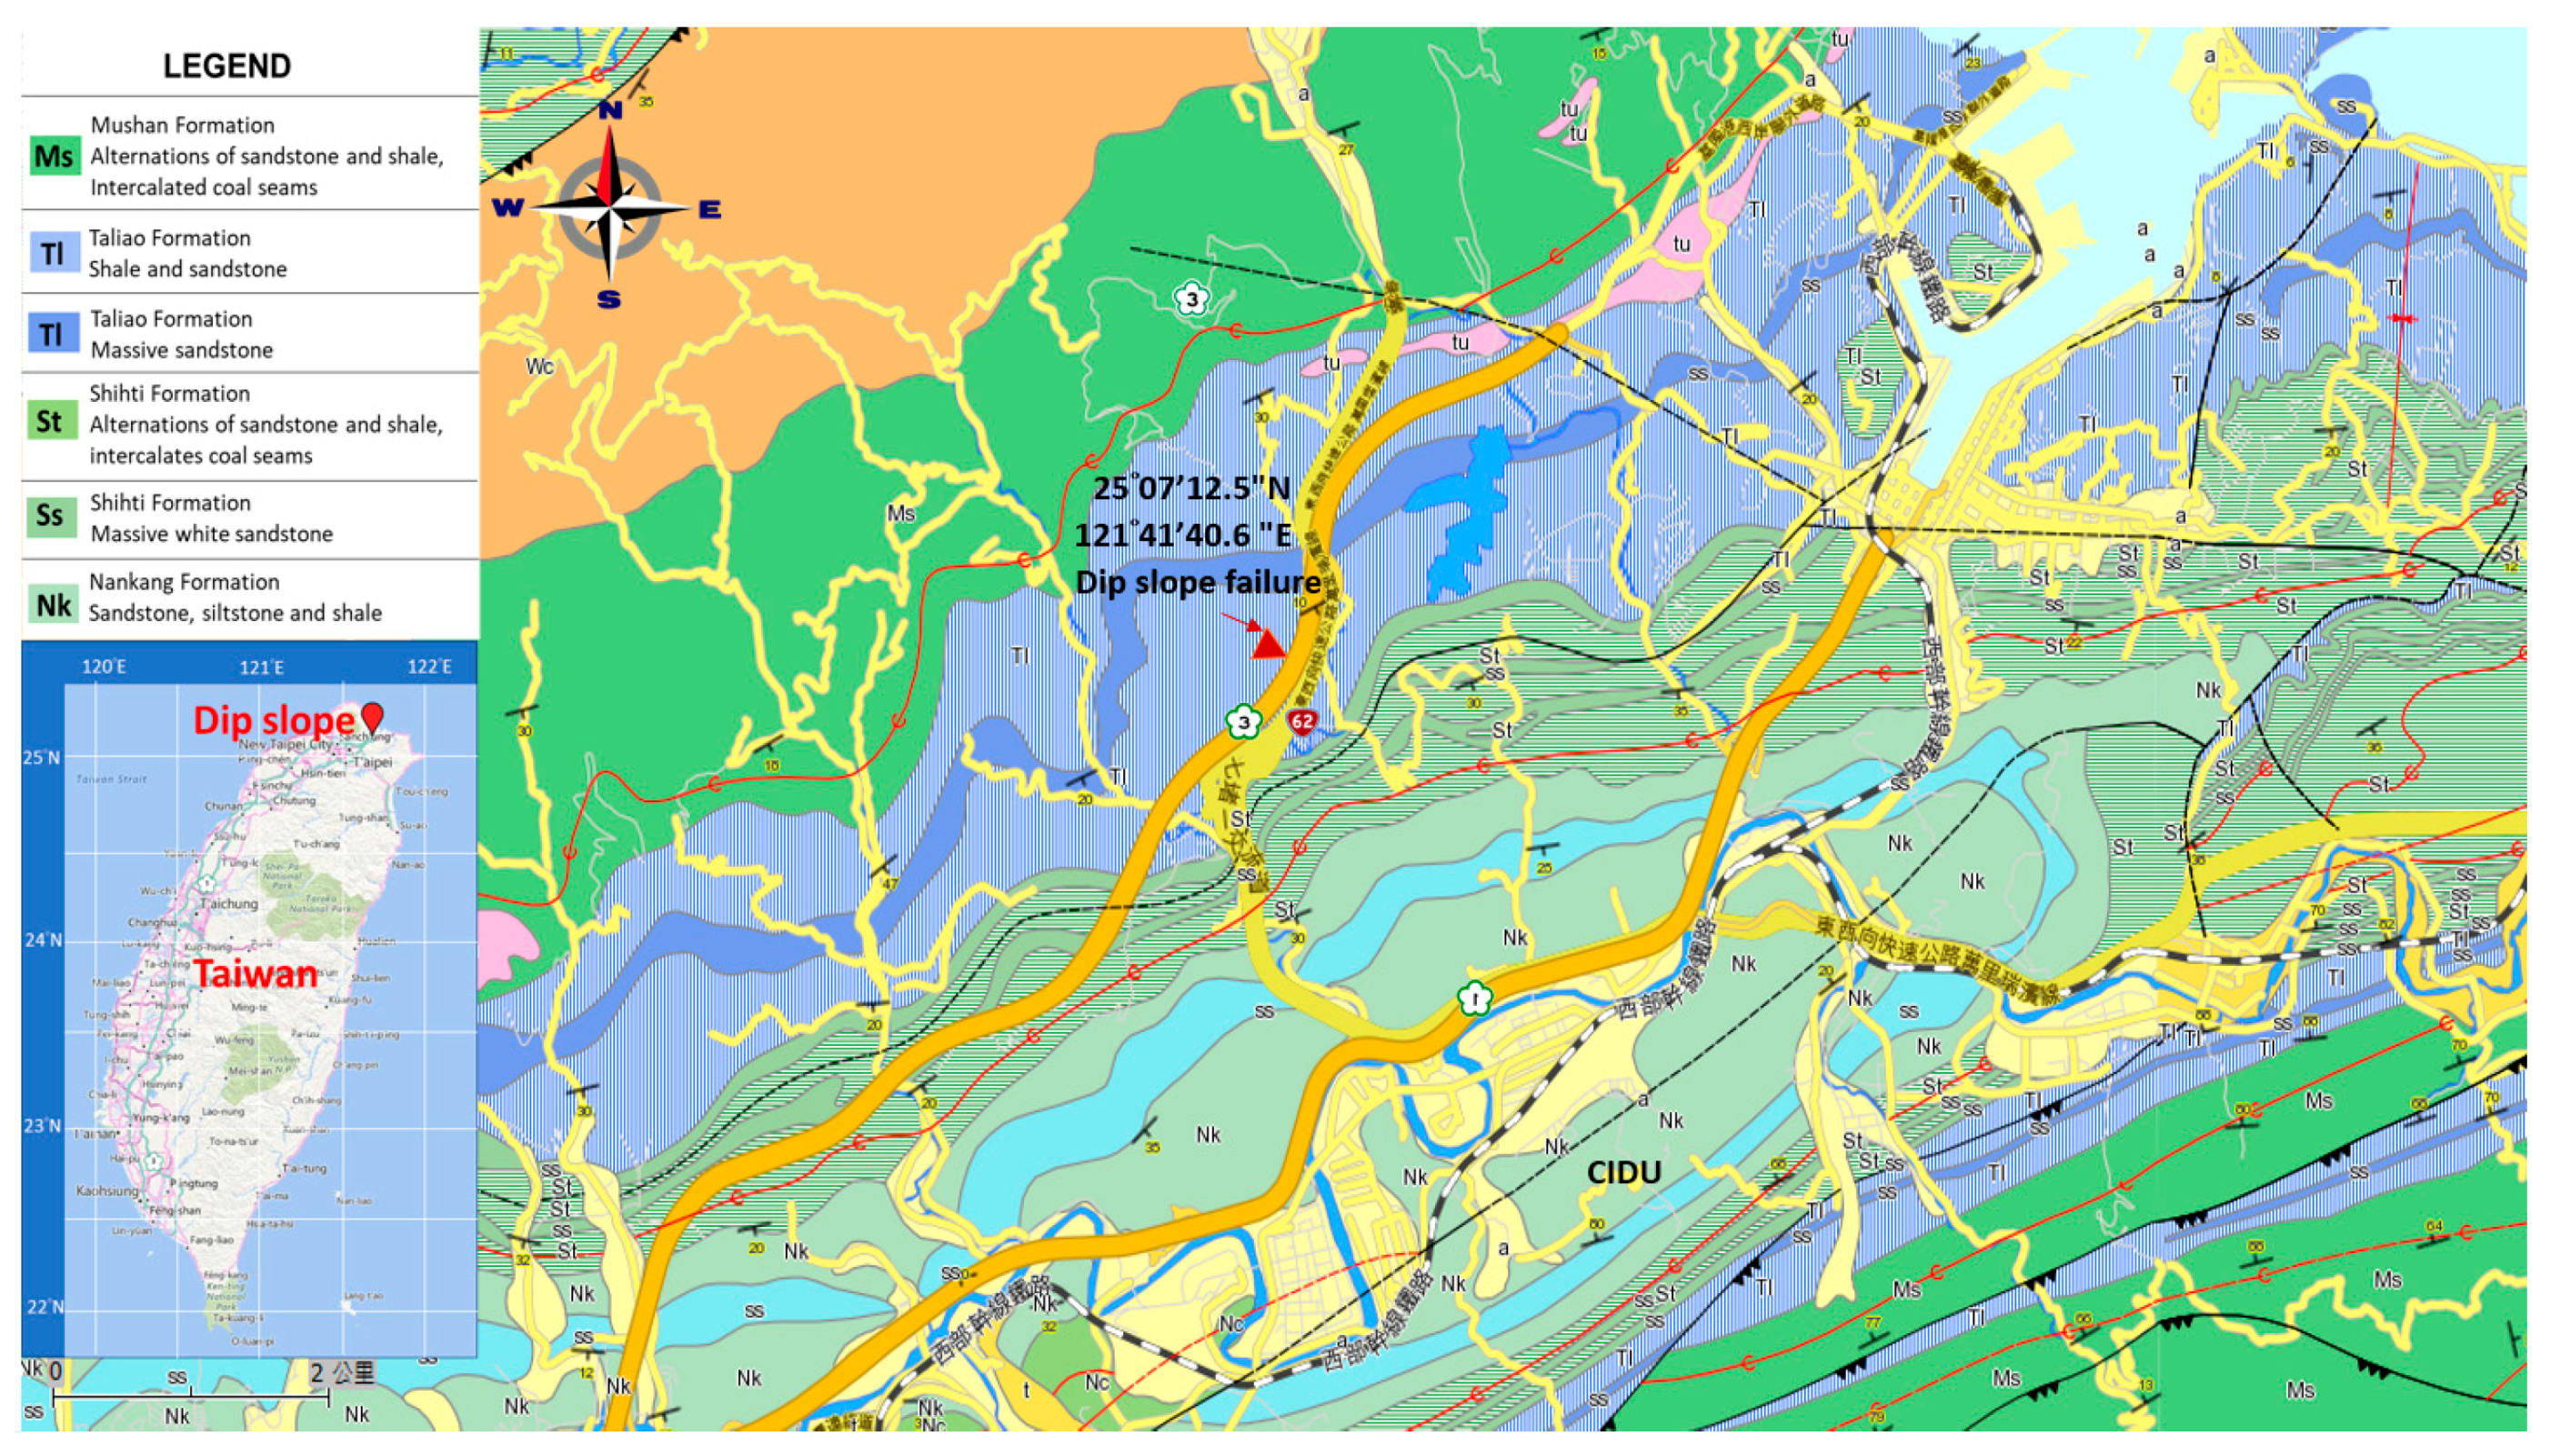
2.1. Overview of the Dip Slope Slides on National Freeway No. 3 in Taiwan
2.2. Performance Function
3. Probabilistic Slope Stability Analysis
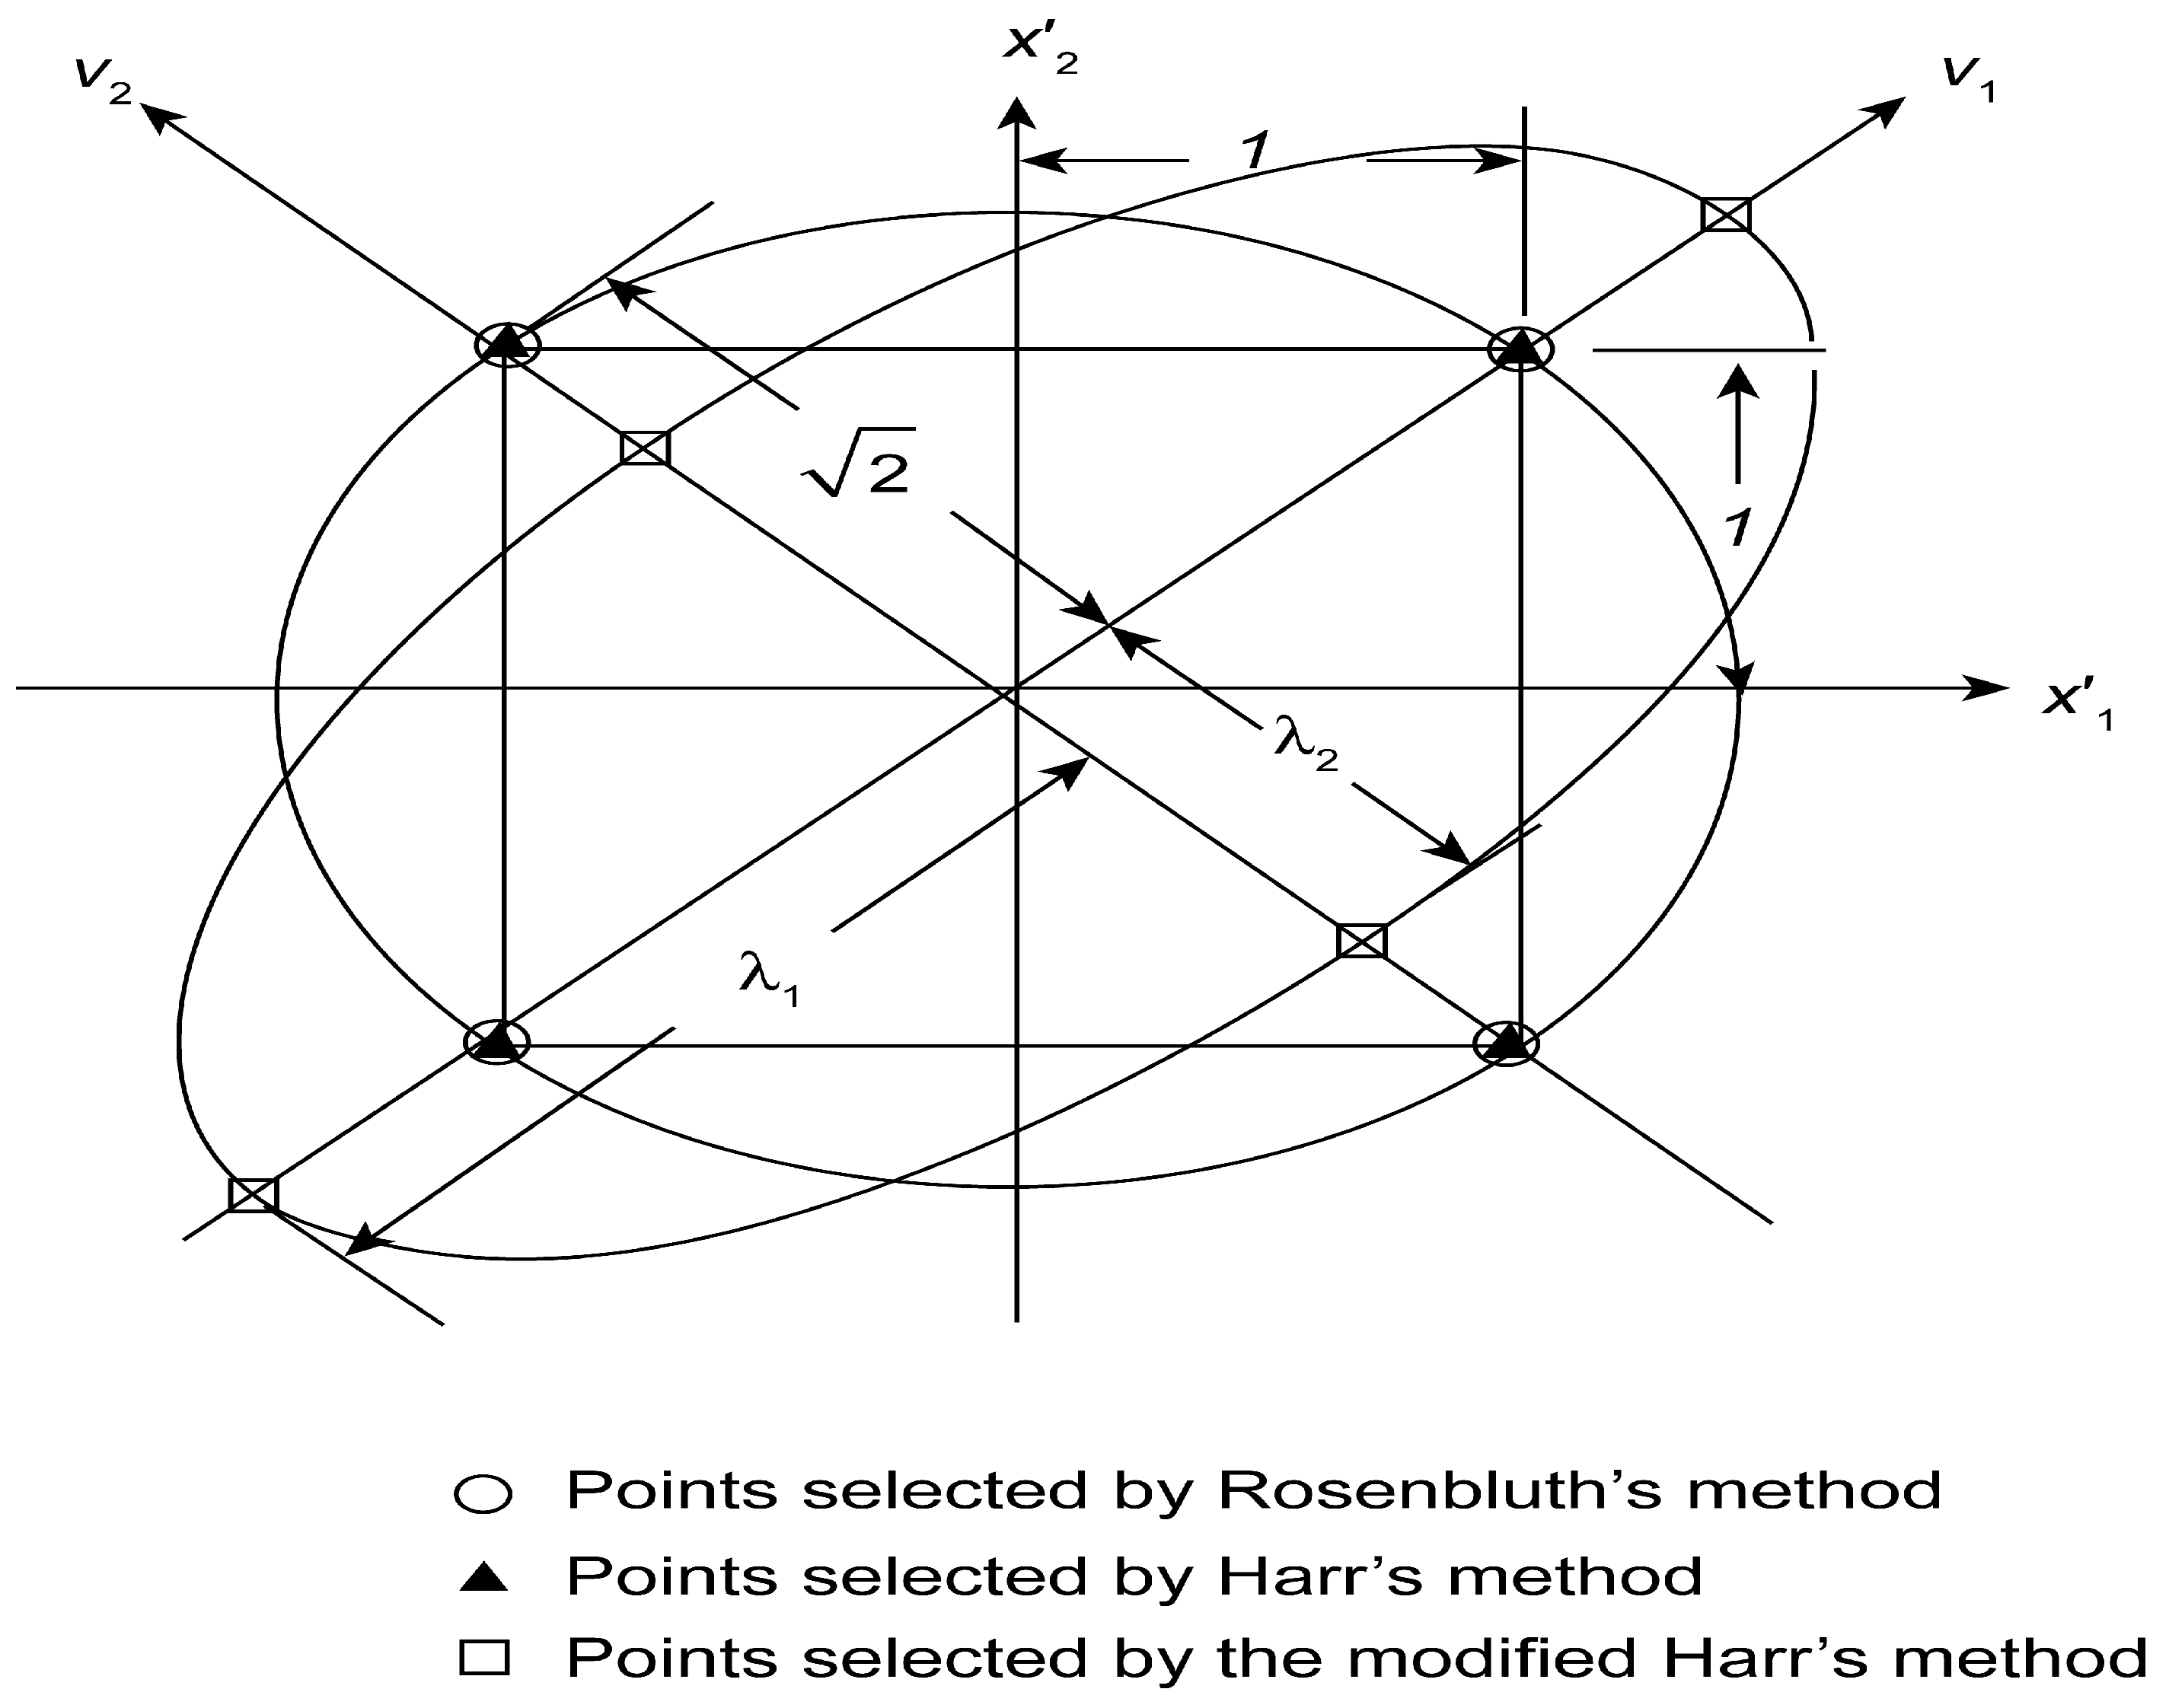
3.1. Point Estimate Method (PEM)
3.1.1. Rosenblueth Point Estimate Method (RPEM)
3.1.2. Harr Point Estimate Method (HPEM)
3.1.3. Modified Harr Point Estimate Method (MPEM)
3.2. Monte Carlo Simulation (MCS)
3.3. Cross Correlation among Parameters
3.4. Probability Density Function (PDF)
4. Results
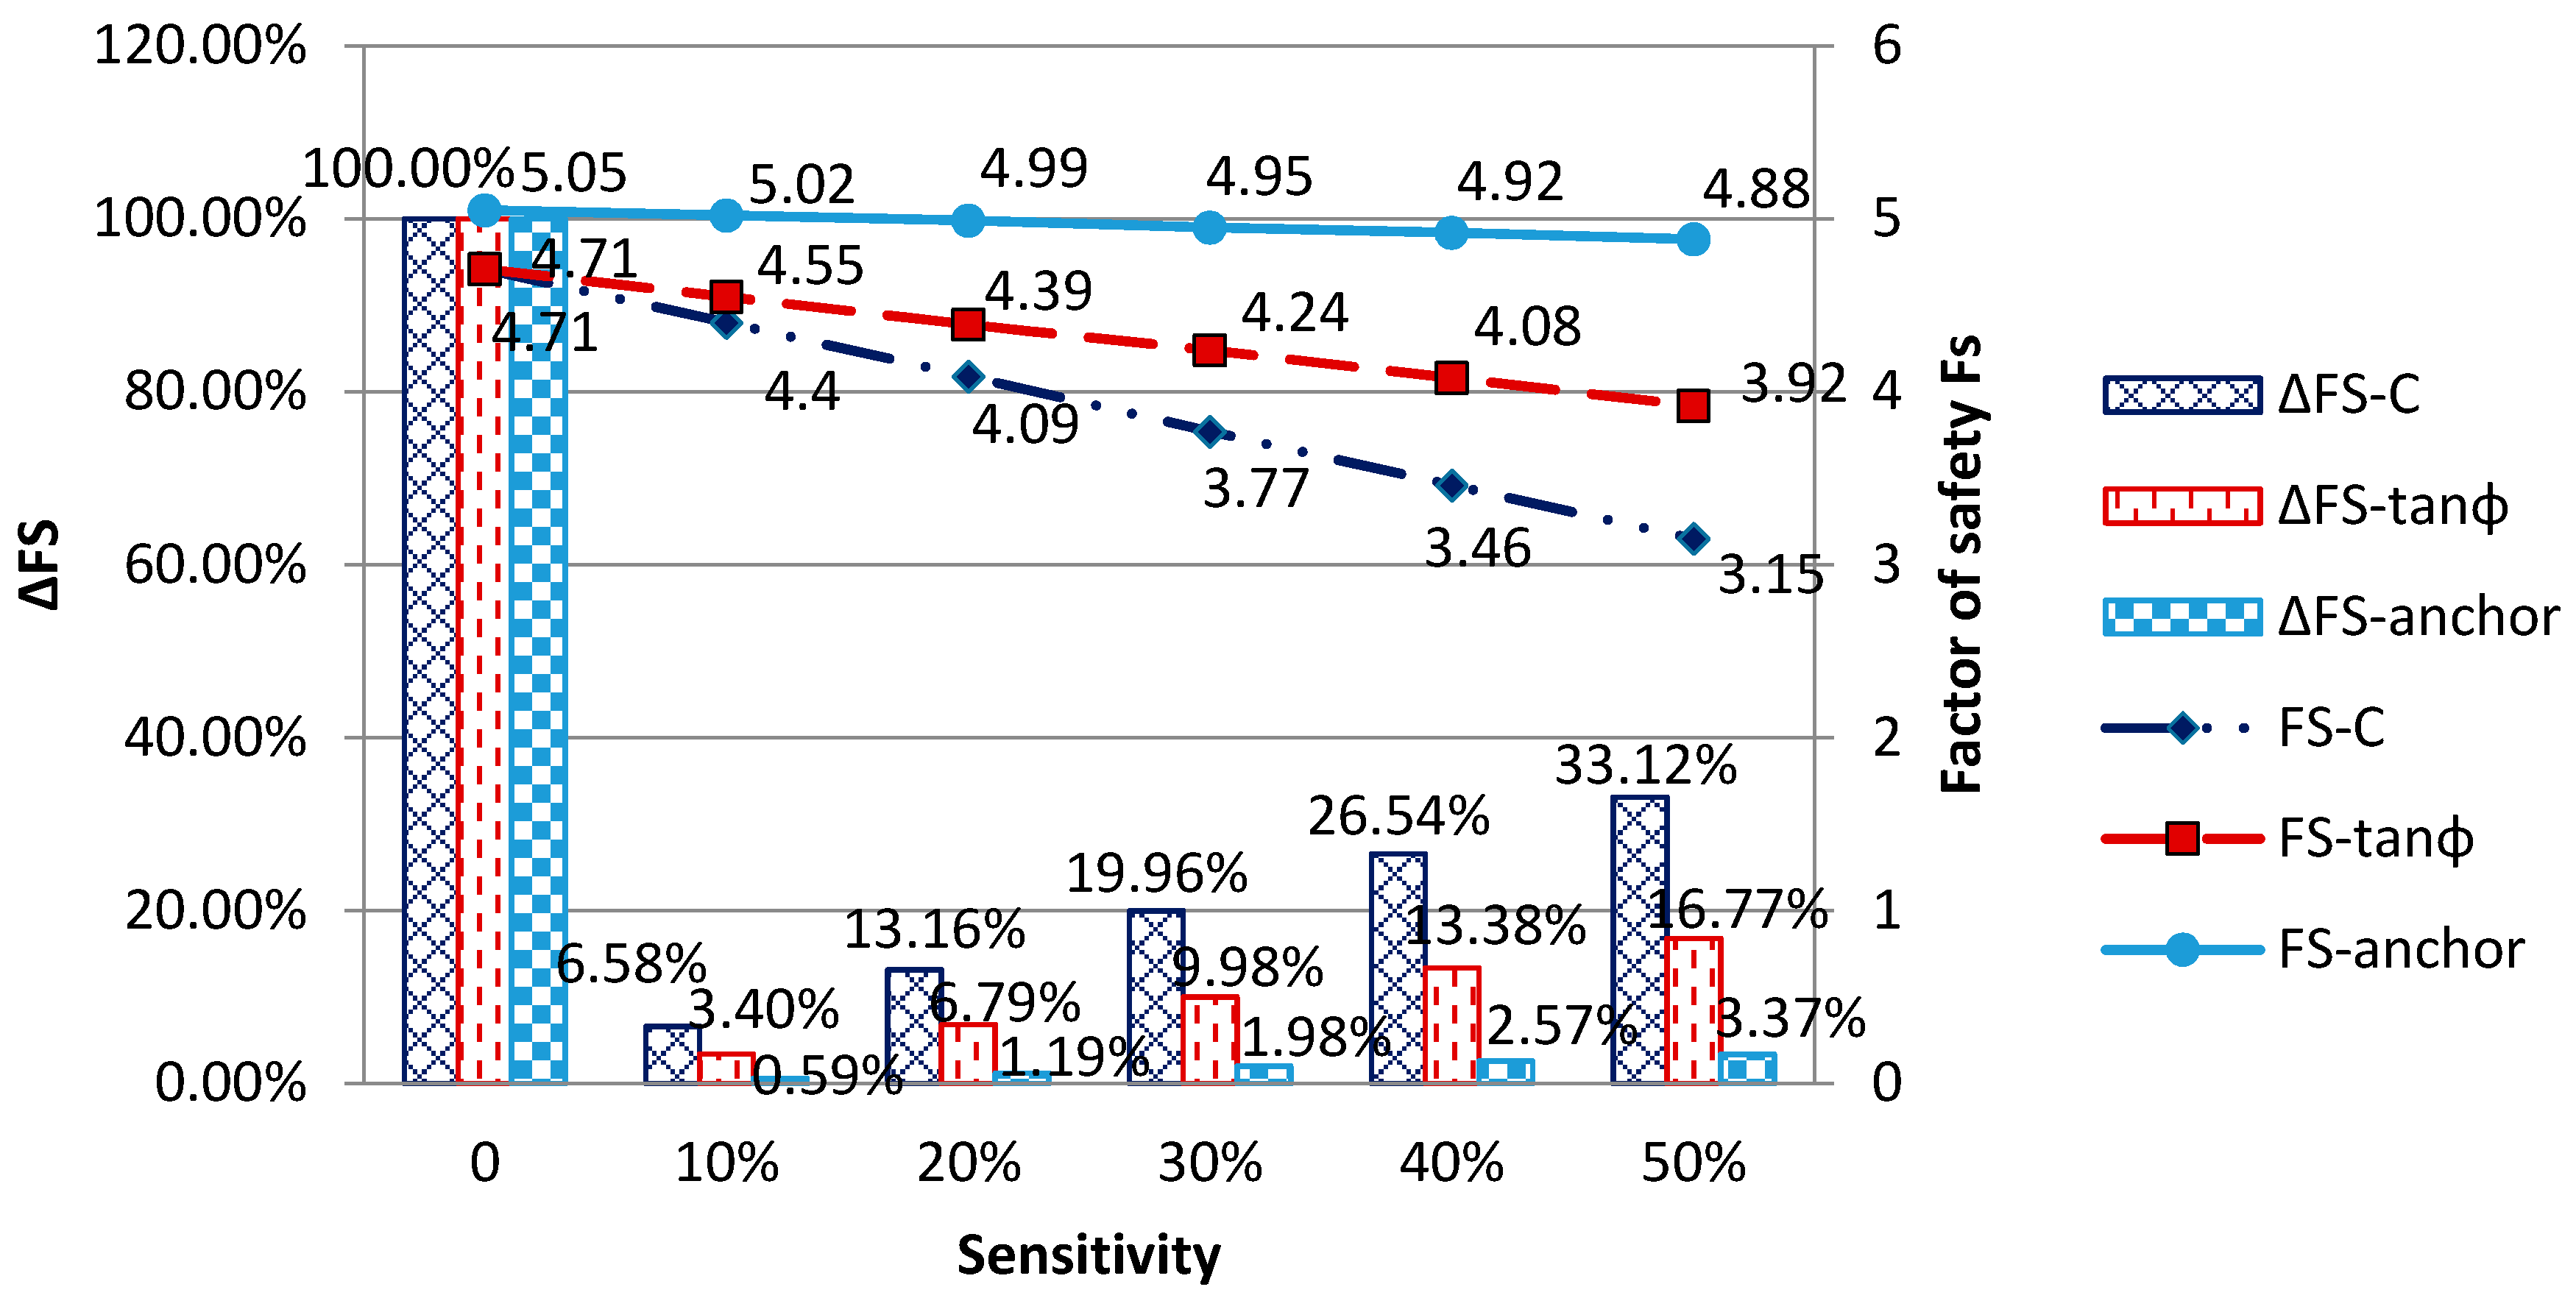
4.1. Sensitivity Analysis
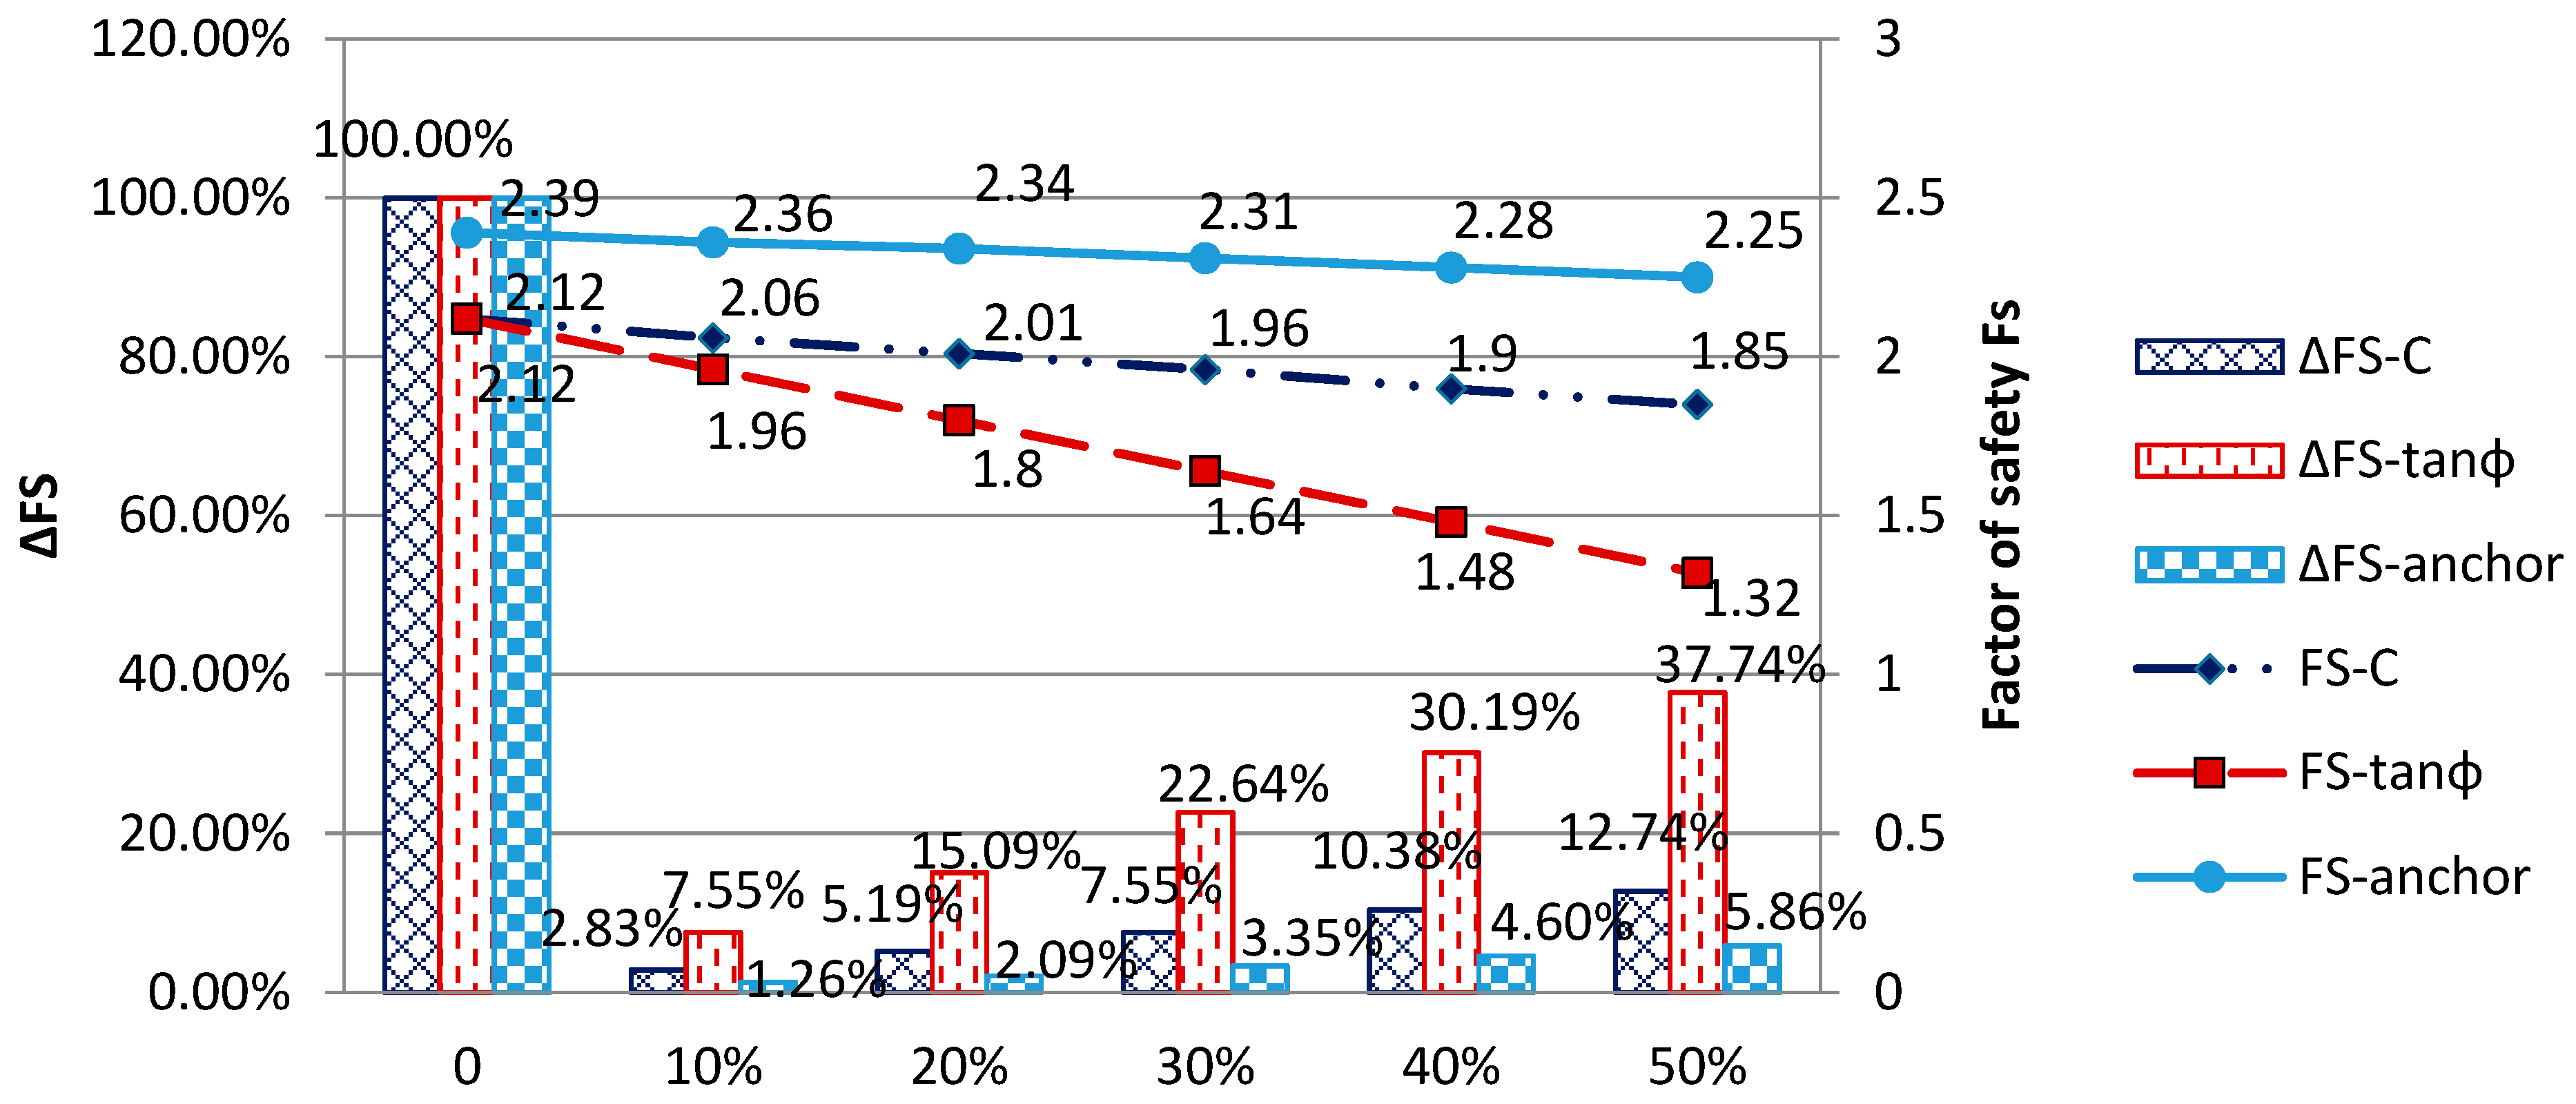
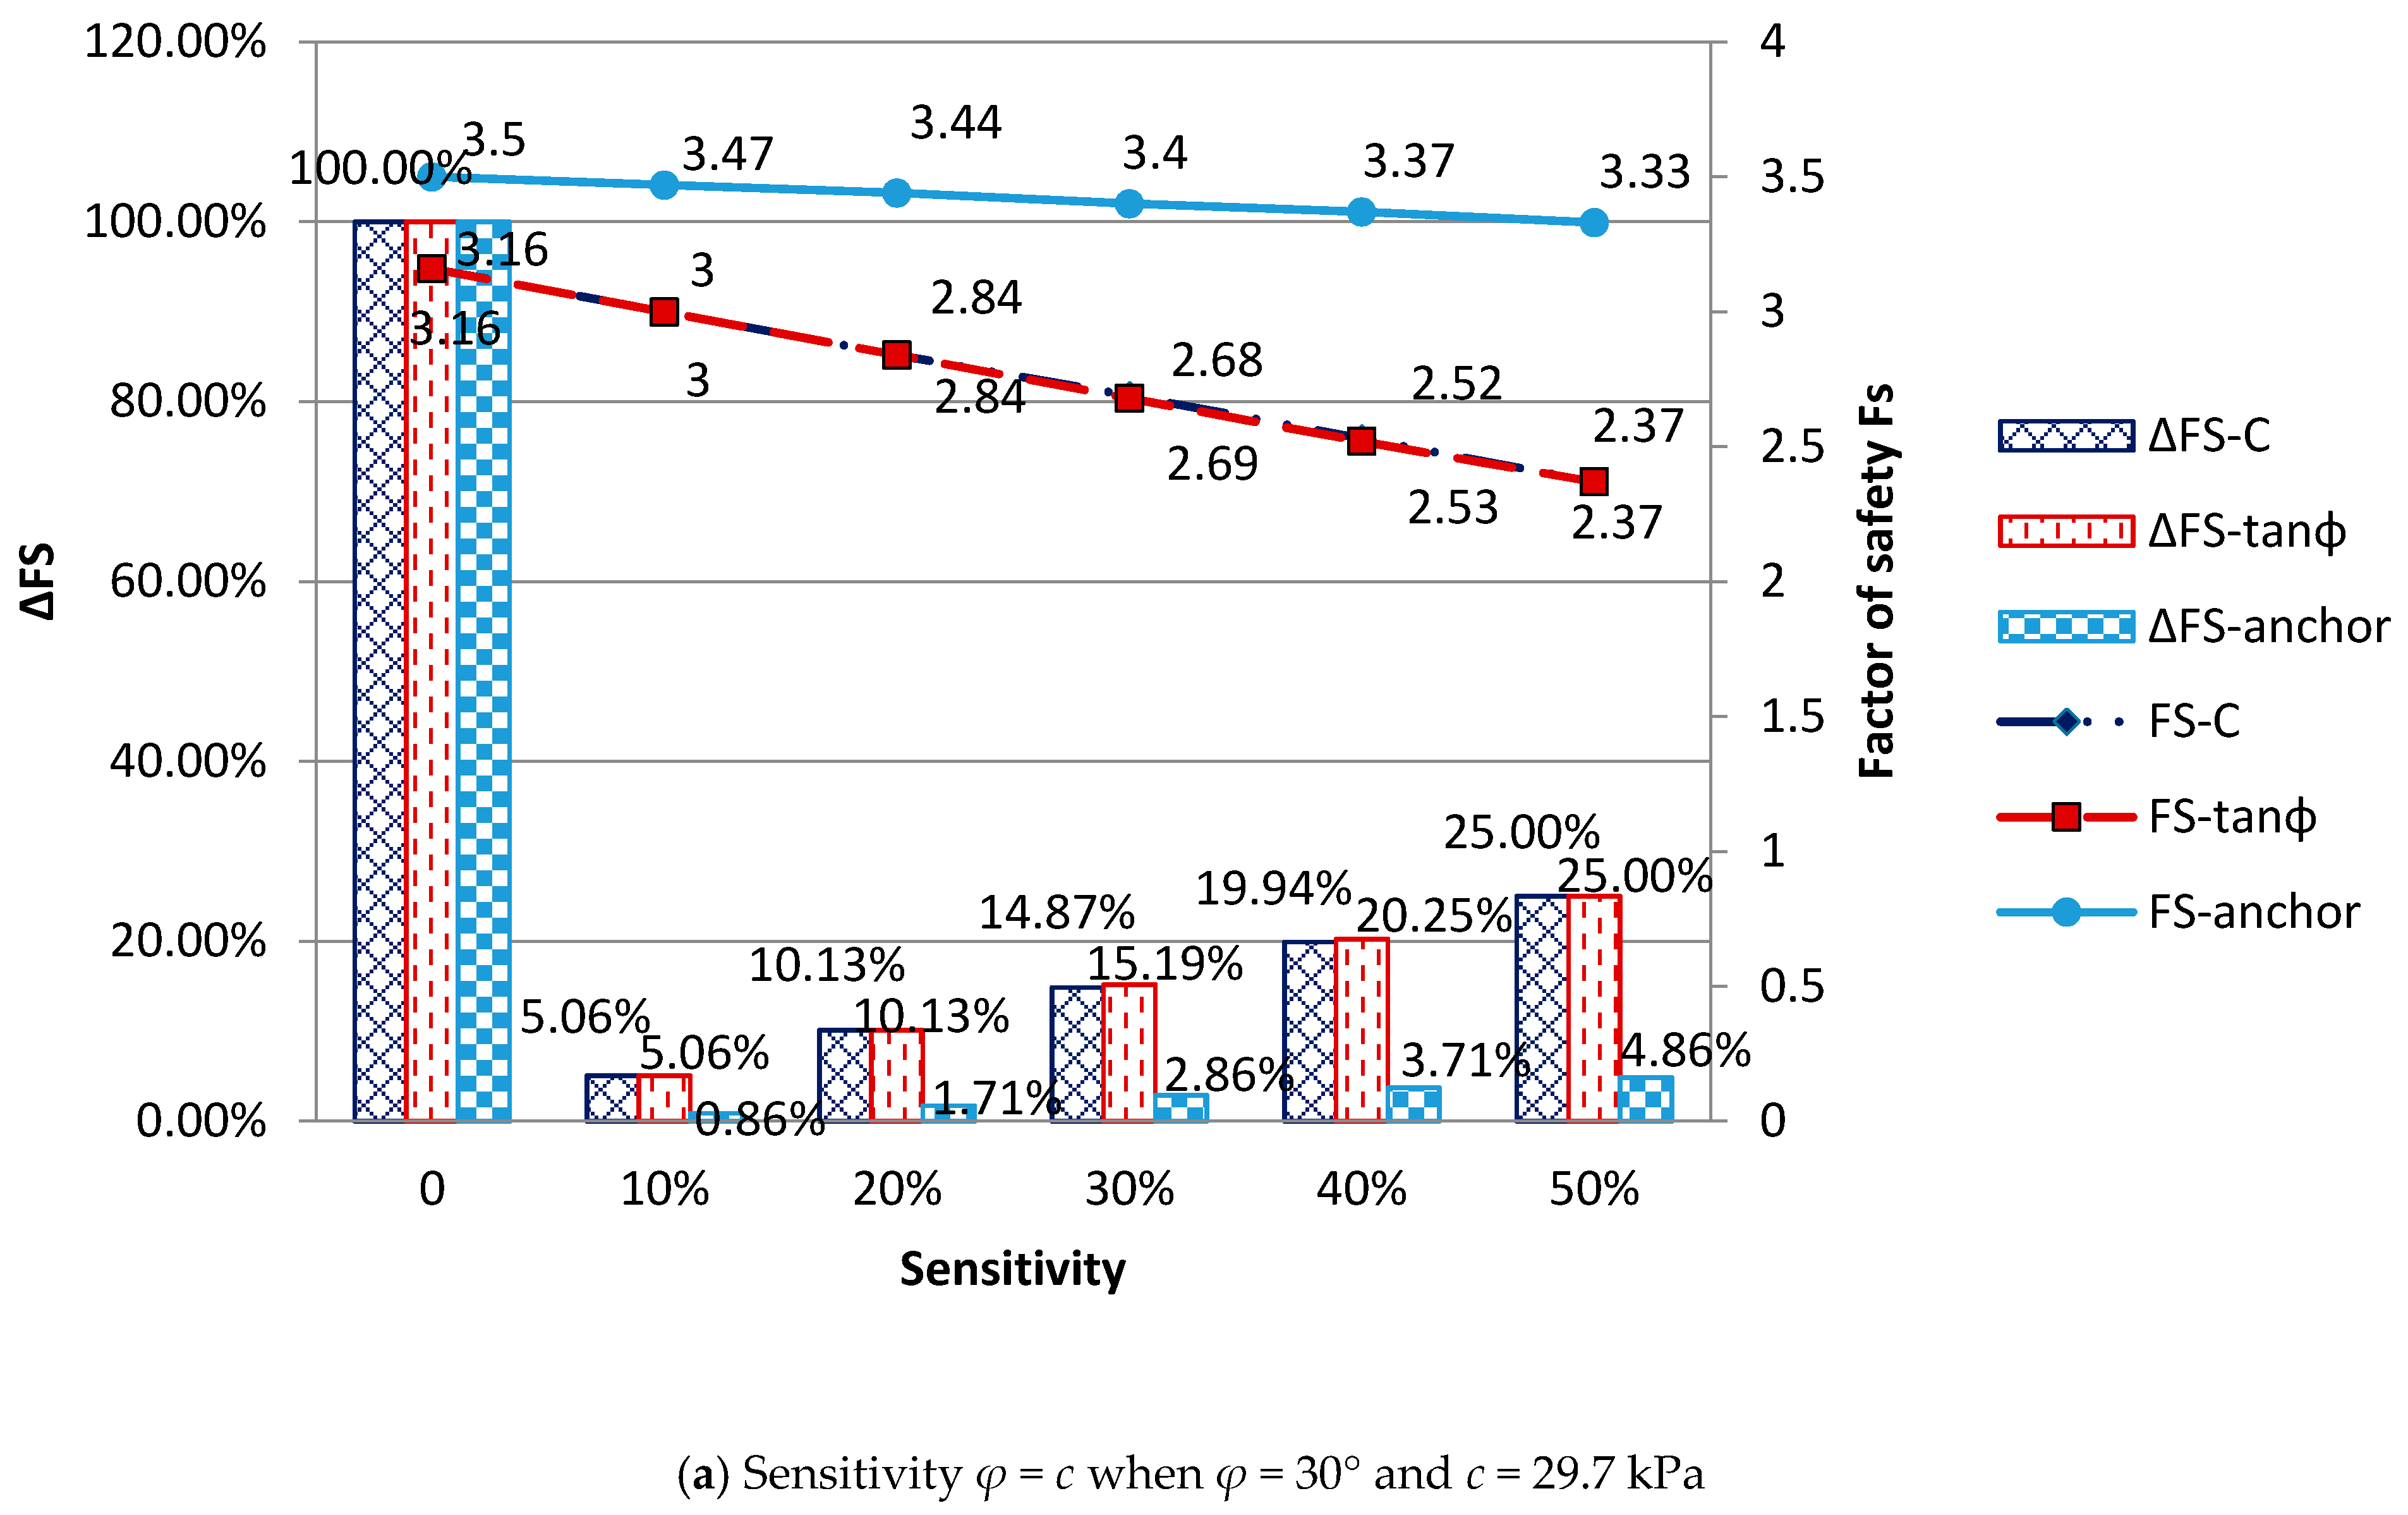
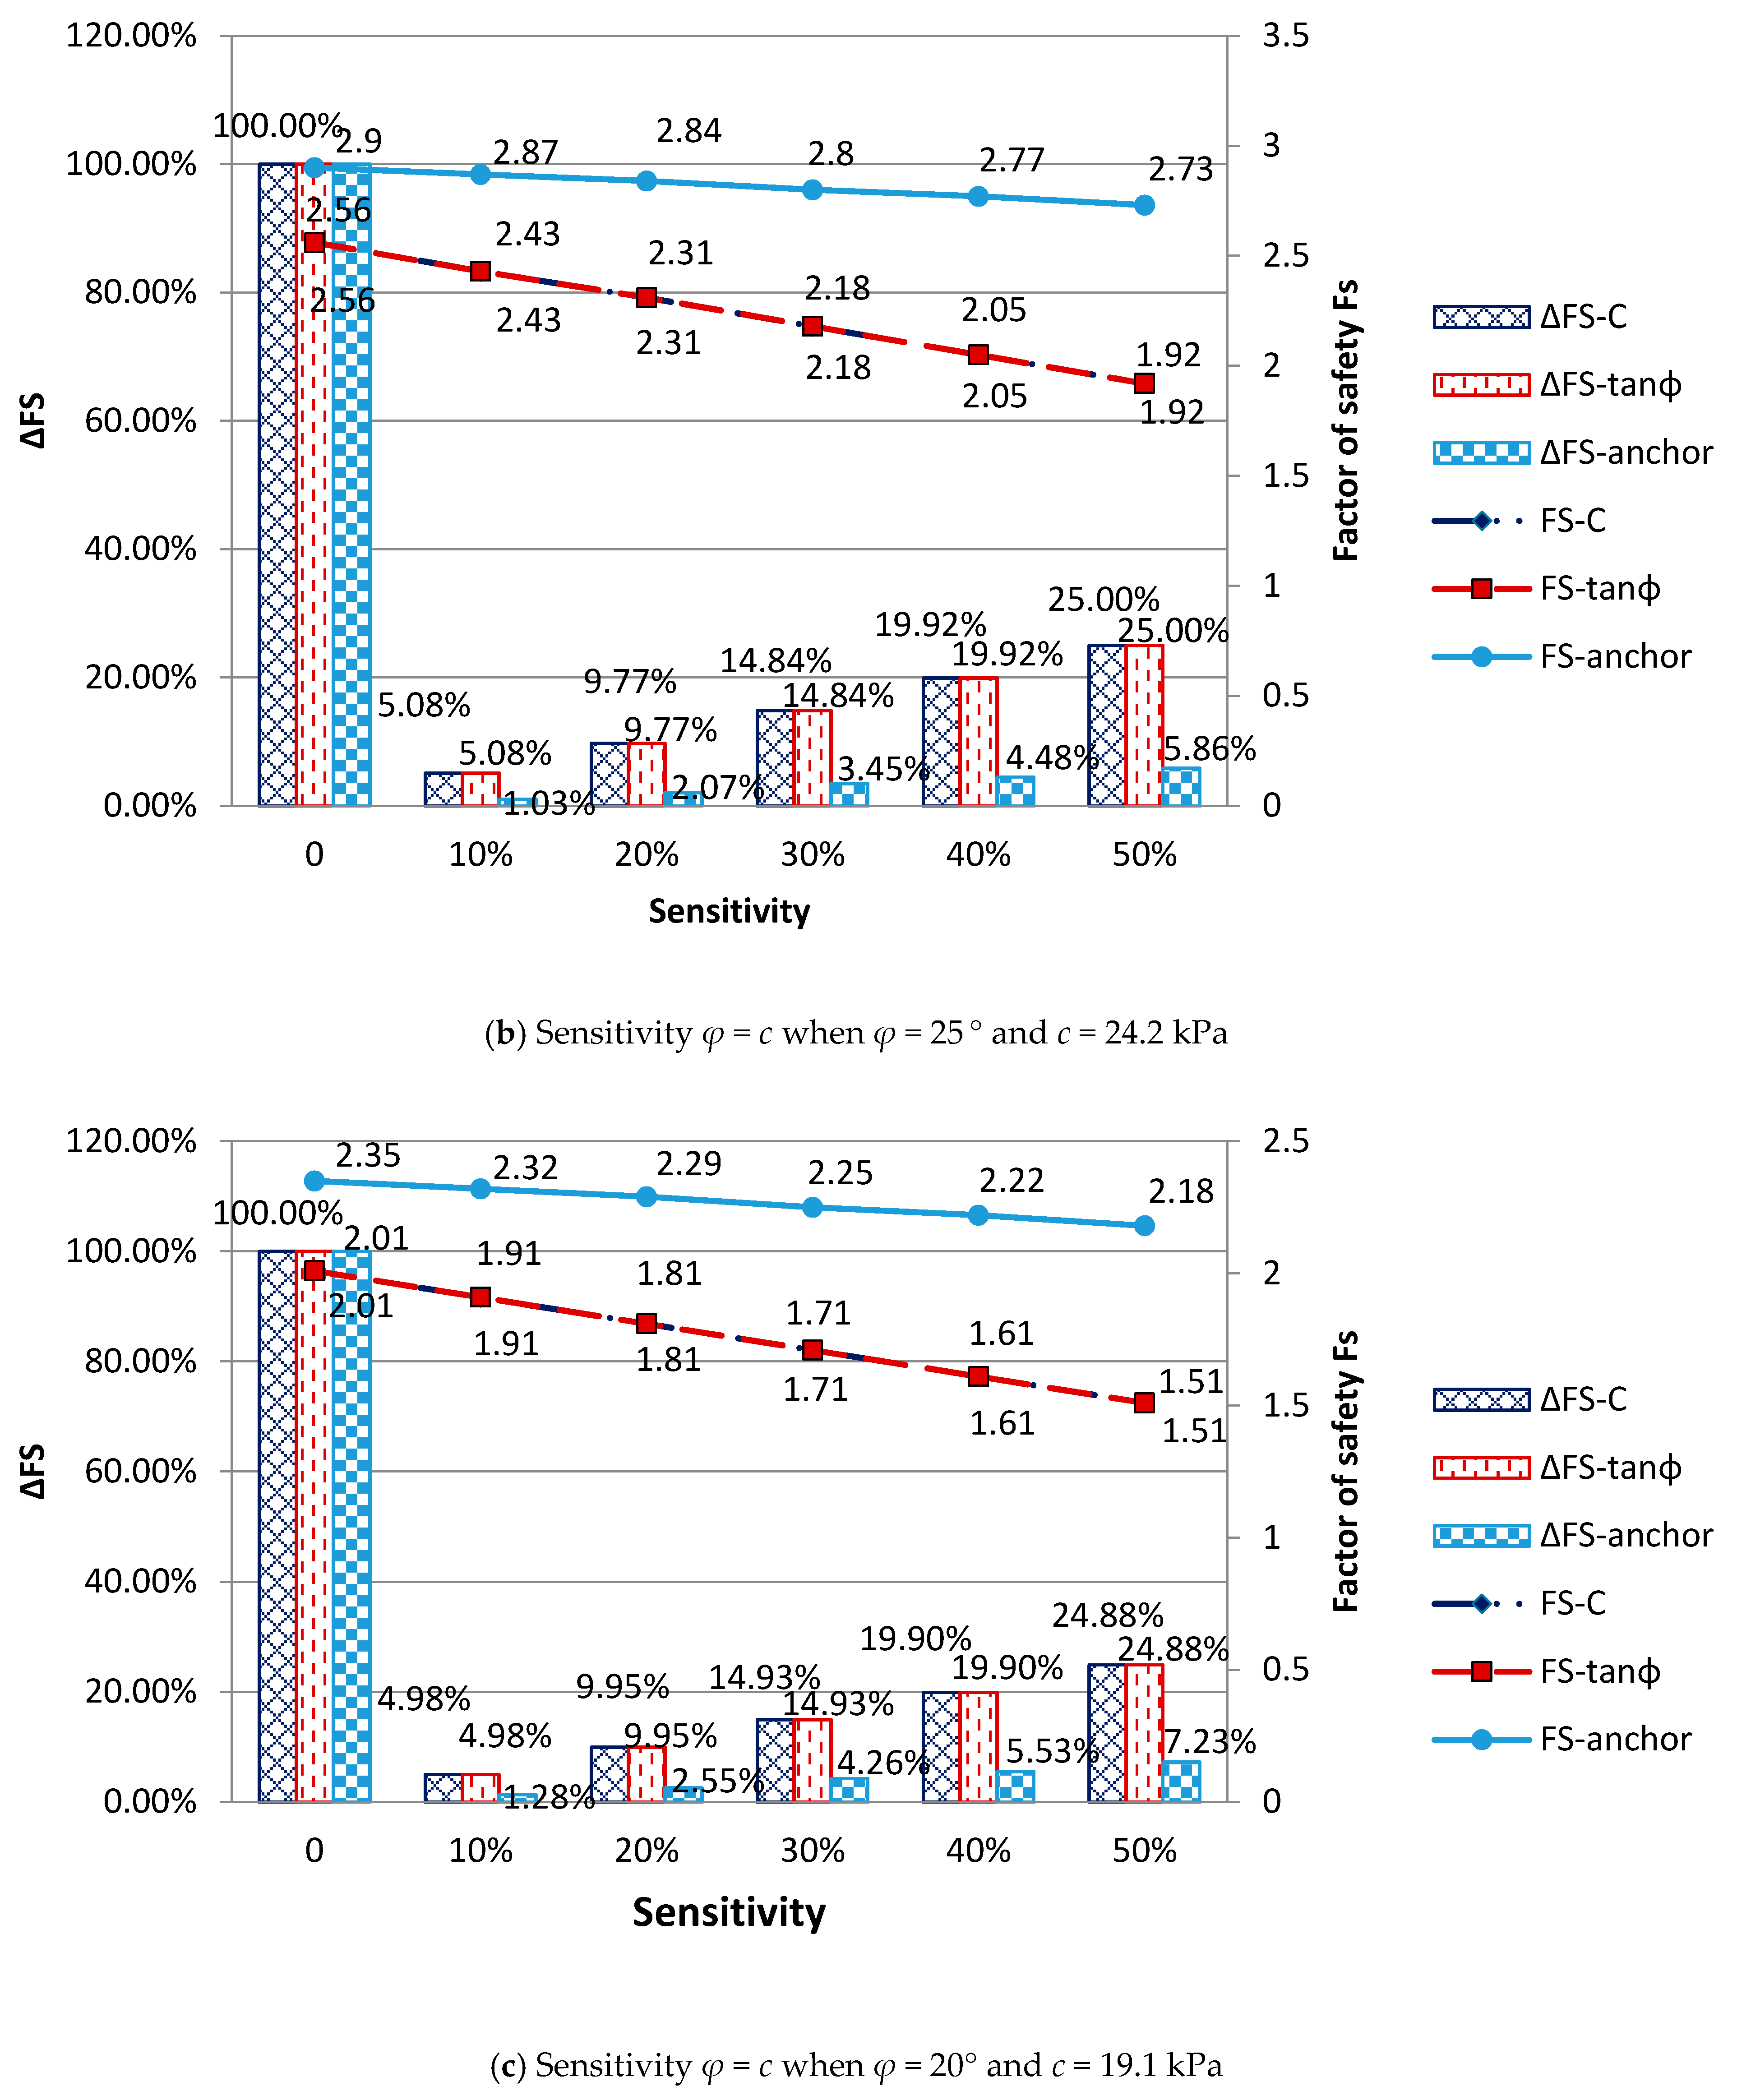
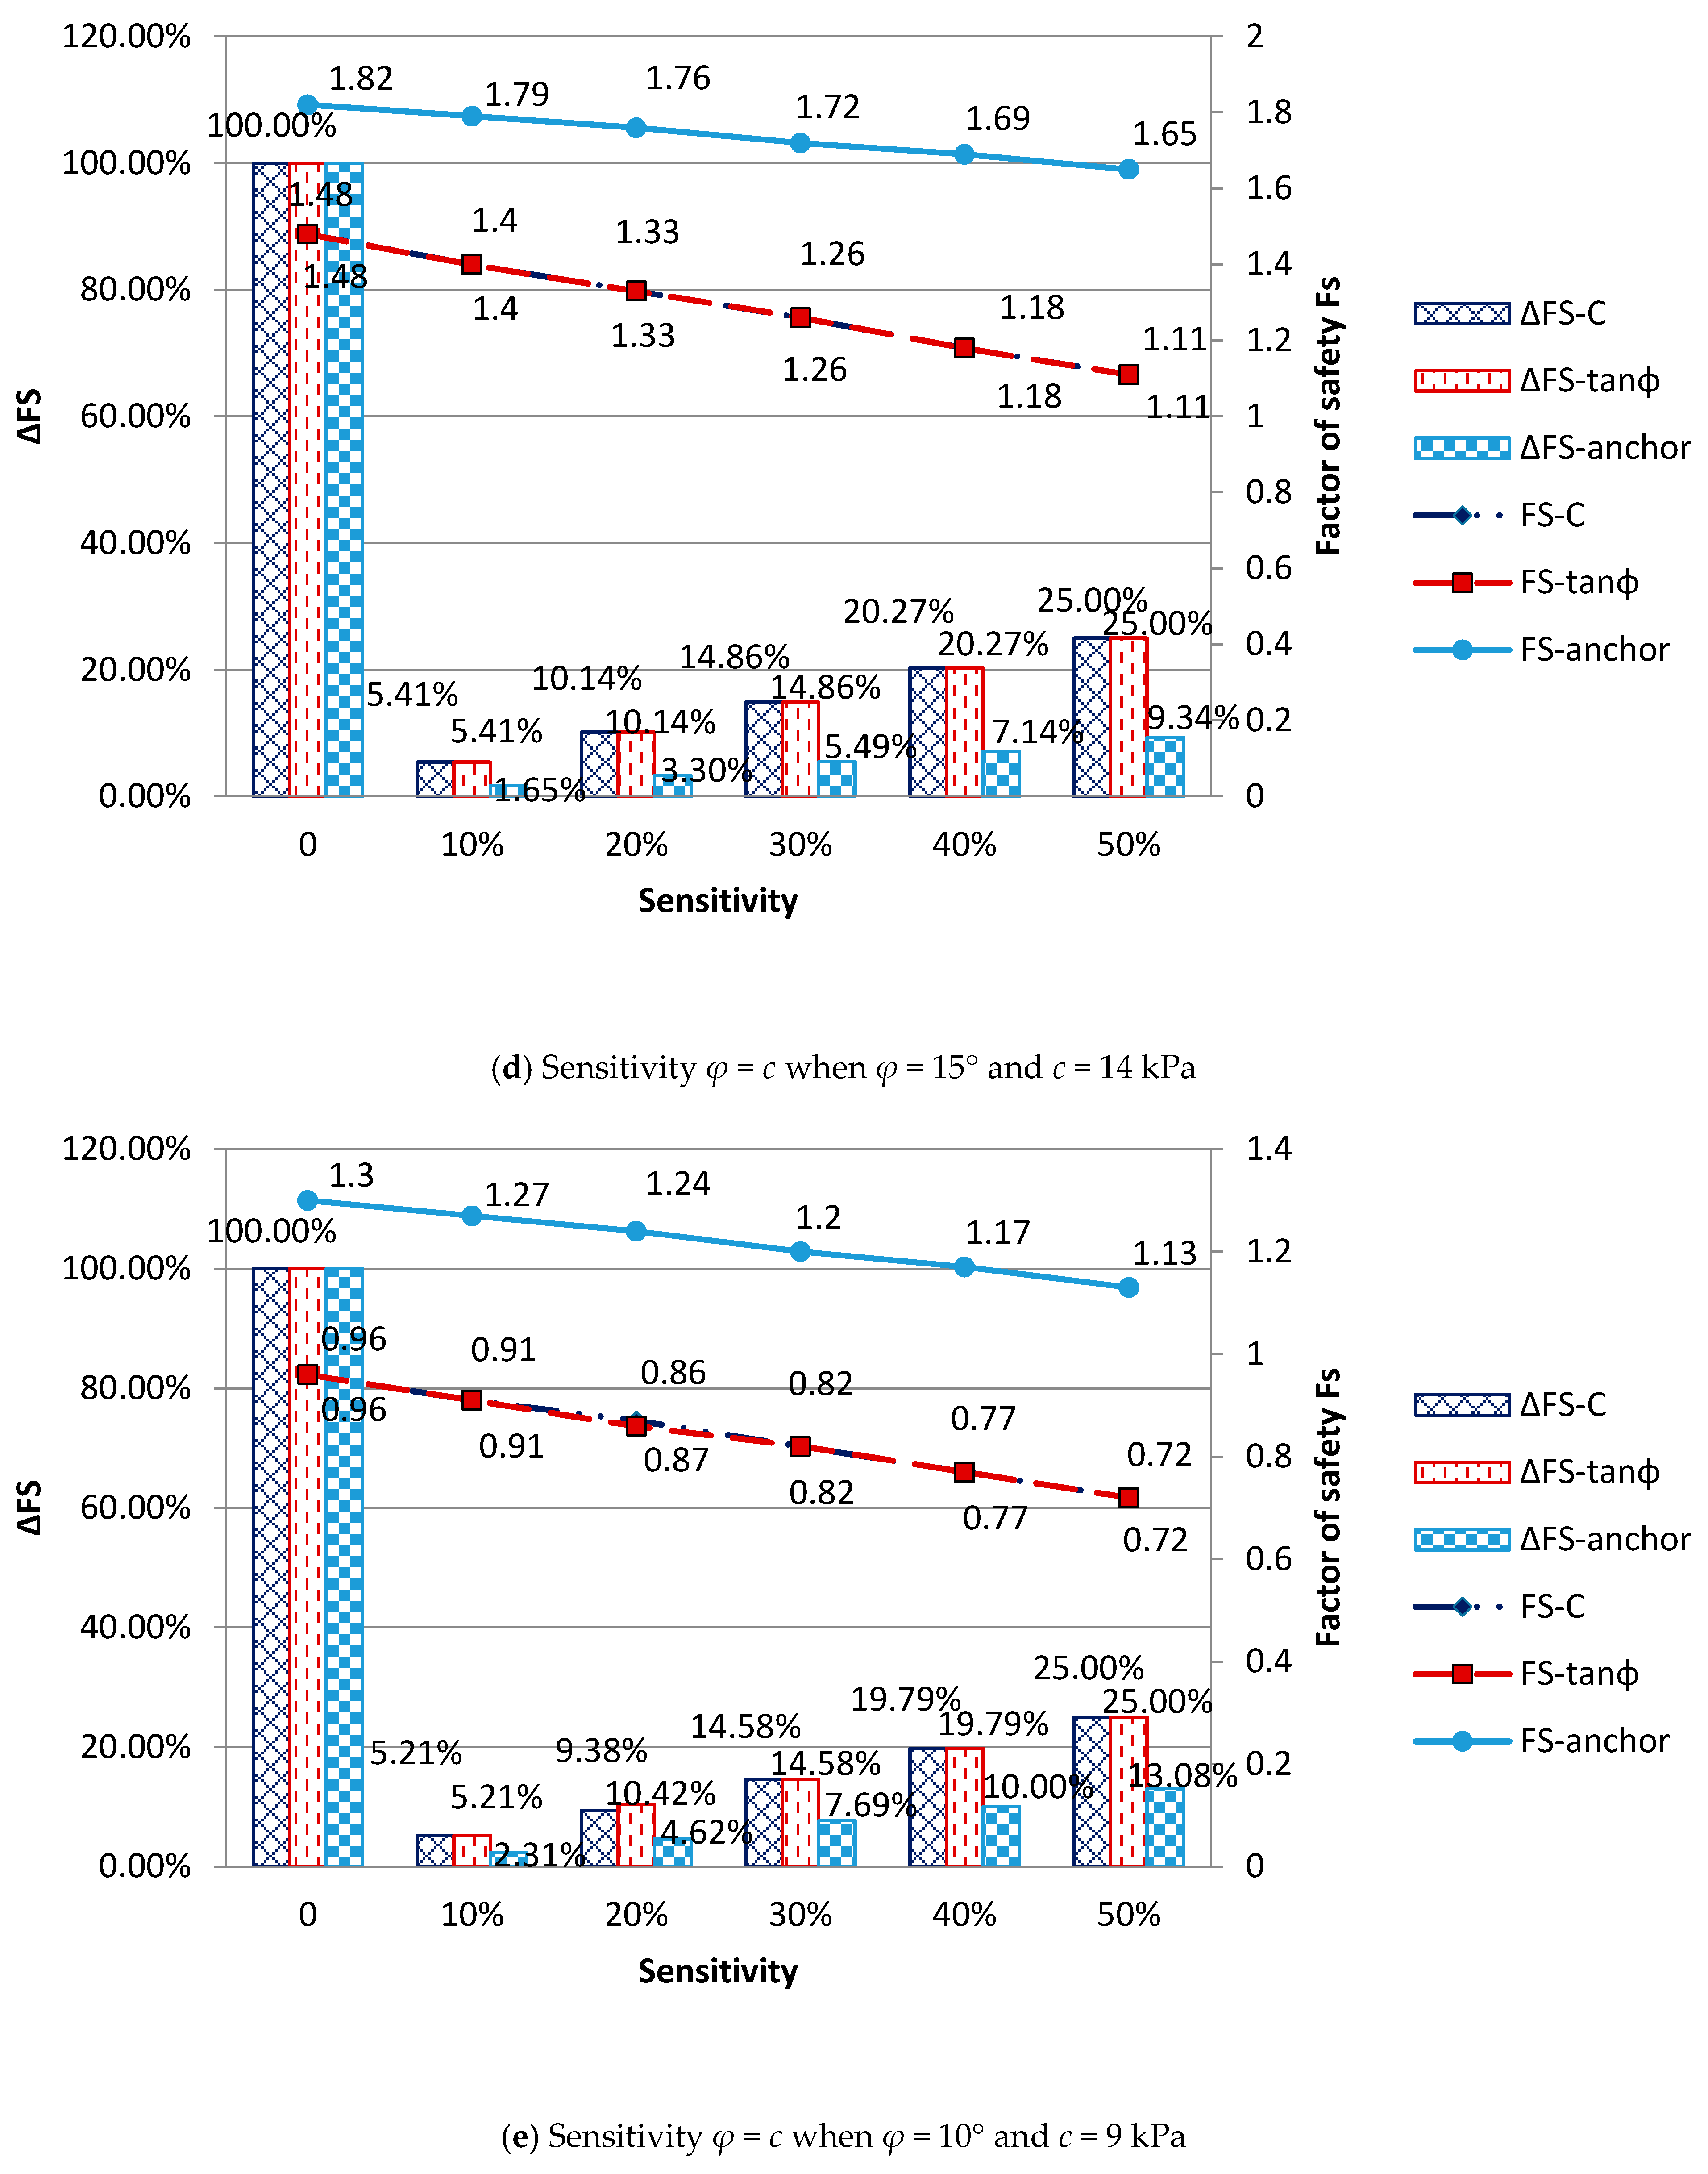
4.1.1. Univariate Sensitivity Analysis
4.1.2. Multivariate Sensitivity Analysis
4.2. Uncertainty Analysis
5. Discussion
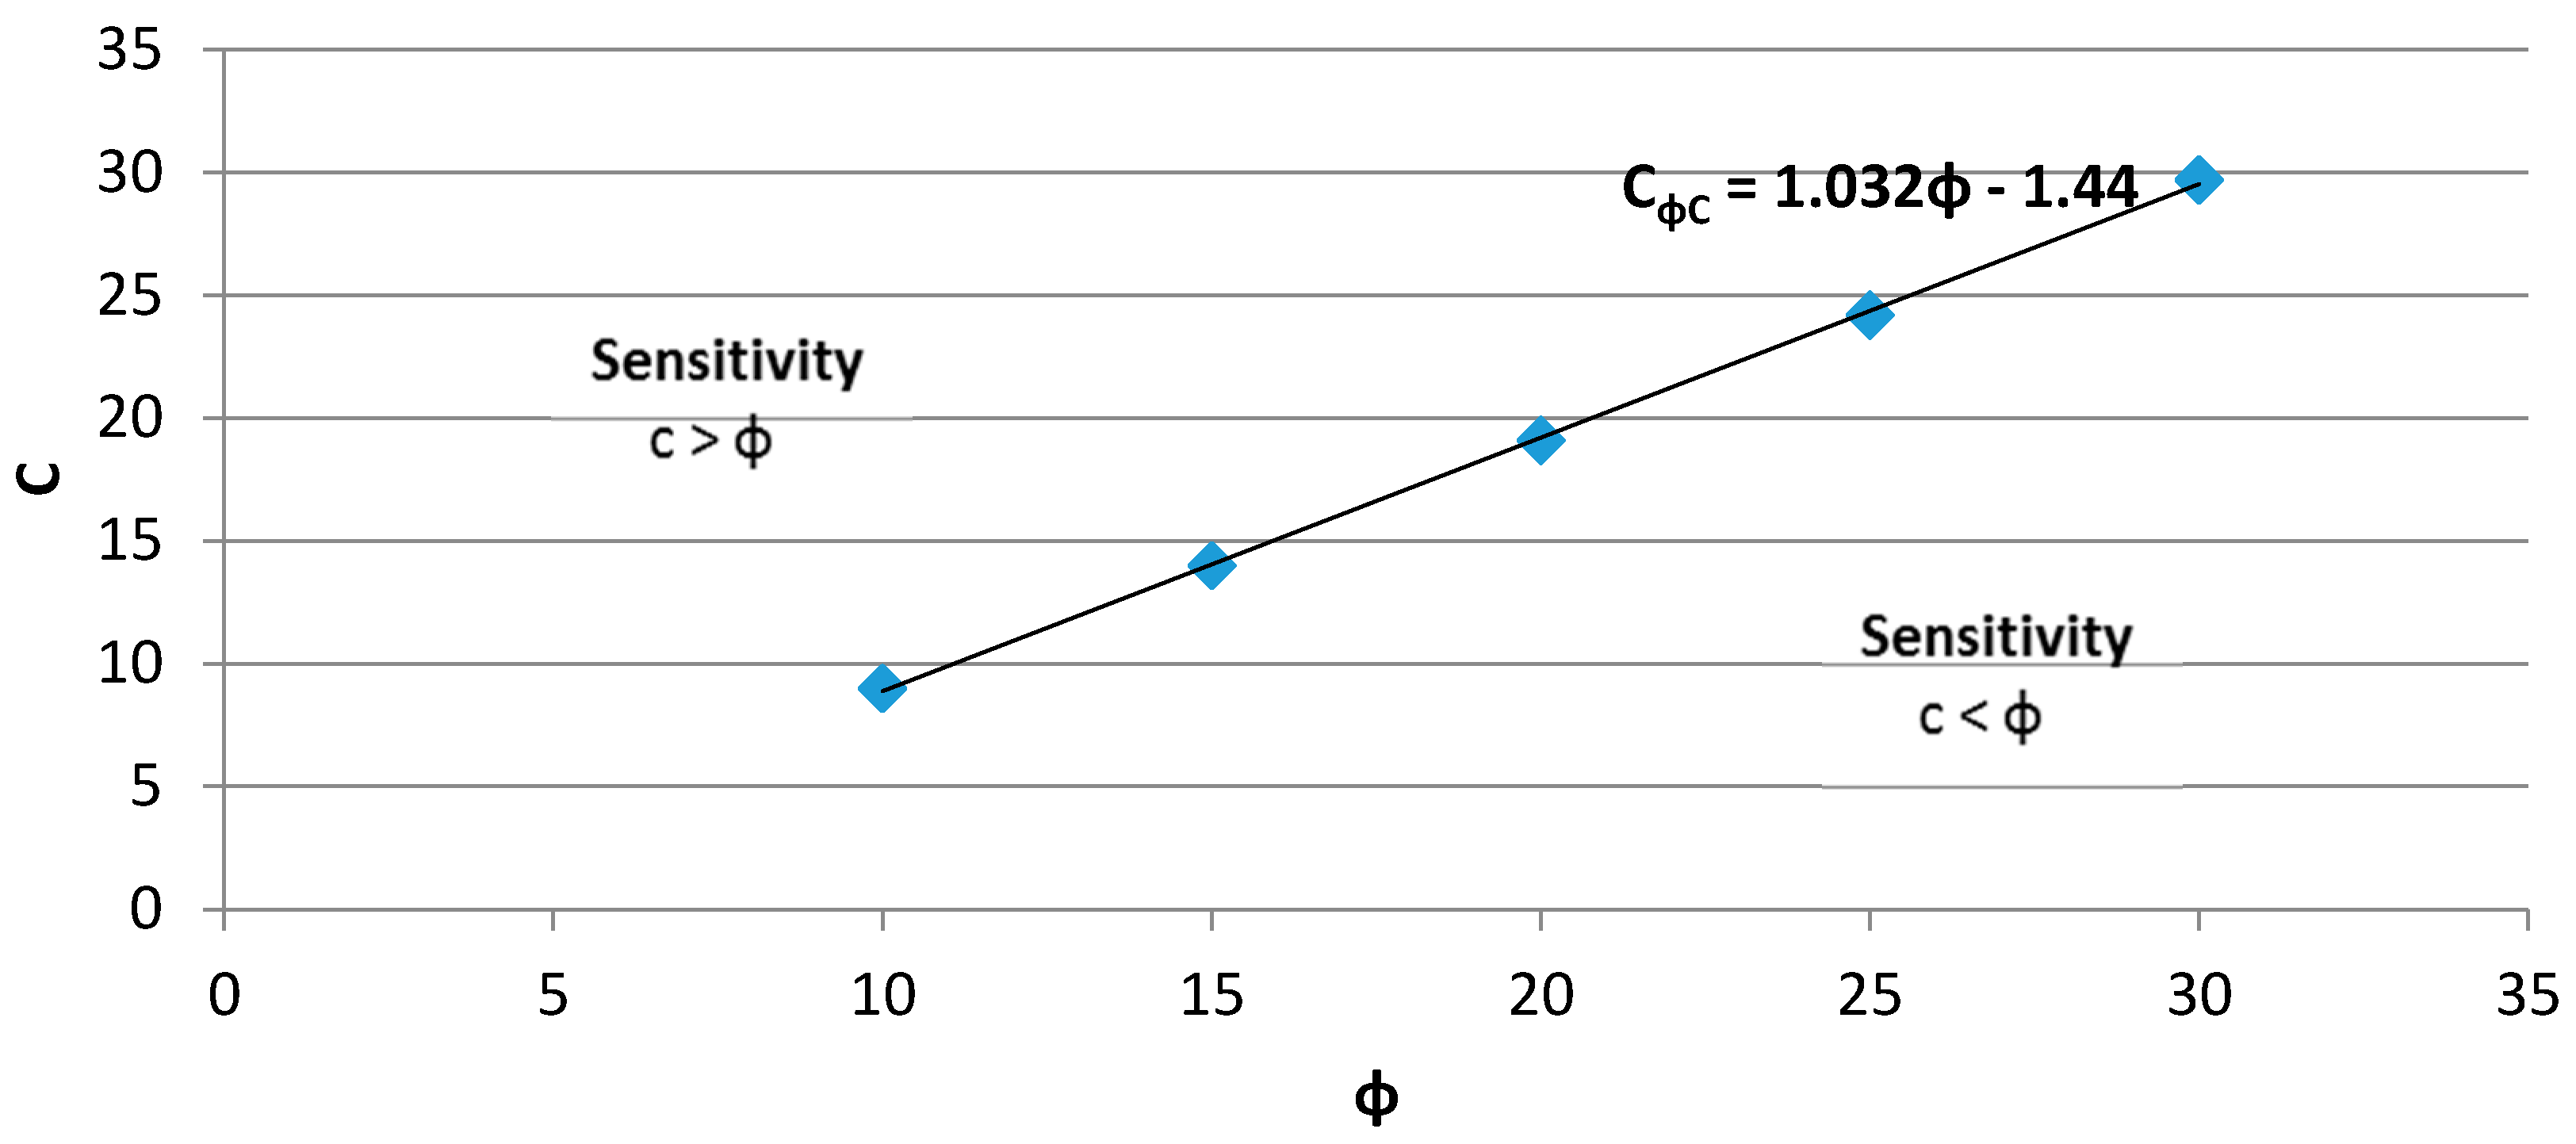
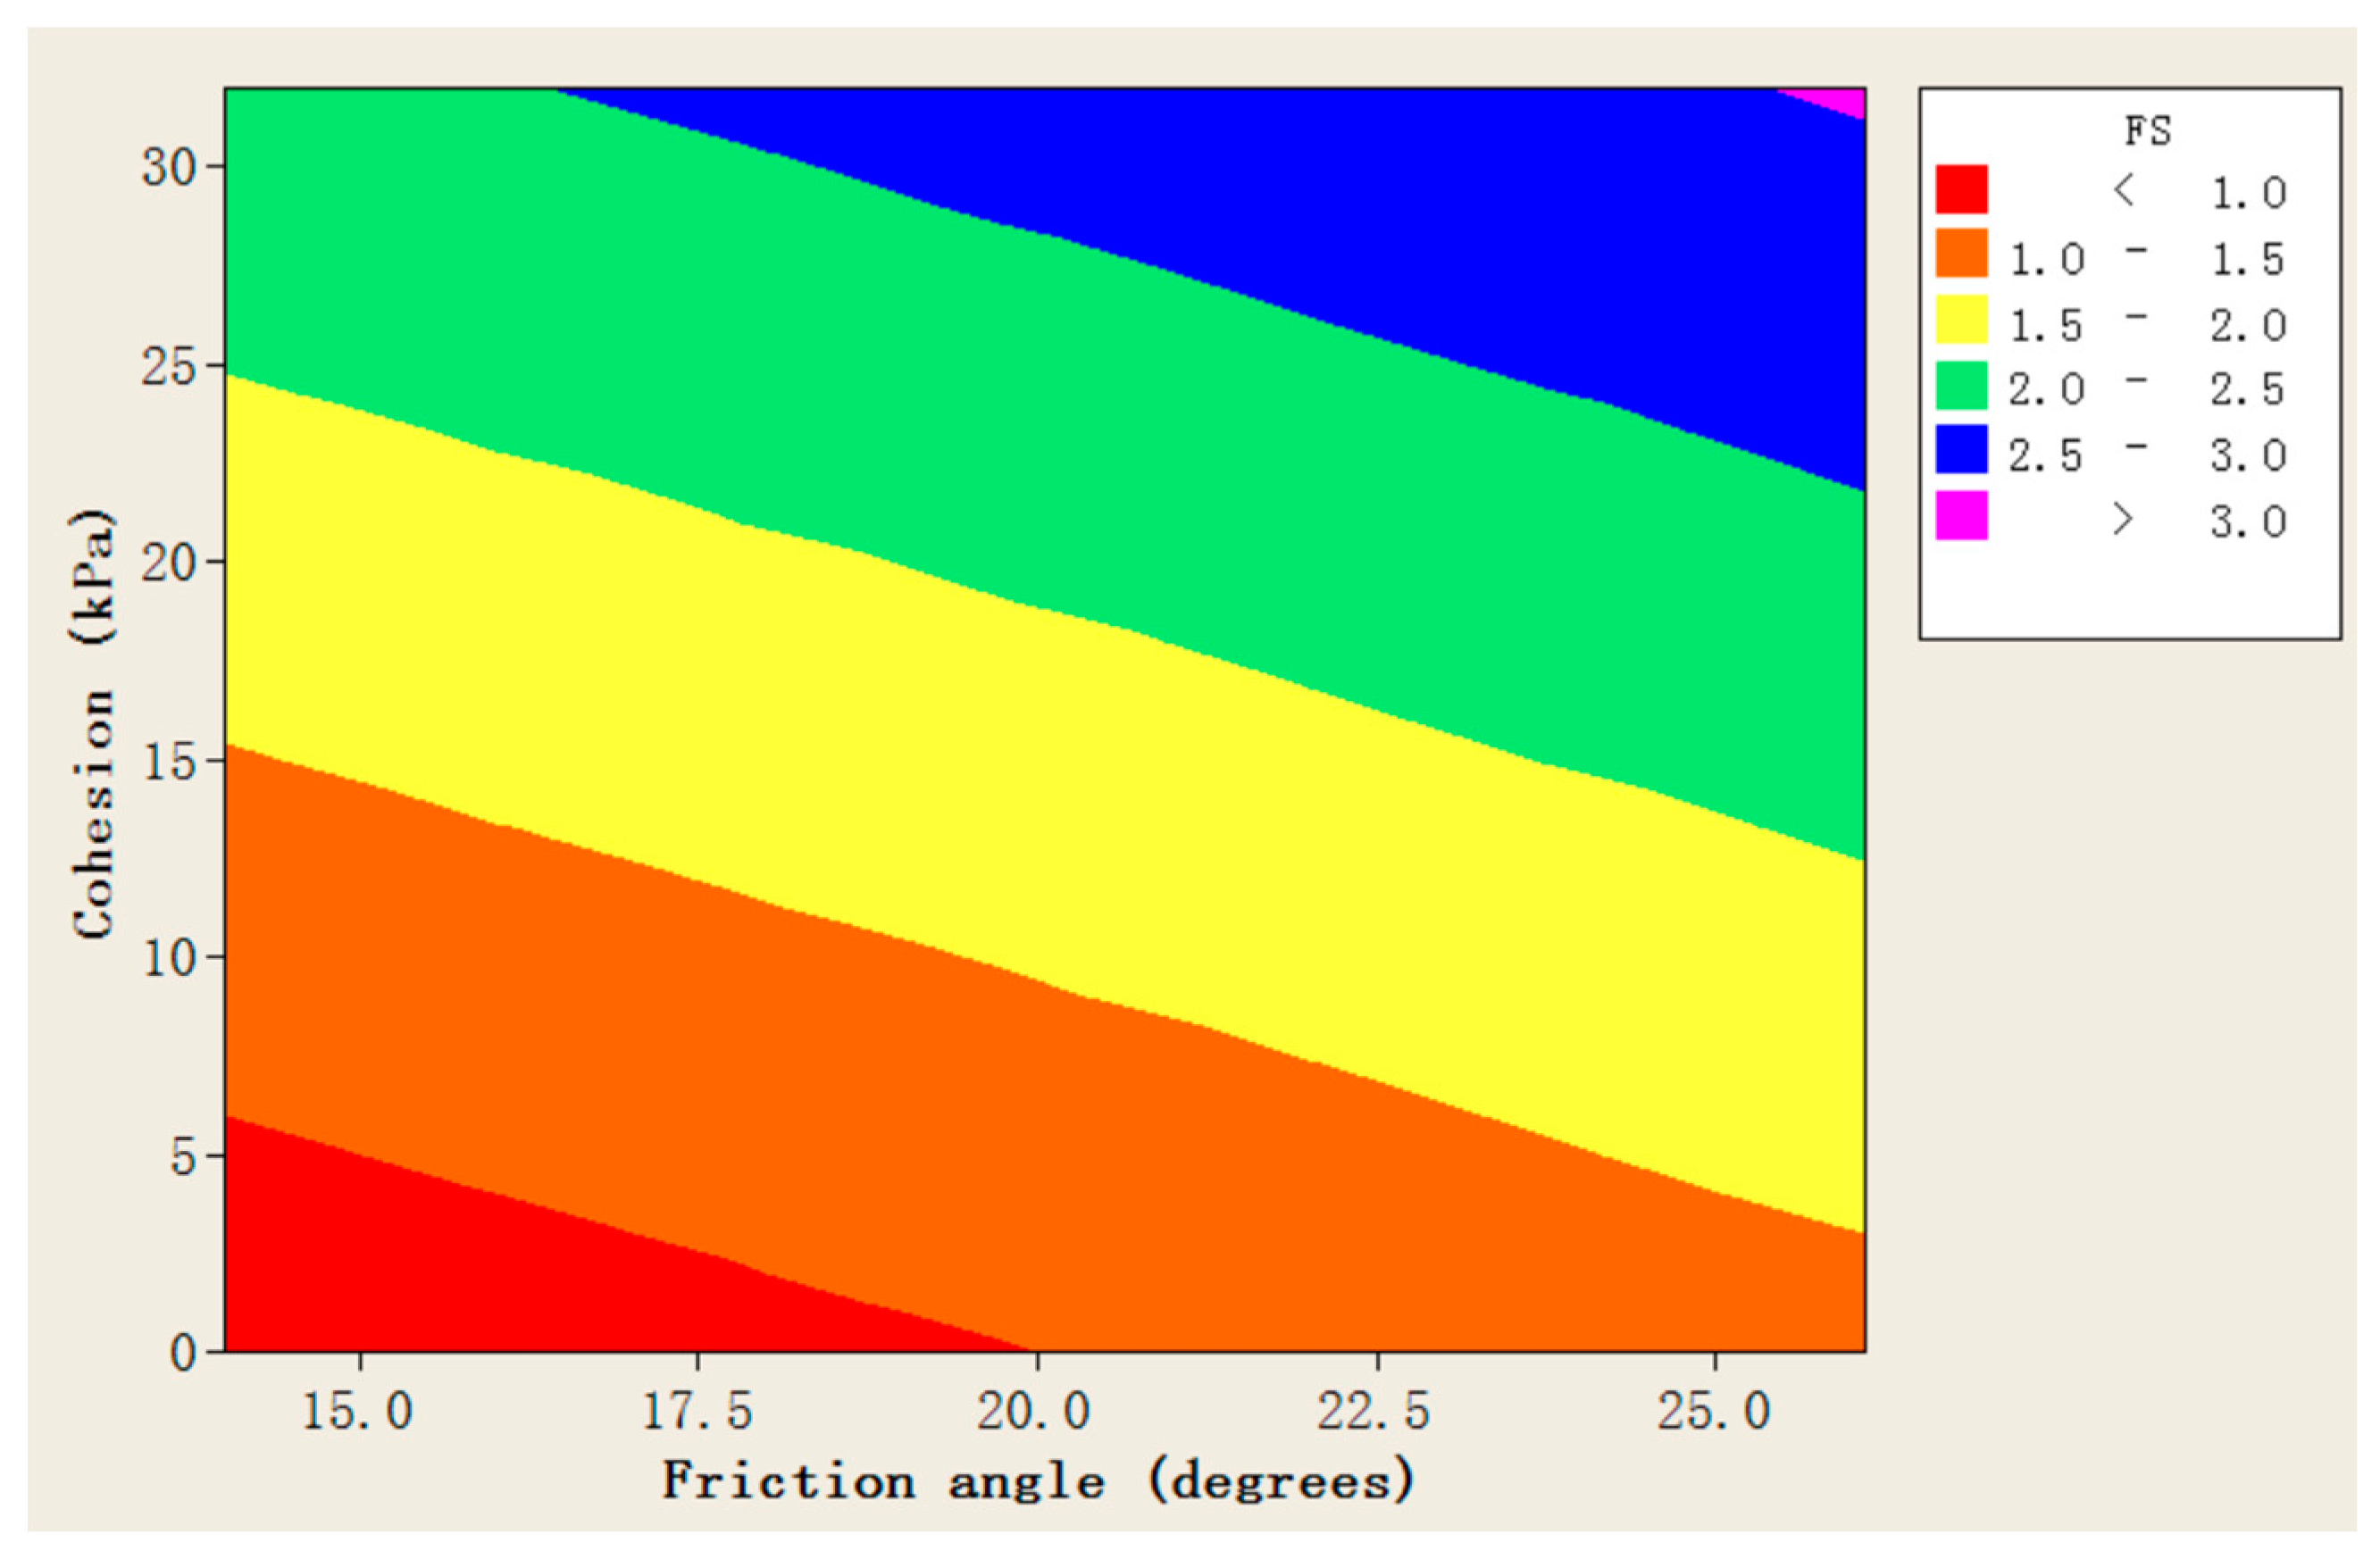
- From the univariate sensitivity test result, the sensitivity to the pre-stressing force of rock anchor T was significantly less than the influence by variation in the cohesion force c and friction angle ϕ. When c decreased to a threshold, the influence on sensitivity of the factor would be the same as friction angle ϕ. The threshold c value was defined as a linear function CΦc = 1.032ϕ − 1.44. It was found that the area above the equation line had the sensitivity c > ϕ, while the area below would show the opposite, c < ϕ. The results of the sensitivity analysis provide engineers with an important factor in understanding the impact of the slope collapse. In the future, in determining the failure of the slope system, it is possible to obtain important factors in this result and to make relevant improvements or reinforcement measures.
- From the multi-variate sensitivity test, it was known that when the cohesion force c was reduced to 6 Kpa and the friction angle ϕ was reduced below 14°, the slope factor of safety (FS) < 1 and started to show instability and failure. The results show that, consistent with the report from the MOTC (2011), it is shown that the slope failure model established in this study can reasonably simulate the slope failure.
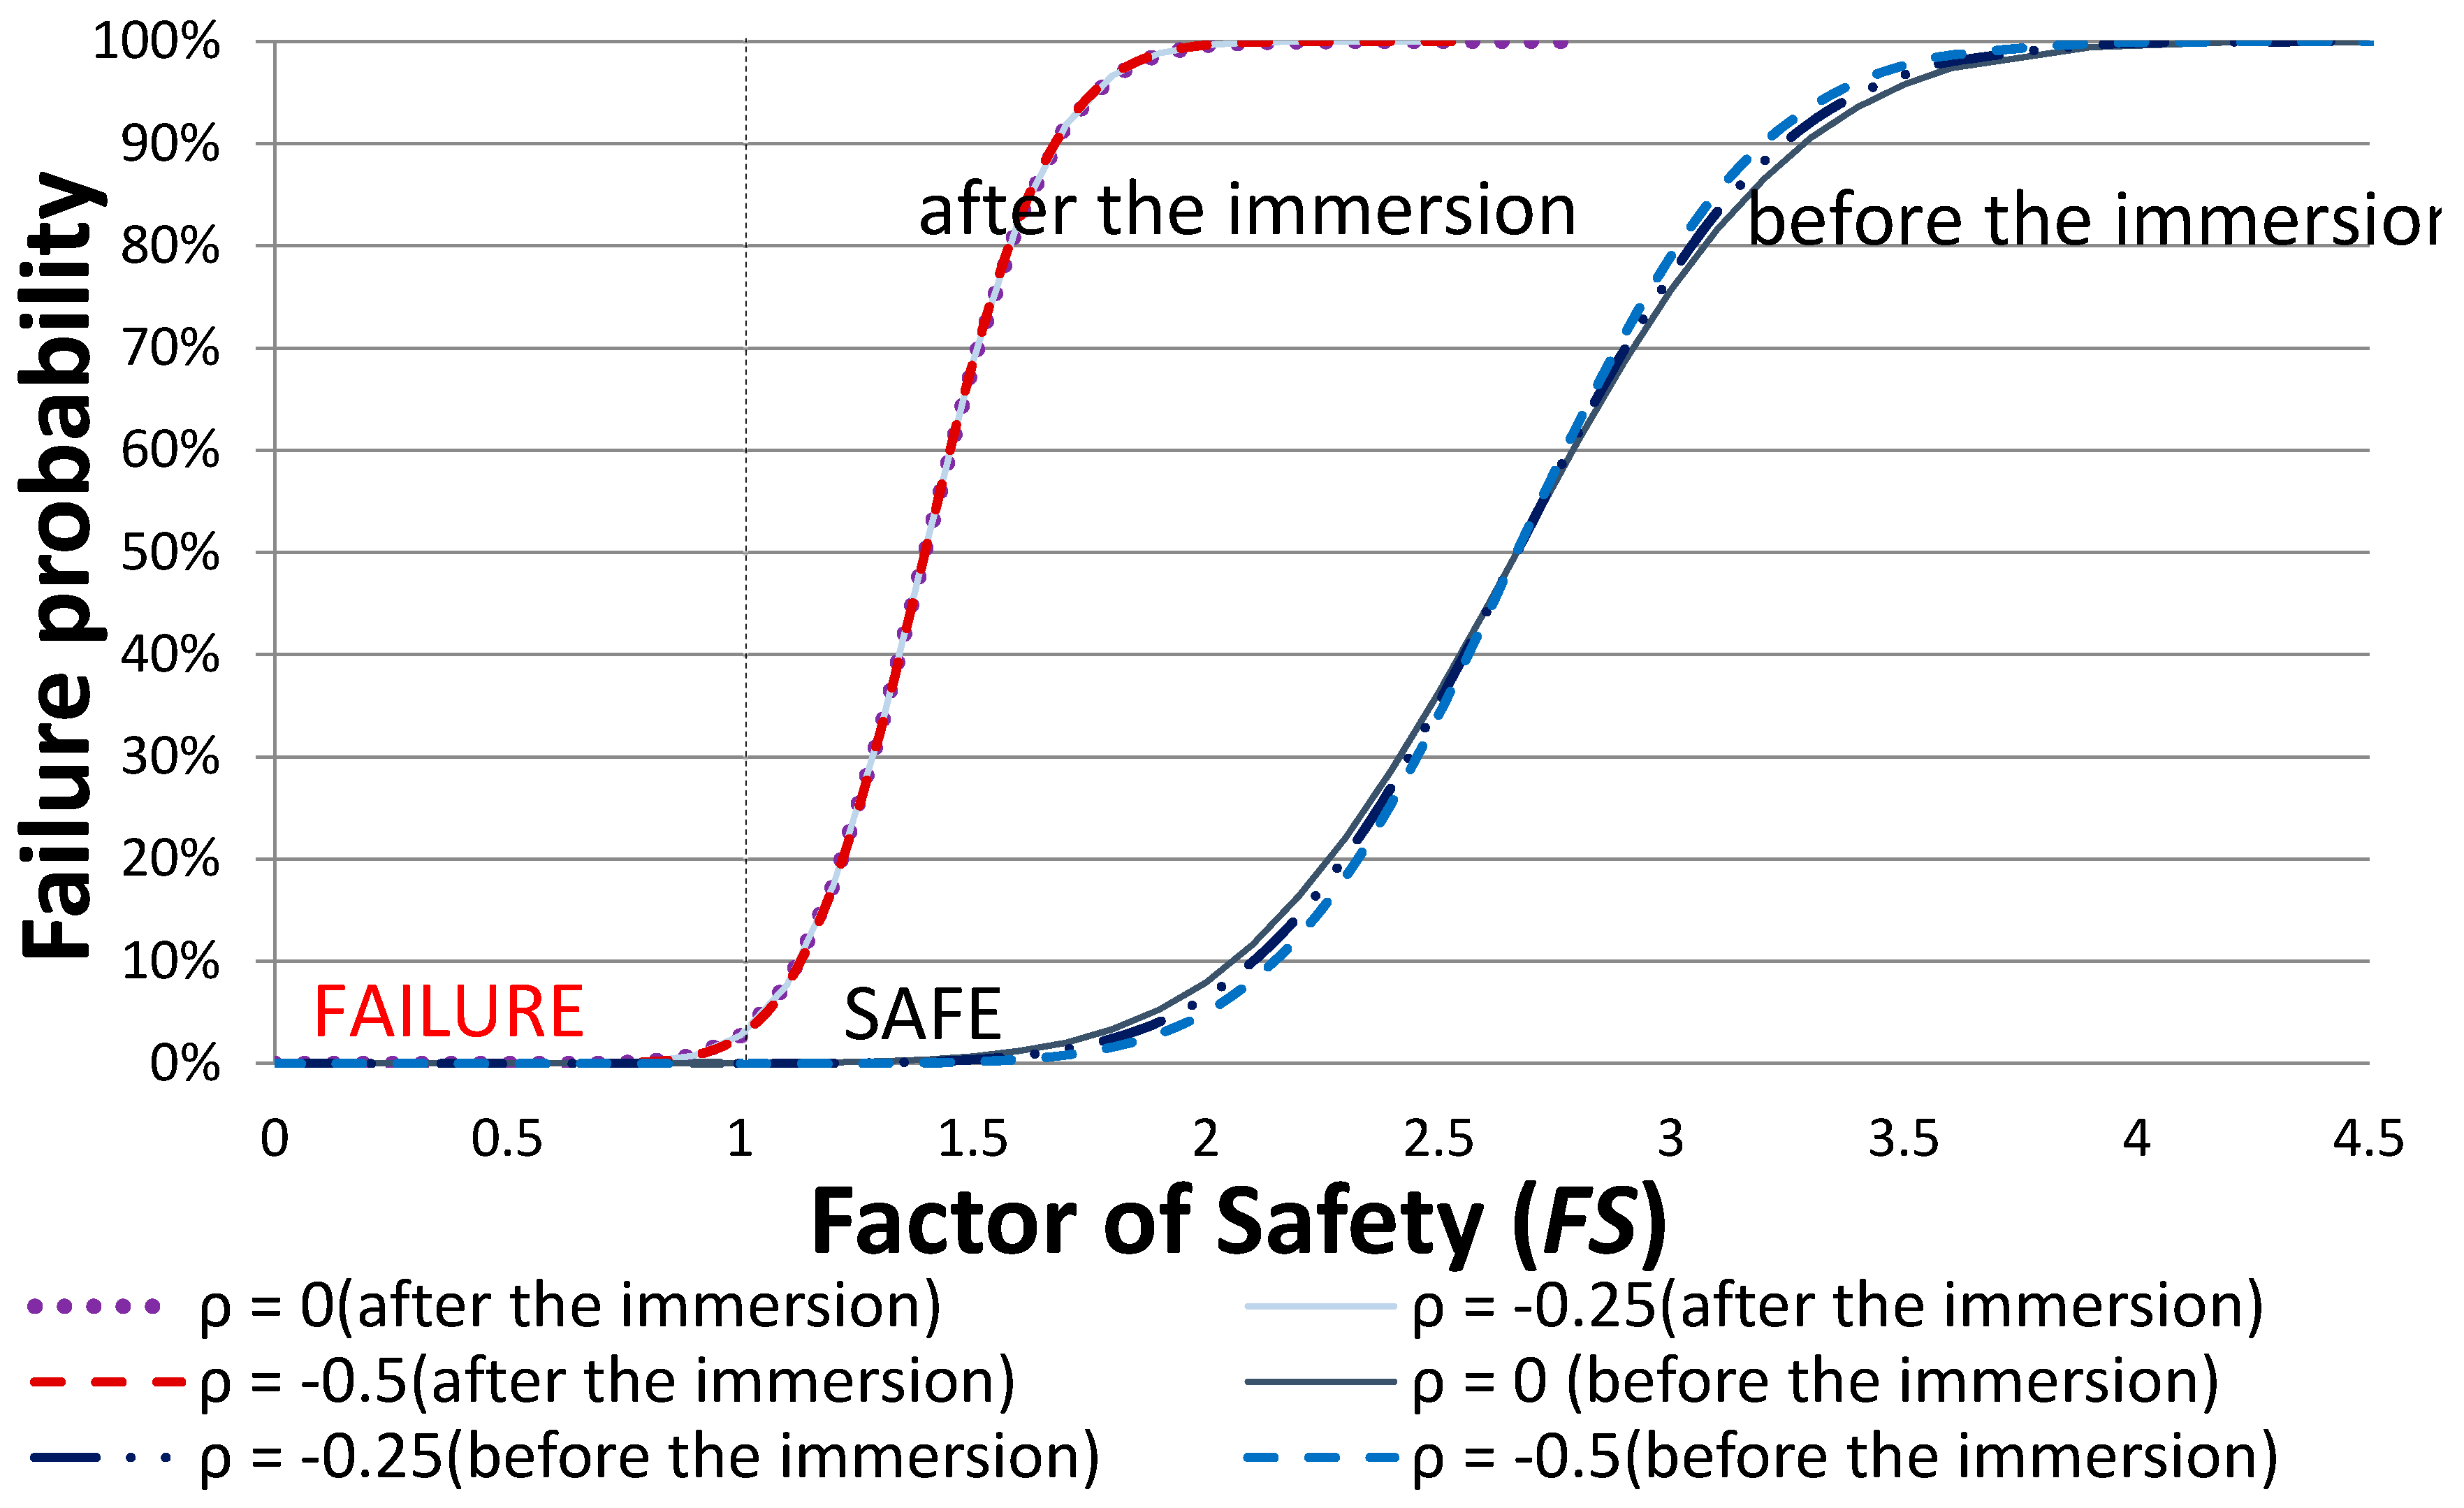
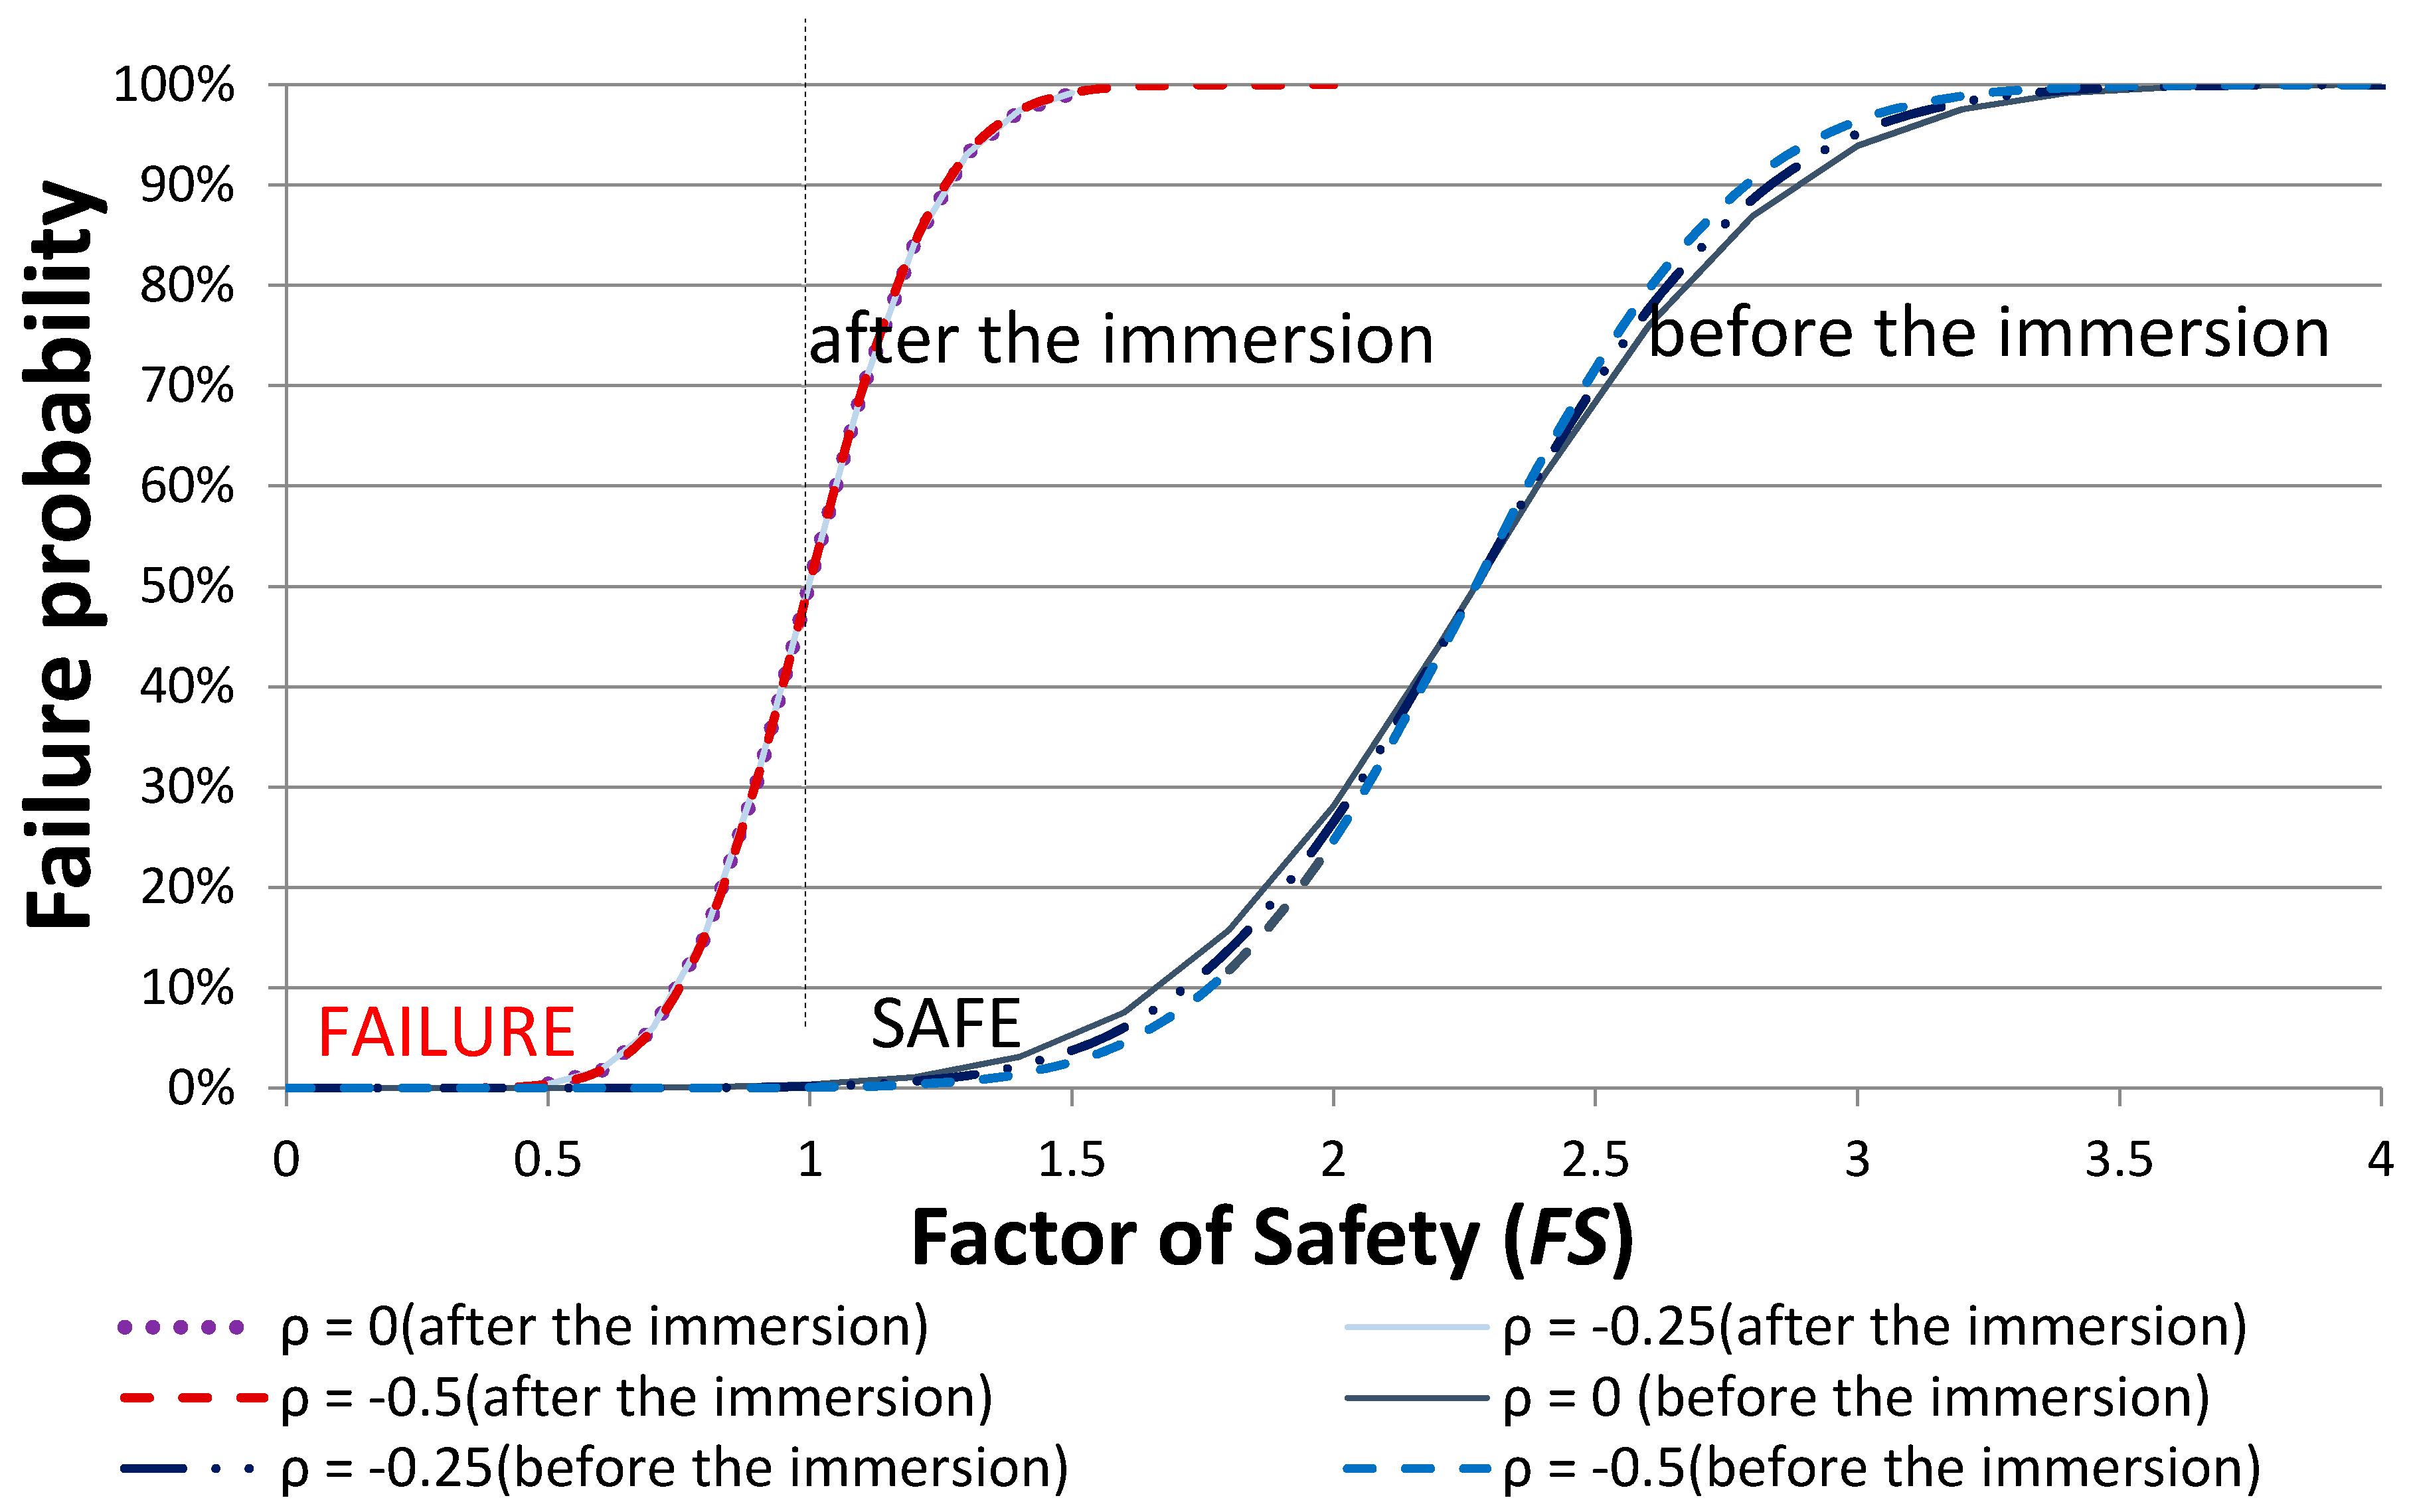
- Without considering the rock anchor reinforcement, the failure probability rate before water immersion FS ≅ 2.27 >> 1 and Pf = 0.34% (safe), even though FS ≅ 1 (immediate failure) was seen after water immersion. The slope was near the threshold of failure and the rate was as high as 50%. After rock anchor reinforcement, the FS was improved by 0.39 and the Pf was reduced to 3–4%, significantly improving the slope stability and reliability. However, the rock anchor has a useful life, and it requires frequent inspections and maintenance, once the loss of reinforcement function occurs, the slope system will be destroyed, for similar reasons as for the destruction in the study case. Our results showed that the slope stability assessment and FS calculations involve many variables. Probability analysis takes into account rock formation parameters and rock anchor variability, calculates the failure probability and therefore offers very significant benefits over traditional limit equilibrium methods in the analysis of highly variable soils.
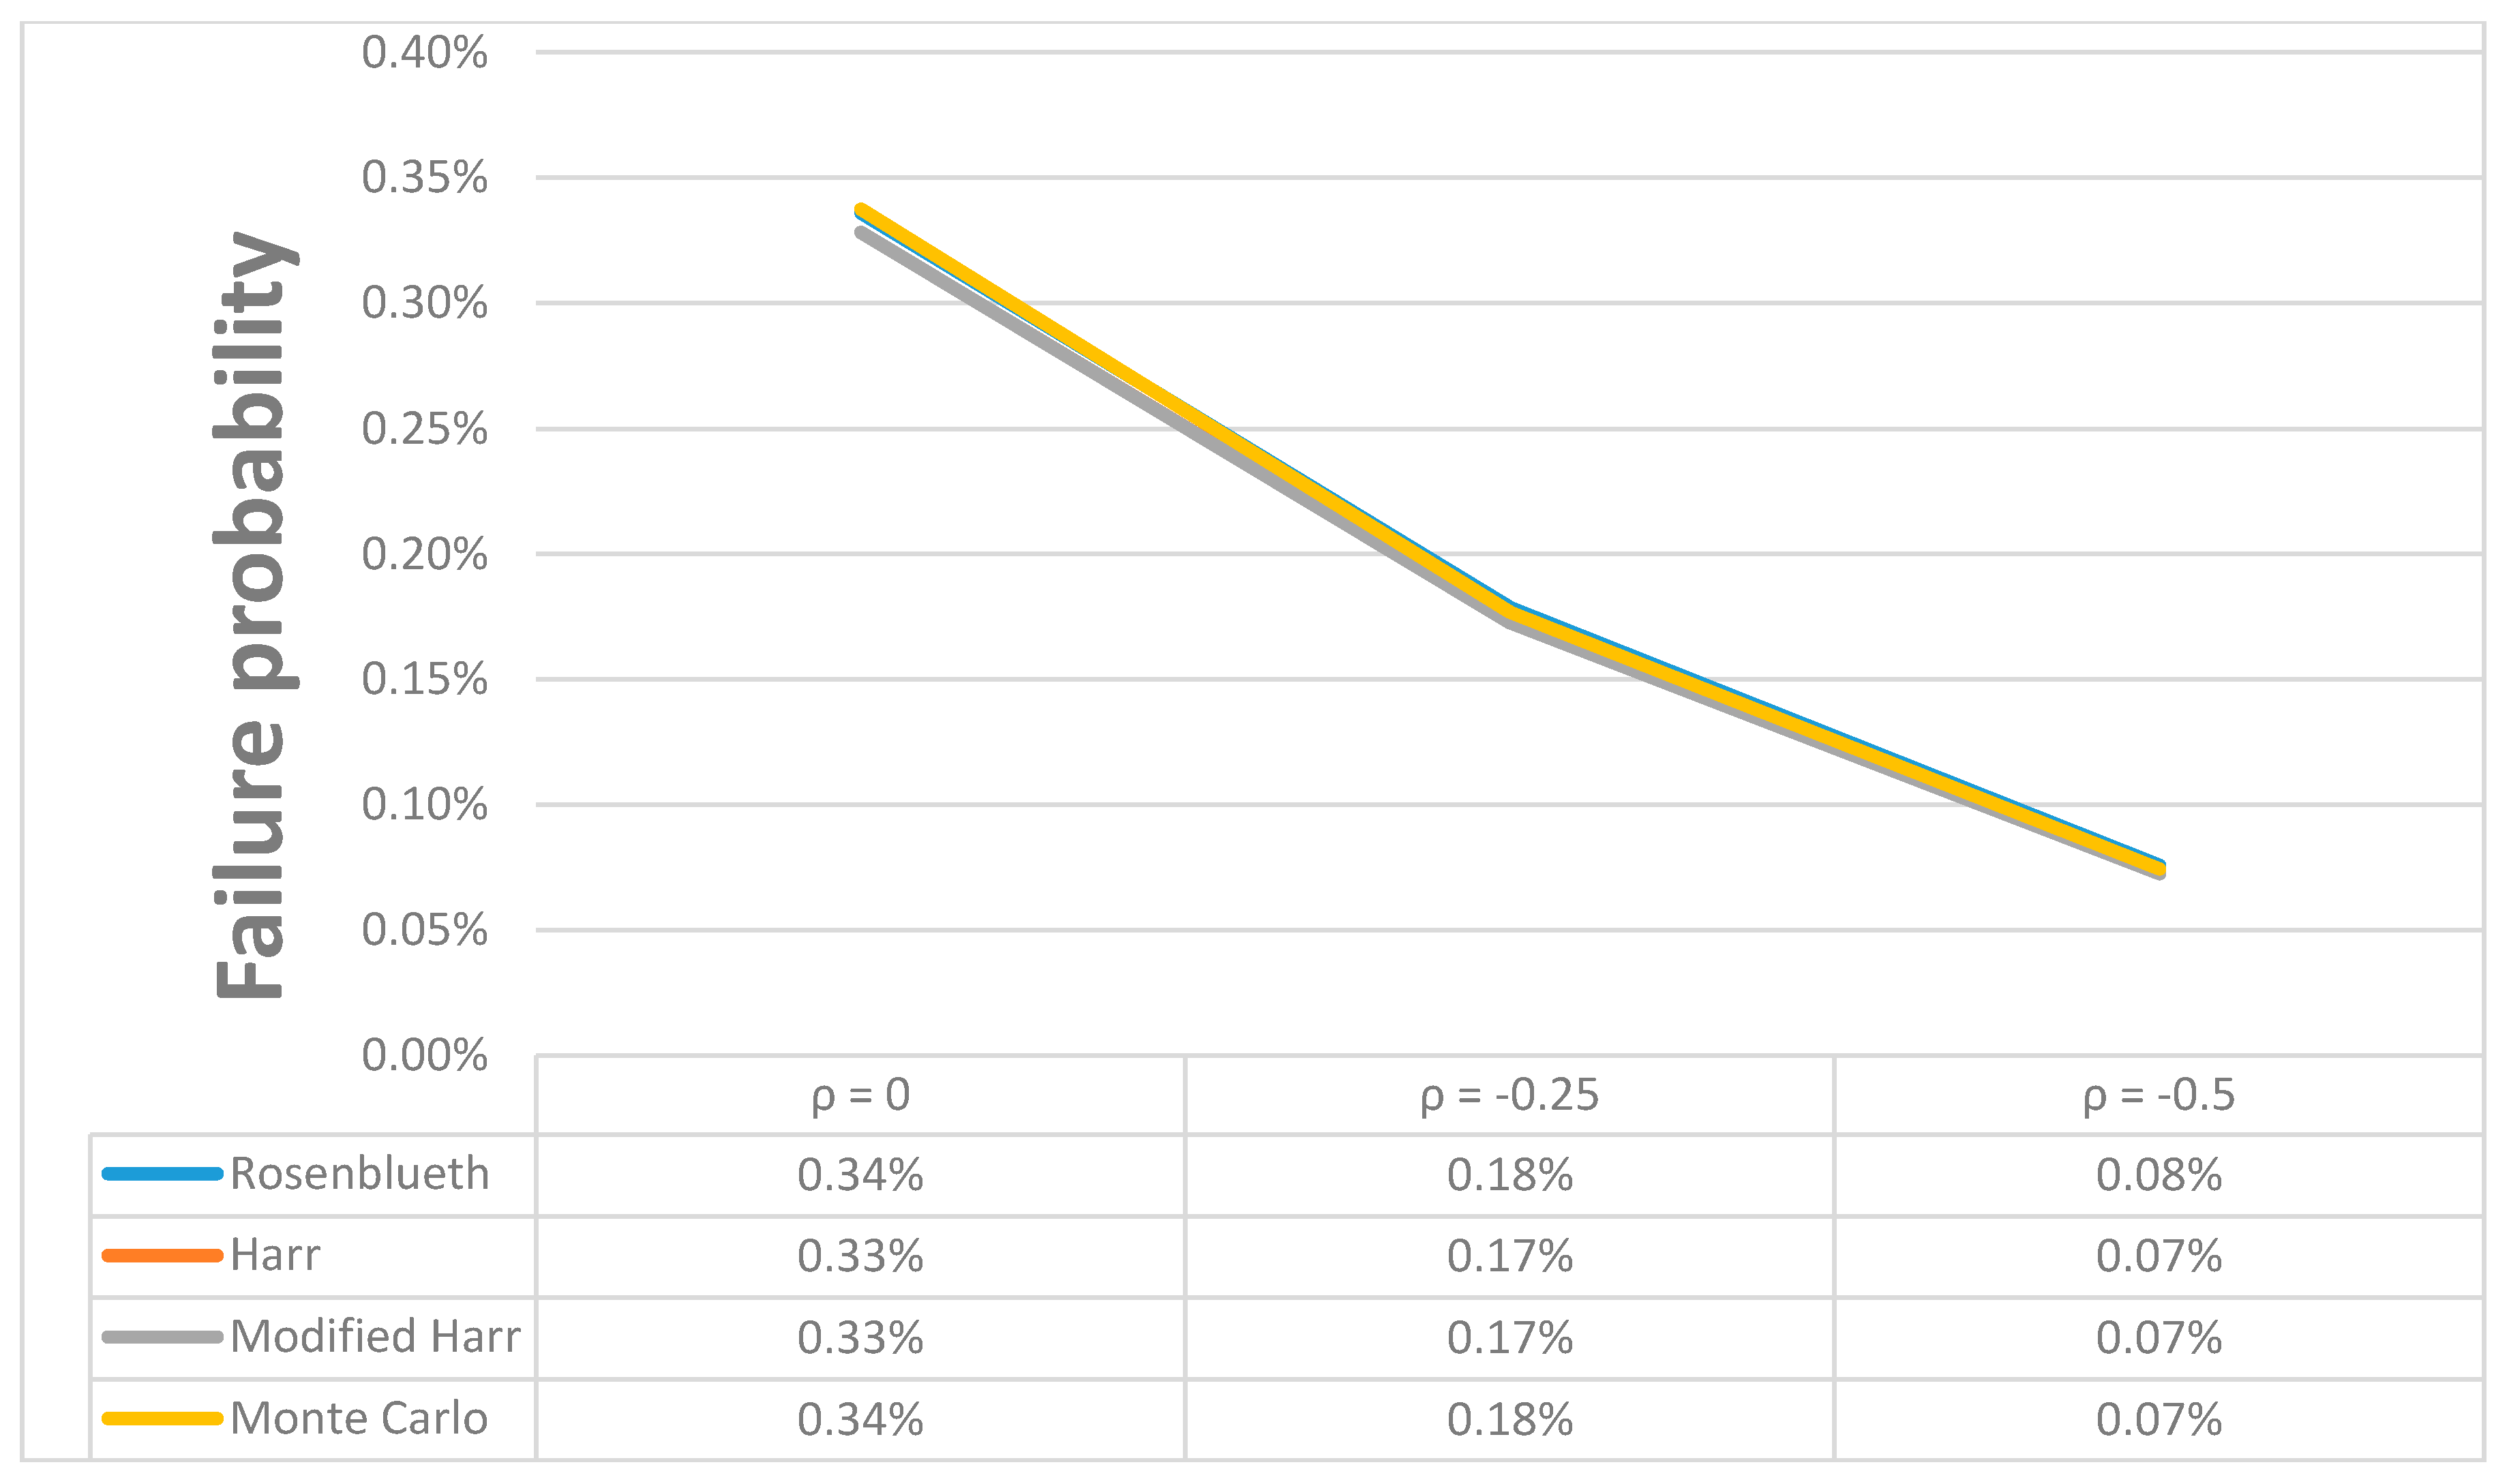
- The correlation coefficient of these parameters ρ (c, ϕ) would not affect the average value for the FS, but would affect that for the Pf. When the absolute value of ρ (c, ϕ) increased, the Pf decreased. However the results were almost the same, thus proving a simplification of the calculation.
- The three PEMs and MCS under the curve for both the normal and lognormal PDF distributions are almost the same. Therefore, they bring about the outcome that, in geotechnical applications, we can only use the normal distribution.
6. Conclusions
Author Contributions
Conflicts of Interest
References
- Wyllie, D.C.; Mah, C.W. Rock Slope Engineering, 4th ed.; Taylor & Francis: Abingdon, UK, 2007. [Google Scholar]
- Phoon, K.K. Towards Reliability-Based Design for Geotechnical Engineering. Available online: http://www.eng.nus.edu.sg/civil/people/cvepkk/Special_KGS_2004.pdf (accessed on 18 August 2017).
- Wu, X.Z. Probabilistic slope stability analysis by a copula-based sampling method. Comput. Geosci. 2013, 17, 739–755. [Google Scholar] [CrossRef]
- Alonso, E.E. Discussion: Risk analysis of slopes and its application to slopes in Canadian sensitive clays. Géotechnique 1977, 27, 254–258. [Google Scholar] [CrossRef]
- Canada Centre for Mineral and Energy Technology; Mining Research Laboratories. Pit Slope Manual; Minerals Research Program, Mining Research Laboratories: Ottawa, QC, Canada, 1978. [Google Scholar]
- Fredlund, D.G.; Krahn, J. Comparison of slope stability methods of analysis. Can. Geotech. J. 1977, 14, 429–439. [Google Scholar] [CrossRef]
- Low, B.K. Reliability analysis of rock wedges. J. Geotech. Geoenviron. Eng. 1997, 123, 498–505. [Google Scholar] [CrossRef]
- Matsuo, M.; Kuroda, K. Probabilistic approach to design of embankments. Soils Found. 1974, 14. [Google Scholar] [CrossRef]
- Wu, T.H.; Kraft, L.M. Safety analysis of slopes. J. Soil Mech. Found. Div. 1970, 96, 609–630. [Google Scholar]
- Yucemen, M.S.; Tang, W.H.; Ang, A.S. A Probabilistic Study of Safety and Design of Earth Slopes; University of Illinois at Urbana: Champaign, IL, USA, 1973; pp. 1–204. [Google Scholar]
- Schmidt, J.; Dikau, R. Modeling historical climate variability and slope stability. Geomorphology 2004, 60, 433–447. [Google Scholar] [CrossRef]
- Zhang, L.L.; Zuo, Z.B.; Ye, G.L.; Jeng, D.S.; Wang, J.H. Probabilistic parameter estimation and predictive uncertainty based on field measurements for unsaturated soil slope. Comput. Geotech. 2013, 48, 72–81. [Google Scholar] [CrossRef]
- Li, D.Q.; Xiao, T.; Cao, Z.J.; Zhou, C.B.; Zhang, L.M. Enhancement of random finite element method in reliability analysis and risk assessment of soil slopes using Subset Simulation. Landslides 2016, 13, 293–303. [Google Scholar] [CrossRef]
- Kaur, A.; Sharma, R.K. Slope stability analysis techniques: A review. Int. J. Eng. Appl. Sci. Technol. 2016, 1, 52–57. [Google Scholar]
- El-Ramly, H.; Morgenstern, N.R.; Cruden, D.M. Lodalen slide: A probabilistic assessment. Can. Geotech. J. 2006, 43, 956–968. [Google Scholar] [CrossRef]
- Babanouri, N. Investigating a potential reservoir landslide and suggesting its treatment using limit-equilibrium and numerical methods. J. Mt. Sci. 2017, 14, 432–441. [Google Scholar] [CrossRef]
- Iovine, G.G.; Greco, R.; Gariano, S.L.; Pellegrino, A.D.; Terranova, O.G. Shallow-landslide susceptibility in the Costa Viola with considerations on the role of causal factors. Nat. Hazards 2014, 73, 111–136. [Google Scholar] [CrossRef]
- Jaiswal, P.; van Westen, C.J.; Jetten, V. Quantitative landslide hazard assessment along a transportation corridor in southern India. Eng. Geol. 2010, 116, 236–250. [Google Scholar] [CrossRef]
- Wu, X.Z. Assessing the correlated performance functions of an engineering system via probabilistic analysis. Struct. Saf. 2015, 52, 10–19. [Google Scholar] [CrossRef]
- Malkawi, A.I.H.; Hassan, W.F.; Abdulla, F.A. Uncertainty and reliability analysis applied to slope stability. Struct. Saf. 2000, 22, 161–187. [Google Scholar] [CrossRef]
- Wu, X.Z. Implementing statistical fitting and reliability analysis for geotechnical engineering problems in R. Georisk 2016, 11, 173–188. [Google Scholar] [CrossRef]
- Xiao, Z.Q.; Huang, J.; Wang, Y.J.; Xu, C.Y.; Huan, X.I.A. Random reliability analysis of gravity retaining wall structural system. In Proceedings of the International Conference on Mechanics and Civil Engineering (ICMCE 2014), Wuhan, China, 13–14 December 2014; pp. 199–204. [Google Scholar]
- Ji, J.; Low, B.K. Stratified response surfaces for system probabilistic evaluation of slopes. J. Geotech. Geoenviron. Eng. 2012, 138, 1398–1406. [Google Scholar] [CrossRef]
- Li, L.; Chu, X. Multiple response surfaces for slope reliability analysis. Int. J. Numer. Anal. Meth. Geomech. 2015, 39, 175–192. [Google Scholar] [CrossRef]
- Cho, S.E. Probabilistic stability analyses of slopes using the ANN-based response surface. Comput. Geotech. 2009, 36, 787–797. [Google Scholar] [CrossRef]
- Wang, Y.; Cao, Z.; Au, S.K. Practical reliability analysis of slope stability by advanced Monte Carlo simulations in a spreadsheet. Can. Geotech. J. 2011, 48, 162–172. [Google Scholar] [CrossRef]
- Santoso, A.M.; Phoon, K.K.; Quek, S.T. Effects of soil spatial variability on rainfall-induced landslides. Comput. Struct. 2011, 89, 893–900. [Google Scholar] [CrossRef]
- Eldred, M.S. Recent advances in non-intrusive polynomial chaos and stochastic collocation methods for uncertainty analysis and design. In Proceedings of the 50th AIAA/ASME/ASCE/AHS/ASC Structures, Structural Dynamics, and Materials Conference, Palm Springs, CA, USA, 4–7 May 2009. [Google Scholar]
- Xiu, D. Efficient collocational approach for parametric uncertainty analysis. Commun. Comput. Phys. 2006, 2, 293–309. [Google Scholar]
- Upadhyay, R.R.; Ezekoye, O.A. Treatment of design fire uncertainty using quadrature method of moments. Fire Saf. J. 2008, 43, 127–139. [Google Scholar] [CrossRef]
- Marchisio, D.L.; Vigil, R.D.; Fox, R.O. Implementation of the quadrature method of moments in CFD codes for aggregation—breakage problems. Chem. Eng. Sci. 2003, 58, 3337–3351. [Google Scholar] [CrossRef]
- Tobutt, D.C. Monte carlo simulation methods for slope stability. Comput. Geosci. 1982, 8, 199–208. [Google Scholar] [CrossRef]
- Li, D.; Zhou, C.; Lu, W.; Jiang, Q. A system reliability approach for evaluating stability of rock wedges with correlated failure modes. Comput. Geotech. 2009, 36, 1298–1307. [Google Scholar] [CrossRef]
- Mbarka, S.; Baroth, J.; Ltifi, M.; Hassis, H.; Darve, F. Reliability analyses of slope stability: Homogeneous slope with circular failure. Eur. J. Environ. Civ. Eng. 2010, 14, 1227–1257. [Google Scholar] [CrossRef]
- Huang, J.; Griffiths, D.V.; Fenton, G.A. System reliability of slopes by RFEM. Soils Found. 2010, 50, 343–353. [Google Scholar] [CrossRef]
- Xin, C.; Chongshi, G. Risk analysis of gravity dam instability using credibility theory Monte Carlo simulation model. SpringerPlus 2016, 5. [Google Scholar] [CrossRef] [PubMed]
- Harr, M.E. Probabilistic estimates for multivariate analyses. Appl. Math. Model. 1989, 13, 313–318. [Google Scholar] [CrossRef]
- Abbaszadeh, M.; Shahriar, K.; Sharifzadeh, M.; Heydari, M. Uncertainty and reliability analysis applied to slope stability: A case study from sungun copper mine. Geotech. Geol. Eng. 2011, 29, 581–596. [Google Scholar] [CrossRef]
- Wang, J.P.; Huang, D. RosenPoint: A Microsoft Excel-based program for the Rosenblueth point estimate method and an application in slope stability analysis. Comput. Geosci. 2012, 48, 239–243. [Google Scholar] [CrossRef]
- Ahmadabadi, M.; Poisel, R. Probabilistic analysis of rock slopes involving correlated non-normal variables using point estimate methods. Rock Mech. Rock Eng. 2016, 49, 909–925. [Google Scholar] [CrossRef]
- Christian, J.T.; Baecher, G.B. The point-estimate method with large numbers of variables. Int. J. Numer. Anal. Methods Geomech. 2002, 26, 1515–1529. [Google Scholar] [CrossRef]
- Chen, S.L.; Cheng, C.P.; Gui, M.W. Sensitivity and uncertainty analyses of the translational slide at the Cidu section, 3.1 k of the Taiwan Formosan freeway. In Proceedings of the Fourth Geo-China International Conference, Shandong, China, 25–27 July 2016; pp. 81–89. [Google Scholar]
- Ministry of Transportation and Communications R.O.C. Summary Report of Investigation of Reasons for Taiwan Freeway 3 (Formosan Freeway Cidu Section) 3.1k Landslide. Available online: https://drive.google.com/file/d/0B5-uoBhbSoMOT00wVHEydjBXV0E/view (accessed on 18 August 2017). (In Chinese).
- Hoek, E.; Bray, J. Rock Slope Engineering, 3rd ed.; Institution of Mining and Metallurgy: London, UK, 1981. [Google Scholar]
- Chang, C.-H.; Tung, Y.-K.; Yang, J.-C. Evaluation of probability point estimate methods. Appl. Math. Model. 1995, 19, 95–105. [Google Scholar]
- Rosenblueth, E. Point estimates for probability moments. Proc. Natl. Acad. Sci. USA. 1975, 72, 3812–3814. [Google Scholar] [CrossRef] [PubMed]
- Quek, S.T.; Leung, C.F. Reliability-based stability analysis of rock excavations. Int. J. Rock Mech. Min. Sci. Geomech. Abstr. 1995, 32, 617–620. [Google Scholar] [CrossRef]
- Baecher, G.B.; Christian, J.T. Reliability and Statistics in Geotechnical Engineering; Wiley: Chichester, UK, 2003; Volume 1. [Google Scholar]
- Wang, W.; Li, C.Q.; Wang, S. Slope instability risk analysis in earth dams considering uncertain factors. Appl. Mech. Mater. 2011, 117–119, 1475–1478. [Google Scholar] [CrossRef]
- Li, H.Z.; Low, B.K. Reliability analysis of circular tunnel under hydrostatic stress field. Comput. Geotech. 2010, 37, 50–58. [Google Scholar] [CrossRef]


| No. | Hole No. | Depth (m) | Peak Strength | Residual Strength | ||
|---|---|---|---|---|---|---|
| Cp (kg/cm2) | ϕp (°) | Cr (kg/cm2) | ϕr (°) | |||
| RDS(D)-1 | B-1 | 3.00–4.00 | 2.5 | 28.0 | 0.0 | 25.0 |
| RDS(D)-2 | B-2 | 4.00–5.00 | 2.6 | 30.1 | 0.0 | 28.0 |
| RDS(D)-3 | B-4 | 2.60–3.60 | 1.5 | 26.7 | 0.0 | 22.0 |
| RDS(D)-4 | B-6 | 16.60–17.00 | 0.28 | 22.5 | 0.0 | 19.8 |
| RDS(D)-5 | B-7 | 18.00–19.00 | 3.2 | 28.5 | 0.0 | 22.7 |
| RDS(D)-6 | B-8 | 16.00–17.00 | 0.7 | 36.5 | 0.0 | 29.0 |
| RDS(W)-1 | B-1 | 0.00–1.00 | 2.1 | 29.0 | 0.0 | 17.2 |
| RDS(W)-2 | B-2 | 3.40–3.80 | 0.5 | 46.0 | 0.0 | 22.0 |
| RDS(W)-3 | B-3 | 16.60–17.00 | 0.9 | 27.7 | 0.0 | 23.2 |
| RDS(W)-4 | B-5 | 16.60–17.00 | 1.1 | 26.2 | 0.0 | 14.1 |
| RDS(W)-5 | B-9 | 38.00–39.00 | 0.5 | 34.6 | 0.0 | 21.0 |
| RDS(W)-6 | B-10 | 10.25–11.00 | 1.4 | 37.0 | 0.0 | 24.6 |
| RDS(W)-7 | B-6 | 22.40–22.50 | - | - | 0.0 | 21.5 |
| RDS(W)-8 | B-6 | 17.30–17.40 | - | - | 0.0 | 20.0 |
| Layer | Depth (m) | γt (kN/m3) | γsat (kN/m3) | c (kPa) | ϕ (°) | |
|---|---|---|---|---|---|---|
| 1 | sandstone (SS) | 5–20 | 21 | 21 | 30 | 32 |
| 2 | sandstone and shale (SS/SH) | 2 | 21 | 21 | 10 | 20 |
| 3 | shale (SH) | 21 | 21 | 30 | 28 |
| Parameter | Value | Reference |
|---|---|---|
| ρ (c, ϕ) | −0.2 | Leung & Quek (1995) [47]. |
| −0.3 | Baecher & Christian (2003), W. Wang, C. Q. Li, and S. Wang (2011) [48,49]. | |
| −0.5 | Low (1997), Li, Zhou, Lu, & Jiang (2009), H.-Z. Li & Low (2010) [7,33,50]. |
| No. | Parameter | c (kPa) | ϕ (°) | T (kN) |
|---|---|---|---|---|
| 1 | 1 | 59 | 30 | 600 |
| 2 | 10 | 30 | 600 | |
| 2 | 1 | 59 | 25 | 600 |
| 2 | 10 | 25 | 600 | |
| 3 | 1 | 59 | 20 | 600 |
| 2 | 10 | 20 | 600 | |
| 4 | 1 | 59 | 15 | 600 |
| 2 | 10 | 15 | 600 | |
| 5 | 1 | 59 | 10 | 600 |
| 2 | 10 | 10 | 600 |
| Fix Parameters | Value |
|---|---|
| Height of slope, H (M) | 25 |
| Angle of slip surface, θ (°) | 15 |
| Angle of dip, β (°) | 20 |
| Number of anchors/layer | 3 |
| Inclined angle of anchor, δ (°) | 20 |
| Horizontal spacing of anchor, S (m) | 2.6 |
| Parameter | Mean | STD. DEV. | Distribution | Remarks |
|---|---|---|---|---|
| γ (kN/m3) | 22.9 | 0.11 | (1) Normal distribution (2) Log-normal distribution | |
| Cp (kN/m2) | 2.8–32 | Uniform distribution | Prior to immersion (peak strength) | |
| Cr (kN/m2) | 0 | Constant | After immersion (residual strength) | |
| ϕp (°) | 26.1 | 2.23 | (1) Normal distribution (2) Log-normal distribution | Prior to immersion (peak strength) |
| ϕr (°) | 19.95 | 3.62 | (1) Normal distribution (2) Log-normal distribution | After immersion (residual strength) |
| T (kN) | 767 | 153 | (1) Normal distribution (2) Log-normal distribution |
| (a) Normal Distribution | ||||||||
| Method | ρ = 0 | ρ = −0.25 | ρ = −0.5 | |||||
| Before Immersion | After Immersion | Before Immersion | After Immersion | Before Immersion | After Immersion | |||
| RPEM | MEAN | ✕ | 2.2720 | 1.0018 | 2.2720 | 1.0018 | 2.2720 | 1.0018 |
| ☑ | 2.6703 | 1.4000 | 2.6703 | 1.4000 | 2.6703 | 1.4000 | ||
| STD. DEV. | ✕ | 0.4693 | 0.1968 | 0.4366 | 0.1968 | 0.4011 | 0.1968 | |
| ☑ | 0.4782 | 0.2131 | 0.4461 | 0.2131 | 0.4115 | 0.2131 | ||
| HPEM | MEAN | ✕ | 2.2721 | 1.0018 | 2.2721 | 1.0018 | 2.2721 | 1.0018 |
| ☑ | 2.6703 | 1.4000 | 2.6703 | 1.4000 | 2.6703 | 1.4000 | ||
| STD. DEV. | ✕ | 0.4680 | 0.1977 | 0.4351 | 0.1970 | 0.3996 | 0.1970 | |
| ☑ | 0.4769 | 0.2142 | 0.4446 | 0.2134 | 0.4099 | 0.2134 | ||
| MPEM | MEAN | ✕ | 2.2721 | 1.0018 | 2.2721 | 1.0018 | 2.2721 | 1.0018 |
| ☑ | 2.6703 | 1.4000 | 2.6703 | 1.4000 | 2.6703 | 1.4000 | ||
| STD. DEV. | ✕ | 0.4680 | 0.1977 | 0.4350 | 0.1970 | 0.3995 | 0.1971 | |
| ☑ | 0.4769 | 0.2142 | 0.4446 | 0.2134 | 0.4098 | 0.2136 | ||
| MCS | MEAN | ✕ | 2.2721 | 1.0021 | 2.2723 | 1.0016 | 2.2723 | 1.0015 |
| ☑ | 2.6699 | 1.3919 | 2.6700 | 1.3918 | 2.6702 | 1.3918 | ||
| STD. DEV. | ✕ | 0.4696 | 0.1977 | 0.4362 | 0.1982 | 0.4005 | 0.1981 | |
| ☑ | 0.4788 | 0.2261 | 0.4460 | 0.2260 | 0.4115 | 0.2261 | ||
| (b) Log-Normal Distribution | ||||||||
| Method | ρ = 0 | ρ = −0.25 | ρ = −0.5 | |||||
| Before Immersion | After Immersion | Before Immersion | After Immersion | Before Immersion | After Immersion | |||
| RPEM | MEAN | ✕ | 2.2721 | 1.0020 | 2.2721 | 1.0020 | 2.2721 | 1.0020 |
| ☑ | 2.6703 | 1.4002 | 2.6703 | 1.4002 | 2.6703 | 1.4002 | ||
| STD. DEV. | ✕ | 0.4695 | 0.1994 | 0.4368 | 0.1994 | 0.4014 | 0.1994 | |
| ☑ | 0.4783 | 0.2155 | 0.4477 | 0.2155 | 0.4147 | 0.2155 | ||
| HPEM | MEAN | ✕ | 2.2721 | 1.0018 | 2.2721 | 1.0018 | 2.2721 | 1.0018 |
| ☑ | 2.6703 | 1.4000 | 2.6703 | 1.4000 | 2.6703 | 1.4000 | ||
| STD. DEV. | ✕ | 0.4680 | 0.1977 | 0.4351 | 0.1970 | 0.3996 | 0.1970 | |
| ☑ | 0.4769 | 0.2142 | 0.4446 | 0.2134 | 0.4099 | 0.2134 | ||
| MPEM | MEAN | ✕ | 2.2721 | 1.0020 | 2.2721 | 1.0019 | 2.2721 | 1.0019 |
| ☑ | 2.6703 | 1.4003 | 2.6703 | 1.4001 | 2.6703 | 1.4002 | ||
| STD. DEV. | ✕ | 0.4681 | 0.1994 | 0.4349 | 0.1974 | 0.3993 | 0.1984 | |
| ☑ | 0.4770 | 0.2169 | 0.4444 | 0.2143 | 0.4094 | 0.2156 | ||
| MCS | MEAN | ✕ | 2.2721 | 1.0015 | 2.2723 | 1.0012 | 2.2723 | 1.0011 |
| ☑ | 2.6698 | 1.3785 | 2.6700 | 1.3788 | 2.6702 | 1.3787 | ||
| STD. DEV. | ✕ | 0.4698 | 0.2005 | 0.4362 | 0.2008 | 0.4005 | 0.2006 | |
| ☑ | 0.4789 | 0.2456 | 0.4459 | 0.2450 | 0.4114 | 0.2455 | ||
| Method | Distribution | ρ = 0 | ρ = −0.25 | ρ = −0.5 | ||||
|---|---|---|---|---|---|---|---|---|
| Before Immersion | After Immersion | Before Immersion | After Immersion | Before Immersion | After Immersion | |||
| RPEM | Normal | ✕ | 0.34% | 49.64% | 0.18% | 49.64% | 0.08% | 49.64% |
| ☑ | 0.02% | 3.03% | 0.01% | 3.03% | 0.00% | 3.03% | ||
| Log-normal | ✕ | 0.34% | 49.60% | 0.18% | 49.60% | 0.08% | 49.60% | |
| ☑ | 0.02% | 3.17% | 0.01% | 3.17% | 0.00% | 3.17% | ||
| HPEM | Normal | ✕ | 0.33% | 49.64% | 0.17% | 49.64% | 0.07% | 49.64% |
| ☑ | 0.02% | 3.09% | 0.01% | 3.04% | 0.00% | 3.04% | ||
| Log-normal | ✕ | 0.33% | 49.64% | 0.17% | 49.64% | 0.07% | 49.64% | |
| ☑ | 0.02% | 3.09% | 0.01% | 3.04% | 0.00% | 3.04% | ||
| MPEM | Normal | ✕ | 0.33% | 49.64% | 0.17% | 49.64% | 0.07% | 49.64% |
| ☑ | 0.02% | 3.09% | 0.01% | 3.04% | 0.00% | 3.06% | ||
| Log-normal | ✕ | 0.33% | 49.60% | 0.17% | 49.62% | 0.07% | 49.62% | |
| ☑ | 0.02% | 3.25% | 0.01% | 3.10% | 0.00% | 3.17% | ||
| MCS | Normal | ✕ | 0.34% | 49.58% | 0.18% | 49.68% | 0.07% | 49.70% |
| ☑ | 0.02% | 4.15% | 0.01% | 4.15% | 0.00% | 4.16% | ||
| Log-normal | ✕ | 0.34% | 49.70% | 0.18% | 49.76% | 0.07% | 49.78% | |
| ☑ | 0.02% | 6.16% | 0.01% | 6.10% | 0.00% | 6.15% | ||
© 2017 by the authors. Licensee MDPI, Basel, Switzerland. This article is an open access article distributed under the terms and conditions of the Creative Commons Attribution (CC BY) license (http://creativecommons.org/licenses/by/4.0/).
Share and Cite
Chen, S.-L.; Cheng, C.-P. Influence of Failure Probability Due to Parameter and Anchor Variance of a Freeway Dip Slope Slide—A Case Study in Taiwan †. Entropy 2017, 19, 431. https://doi.org/10.3390/e19080431
Chen S-L, Cheng C-P. Influence of Failure Probability Due to Parameter and Anchor Variance of a Freeway Dip Slope Slide—A Case Study in Taiwan †. Entropy. 2017; 19(8):431. https://doi.org/10.3390/e19080431
Chicago/Turabian StyleChen, Shong-Loong, and Chia-Pang Cheng. 2017. "Influence of Failure Probability Due to Parameter and Anchor Variance of a Freeway Dip Slope Slide—A Case Study in Taiwan †" Entropy 19, no. 8: 431. https://doi.org/10.3390/e19080431
APA StyleChen, S.-L., & Cheng, C.-P. (2017). Influence of Failure Probability Due to Parameter and Anchor Variance of a Freeway Dip Slope Slide—A Case Study in Taiwan †. Entropy, 19(8), 431. https://doi.org/10.3390/e19080431