Pretreatment and Wavelength Selection Method for Near-Infrared Spectra Signal Based on Improved CEEMDAN Energy Entropy and Permutation Entropy

Abstract
:1. Introduction
2. Related Theory
2.1. EMD Method
- (1)
- Find all the maxima and minima for the signal, .
- (2)
- Obtain the upper envelope composed of all the maxima and the lower envelope composed of all the minima using the cubic spline interpolation, and define them as and respectively.
- (3)
- The mean of upper and lower envelope is .
- (4)
- The difference between original signal and mean of envelope is .
- (5)
- If meet the nature of IMF, then the is . Otherwise, repeat steps (1)–(4) until is obtained. The IMF needs to meet two natures, one is that the number of extreme value points and passing zero points is equal or differs at most by one point, another one is that the mean of upper and lower envelope at any point is zero.
- (6)
- The , as a new signal to be analyzed, repeat the steps (1)–(5) to obtain the second IMF and the .
- (7)
- Repeat the above steps and the decomposition ends when the residue is a monotonic function.
2.2. Improved CEEMDAN Method
- (1)
- Decompose signal to obtain the first residue and first mode using the EMD algorithm.where is the original signal, is the standard deviation of the added white Gaussian noise, and is the operator that produces the k-th mode obtained by EMD algorithm (k = 1,2,…,N, N is the total ensemble number).
- (2)
- When , the k-th residue is
- (3)
- The k-th mode is
2.3. Energy Entropy of IMF
2.4. Permutation Entropy
3. Reconstruction Methods
3.1. Selection of Relevant Mode
- (1)
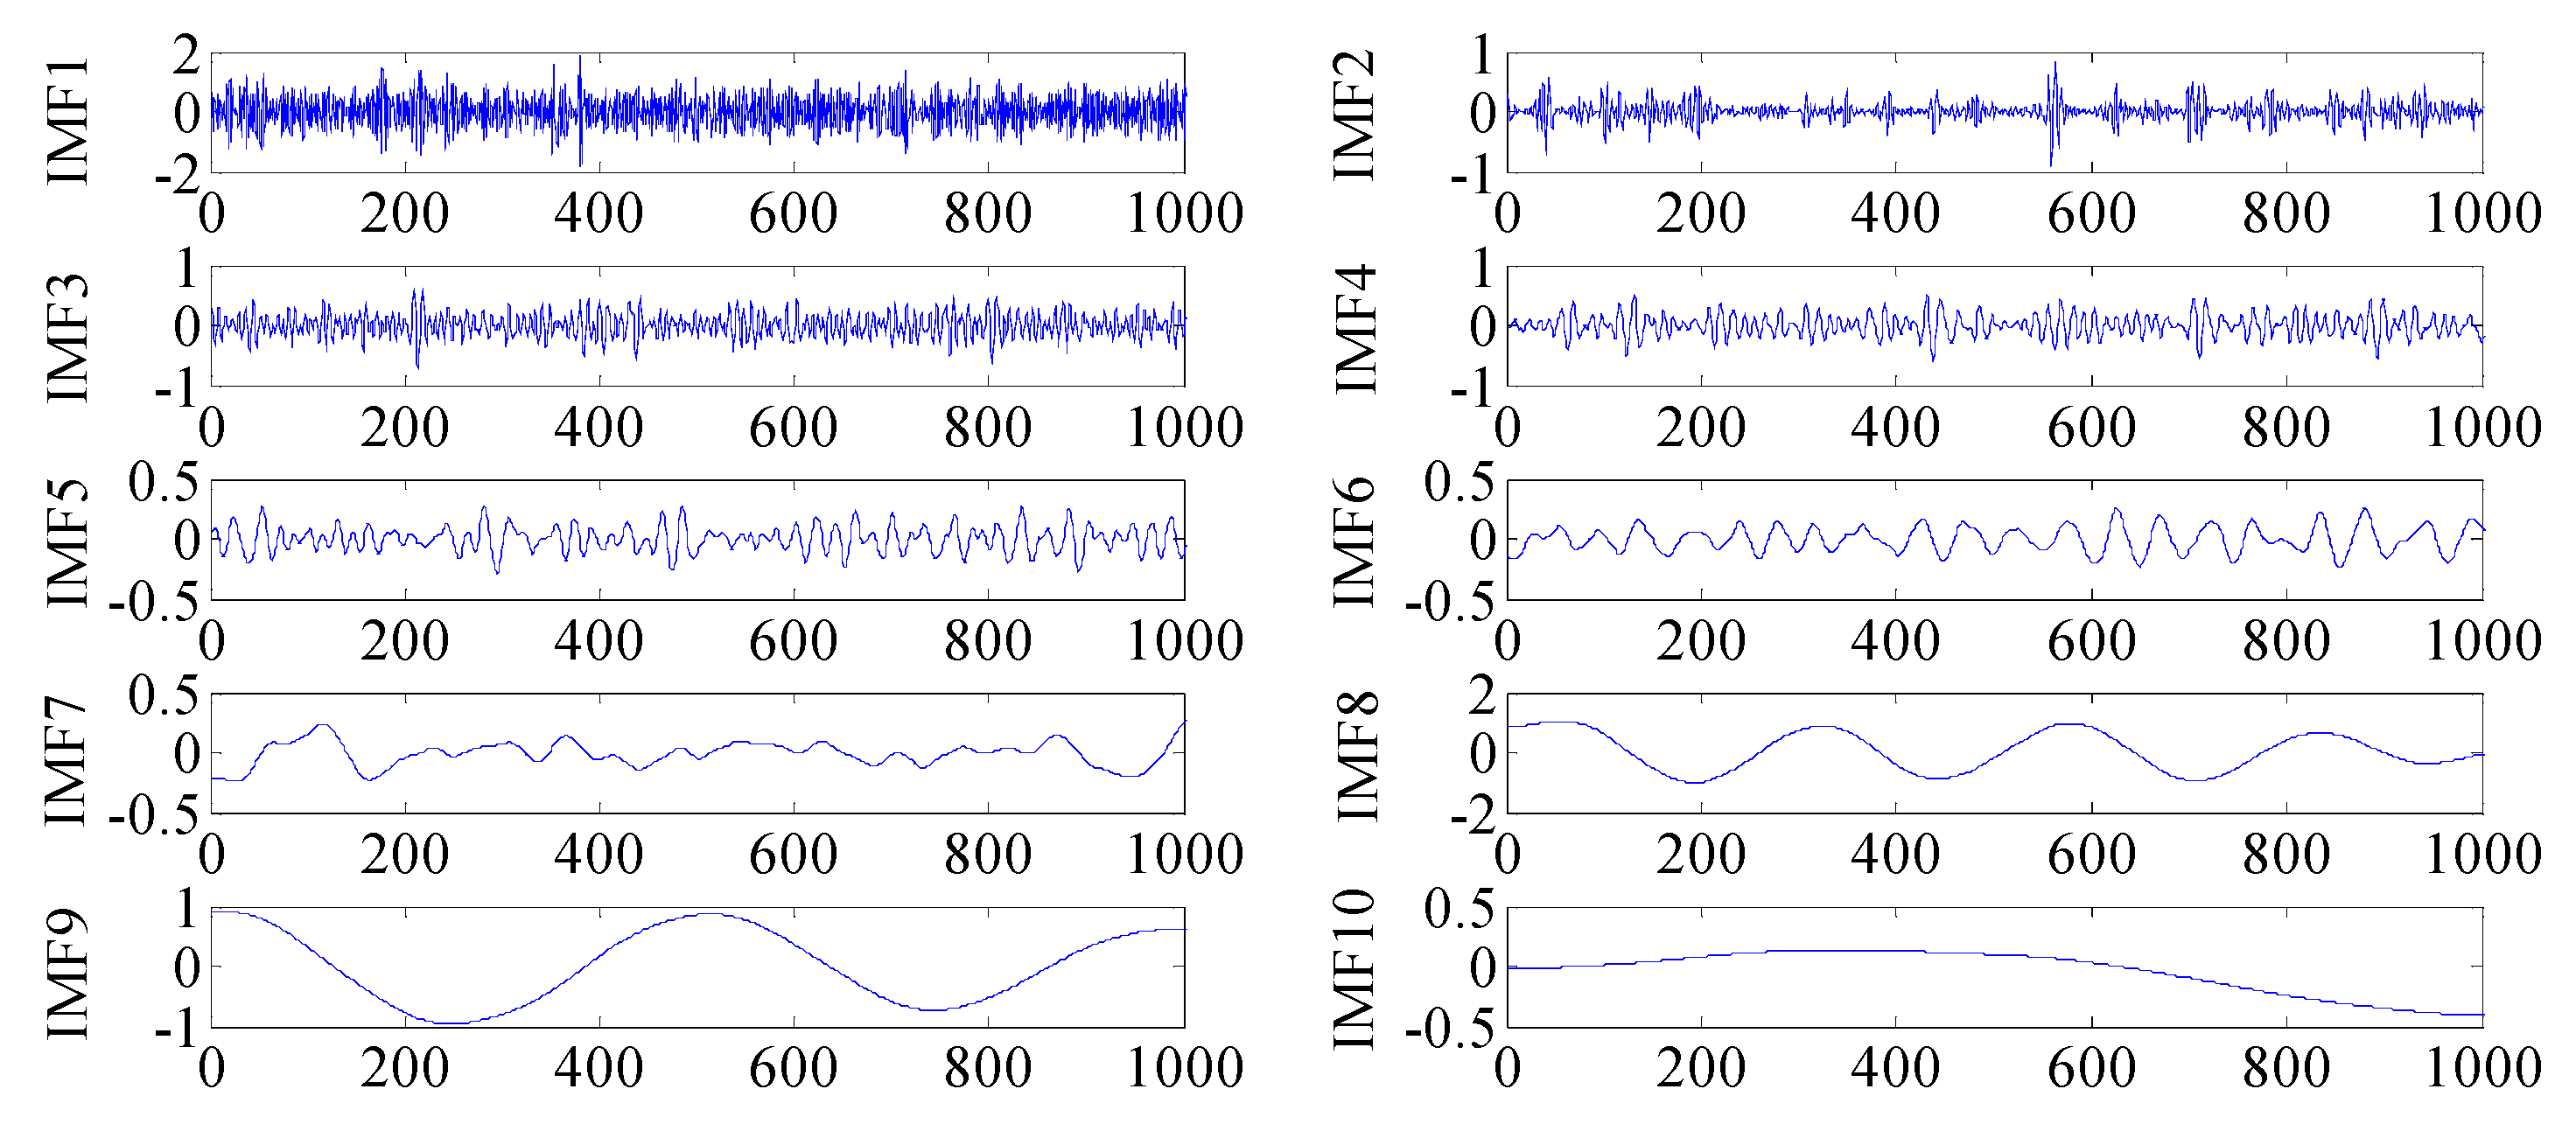
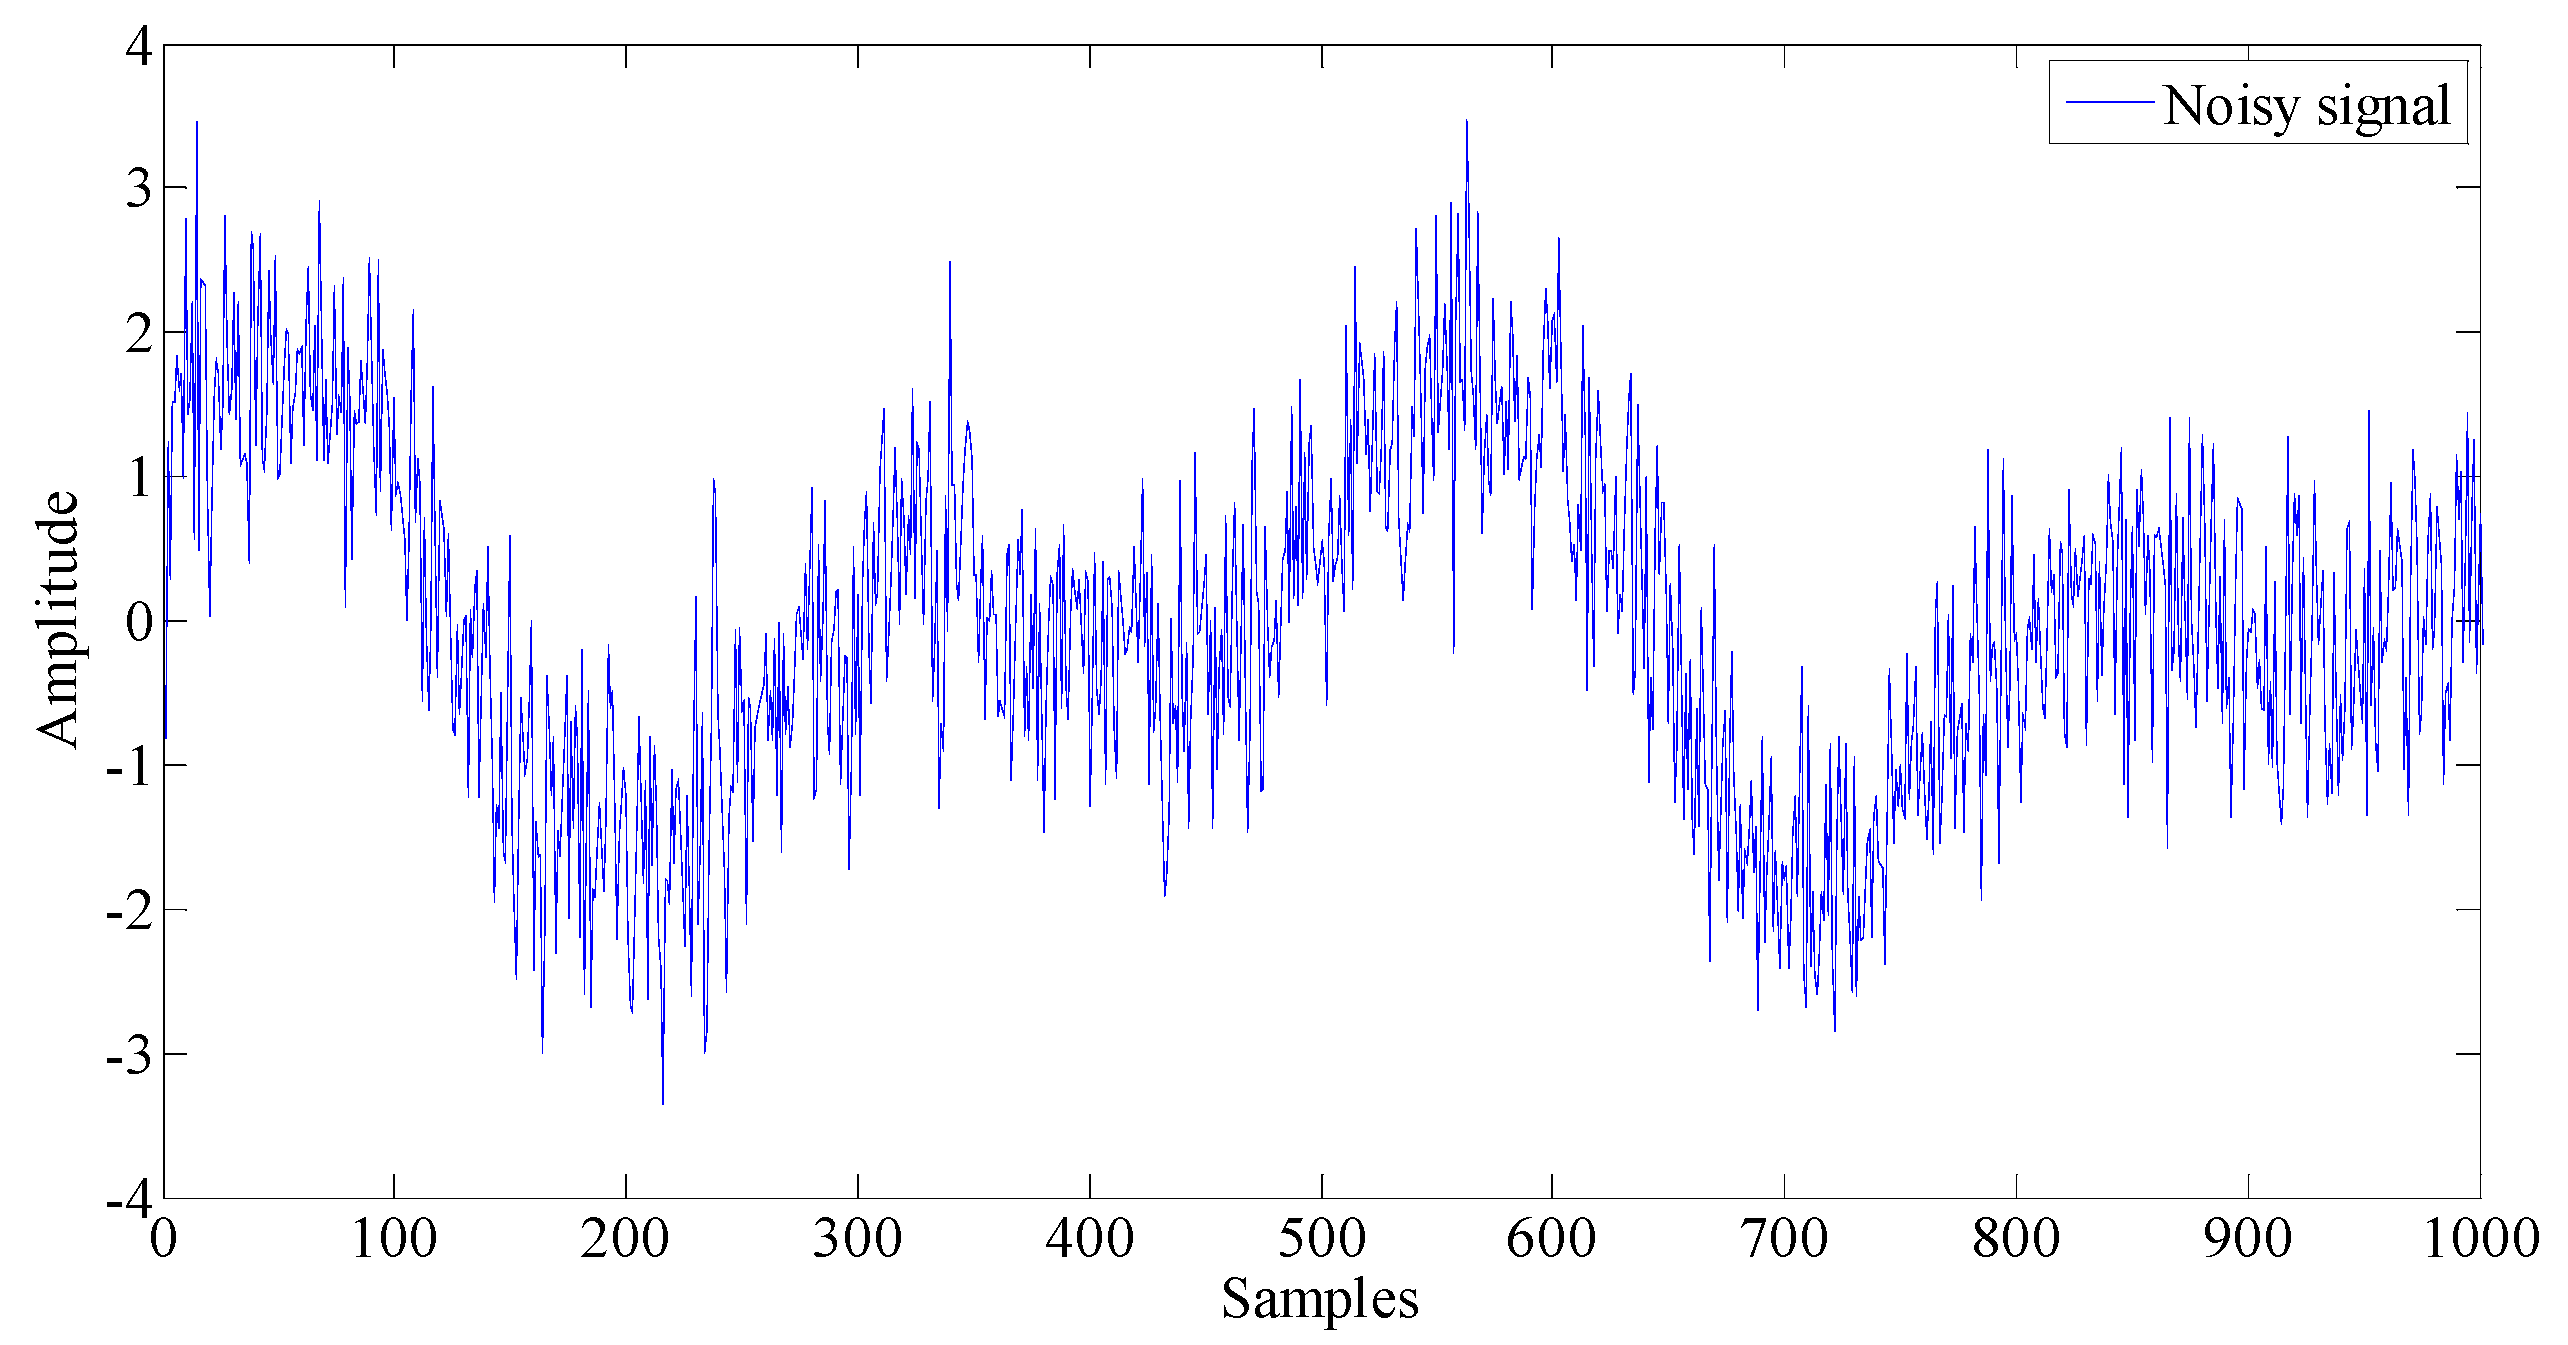
- Noisy signal is decomposed to obtain by improved CEEMDAN algorithm.
- (2)
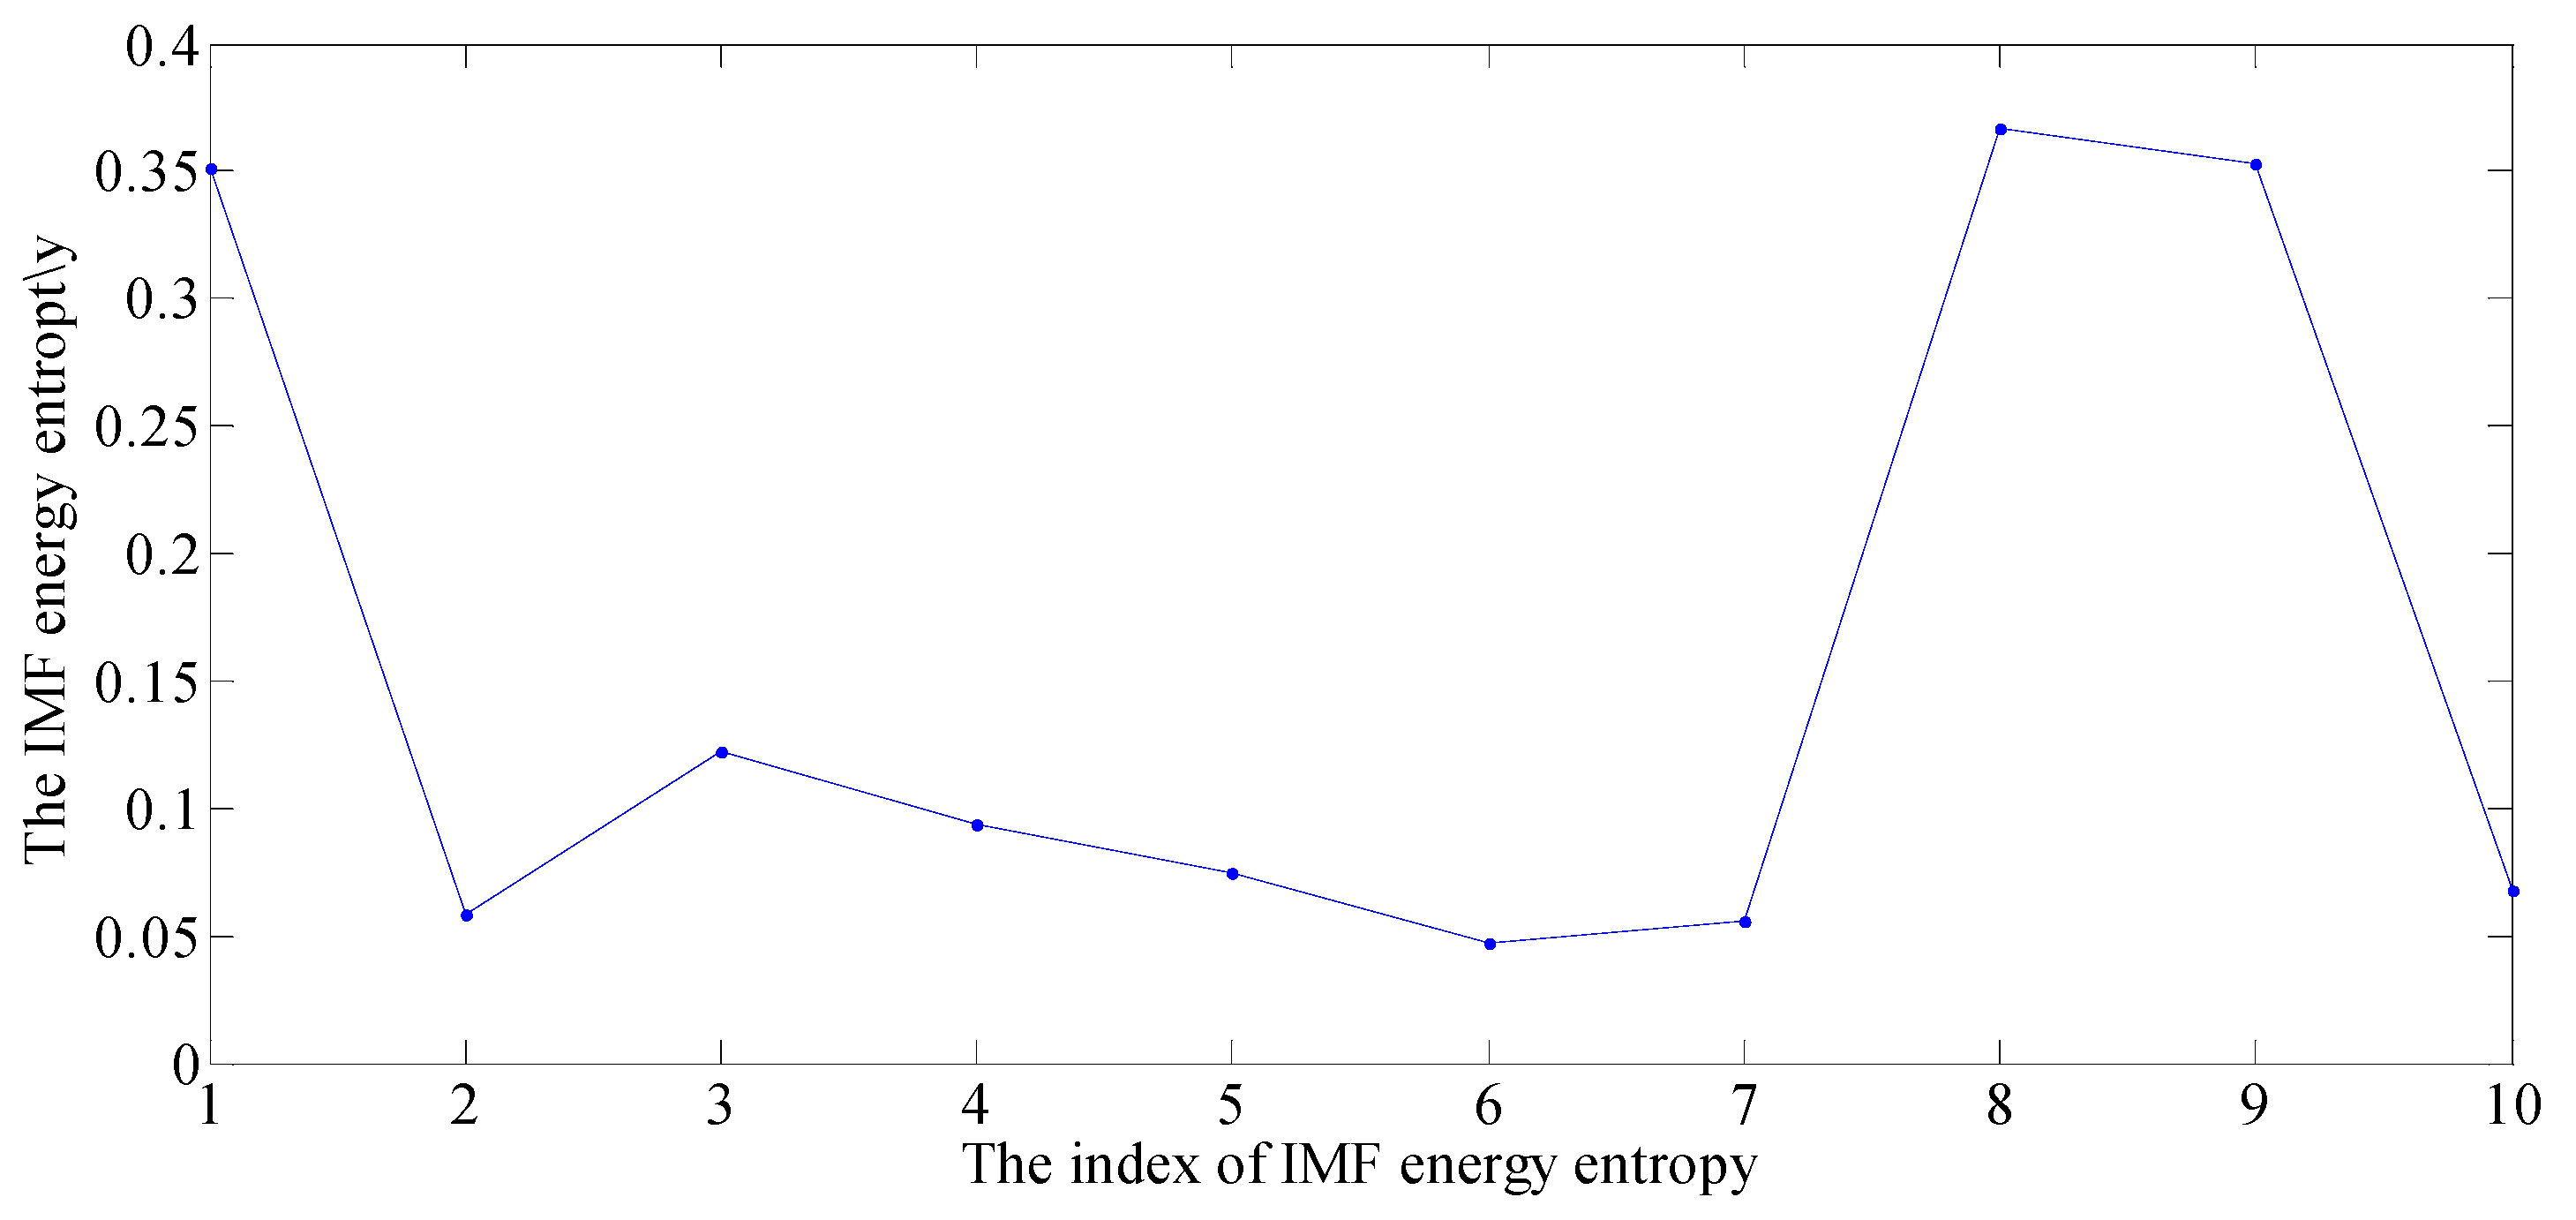
- The energy entropy of each is calculated, which is denoted as , where I is the number of modes obtained by improved CEEMDAN algorithm.
- (3)
- The relevant mode is identified as
- (4)
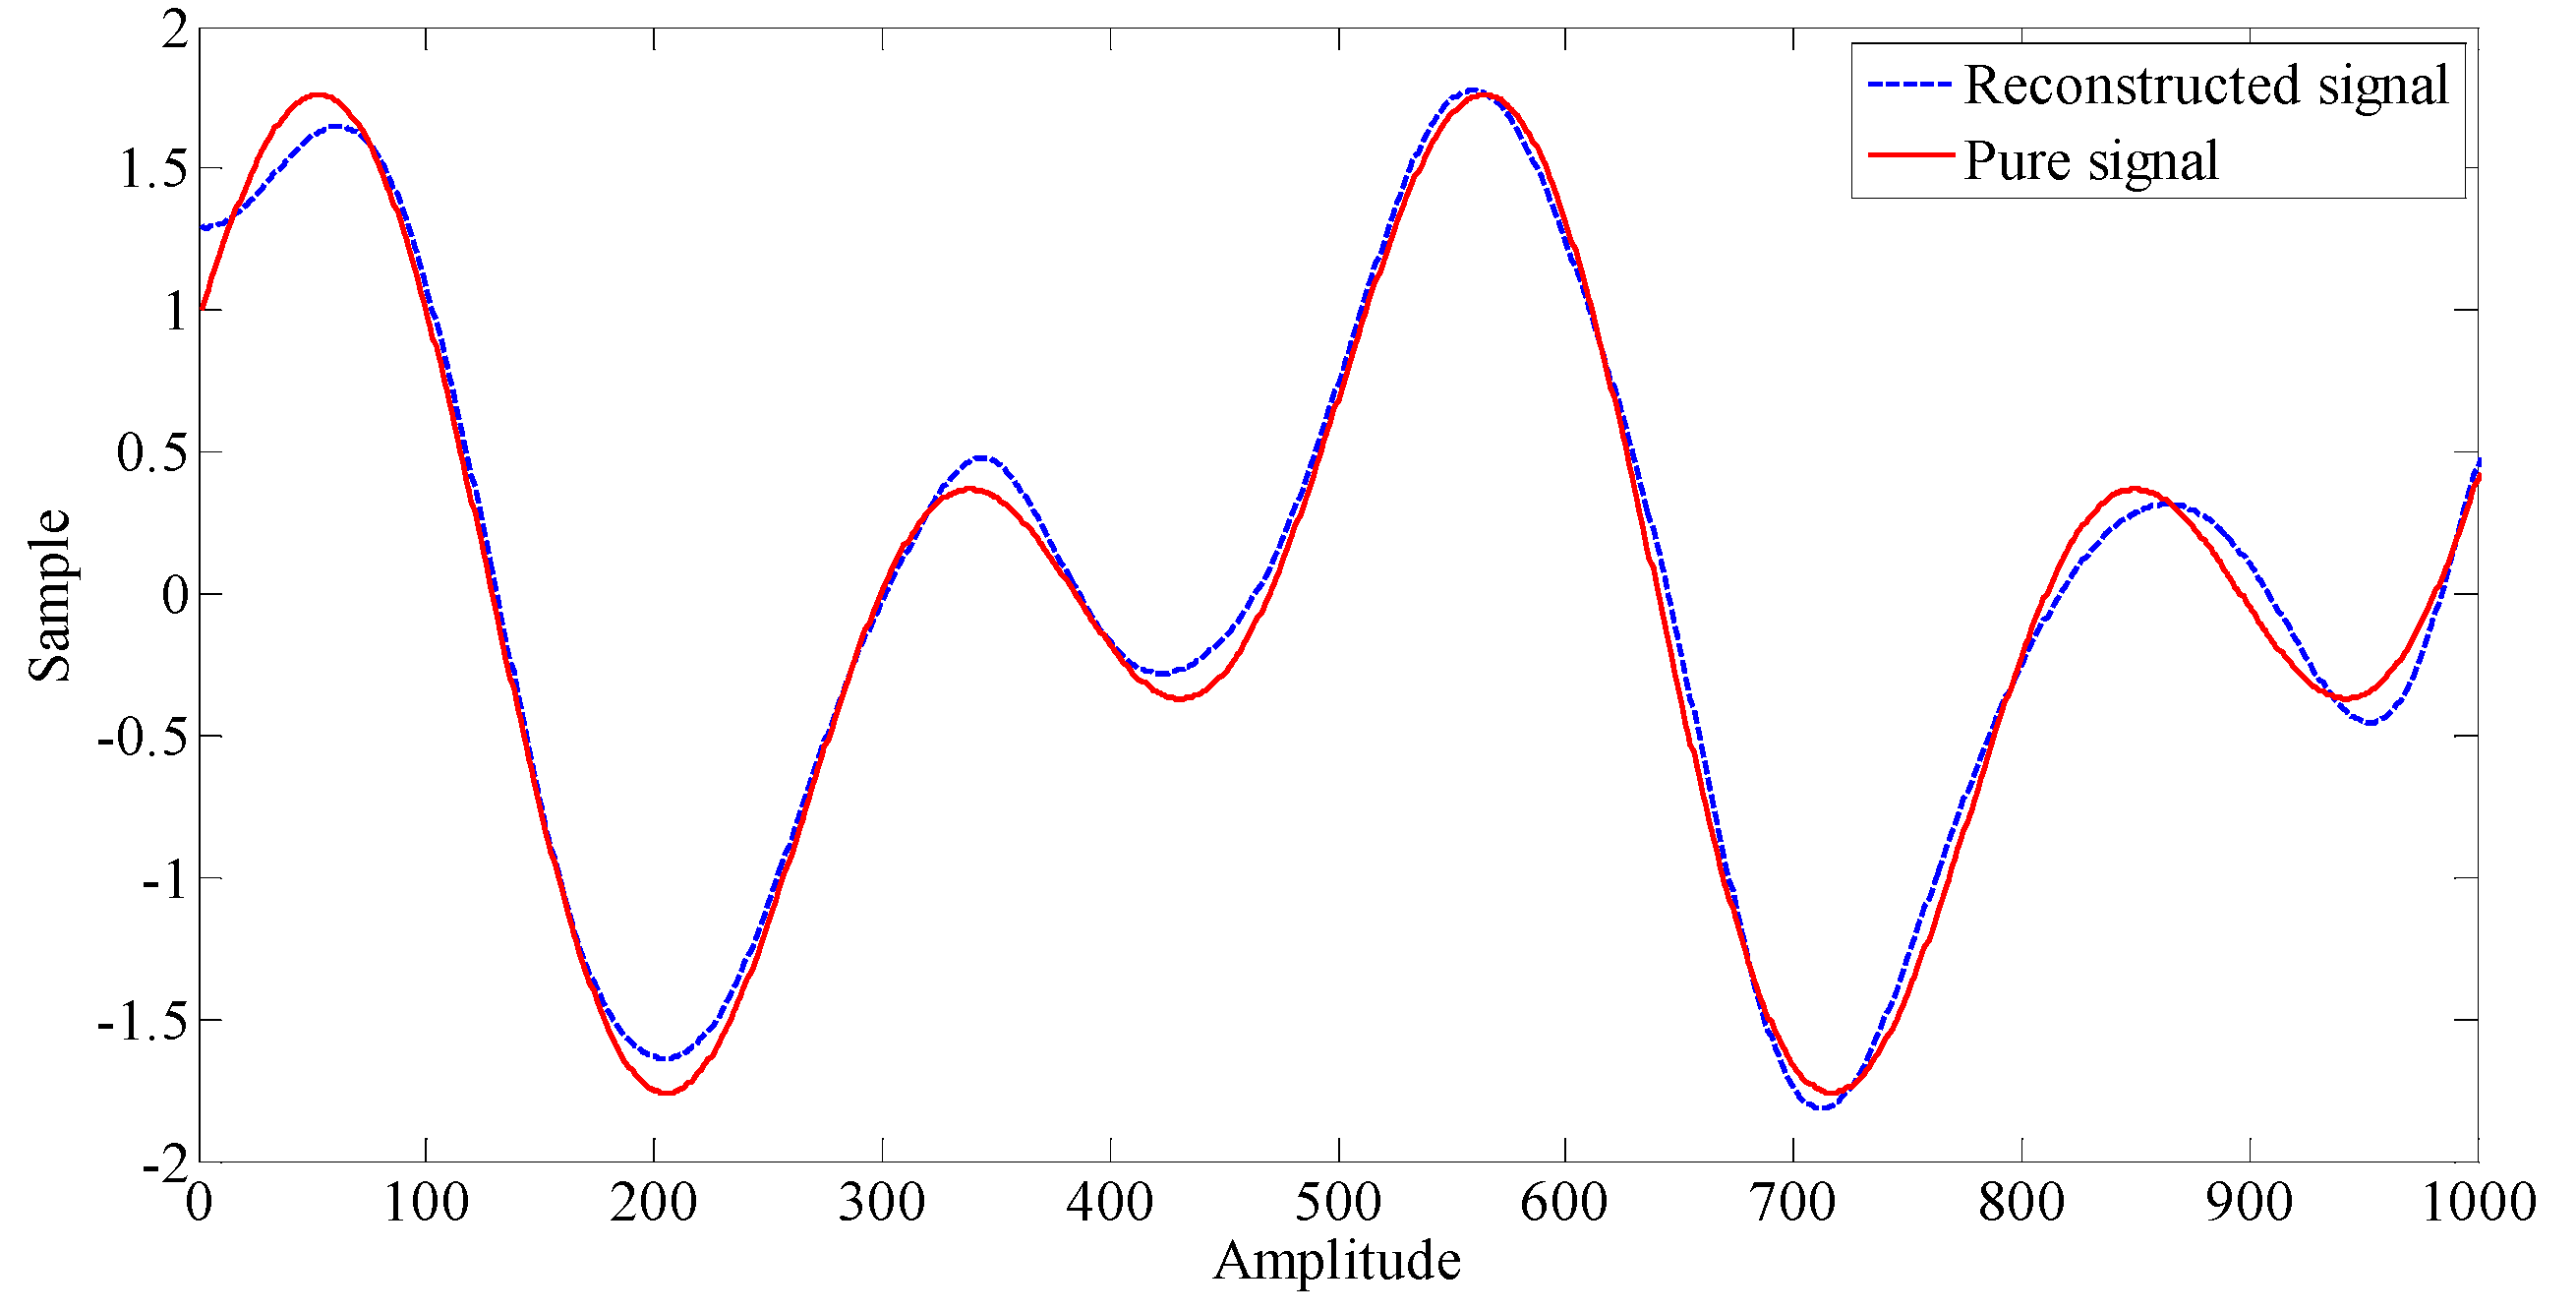
- The reconstructed signal is
3.2. Application
4. Results and Discussion
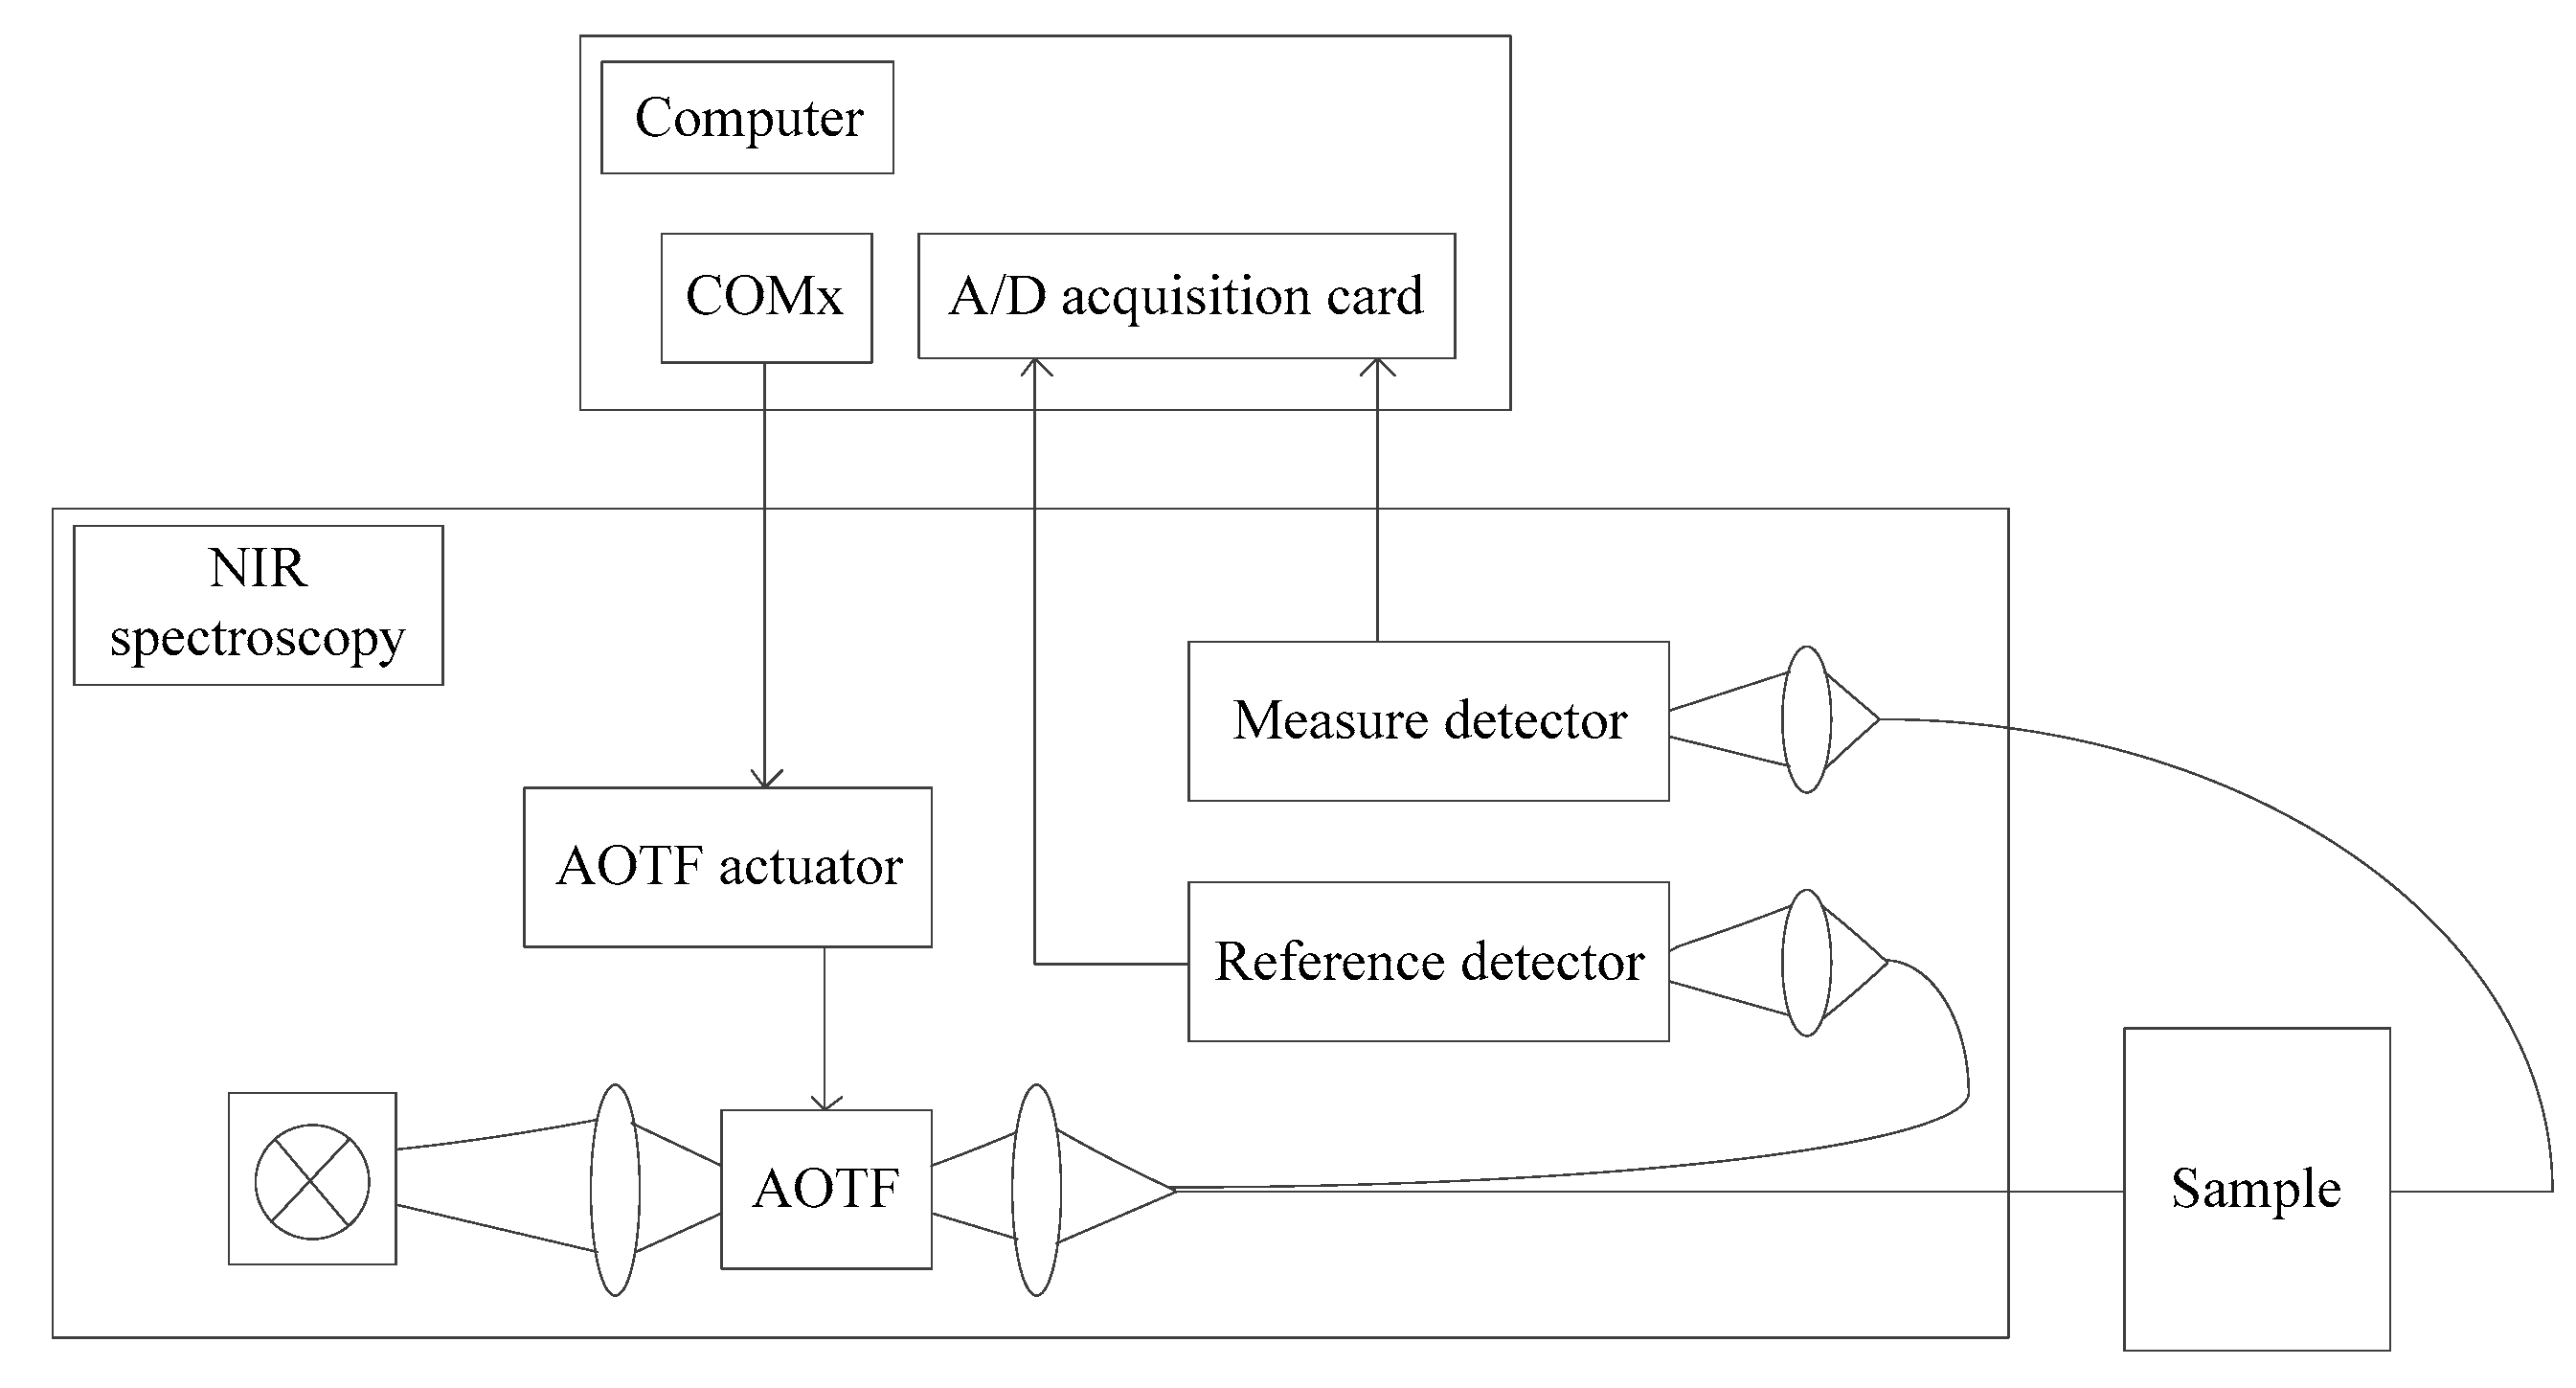
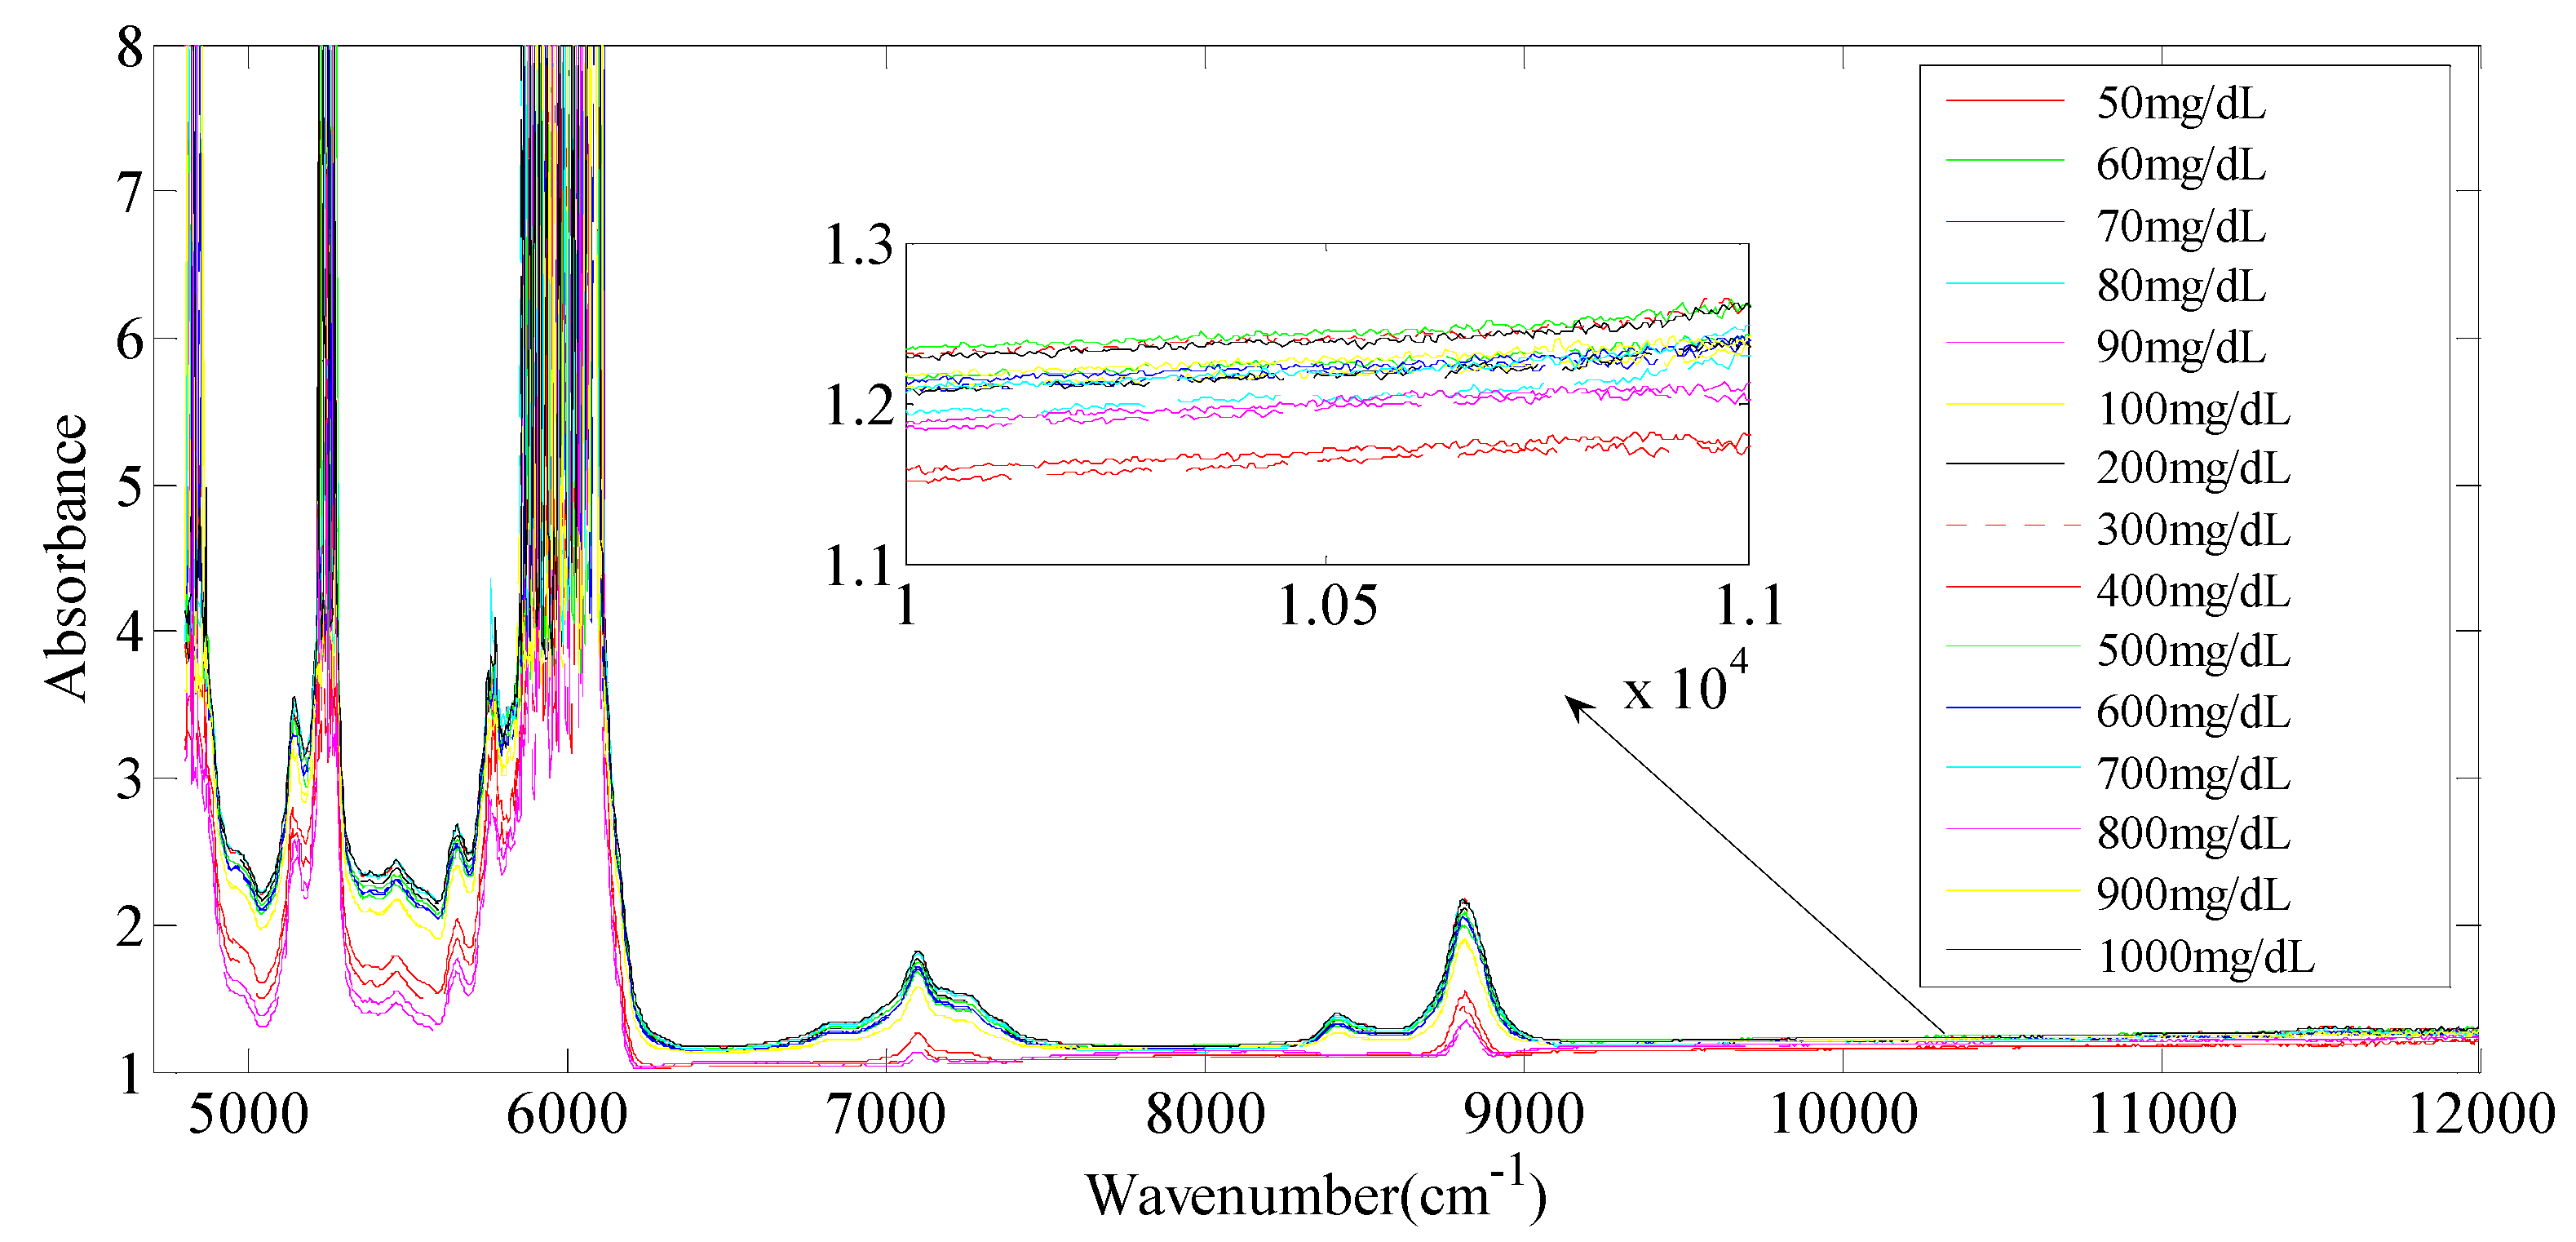
4.1. Near-Infrared Spectra Collection
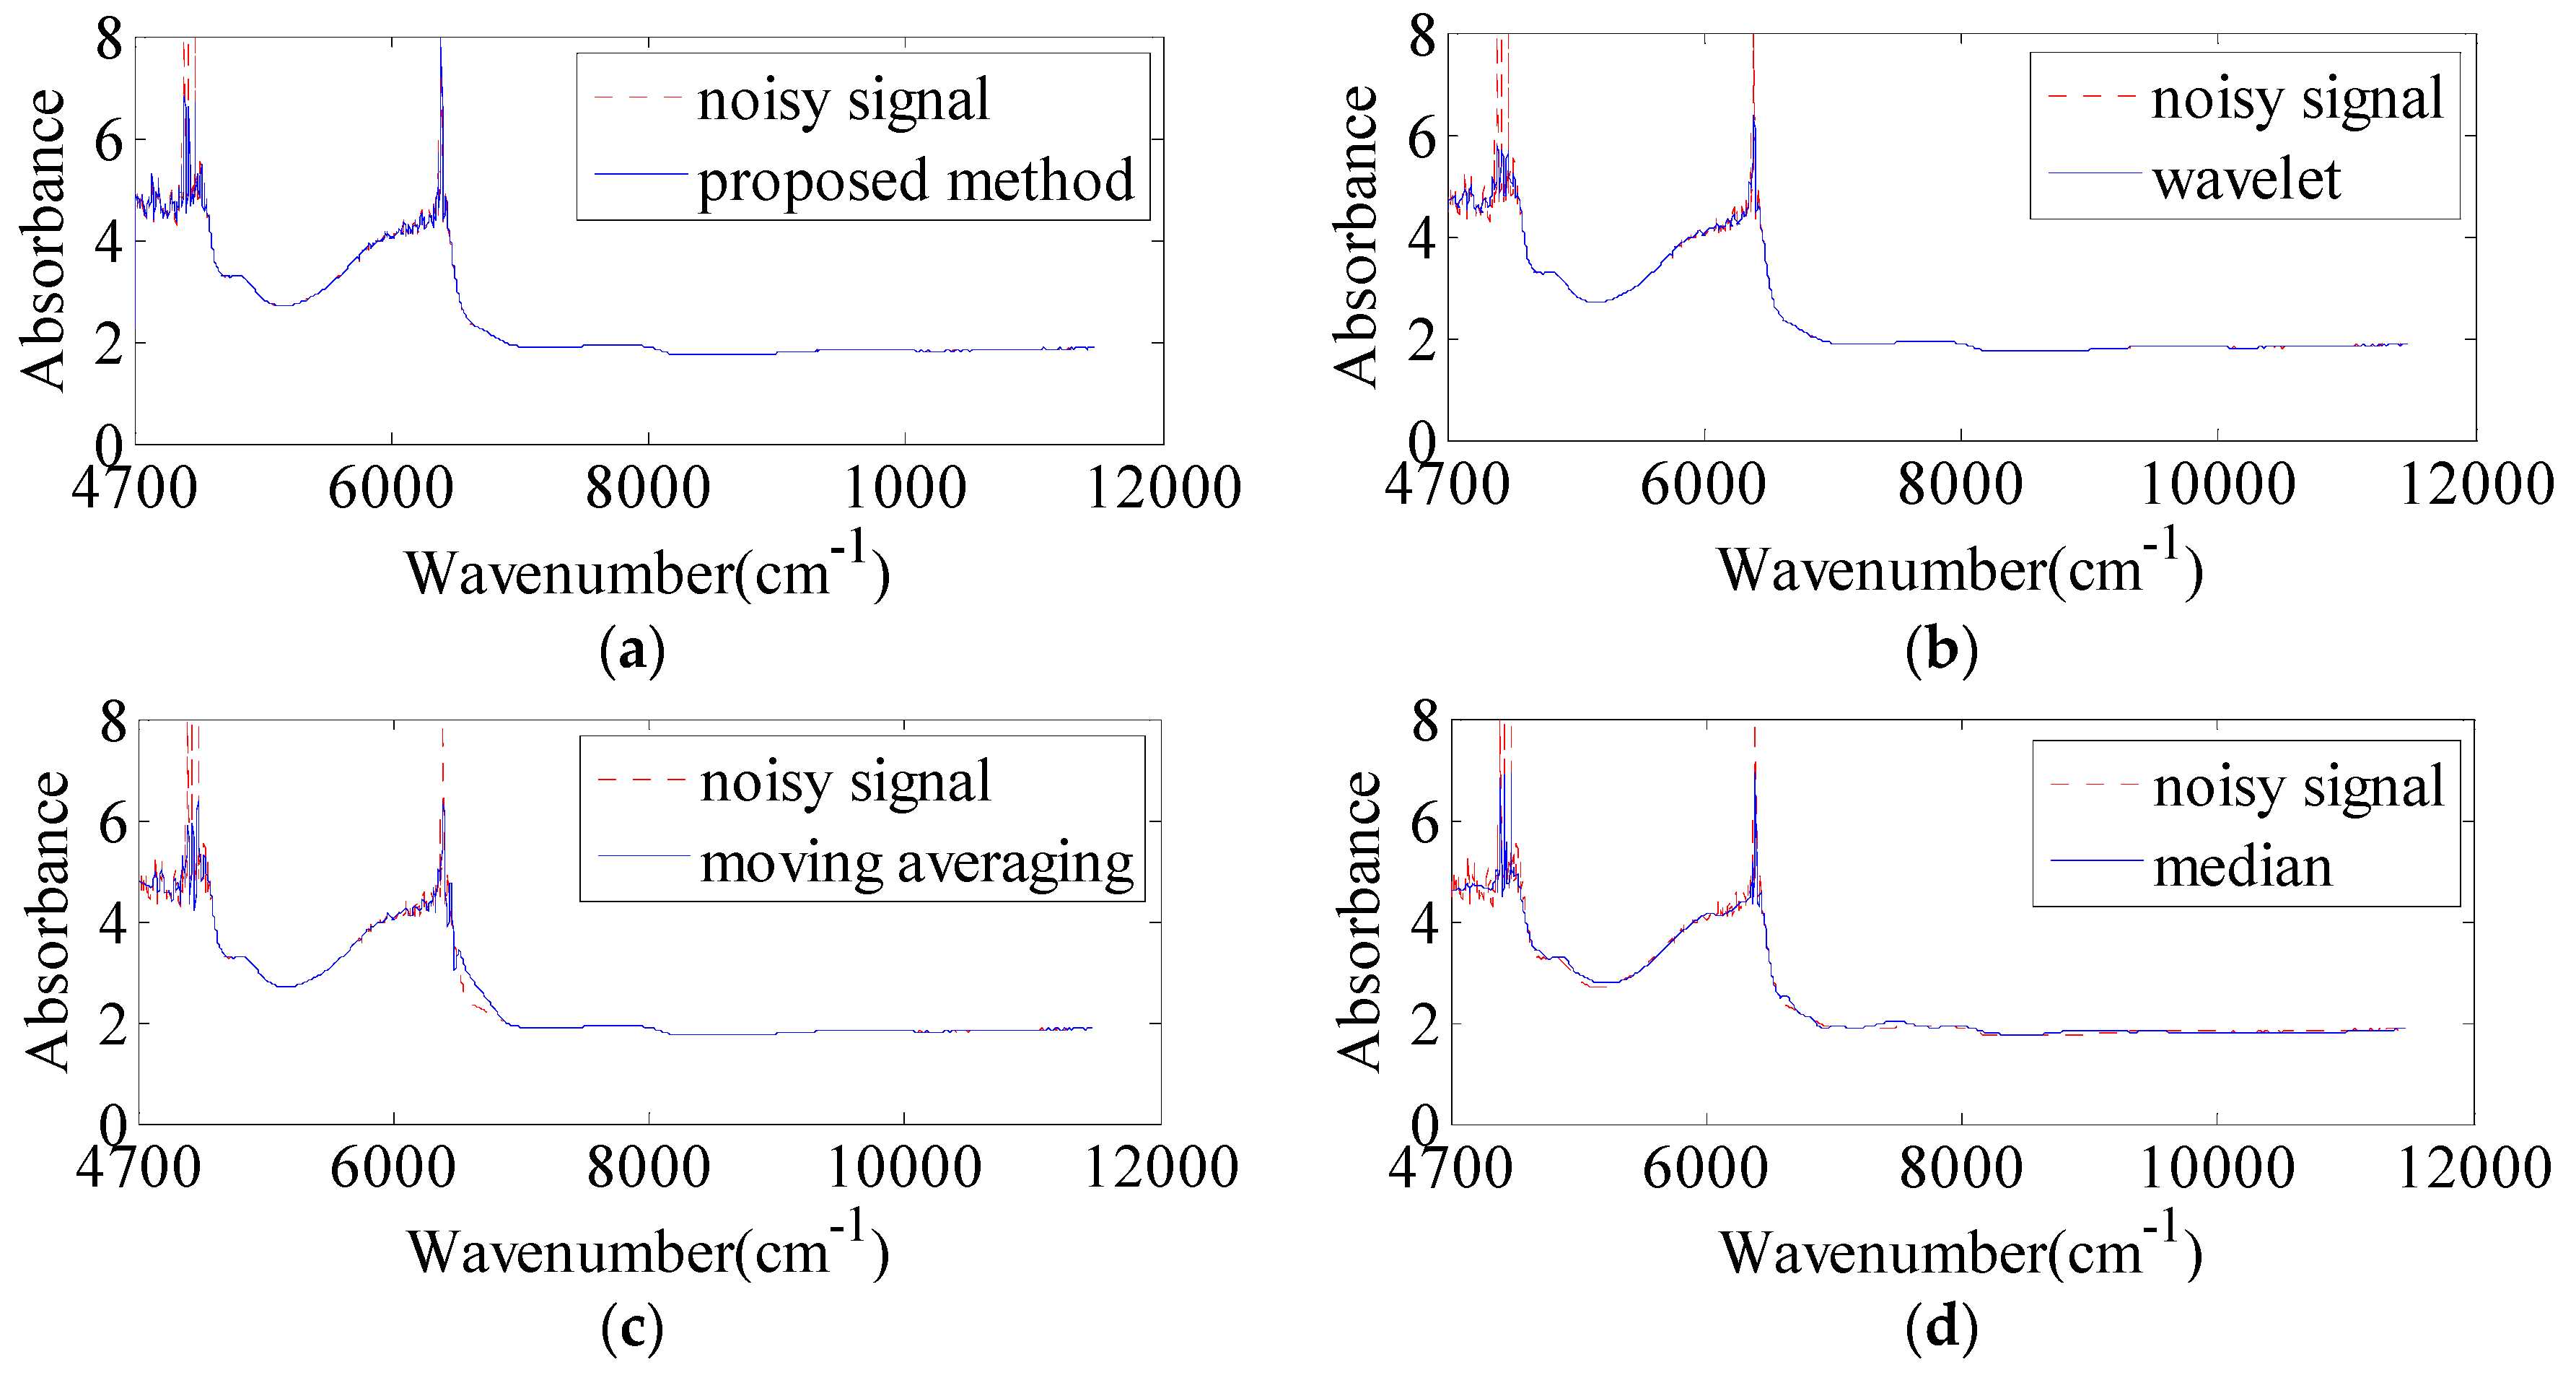
4.2. Reconstruction of Near-Infrared Spectra
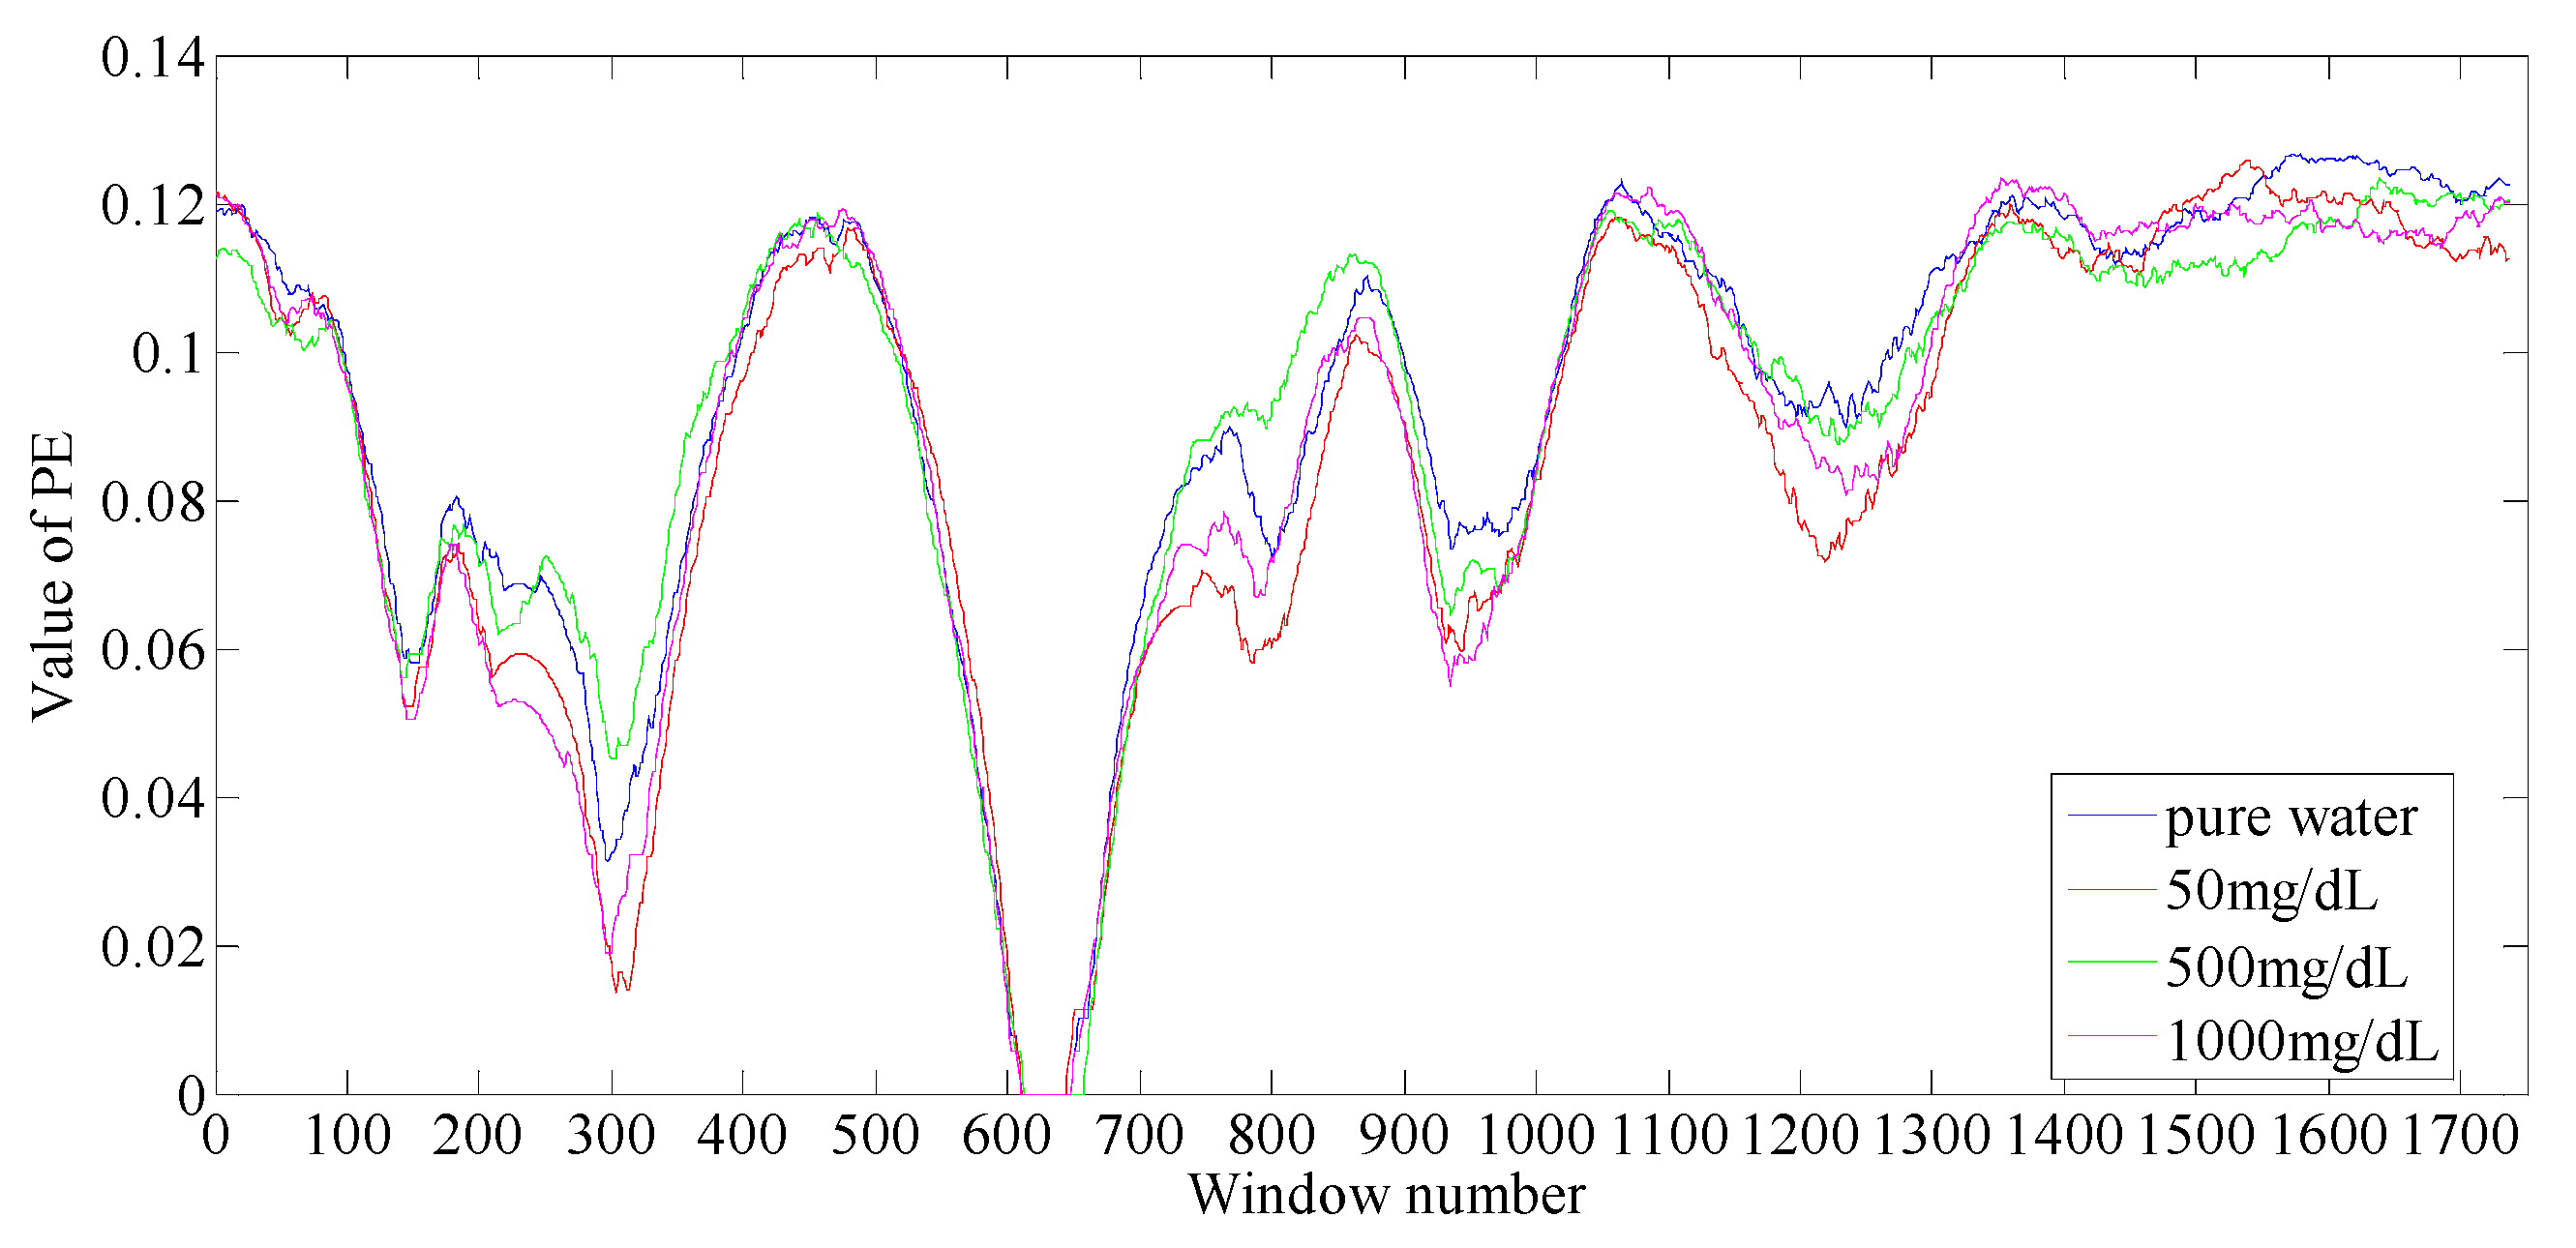
4.3. Wavelength Selection of Near-Infrared Spectra
5. Conclusions
Acknowledgments
Author Contributions
Conflicts of Interest
References
- Coster, S.; Gulliford, M.C.; Seed, P.T.; Powrie, J.K.; Swaminathan, R. Monitoring blood glucose control in diabetes mellitus: A systematic review. Health Technol. Assess. 2000, 4, 1–93. [Google Scholar]
- Guariguata, L.; Whiting, D.R.; Hambleton, I.; Beagley, J.; Linnenkamp, U.; Shaw, J.E. Global estimates of diabetes prevalence for 2013 and projections for 2035. Diabetes Res. Clin. Pract. 2014, 103, 137–149. [Google Scholar] [CrossRef] [PubMed]
- Ce, F.D.A.; Wolf, B. Current development in non-invasive glucose monitoring. Med. Eng. Phys. 2008, 30, 541–549. [Google Scholar]
- Tang, J.Y.; Wang, M.H.; Chen, M.K.; Jang, L.S. Glucose detection using an electro-optical fluidic device based on pulse width modulation. In Proceedings of the Seventh International Conference on Sensing Technology, Wellington, New Zealand, 3–5 December 2013; pp. 325–329. [Google Scholar]
- Wabomba, M.; Small, G.W.; Arnold, M.A. Evaluation of selectivity and robustness of near-infrared glucose measurements based on short-scan Fourier transform infrared interferograms. Anal. Chim. Acta 2003, 490, 325–340. [Google Scholar] [CrossRef]
- Mobley, P.R.; Kowalski, B.R.; Workman, J.J., Jr.; Bro, R. Review of Chemometrics Applied to Spectroscopy: 1985–95, Part 2. Appl. Spectrosc. Rev. 1996, 31, 347–368. [Google Scholar] [CrossRef]
- Li, X.; Mei, D.Q.; Chen, Z.C. Feature extraction of chatter for precision hole boring processing based on EMD and HHT. Opt. Precis. Eng. 2011, 19, 1291–1297. [Google Scholar]
- Lu, L.; Yan, G.Z.; Zhao, K.; Xu, F. Analysis of human colonic motility using EEMD. Opt. Precis. Eng. 2015, 23, 1580–1586. [Google Scholar] [CrossRef]
- Luo, Y.K.; Luo, S.T.; Luo, F.L. Realization and improvement of laser ultrasonic signal denoising based on empirical mode decomposition. Opt. Precis. Eng. 2013, 21, 479–487. [Google Scholar] [CrossRef]
- Jiang, L.H.; Gai, J.Y.; Wang, W.B.; Xiong, X.L.; Liang, S.; Sheng, X.Z. Ensemble Empirical Mode Decomposition Based Event Classification Method for the Fiber-Optic Intrusion Monitoring System. Acta Opt. Sin. 2015, 10, 52–58. [Google Scholar] [CrossRef]
- Zhao, H.W.; Norden, E.H. Ensemble empirical mode decomposition: A noise-assisted data analysis method. Adv. Adapt. Data Anal. 2009, 1, 1–41. [Google Scholar]
- Yeh, J.R.; Shieh, J.S.; Huang, N.E. Complementary Ensemble Empirical Mode Decomposition: A Novel Noise Enhanced Data Analysis Method. Adv. Adapt. Data Anal. 2011, 2, 135–156. [Google Scholar] [CrossRef]
- Torres, M.E.; Colominas, M.A.; Schlotthauer, G.; Flandrin, P. A complete ensemble empirical mode decomposition with adaptive noise. In Proceedings of the IEEE International Conference on Acoustics, Speech and Signal Processing (ICASSP), Prague, Czech Republic, 22–27 May 2011; pp. 4144–4147. [Google Scholar]
- Colominas, M.A.; Schlotthauer, G.; Torres, M.E. Improved complete ensemble EMD: A suitable tool for biomedical signal processing. Biomed. Signal Process. Control 2014, 14, 19–29. [Google Scholar] [CrossRef]
- Thomas, E.V. A primer on multivariate calibration. Anal. Chem. 1994, 66, 795A–804A. [Google Scholar] [CrossRef]
- Wu, W.; Walczak, B.; Massart, D.L.; Prebble, K.A.; Last, I.R. Spectral transformation and wavelength selection in near-infrared spectra classification. Anal. Chim. Acta 1995, 315, 243–255. [Google Scholar] [CrossRef]
- Centner, V.; Massart, D.L.; Noord, O.E.D.; de Jong, S.; Vandeginste, B.M.; Sterna, C. Elimination of Uninformative Variables for Multivariate Calibration. Anal. Chem. 1996, 68, 3851–3858. [Google Scholar] [CrossRef] [PubMed]
- Norgaard, L.; Saudland, A.; Wagner, J.; Nielsen, J.P.; Munck, L.; Engelsen, S.B. Interval Partial Least-Squares Regression (iPLS): A Comparative Chemometric Study with an Example from Near-Infrared Spectroscopy. Appl. Spectrosc. 2000, 54, 413–419. [Google Scholar] [CrossRef]
- Araújo, M.C.U.; Saldanha, T.C.B.; Galvão, R.K.H.; Yoneyama, T.; Chame, H.C.; Visani, V. The successive projections algorithm for variable selection in spectroscopic multicomponent analysis. Chemom. Intell. Lab. Syst. 2001, 57, 65–73. [Google Scholar] [CrossRef]
- Wang, L.Q.; Ge, H.F.; Li, G.B.; Yu, D.Y.; Hu, L.Z.; Jiang, L.Z. Characteristic Wavelength Variable Optimization of Near-Infrared Spectroscopy Based on Kalman Filtering. Spectrosc. Spectr. Anal. 2014, 34, 958–961. [Google Scholar]
- Bandt, C.; Pompe, B. Permutation entropy: A natural complexity measure for time series. Phys. Rev. Lett. 2002, 88, 174102. [Google Scholar] [CrossRef] [PubMed]
- Zunino, L.; Soriano, M.C.; Fischer, I.; Rosso, O.A.; Mirasso, C.R. Permutation-information-theory approach to unveil delay dynamics from time-series analysis. Phys. Rev. E Stat. Nonlinear Soft Matter Phys. 2010, 82, 565–590. [Google Scholar] [CrossRef] [PubMed]
- Li, X.; Cui, S.; Voss, L.J. Using Permutation Entropy to Measure the Electroencephalographic Effects of Sevoflurane. Anesthesiology 2008, 109, 448–456. [Google Scholar] [CrossRef] [PubMed]
- Yuedan, L.; Taesoo, C.; Hunki, B.; Younghae, D.; Jin, H.C.; Yun, D.C. Permutation entropy applied to movement behaviors of Drosophila Melanogaster. Mod. Phys. Lett. B 2011, 25, 1133–1142. [Google Scholar]
- Zanin, M.; Zunino, L.; Rosso, O.A.; Papo, D. Permutation Entropy and Its Main Biomedical and Econophysics Applications: A Review. Entropy 2012, 14, 1553–1577. [Google Scholar] [CrossRef]
- Bian, C.; Qin, C.; Ma, Q.D.; Shen, Q. Modified permutation-entropy analysis of heartbeat dynamics. Phys. Rev. E 2012, 85, 021906. [Google Scholar] [CrossRef] [PubMed]
- Huang, N.E.; Shen, Z.; Long, S.R.; Wu, M.C.; Shih, H.H.; Zheng, W.; Yen, N.; Tung, C.C.; Liu, H.H.; Yen, N.C.; et al. The empirical mode decomposition and the Hilbert spectrum for nonlinear and non-stationary time series analysis. R. Soc. Lond. Proc. 1988, 454, 903–995. [Google Scholar] [CrossRef]
- Freeland, R.S.; Odhiambo, L.O. Subsurface characterization using textural features extracted from GPR data. Trans. ASABE 2007, 50, 287–293. [Google Scholar] [CrossRef]
- Chen, W.G.; Deng, B.F.; Bin, Y. Fault Recognition for High Voltage Circuit Breaker Based on EMD of Vibration Signal and Energy Entropy Characteristic. High Volt. Appar. 2009, 45, 90–96. [Google Scholar]
- Zunino, L.; Olivares, F.; Scholkmann, F.; Rosso, O.A. Permutation entropy based time series analysis: Equalities in the input signal can lead to false conclusions. Phys. Lett. A 2017, 381, 1883–1892. [Google Scholar] [CrossRef]
- Li, C.; Zhan, L. A hybrid filtering method based on a novel empirical mode decomposition for friction signals. Meas. Sci. Technol. 2015, 26, 125003. [Google Scholar] [CrossRef]
- Amigó, J.M.; Zambrano, S.; Sanjuán, M.A.F. Combinatorial detection of determinism in noisy time series. EPL 2008, 83, 60005. [Google Scholar]
- Amigó, J.M. Permutation Complexity in Dynamical Systems: Ordinal Patterns, Permutation Entropy and All That; Springer Publishing Company, Inc.: New York, NY, USA, 2012. [Google Scholar]
- Li, C.; Zhan, L.; Shen, L. Friction Signal Denoising Using Complete Ensemble EMD with Adaptive Noise and Mutual Information. Entropy 2015, 17, 5965–5979. [Google Scholar] [CrossRef]
- Brègman, L.M. Certain properties of nonnegative matrices and their permanents. Doklady Akademii Nauk SSSR 1973, 14, 27–30. [Google Scholar]
- Colucci, J.A.; Fontalvogómez, M.; Velez, N.; Romanach, R.J. In-Line Near-Infrared (NIR) and Raman Spectroscopy Coupled with Principal Component Analysis (PCA) for In Situ Evaluation of the Transesterification Reaction. Appl. Spectrosc. 2013, 67, 1142–1149. [Google Scholar]
- Martens, H.; Jensen, S.A. Partial least squares regression: A new two-stage NIR calibration method. In Developments in Food Science, Vol. 5A. Progress in Cereal Chemistry and Technology; Elsevier: Amsterdam, The Netherlands, 1983. [Google Scholar]
- Safavi, H.R.; Esmikhani, M. Conjunctive use of surface water and groundwater: Application of support vector machines (SVMs) and genetic algorithms. Water Resour. Manag. 2013, 27, 2623–2644. [Google Scholar] [CrossRef]


| IMF | IMF1 | IMF2 | IMF3 | IMF4 | IMF5 | IMF6 | IMF7 | IMF8 | IMF9 | IMF10 |
|---|---|---|---|---|---|---|---|---|---|---|
| Energy Entropy | 0.3509 | 0.0586 | 0.1226 | 0.0939 | 0.0751 | 0.0471 | 0.0556 | 0.3664 | 0.3526 | 0.0680 |
| Input SNR (dB) | Improved CEEMDAN | Fourier Transform | Wavelet | Moving Averaging | Median |
|---|---|---|---|---|---|
| 1 | 17.8248 | 16.0560 | 15.0341 | 14.5787 | 12.2264 |
| 2 | 18.0438 | 17.3067 | 15.7924 | 15.5213 | 14.3009 |
| 3 | 18.4945 | 17.8271 | 16.6156 | 16.5692 | 15.5220 |
| 4 | 20.8505 | 18.7479 | 17.3508 | 17.0353 | 15.7923 |
| 5 | 20.9332 | 20.0900 | 19.3935 | 17.9618 | 15.9758 |
| 6 | 21.4840 | 20.9410 | 20.9280 | 20.5687 | 16.9514 |
| 7 | 22.0085 | 21.9528 | 21.2787 | 21.0124 | 17.8478 |
| 8 | 22.4068 | 22.0203 | 21.9441 | 21.0533 | 19.0951 |
| 9 | 23.3195 | 22.9087 | 22.8480 | 22.2636 | 19.3020 |
| 10 | 23.9494 | 23.6274 | 23.5810 | 23.2829 | 20.4236 |
| Input SNR (dB) | Improved CEEMDAN | Fourier Transform | Wavelet | Moving Averaging | Median |
|---|---|---|---|---|---|
| 1 | 0.0165 | 0.0234 | 0.0314 | 0.0348 | 0.0599 |
| 2 | 0.0157 | 0.0207 | 0.0263 | 0.0280 | 0.0371 |
| 3 | 0.0141 | 0.0187 | 0.0218 | 0.0220 | 0.0280 |
| 4 | 0.0082 | 0.0120 | 0.0184 | 0.0198 | 0.0263 |
| 5 | 0.0081 | 0.0102 | 0.0115 | 0.0160 | 0.0252 |
| 6 | 0.0071 | 0.0075 | 0.0081 | 0.0088 | 0.0202 |
| 7 | 0.0063 | 0.0069 | 0.0074 | 0.0079 | 0.0164 |
| 8 | 0.0057 | 0.0060 | 0.0064 | 0.0078 | 0.0123 |
| 9 | 0.0047 | 0.0049 | 0.0052 | 0.0059 | 0.0117 |
| 10 | 0.0040 | 0.0042 | 0.0044 | 0.0047 | 0.0091 |
| Methods | ECG | Blocks | ||
|---|---|---|---|---|
| SNR | MSE | SNR | MSE | |
| Improved CEEMDAN | 35.6925 | 0.4605 | 20.1445 | 0.0853 |
| Wavelet | 32.8187 | 0.8924 | 14.8604 | 0.2881 |
| Median | 31.5652 | 1.1910 | 17.5286 | 0.1558 |
| Moving Averaging | 30.7328 | 1.4427 | 19.6235 | 0.0962 |
| Fourier Transform | 30.3529 | 1.5744 | 16.3653 | 0.2037 |
| Methods | ECG | Blocks | ||||
|---|---|---|---|---|---|---|
| SNR | MSE | SNR | MSE | SNR | MSE | |
| Improved CEEMDAN | 6.1669 | 0.2417 | 37.0801 | 0.3345 | 14.8196 | 0.2908 |
| Wavelet | 5.6590 | 0.2717 | 35.7799 | 0.4513 | 14.3990 | 0.3204 |
| Moving Averaging | 5.6052 | 0.2751 | 30.4034 | 1.5563 | 14.0942 | 0.3436 |
| Fourier Transform | 5.4867 | 0.2827 | 30.9340 | 1.3773 | 13.8094 | 0.3669 |
| Median | 5.0963 | 0.3093 | 32.1864 | 1.0323 | 14.5561 | 0.3090 |
| Methods | SNR | MSE |
|---|---|---|
| Improved CEEMDAN | 24.0355 | 0.0297 |
| Wavelet | 26.3136 | 0.0178 |
| Moving Averaging | 27.7917 | 0.0125 |
| Median | 28.0776 | 0.0117 |
| Number | Point Number | Wavenumber (cm−1) |
|---|---|---|
| 1 | 218–301 | 5639–5959 |
| 2 | 701–791 | 7502–7849 |
| 3 | 942–1141 | 8431–9120 |
| Methods | SVR | PLSR | ||
|---|---|---|---|---|
| R | RMSEP | R | RMSEP | |
| Improved CEEMDAN-FD | 0.9999 | 0.9125 | 0.9998 | 0.9089 |
| SPA | 0.9892 | 0.8195 | 0.9878 | 0.8002 |
| MI | 0.9790 | 0.7604 | 0.9658 | 0.7019 |
| PCA | 0.9621 | 0.7542 | 0.9403 | 0.6958 |
| Full wave bands | 0.8988 | 0.5499 | 0.8147 | 0.5013 |
© 2017 by the authors. Licensee MDPI, Basel, Switzerland. This article is an open access article distributed under the terms and conditions of the Creative Commons Attribution (CC BY) license (http://creativecommons.org/licenses/by/4.0/).
Share and Cite
Li, X.; Li, C. Pretreatment and Wavelength Selection Method for Near-Infrared Spectra Signal Based on Improved CEEMDAN Energy Entropy and Permutation Entropy. Entropy 2017, 19, 380. https://doi.org/10.3390/e19070380
Li X, Li C. Pretreatment and Wavelength Selection Method for Near-Infrared Spectra Signal Based on Improved CEEMDAN Energy Entropy and Permutation Entropy. Entropy. 2017; 19(7):380. https://doi.org/10.3390/e19070380
Chicago/Turabian StyleLi, Xiaoli, and Chengwei Li. 2017. "Pretreatment and Wavelength Selection Method for Near-Infrared Spectra Signal Based on Improved CEEMDAN Energy Entropy and Permutation Entropy" Entropy 19, no. 7: 380. https://doi.org/10.3390/e19070380
APA StyleLi, X., & Li, C. (2017). Pretreatment and Wavelength Selection Method for Near-Infrared Spectra Signal Based on Improved CEEMDAN Energy Entropy and Permutation Entropy. Entropy, 19(7), 380. https://doi.org/10.3390/e19070380