
Systematic Analysis of the Non-Extensive Statistical Approach in High Energy Particle Collisions—Experiment vs. Theory †

 , ,
, ,
Abstract
:1. Introduction
2. Connection with High Energy Physics
3. Non-Extensive Statistics in High-Energy Physics
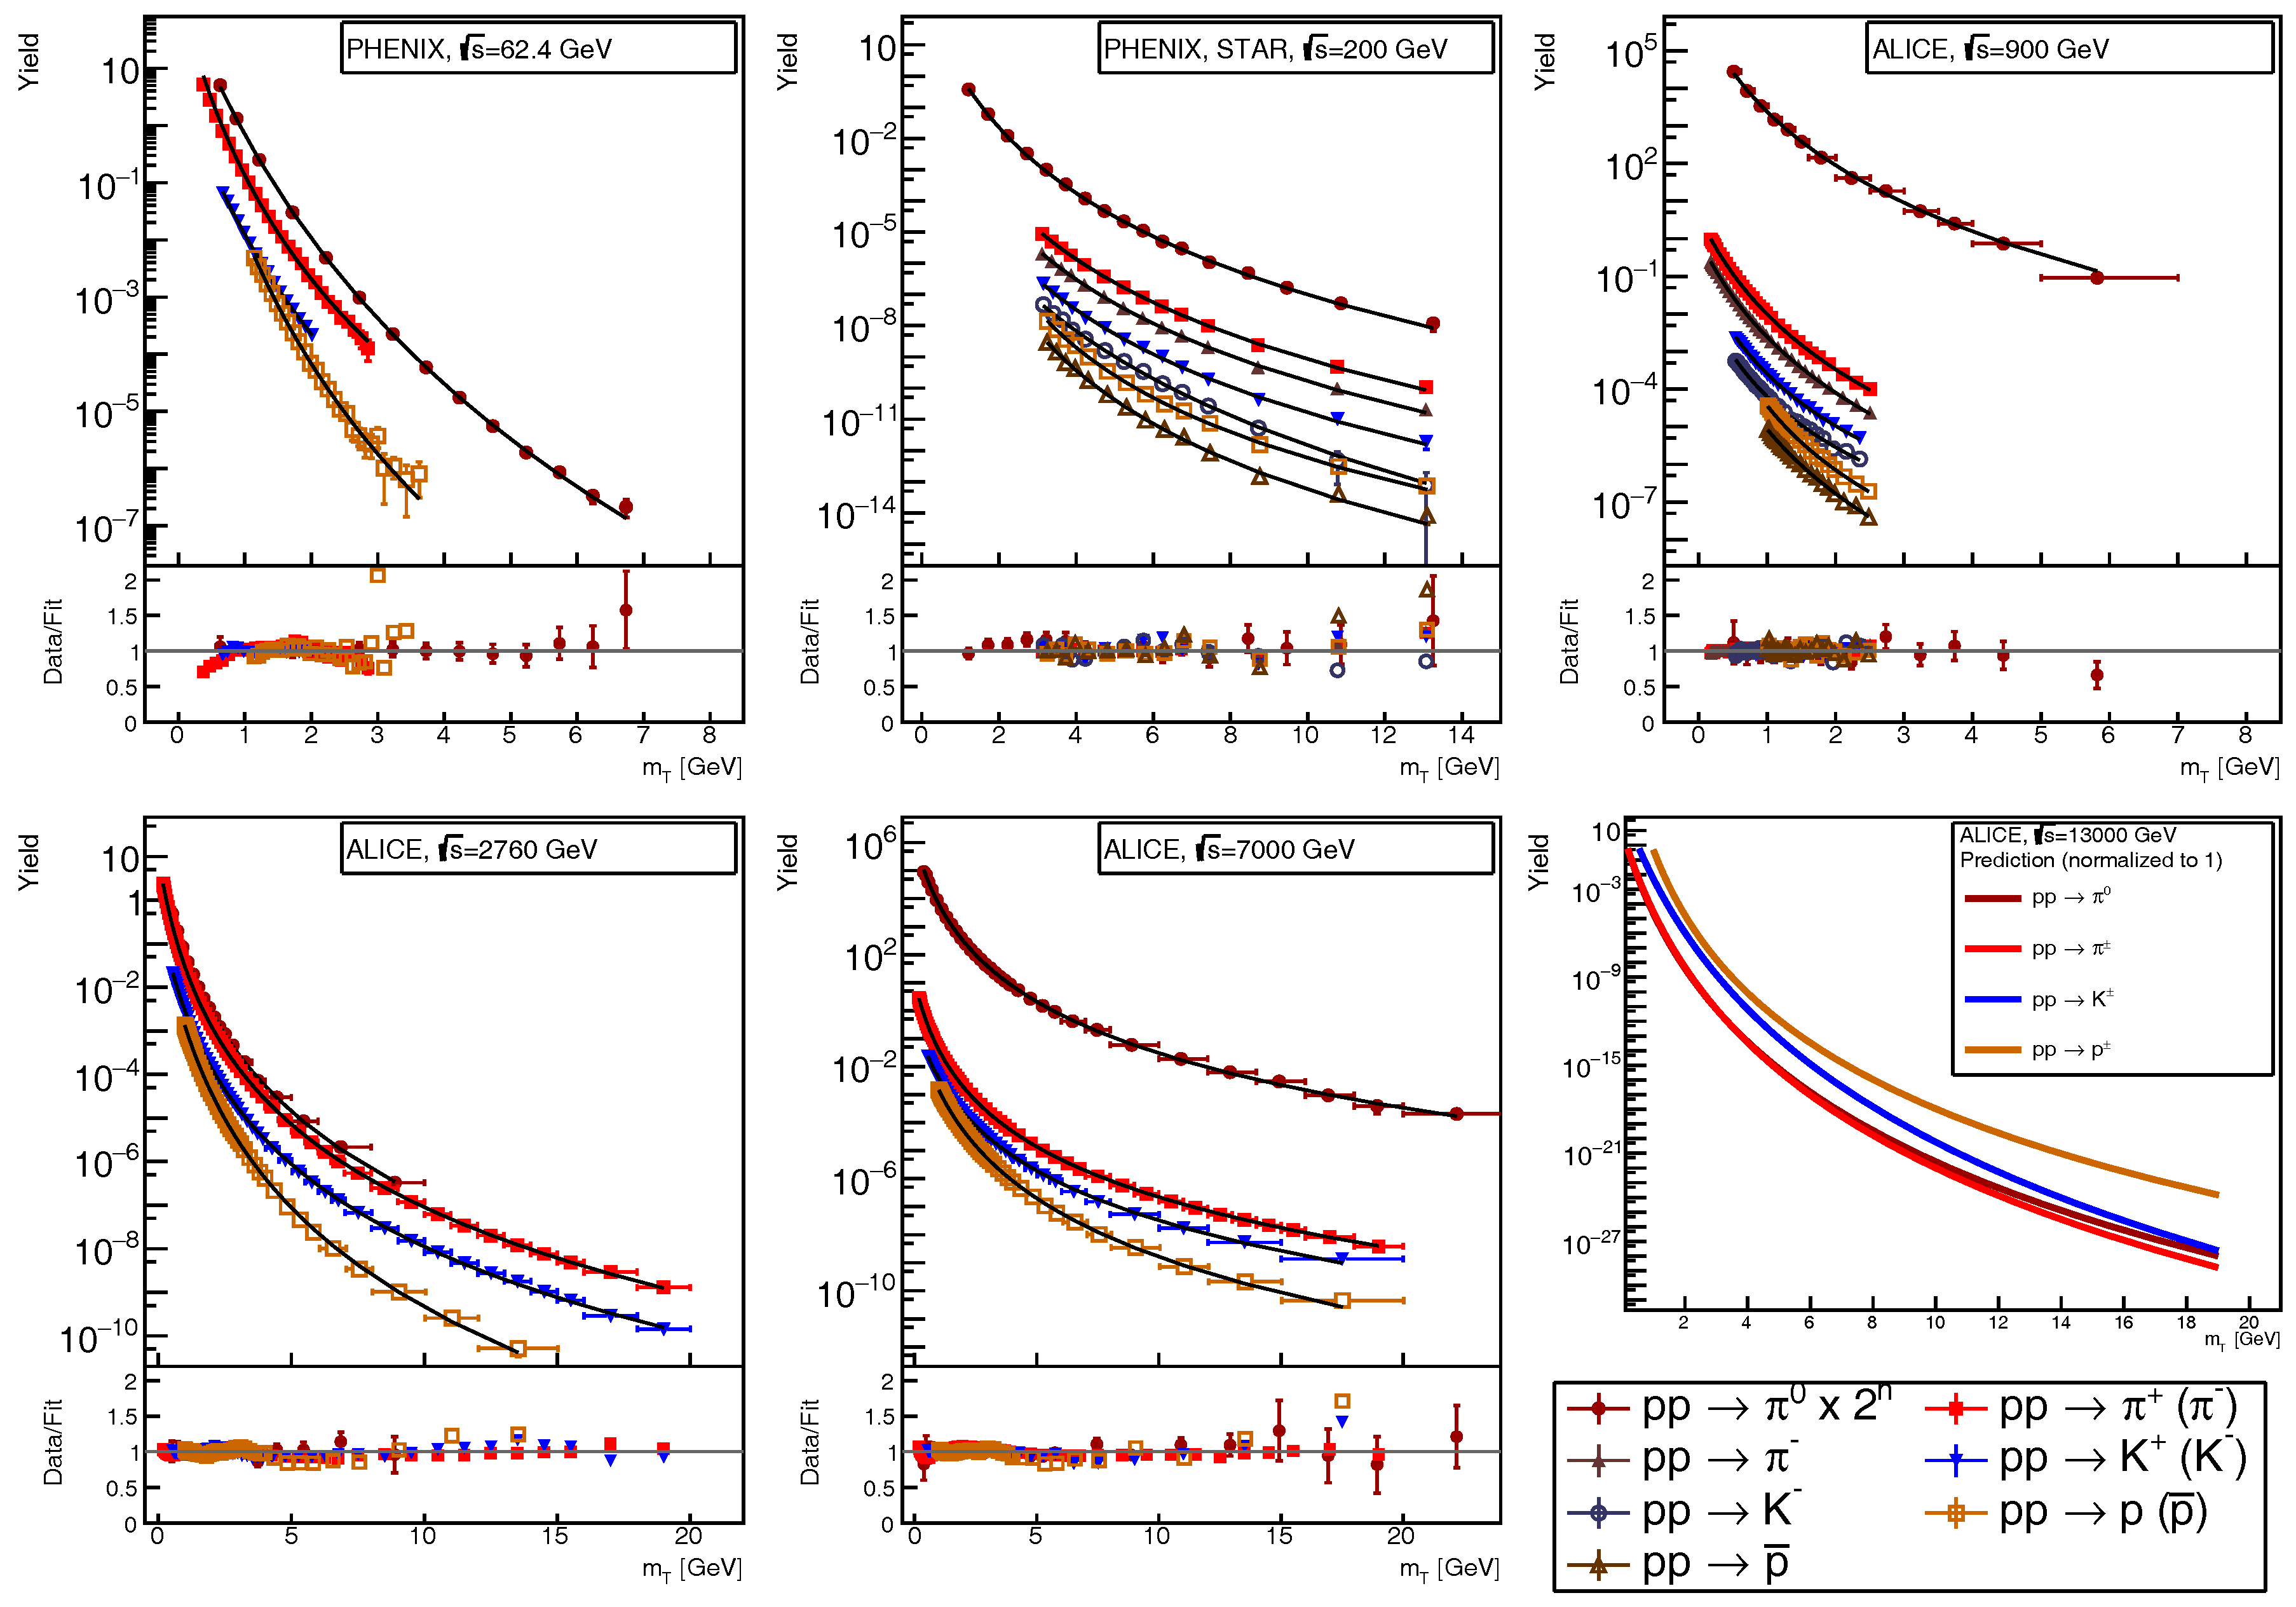
3.1. The Description of the Inclusive Hadron Production
3.2. Hadronization Using Non-Extensive Statistics
3.3. Motivation for Qcd-Like Energy Scaling of the Parameters
3.4. The Improved Quark-Coalescence Model
4. Fitted Parameters
- fit of the high- part by fixing T and changing q;
- fit of the low- part by fixing q and changing T;
- fit of the whole range with both parameters, starting from the above obtained q and T.
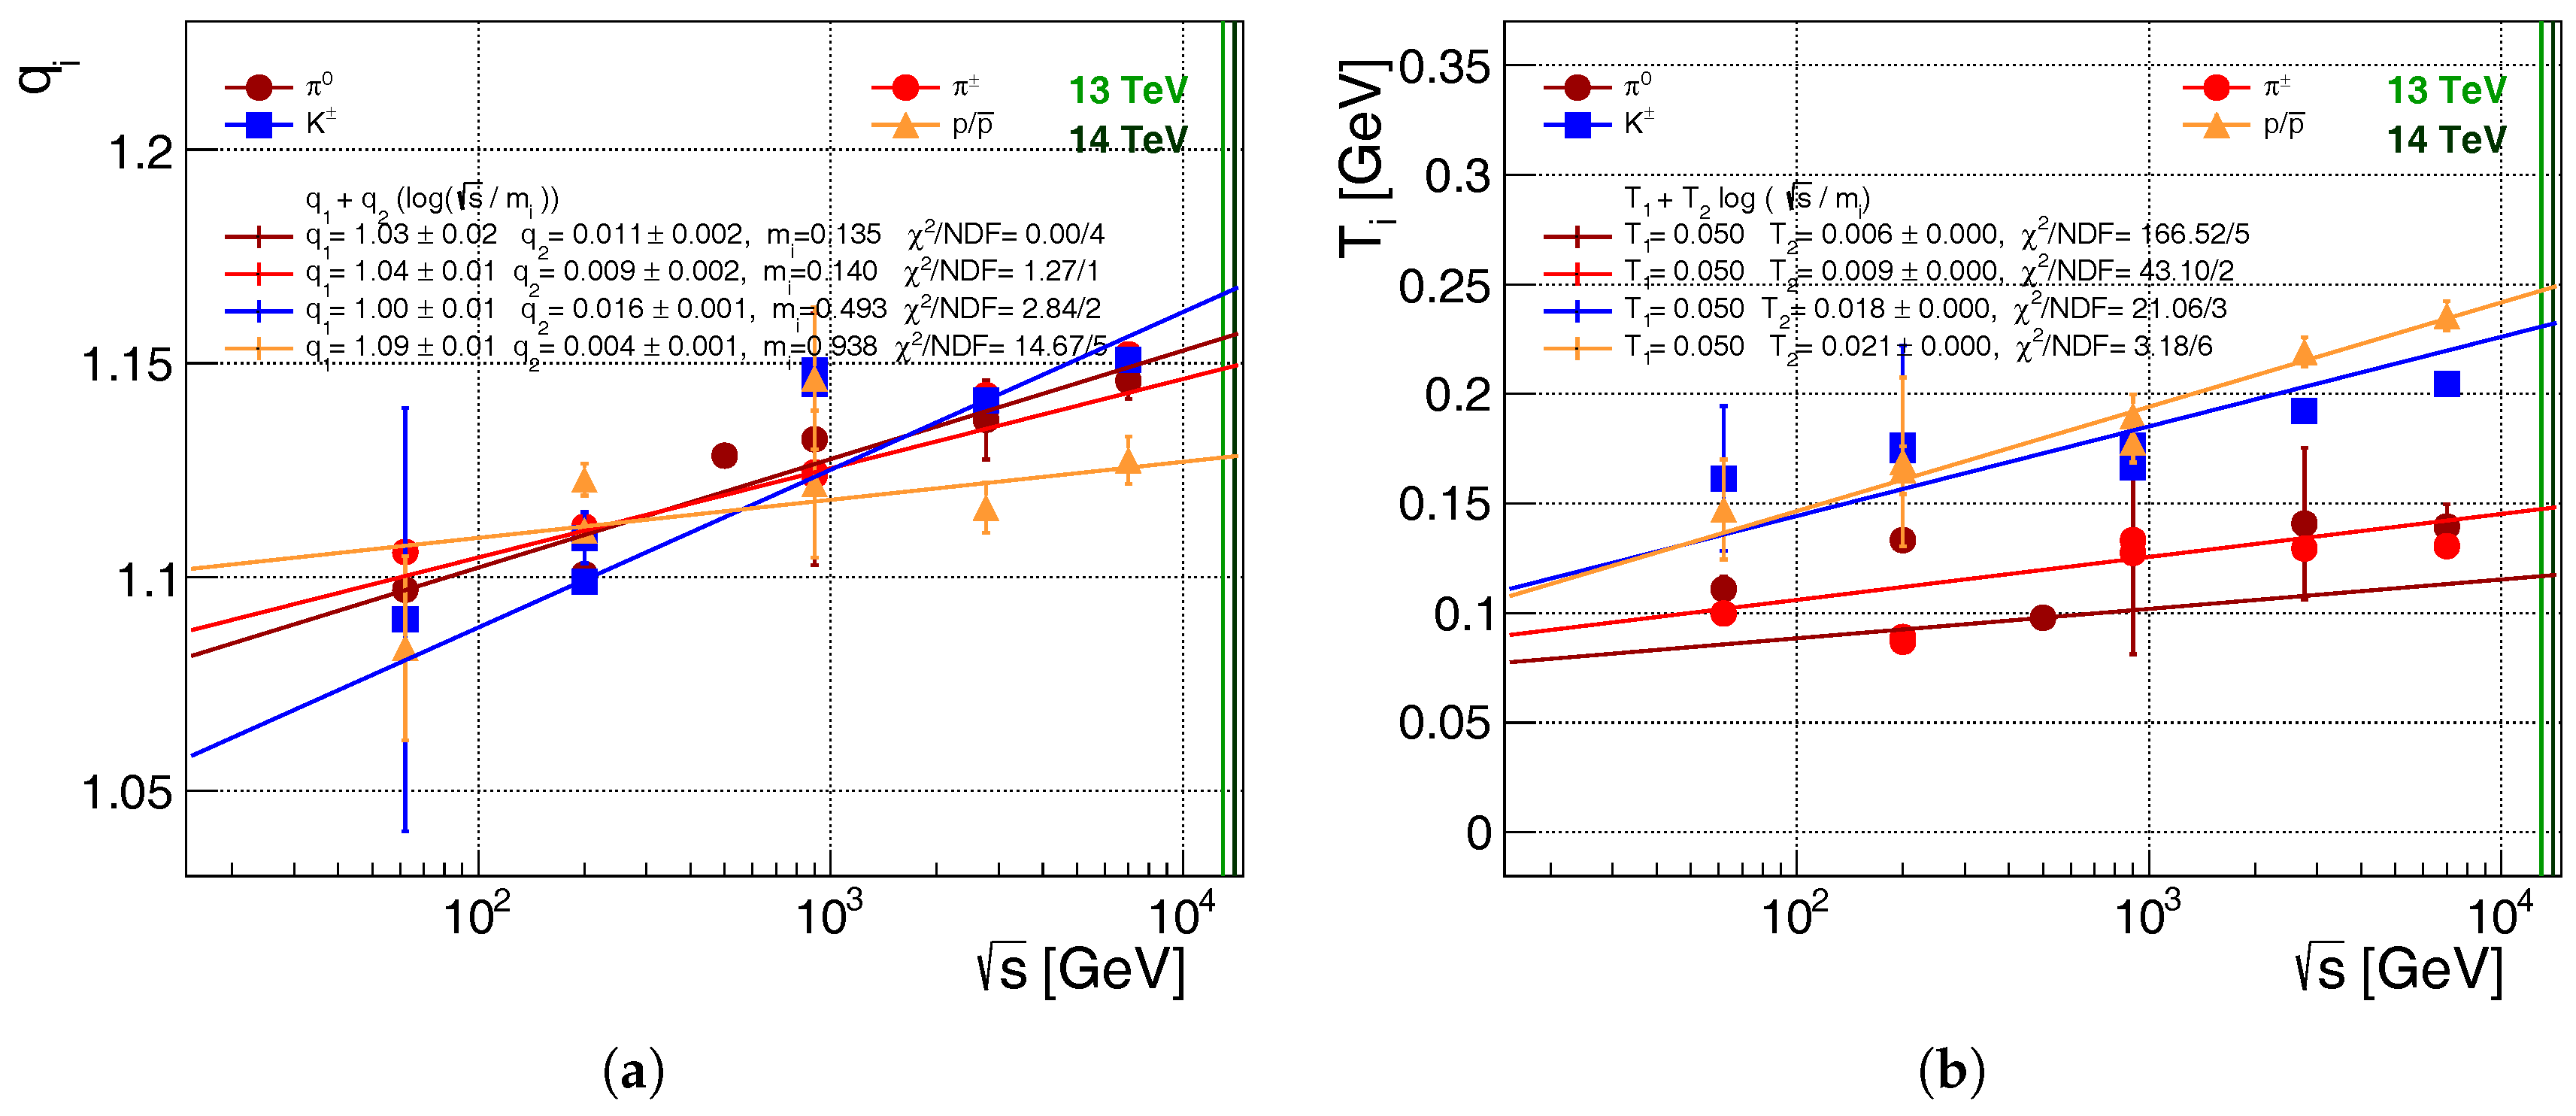
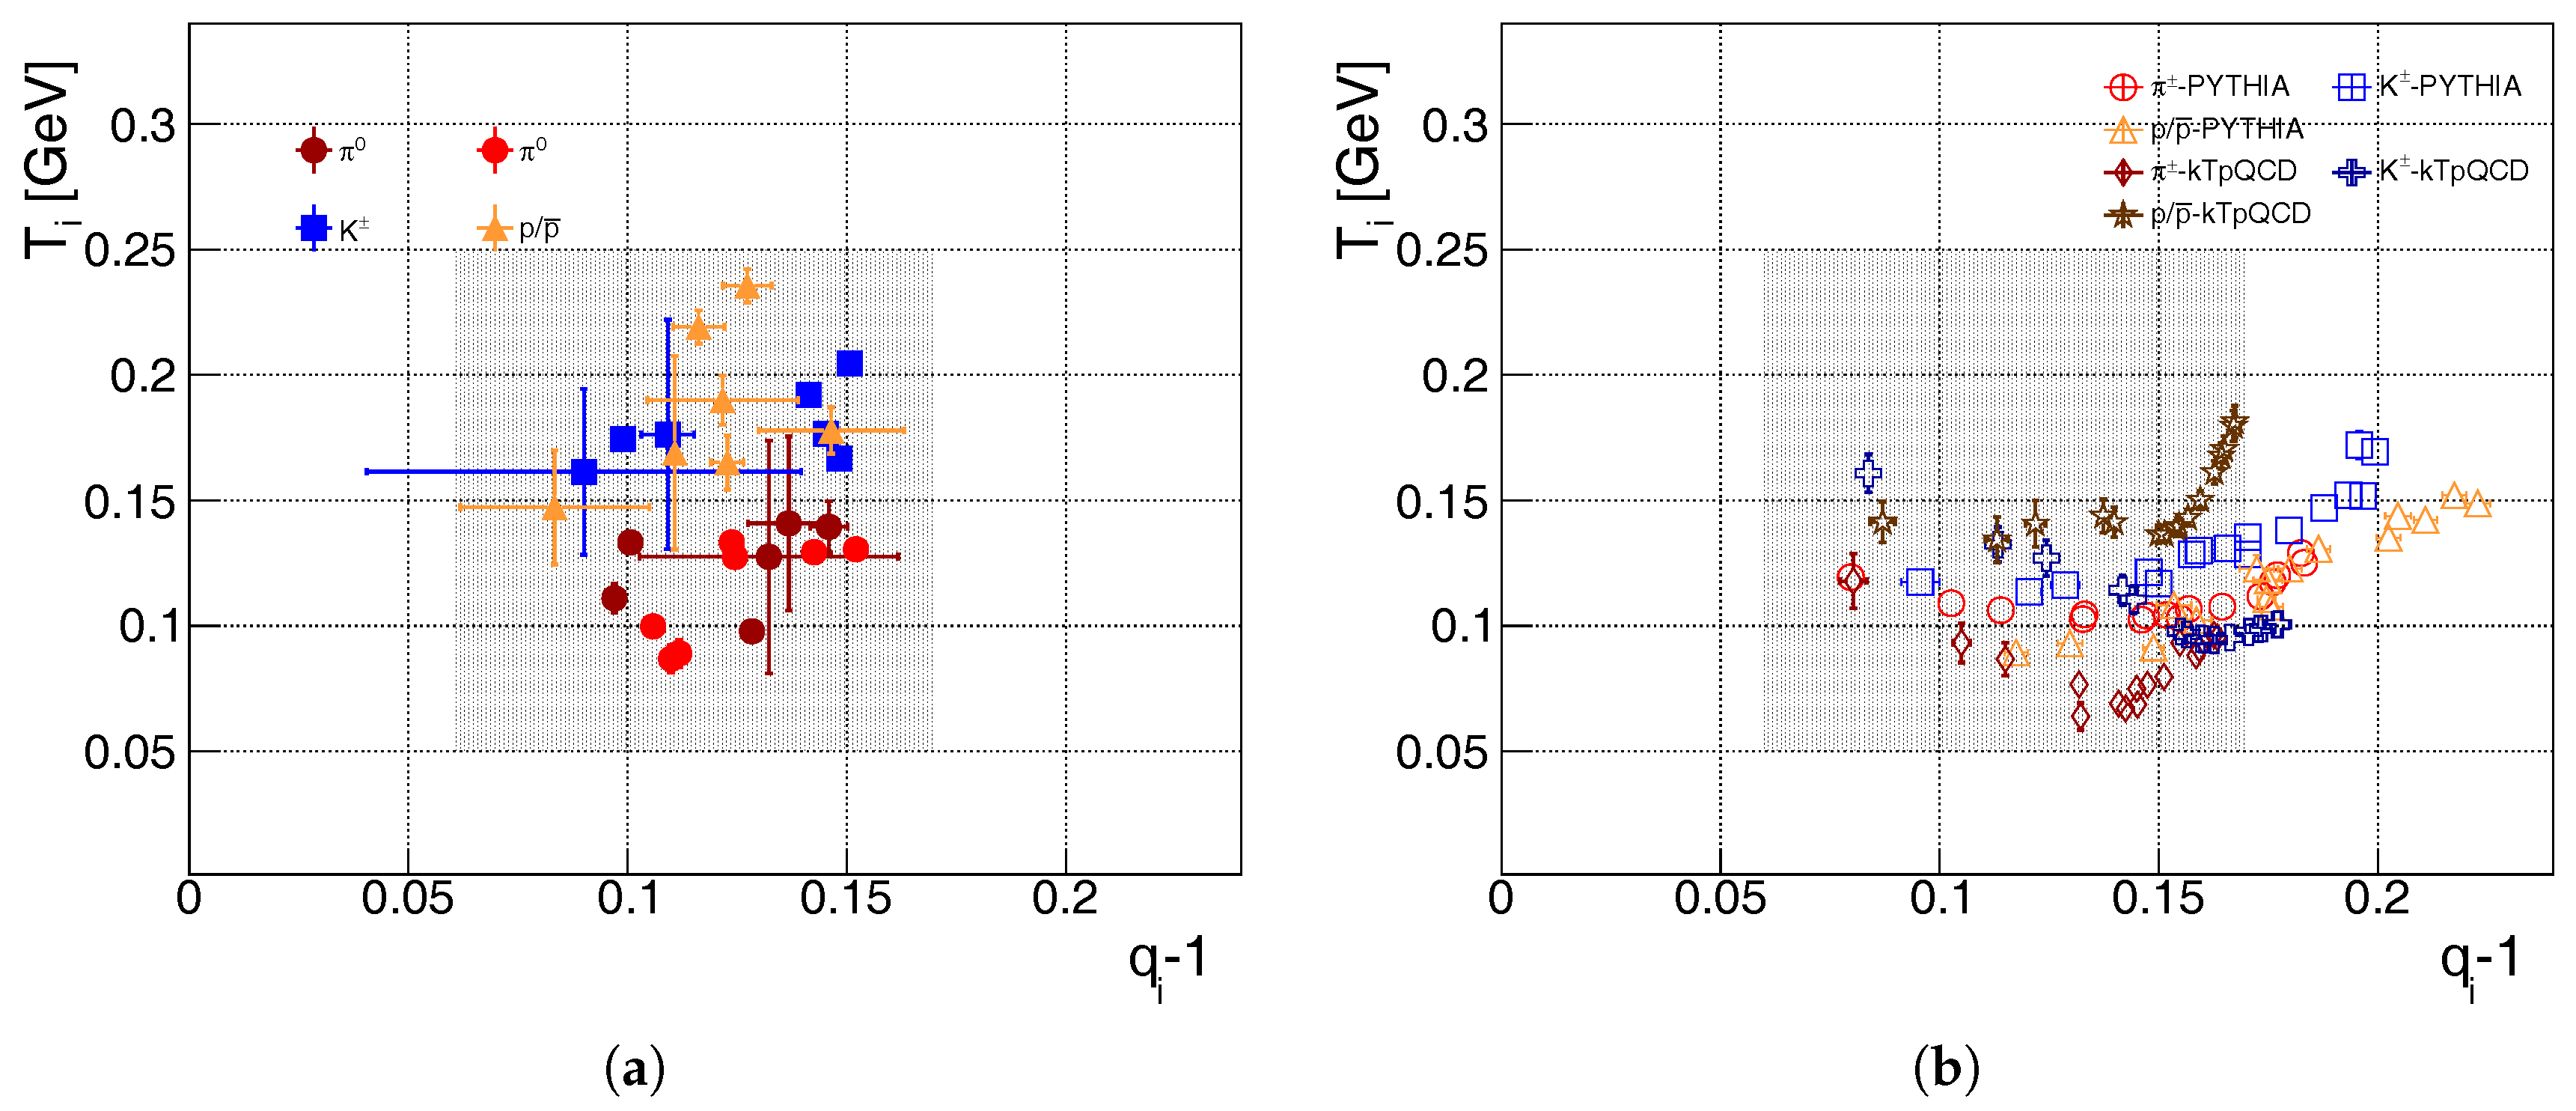
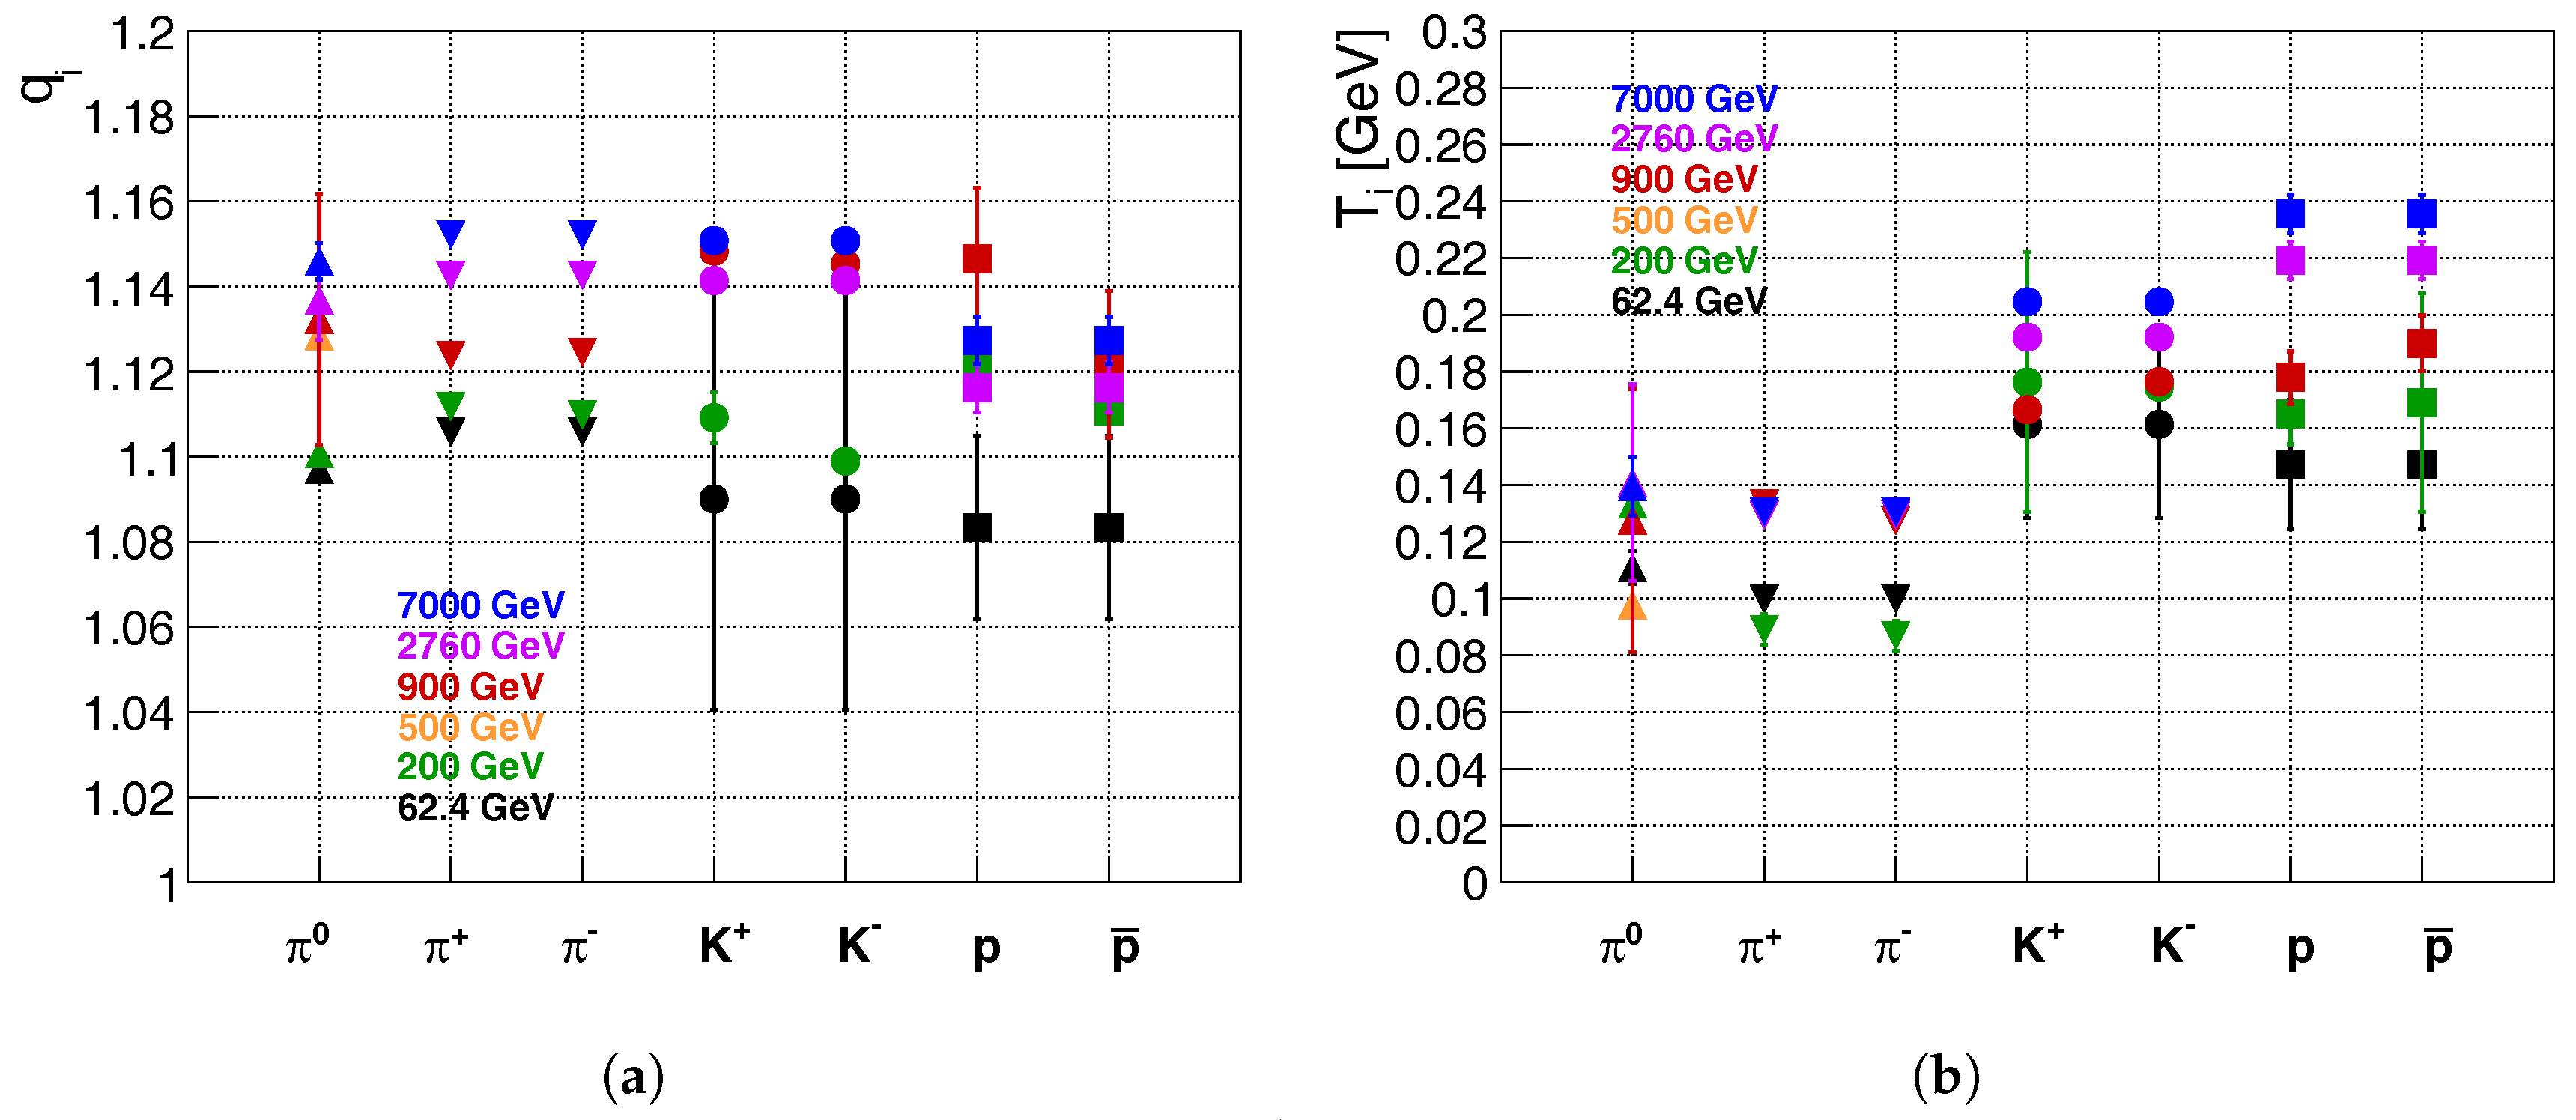
4.1. The Parameter Space for Identified Hadrons
- The obtained function increases with in the range 1.07–1.17 indicating the deviation from the Boltzmann–Gibbs case where . The deviation from this “thermodynamical limit” case grows as the center-of-mass energy gets higher values. However large statistical errorbars correspond to the lack of statistics in specific particle identification methods of the measurements. (See more in Appendix B.)
- The kinetical temperature parameters almost keep constant values, with the following hadron (mass) hierarchy: = 120–140 MeV, = 120–200 MeV, and = 70–240 MeV.
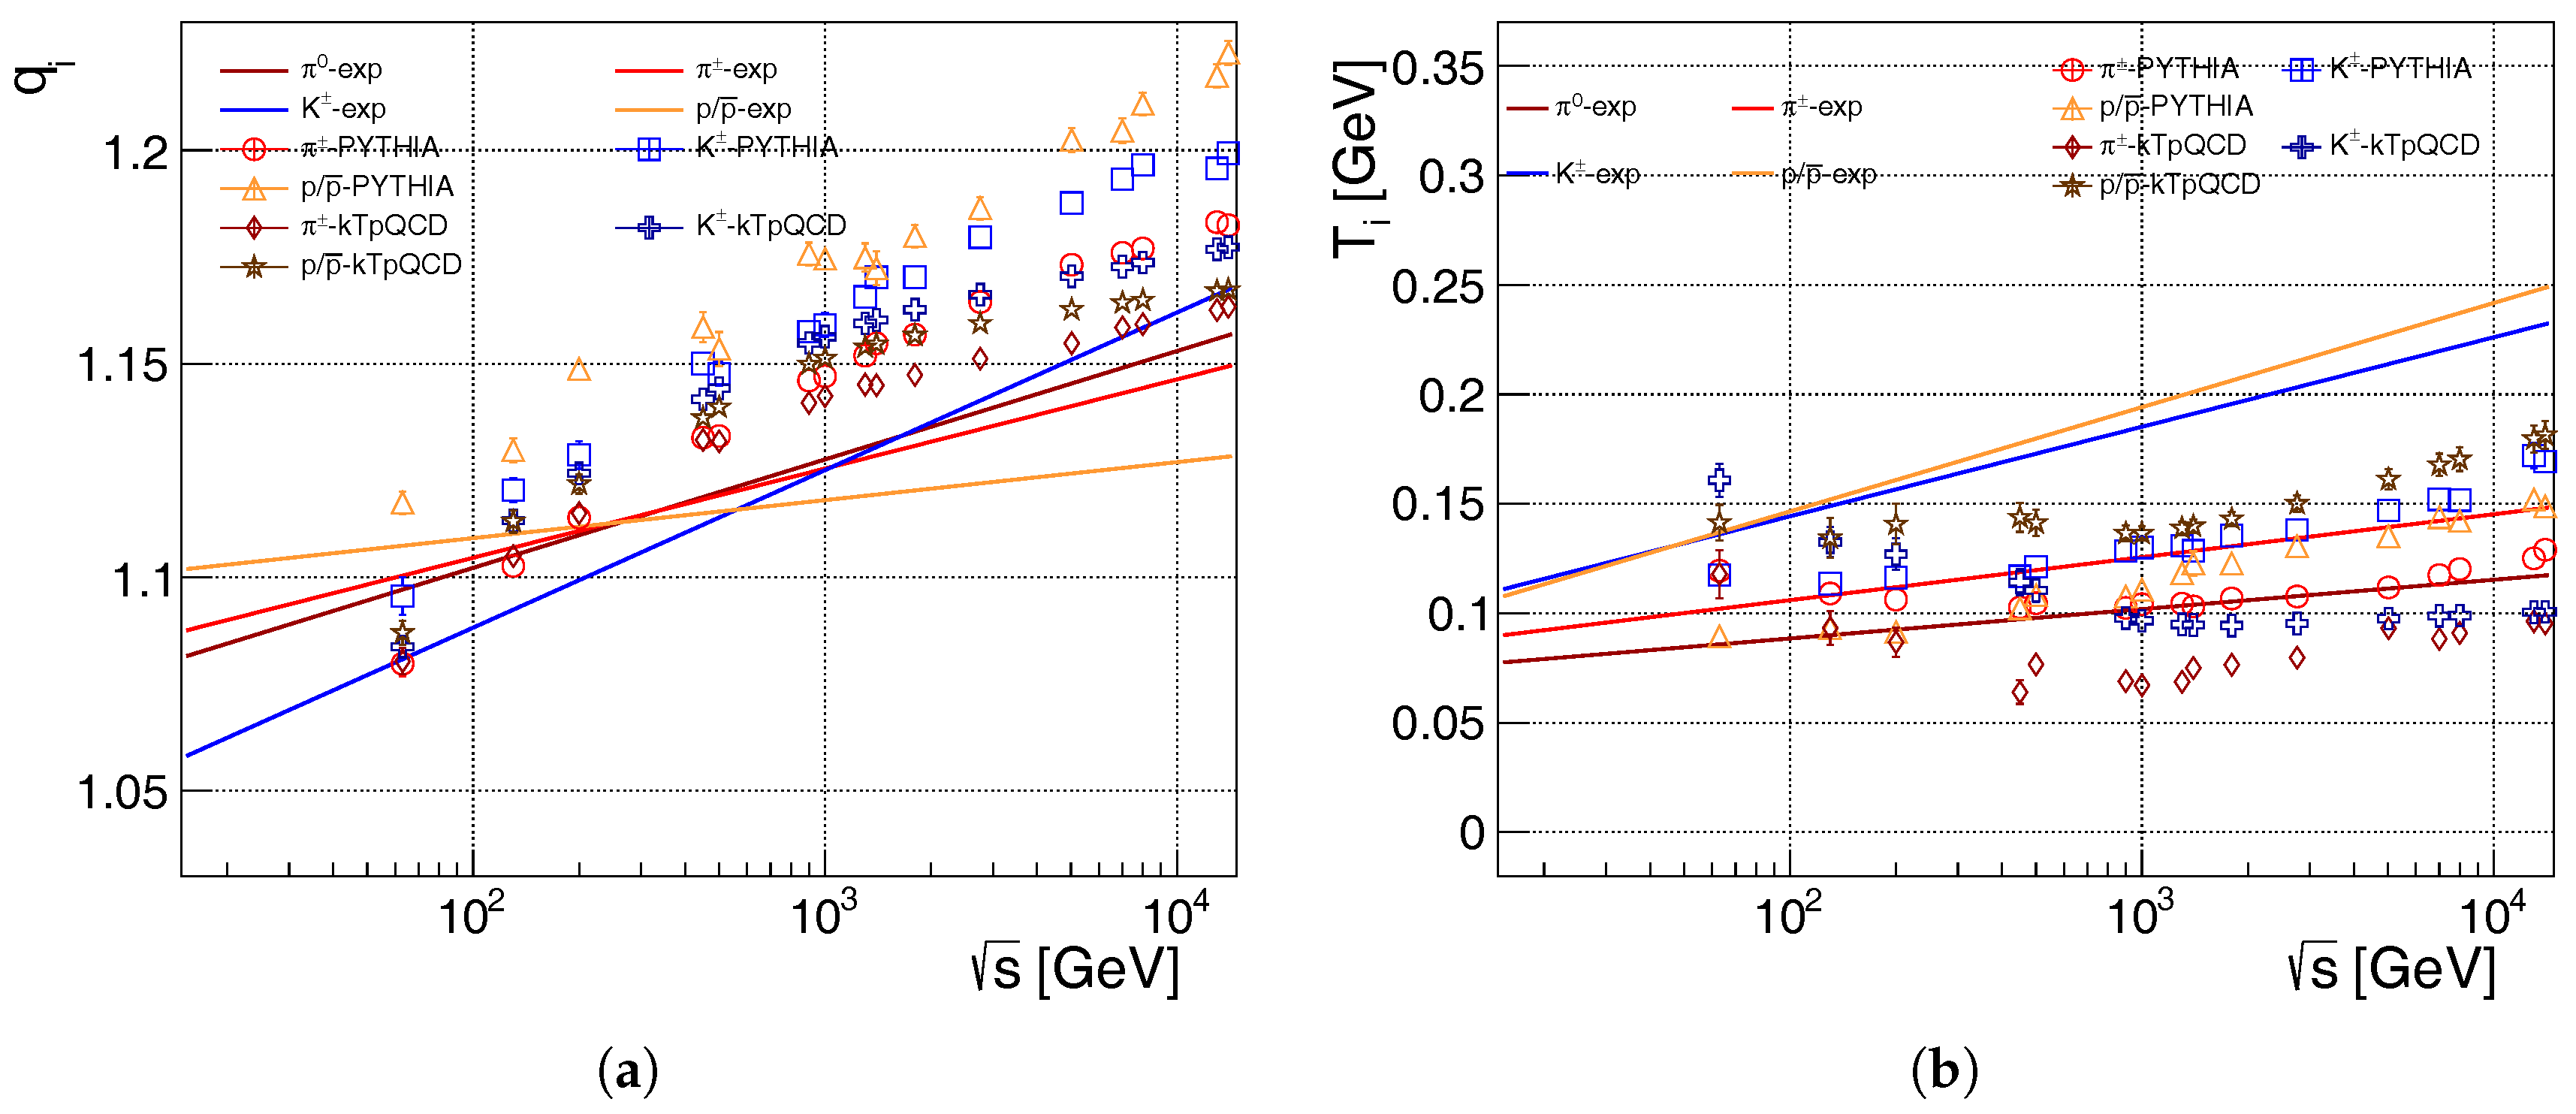
PYTHIA8
kTpQCD_v20
Non-extensivity, :
Temperature-like, :
5. Comparison with the Improved Quark-Coalescence Model
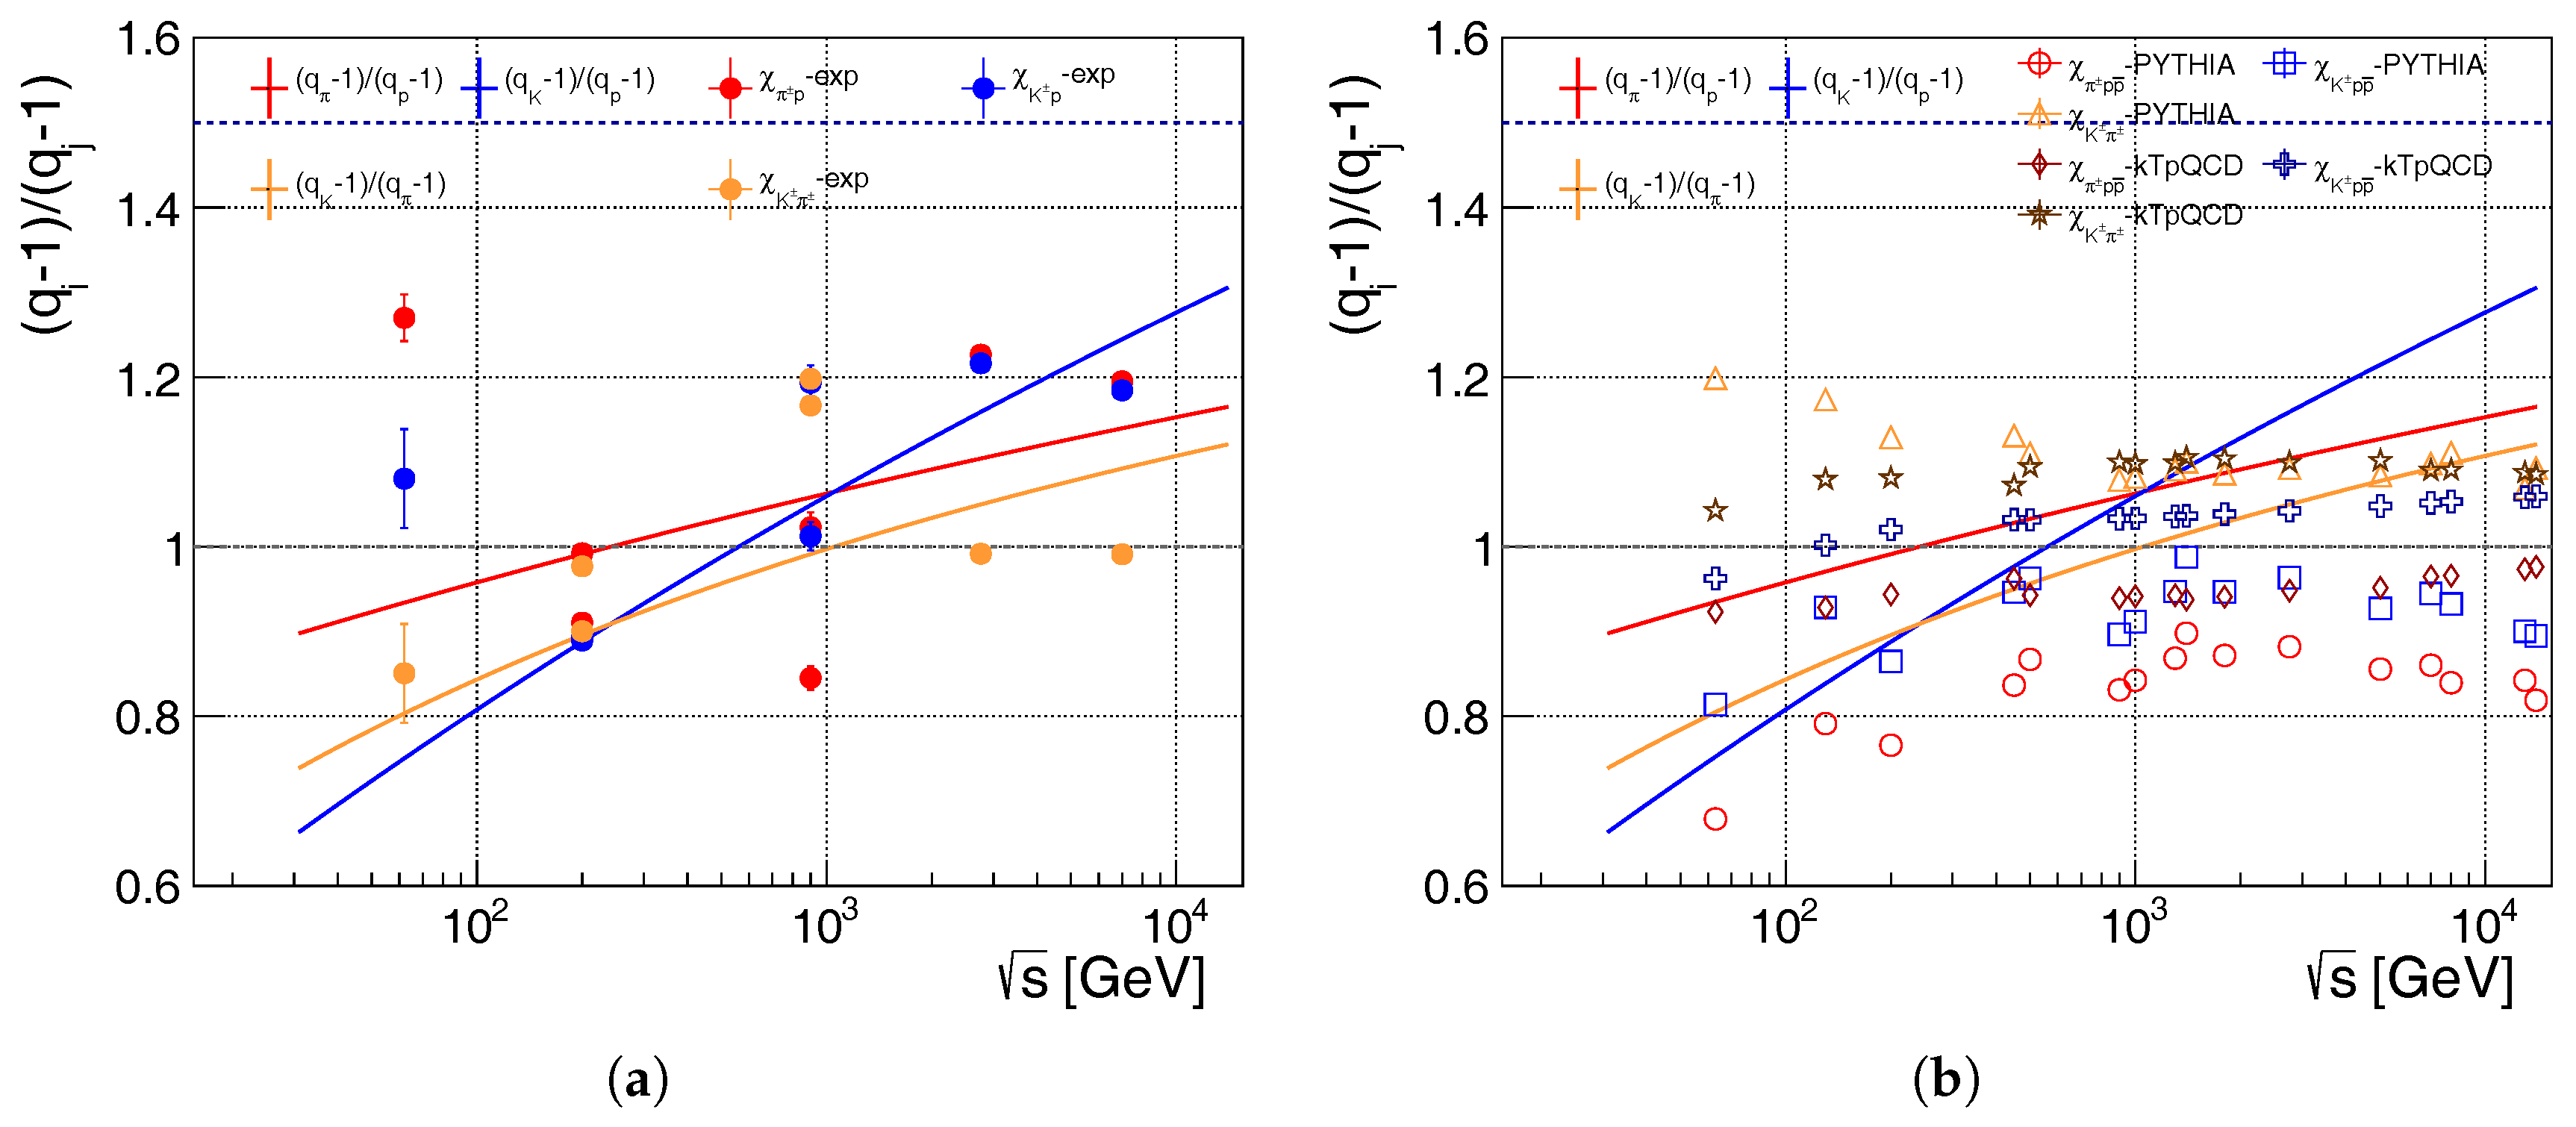
5.1. Connecting Non-Extensivity with the Quark-Coalescence Model
- the fit curves lie below the dashed line with the value of within the c.m. energy range;
- the kaon-pion ratio shoots over the expected value, 1, a bit.
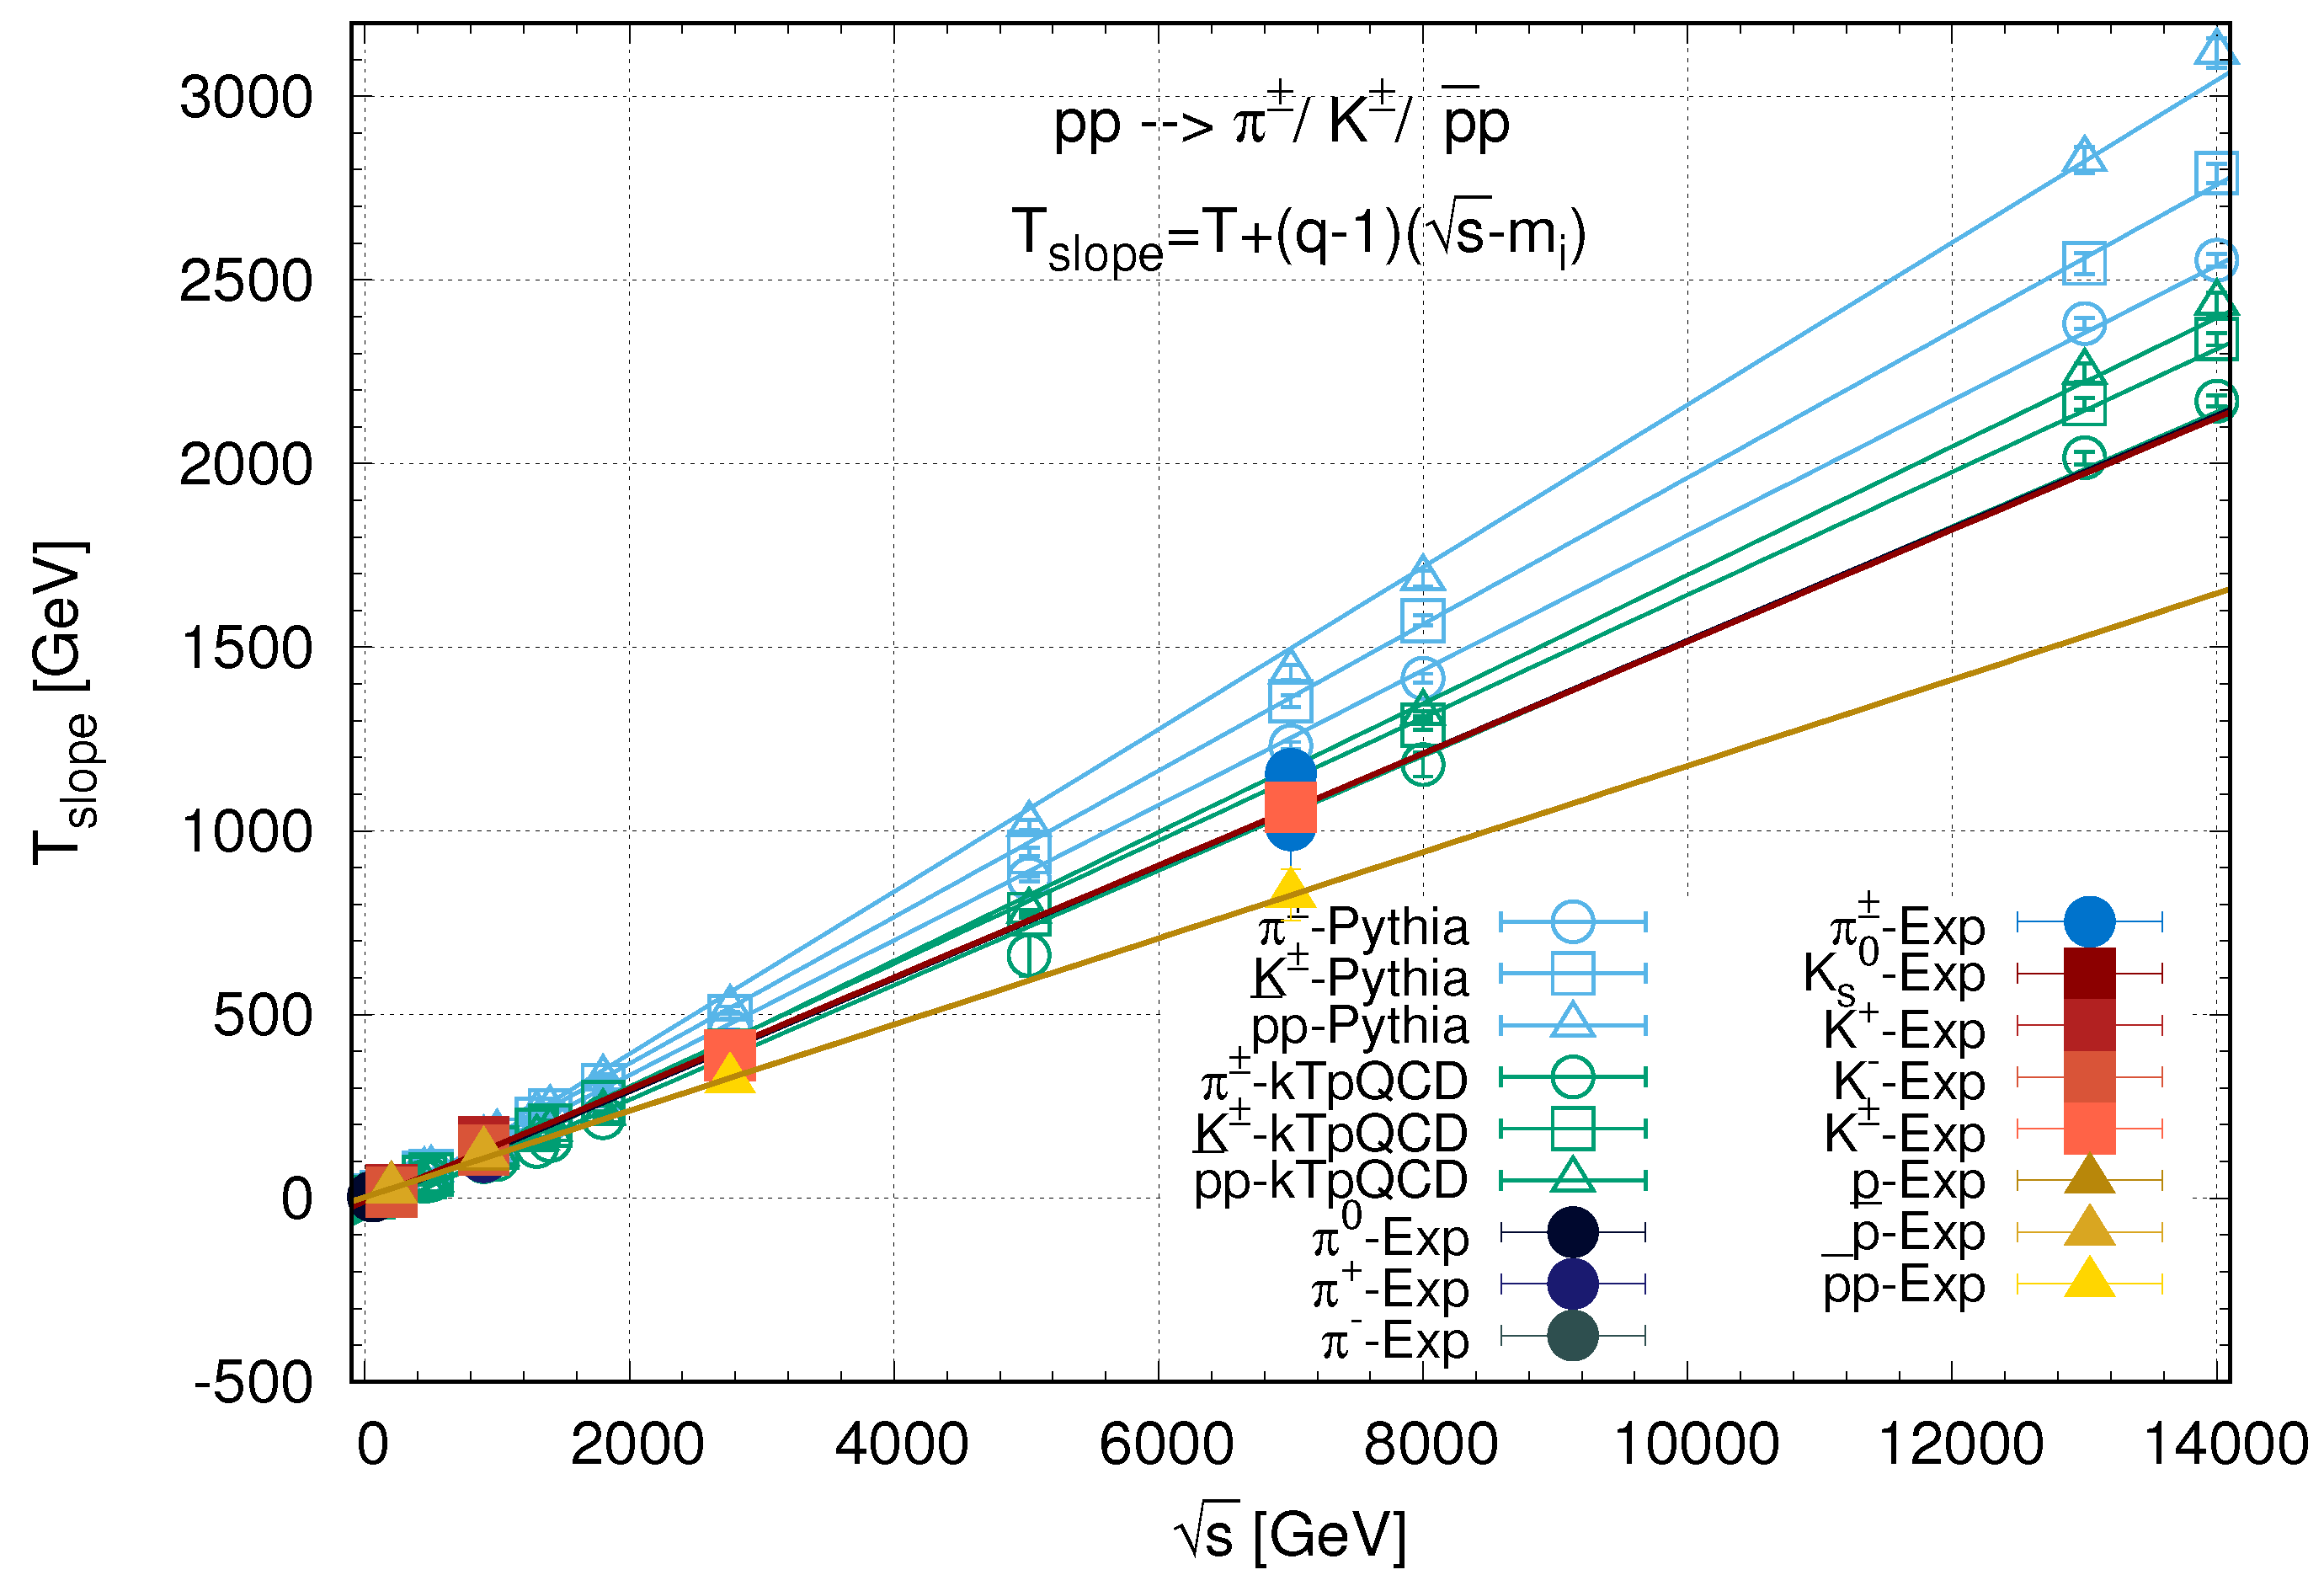
5.2. Investigating the in the Quark-Coalescence Model
6. Summary and Discussion
- (i)
- for the evolution, kTpQCD_v20 agrees more with the power-law related non-extensivity parameter ;
- (ii)
- PYTHIA8 results correspond well with the measured evolution.
Acknowledgments
Author Contributions
Conflicts of Interest
Abbreviations
| ALICE | A Large Ion Colliding Experiment |
| BNL | Brookhave National Laboratory |
| CERN | Conseil Européen pour la Recherche Nucléaire |
| CM | Center-of-mass |
| DGLAP | Dokshitzer–Gribov–Lipatov–Altarelli–Parisi |
| FF | Fragmentation Function |
| LHC | Large Hadron Collider |
| NBD | Negative Binomial Distribution |
| NDF | Number of Degrees of Freedom |
| PHENIX | A Physics Experiment at RHIC |
| Parton Distribution Function | |
| RHIC | Relativistic Heavy Ion Collider |
| (p)QCD | (perturbative) Quantum Chromo Dynamics |
| STAR | Solenoidal Tracker at RHIC |
| QGP | Quark Gluon Plasma |
Appendix A

| (GeV) | Hadron | q | T (GeV) | A | ndf | Experiment |
|---|---|---|---|---|---|---|
| 62 | 1.073 ± 0.011 | 0.139 ± 0.027 | 121.252 ± 100.460 | 7.857/11 | PHENIX [57] | |
| 200 | 1.101 ± 0.002 | 0.133 ± 0.003 | 149.459 ± 15.459 | 6.450/14 | PHENIX [34] | |
| 500 | 1.128 ± 0.000 | 0.098 ± 0.000 | 746.070 ± 0.527 | 3656.733/25 | PHENIX [60] | |
| 900 | 1.132 ± 0.029 | 0.128 ± 0.046 | 302183.366 ± 321455.697 | 0.462/10 | ALICE [35] | |
| 2760 | 1.137 ± 0.009 | 0.141 ± 0.035 | 4.937 ± 5.116 | 0.237/15 | ALICE [63] | |
| 7000 | 1.146 ± 0.004 | 0.140 ± 0.010 | 498950.603 ± 133429.129 | 1.143/30 | ALICE [35] | |
| 62 | 1.106 ± 0.000 | 0.100 ± 0.000 | 245.248 ± 0.000 | 4.276/23 | PHENIX [34] | |
| 200 | 1.112 ± 0.001 | 0.089 ± 0.005 | 39.389 ± 14.396 | 58.248/11 | STAR [59] | |
| 200 | 1.110 ± 0.001 | 0.087 ± 0.005 | 48.554 ± 18.250 | 75.053/11 | STAR [59] | |
| 900 | 1.124 ± 0.000 | 0.133 ± 0.000 | 4.496 ± 0.000 | 4.413/12 | ALICE [61] | |
| 900 | 1.124 ± 0.002 | 0.127 ± 0.001 | 5.240 ± 0.082 | 10.816/30 | ALICE [61] | |
| 2760 | 1.143 ± 0.000 | 0.129 ± 0.000 | 12.546 ± 0.000 | 3.929/60 | ALICE [62] | |
| 7000 | 1.152 ± 0.000 | 0.131 ± 0.000 | 14.544 ± 0.000 | 5.750/55 | ALICE [64,65] | |
| 62 | 1.090 ± 0.050 | 0.161 ± 0.033 | 3.142 ± 1.155 | 0.192/13 | PHENIX [34] | |
| 200 | 1.109 ± 0.001 | 0.122 ± 0.002 | 0.902 ± 0.187 | 31.664/12 | STAR [59] | |
| 200 | 1.083 ± 0.005 | 0.199 ± 0.116 | 0.091 ± 0.058 | 17.189/11 | STAR [59] | |
| 900 | 1.148 ± 0.000 | 0.167 ± 0.000 | 0.203 ± 0.000 | 6.932/24 | ALICE [61] | |
| 900 | 1.145 ± 0.000 | 0.176 ± 0.000 | 0.186 ± 0.000 | 19.465/24 | ALICE [61] | |
| 2760 | 1.141 ± 0.002 | 0.192 ± 0.004 | 0.434 ± 0.022 | 2.793/55 | ALICE [62] | |
| 7000 | 1.151 ± 0.000 | 0.205 ± 0.000 | 0.500 ± 0.000 | 3.756/48 | ALICE [64,65] | |
| 62 | 1.083 ± 0.022 | 0.147 ± 0.023 | 1.240 ± 0.440 | 4.722/24 | PHENIX [34] | |
| 200 | p | 1.118 ± 0.001 | 0.070 ± 0.001 | 10.205 ± 13.089 | 15.983/11 | STAR [59] |
| 200 | 1.109 ± 0.001 | 0.074 ± 0.003 | 9.945 ± 2.227 | 26.393/11 | STAR [59] | |
| 900 | p | 1.146 ± 0.017 | 0.178 ± 0.009 | 0.053 ± 0.003 | 13.758/21 | ALICE [61] |
| 900 | 1.122 ± 0.017 | 0.190 ± 0.010 | 0.049 ± 0.002 | 13.337/21 | ALICE [61] | |
| 2760 | 1.116 ± 0.006 | 0.219 ± 0.007 | 0.110 ± 0.005 | 2.232/45 | ALICE [62] | |
| 7000 | 1.127 ± 0.006 | 0.236 ± 0.007 | 0.117 ± 0.005 | 2.556/46 | ALICE [64,65] |
Appendix B
| (TeV) | Rapidity | Particle | Range [GeV/c] | Experiment |
|---|---|---|---|---|
| 0.062 | PHENIX [57] | |||
| PHENIX [34] | ||||
| 0.2 | PHENIX [58] | |||
| STAR [59] | ||||
| 0.5 | PHENIX [60] | |||
| 0.9 | ALICE [35] | |||
| ALICE [61] | ||||
| 2.76 | ALICE [63] | |||
| ALICE [62] | ||||
| 7 | ALICE [35] | |||
| ALICE [64,65] | ||||
References
- Gell-Mann, M.; Tsallis, C. Possible generalization of Boltzmann-Gibbs statistics. In Nonextensive Entropy-Interdisciplinary Applications; Oxford University Press: Oxford, UK, 2004. [Google Scholar]
- Tsallis, C. Introduction to Nonextensive Statistical Mechanics; Springer: New York, NY, USA, 2009. [Google Scholar]
- Sébenne, C.; Morrison, G. Nonextensive statistical mechanics: New trends, new perspectives. Europhys. News Spec. Issue 2005, 36. [Google Scholar] [CrossRef]
- Tarmissi, K.; Hamza, A.B. Information-theoretic hashing of 3D objects using graph theory. Expert Syst. Appl. 2009, 36, 9409–9414. [Google Scholar] [CrossRef]
- Khader, M.; Hamza, A.B. An information-theoretic method for multimodality medical image registration. Expert Syst. Appl. 2012, 39, 5548–5556. [Google Scholar] [CrossRef]
- Furuichi, S.; Mitroi-Symeonidis, F.C.; Symeonidis, E. On Some Properties of Tsallis Hypoentropies and Hypodivergences. Entropy 2014, 16, 5377–5399. [Google Scholar] [CrossRef]
- List of Application of the Tsallis Distribution. Available online: http://tsallis.cat.cbpf.br/biblio.htm (accessed on 27 January 2017).
- Jaffe, A.; Witten, E. Quantum Yang-Mills theory, Official Problem Description. Available online: http://www.claymath.org/sites/default/files/yangmills.pdf (accessed on 27 January 2017).
- Ürmössy, K.; Barnaföldi, G.G.; Biró, T.S. Generalised Tsallis Statistics in Electron-Positron Collisions. Phys. Lett. B 2011, 701, 111–116. [Google Scholar] [CrossRef]
- Ürmössy, K.; Biró, T.S. Cooper-Frye Formula and Non-extensive Coalescence at RHIC Energy. Phys. Lett. B 2010, 689, 14–17. [Google Scholar] [CrossRef]
- Ürmössy, K.; Biró, T.S.; Barnaföldi, G.G.; Xu, Z. Disentangling Soft and Hard Hadron Yields in PbPb Collisions at = 2.76. arXiv 2014. [Google Scholar]
- Ürmössy, K.; Biró, T.S.; Barnaföldi, G.G.; Xu, Z. v2 of charged hadrons in a ‘soft + hard’ model for PbPb collisions at = 2.76. arXiv 2014. [Google Scholar]
- Barnaföldi, G.G.; Ürmössy, K.; Bíró, G. A ’soft + hard’ model for Pion, Kaon, and Proton Spectra and v2 measured in PbPb Collisions at = 2.76 ATeV. J. Phys. Conf. Ser. 2015, 612, 012048. [Google Scholar] [CrossRef]
- Biró, T.S.; Purcsel, G.; Ürmössy, K. Non-Extensive Approach to Quark Matter. Eur. Phys. J. 2009, A40, 325–340. [Google Scholar] [CrossRef]
- Cleymans, J.; Lykasov, G.I.; Parvan, A.S.; Sorin, A.S.; Teryaev, O.V.; Worku, D. Systematic properties of the Tsallis Distribution: Energy Dependence of Parameters in High-Energy p-p Collisions. Phys. Lett. B 2013, 723, 351–354. [Google Scholar] [CrossRef]
- Cleymans, J.; Azmi, M.D. Large Transverse Momenta and Tsallis Thermodynamics. J. Phys. Conf. Ser. 2016, 668, 012050. [Google Scholar] [CrossRef]
- Wong, C.; Wilk, G.; Cirto, L.J.L.; Tsallis, C. From QCD-based hard-scattering to nonextensive statistical mechanical descriptions of transverse momentum spectra in high-energy pp and p collisions. Phys. Rev. D 2015, 91, 114027. [Google Scholar] [CrossRef]
- Wong, C.; Wilk, G.; Cirto, L.J.L.; Tsallis, C. Possible Implication of a Single Nonextensive pTpT Distribution for Hadron Production in High-Energy pp Collisions. EPJ Web Conf. 2015, 90, 04002. [Google Scholar] [CrossRef]
- Wilk, G.; Wlodarczyk, Z. Multiplicity fluctuations and temperature fluctuations in high-energy nuclear collisions. Phys. Rev. C 2009, 79, 054903. [Google Scholar] [CrossRef]
- Wilk, G.; Wlodarczyk, Z. On Possible Origins of Power-law distributions. AIP Conf. Proc. 2013, 1558, 893. [Google Scholar]
- Tsallis, C. Possible generalization of Boltzmann-Gibbs statistics. J. Stat. Phys. 1988, 52, 479–487. [Google Scholar] [CrossRef]
- Wilk, G.; Włodarczyk, Z. Tsallis Distribution Decorated with Log-Periodic Oscillation. Entropy 2015, 17, 384–400. [Google Scholar] [CrossRef]
- Wilk, G.; Włodarczyk, Z. Quasi-power Law Ensembles. Acta Phys. Pol. B 2015, 46, 1103–1122. [Google Scholar] [CrossRef]
- Wilk, G.; Włodarczyk, Z. Quasi-power laws in multiparticle production processes. Chaos Solitons Fract. 2015, 81, 487–496. [Google Scholar] [CrossRef]
- Zheng, H.; Lilin, Z. Can Tsallis Distribution Fit All the Particle Spectra Produced at RHIC and LHC? Adv. High Energy Phys. 2015, 2015, 180491. [Google Scholar] [CrossRef]
- Zheng, H.; Lilin, Z.; Bonasera, A. Systematic analysis of hadron spectra in p + p collisions using Tsallis distributions. Phys. Rev. D 2015, 92, 074009. [Google Scholar] [CrossRef]
- Cleymans, J. On the Use of the Tsallis Distribution at LHC Energies. arXiv 2016. [Google Scholar]
- Cleymans, J. The Tsallis Distribution for p ‒ p collisions at the LHC. J. Phys. Conf. Ser. 2013, 455, 012049. [Google Scholar] [CrossRef]
- Bjorken, J.D. Asymptotic Sum Rules at Infinite Momentum. Phys. Rev. 1969, 179, 1547. [Google Scholar] [CrossRef]
- PHENIX Collaboration. Measurement of and K*0 in p + p, d+Au and Cu+Cu collisions at = 200 GeV. Phys. Rev. C 2014, 90, 054905. [Google Scholar]
- STAR Collaboration. Strange particle production in p + p collisions at = 200 GeV. Phys. Rev. C 2007, 75, 064901. [Google Scholar]
- CMS Collaboration. Study of the inclusive production of charged pions, kaons, and protons in pp collisions at = 0.9, 2.76, and 7 TeV. Eur. Phys. J. C 2012, 72, 2164. [Google Scholar]
- ATLAS Collaboration. Charged-particle multiplicities in pp interactions measured with the ATLAS detector at the LHC. New J. Phys. 2011, 13, 053033. [Google Scholar]
- PHENIX Collaboration. Identified charged hadron production in p + p collisions at = 200 and 62.4 GeV. Phys. Rev. C 2011, 83, 064903. [Google Scholar]
- ALICE Collaboration. Neutral pion and η meson production in proton-proton collisions at = 0.9 TeV and = 7 TeV. Phys. Lett. B 2012, 717, 162–172. [Google Scholar]
- Hagedorn, R. Multiplicities, pT distributions and the expected hadron → quark-gluon phase transition. Nuovo Cimento 1983, 6, 1–50. [Google Scholar]
- UA1 Collaboration. Transverse momentum spectra for charged particles at the CERN proton-antiproton collider. Phys. Lett. B 1982, 118, 167–172. [Google Scholar]
- UA1 Collaboration. Production of Low Transverse Energy Clusters in anti-p p Collisions at = 0.2-TeV to 0.9-TeV and their Interpretation in Terms of QCD Jets. Nucl. Phys. B 1988, 309, 405–425. [Google Scholar]
- Michael, C.; Vanryckeghem, L. Consequences of momentum conservation for particle production at large transverse momentum. J. Phys. G Nucl. Phys. 1977, 3, L151. [Google Scholar] [CrossRef]
- Michael, C. Large transverse momentum and large mass production in hadronic interactions. Prog. Part. Nucl. Phys. 1979, 2, 1–39. [Google Scholar] [CrossRef]
- Biró, T.S.; Ván, P.; Barnaföldi, G.G.; Ürmössy, K. Statistical Power Law due to Reservoir Fluctuations and the Universal Thermostat Independence Principle. Entropy 2014, 16, 6497–6514. [Google Scholar] [CrossRef]
- Biró, T.S.; Ván, P.; Barnaföldi, G.G.; Ván, P. New Entropy Formula with Fluctuating Reservoir. Physica 2015, 417, 215–220. [Google Scholar] [CrossRef]
- Cleymans, J.; Worku, D. The Tsallis distribution in proton–proton collisions at = 0.9 TeV at the LHC. J. Phys. G 2012, 39, 025006. [Google Scholar] [CrossRef]
- Santos, A.P.; Pereira, F.I.M.; Silva, R.; Alcaniz, J.S. Consistent nonadditive approach and nuclear equation of state. J. Phys. G 2014, 41, 055105. [Google Scholar] [CrossRef]
- Deppman, A. Properties of hadronic systems according to the nonextensive self-consistent thermodynamics. J. Phys. G 2014, 41, 055108. [Google Scholar] [CrossRef]
- Megías, E.; Menezes, D.P.; Deppman, A. Non extensive thermodynamics for hadronic matter with finite chemical potentials. Physica A 2015, 421, 15–24. [Google Scholar] [CrossRef]
- Biró, T.S. Is there a Temperature? Conceptual Challenges at High Energy, Acceleration and Complexity; Springer: Berlin/Heidelberg, Germany, 2011. [Google Scholar]
- Biró, T.S.; Ván, P.; Barnaföldi, G.G.; Ván, P. Quark-gluon plasma connected to finite heat bath. Eur. Phys. J. 2013, A49, 110. [Google Scholar] [CrossRef]
- Altarelli, G.; Parisi, G. Asymptotic Freedom in Parton Language. Nucl.Phys. B 1977, 126, 298–318. [Google Scholar] [CrossRef]
- Dokshitser, Y. L. Calculation of structure functions of deep-inelastic scattering and e + e-annihilation by perturbation theory in quantum chromodynamics. Sov. Phys. JETP 1977, 46, 641–653. [Google Scholar]
- Gribov, V.N.; Lipatov, L.N. Deep inelastic e p scattering in perturbation theory. Sov. J. Nucl. Phys. 1972, 15, 438–450. [Google Scholar]
- Patrignani, C.; Agashe, K.; Aielli, G.; Amsler, C.; Antonelli, M.; Asner, D.M.; Baer, H.; Banerjee, S.; Barnett, R.M.; Basaglia, T.; et al. Particle Data Group. Chin. Phys. C 2016, 40, 100001. [Google Scholar]
- Altarelli, G.; Ellis, R.K.; Martinelli, G. Leptoproduction and Drell-Yan processes beyond the leading approximation in chromodynamics. Nucl. Phys. B 1978, 143, 521–545. [Google Scholar] [CrossRef]
- Barnaföldi, G.G.; Biró, T. S.; Ürmössy, K.; Kalmár, G. Tsallis-Pareto-like distributions in hadron-hadron collisions. Gribov-80 Memorial Volume: Quantum Chromodynamics and Beyond. J. Phys. Conf. Ser. 2010, 270, 012008. [Google Scholar] [CrossRef]
- Biró, T.S.; Ürmössy, K. ALCOR. Eur. Phys. J. Spec. Top. 2008, 155, 1–12. [Google Scholar] [CrossRef]
- Biró, T.S.; Lévai, P.; Zimányi, J. ALCOR: A dynamical model for hadronization. Phys. Lett. B. 1995, 347, 6–12. [Google Scholar] [CrossRef]
- PHENIX Collaboration. Inclusive cross section and double helicity asymmetry for π0 production in p + p collisions at = 62.4 GeV. Phys. Rev. D 2009, 79, 012003. [Google Scholar]
- PHENIX Collaboration. Mid-Rapidity Neutral Pion Production in Proton-Proto Collisions at = 200 GeV. Phys. Rev. Lett. 2003, 91, 241803. [Google Scholar]
- STAR Collaboration. Identified hadron compositions in p + p and Au+Au collisions at high transverse momenta at = 200 GeV. Phys. Rev. Lett. 2012, 108, 072302. [Google Scholar]
- PHENIX Collaboration. Inclusive cross section and double-helicity asymmetry for π0 production at midrapidity in p + p collisions at = 510 GeV. Phys. Rev. D 2016, 93, 011501. [Google Scholar]
- ALICE Collaboration. Production of pions, kaons and protons in pp collisions at = 900 GeV with ALICE at the LHC. Eur. Phys. J. C 2010, 71, 1655. [Google Scholar]
- ALICE Collaboration. Production of charged pions, kaons and protons at large transverse momenta in pp and Pb-Pb collisions at = 2.76 TeV. Phys. Lett. B 2014, 736, 196–207. [Google Scholar]
- ALICE Collaboration. Neutral pion production at midrapidity in pp and Pb-Pb collisions at = 2.76 TeV. Eur. Phys. J. C 2014, 74, 3108. [Google Scholar]
- ALICE Collaboration. Measurement of pion, kaon and proton production in proton-proton collisions at = 7 TeV. Eur. Phys. J. C 2015, 75, 226. [Google Scholar]
- ALICE Collaboration. Multiplicity dependence of charged pion, kaon, and (anti)proton production at large transverse momentum in p-Pb collisions at = 5.02 TeV. Phys. Lett. B 2016, 760, 720. [Google Scholar]
- Ürmössy, K. Multiplicity Dependence of Hadron Spectra in Proton-proton Collisions at LHC Energies and Super-statistics. arXiv 2012. [Google Scholar]
- Borsanyi, S.; Fodor, Z.; Guenther, J.; Kampert, K.-H.; Katz, S.D.; Kawanai, T.; Kovacs, T.G.; Mages, S.W.; Pasztor, A.; Pittler, F.; et al. Calculation of the axion mass based on high-temperature lattice quantum chromodynamics. Nature 2016, 539, 69–71. [Google Scholar] [CrossRef] [PubMed]
- Sjostrand, T.; Mrenna, S.; Skands, P. PYTHIA 6.4 Physics and Manual. J. High Energy Phys. 2006, 5, 026. [Google Scholar] [CrossRef]
- Sjostrand, T.; Mrenna, S.; Skands, P. An Introduction to PYTHIA 8.2. Comput. Phys. Commun. 2015, 191, 159–177. [Google Scholar] [CrossRef]
- Zang, Y.; Fai, G.; Papp, G.; Barnaföldi, G.G.; Lévai, P. High-pT pion and kaon production in relativistic nuclear collisions. Phys. Rev. C 2002, 65, 034903. [Google Scholar] [CrossRef]
- Albacete, J.L.; Arleo, F.; Barnafoldi, G.G.; Barrette, J.; Deng, W.-T.; Dumitru, A.; Eskola, K.J.; Ferreiro, E.G.; Fleuret, F.; Fujii, H.; et al. Predictions for p + Pb Collisions at = 5 TeV: Comparison with Data. Int. J. Mod. Phys. E 2016, 25, 1630005. [Google Scholar] [CrossRef]
- Albacete, J.L.; Arleo, F.; Barnafoldi, G.G.; Barrette, J.; Deng, W.-T.; Dumitru, A.; Eskola, K.J.; Ferreiro, E.G.; Fleuret, F.; Fujii, H.; et al. Predictions for p + Pb Collisions at = 5 TeV. Int. J. Mod. Phys. E 2013, 22, 1330007. [Google Scholar] [CrossRef]
- Biró, T.S.; Ürmössy, K. Pions and kaons from stringy quark matter. J. Phys. G 2009, 36, 064044. [Google Scholar] [CrossRef]


| Hadron, i | |||||
|---|---|---|---|---|---|
| 135.0 MeV | 50 MeV | MeV | |||
| 140.0 MeV | 50 MeV | MeV | |||
| 493.0 MeV | 50 MeV | MeV | |||
| 938.0 MeV | 50 MeV | MeV |
| Hadron, i | (MeV) | ||
|---|---|---|---|
| 135.0 MeV | / | / | |
| 140.0 MeV | / | / | |
| 493.0 MeV | / | / | |
| 938.0 MeV | / | / |
| Hadron Ratio | PYTHIA8 | kTpQCD_v20 | Colaescence |
|---|---|---|---|
© 2017 by the authors. Licensee MDPI, Basel, Switzerland. This article is an open access article distributed under the terms and conditions of the Creative Commons Attribution (CC BY) license ( http://creativecommons.org/licenses/by/4.0/).
Share and Cite
Bíró, G.; Barnaföldi, G.G.; Biró, T.S.; Ürmössy, K.; Takács, Á. Systematic Analysis of the Non-Extensive Statistical Approach in High Energy Particle Collisions—Experiment vs. Theory. Entropy 2017, 19, 88. https://doi.org/10.3390/e19030088
Bíró G, Barnaföldi GG, Biró TS, Ürmössy K, Takács Á. Systematic Analysis of the Non-Extensive Statistical Approach in High Energy Particle Collisions—Experiment vs. Theory. Entropy. 2017; 19(3):88. https://doi.org/10.3390/e19030088
Chicago/Turabian StyleBíró, Gábor, Gergely Gábor Barnaföldi, Tamás Sándor Biró, Károly Ürmössy, and Ádám Takács. 2017. "Systematic Analysis of the Non-Extensive Statistical Approach in High Energy Particle Collisions—Experiment vs. Theory" Entropy 19, no. 3: 88. https://doi.org/10.3390/e19030088
APA StyleBíró, G., Barnaföldi, G. G., Biró, T. S., Ürmössy, K., & Takács, Á. (2017). Systematic Analysis of the Non-Extensive Statistical Approach in High Energy Particle Collisions—Experiment vs. Theory. Entropy, 19(3), 88. https://doi.org/10.3390/e19030088