Article

Informative Nature and Nonlinearity of Lagged Poincaré Plots Indices in Analysis of Heart Rate Variability

Department of Medical Biophysics and Informatics, Karaganda State Medical University, Gogol Street 40, Karaganda 100008, Kazakhstan
*
Author to whom correspondence should be addressed.
Entropy 2017, 19(10), 523; https://doi.org/10.3390/e19100523
Submission received: 11 August 2017 / Revised: 16 September 2017 / Accepted: 28 September 2017 / Published: 10 October 2017
(This article belongs to the Special Issue Entropy and Cardiac Physics II)

Abstract

:
Lagged Poincaré plots have been successful in characterizing abnormal cardiac function. However, the current research practices do not favour any specific lag of Poincaré plots, thus complicating the comparison of results of different researchers in their analysis of heart rate of healthy subjects and patients. We researched the informative nature of lagged Poincaré plots in different states of the autonomic nervous system. It was tested in three models: different age groups, groups with different balance of autonomous regulation, and in hypertensive patients. Correlation analysis shows that for lag l = 6, SD1/SD2 has weak (r = 0.33) correlation with linear parameters of heart rate variability (HRV). For l more than 6 it displays even less correlation with linear parameters, but the changes in SD1/SD2 become statistically insignificant. Secondly, surrogate data tests show that the real SD1/SD2 is statistically different from its surrogate value and the conclusion could be made that the heart rhythm has nonlinear properties. Thirdly, the three models showed that for different functional states of the autonomic nervous system (ANS), SD1/SD2 ratio varied only for lags l = 5 and 6. All of this allow to us to give cautious recommendation to use SD1/SD2 with lags 5 and 6 as a nonlinear characteristic of HRV. The received data could be used as the basis for continuing the research in standardisation of nonlinear analytic methods.

1. Introduction

Heart rate variability (HRV) describes the variations between consecutive heartbeats, known as RR intervals. Sympathetic and parasympathetic nervous regulation alter the pattern of these variations, and HRV can quantitatively describe the function of the autonomic nervous system [1]. The standard methods for HRV analysis include statistical (time domain), power spectral (frequency domain), and nonlinear geometrical analysis. Both linear and nonlinear methods are used to analyse heart rate in healthy subjects and patients with different pathologies [2,3,4]. The nonlinear methods usually supplement the linear ones [5,6,7,8,9,10,11,12]. Many authors especially claim the prognostic value of nonlinear analysis [13,14,15,16,17,18,19]. There are publications examining gender differences in the nonlinear structure of HRV [20,21,22] and its variations throughout the times of day and night [22]. Certain publications deal with diagnosis and classification of arrhythmias based on nonlinear parameters [23,24], even up to the point of prognosis of various cardiovascular diseases like ventricular tachycardia and congestive heart failure [25]. With that, the additional clinical validation of existing novel methods is needed to define the clinical predictive value of nonlinear parameters as well as their robustness in relation to reproducibility and widespread clinical use [26].
One method of HRV analysis is the Poincaré plot, which takes a sequence of intervals and plots each interval against the following interval. It is a representation of a time series into a phase space, where the values of each pair of successive elements of the time series define a point in the plot. The Poincaré plot is a very simplified two-dimensional phase space with delay or lag of one beat (i.e., each RR interval is plotted as a function of the previous RR interval). According to Takens’ theorem [27], attractor of a dynamical system may be reconstructed by using an appropriate time delay and embedding dimension. The “true” attractor of HRV is certainly not displayed by the Poincaré plot as the HRV has a higher estimated dimension (greater than one) [28]. Nevertheless, it gives useful visual information about HRV. A quantitative analysis of the plot can be made by using three parameters: SD1—variance of RR intervals in a short time scale, SD2—variance of RR intervals in a long time scale, and the ratio SD1/SD2 [28,29,30].
Poincaré plots have been successful in characterizing abnormal cardiac function and have become an integral part of HRV analysis [30,31,32,33]. They are shown to provide prognostic information in myocardial infarction, chronic heart failure, and sudden infant death syndrome. They also predict the mortality risk of life-threatening ventricular arrhythmias in cardiac surgery patients [34,35,36].
Poincaré plots are on the boundary between linear methods and tools based on nonlinear dynamics—the principle of its construction is taken from the nonlinear dynamics theory, but parameters used for its quantification are essentially linear. Brennan et al. [31] raised doubts on using SD1 and SD2 parameters to characterise nonlinear properties of heart rhythm dynamics and revealed their mathematical direct relation to such linear parameters as standard deviation (SDNN) and standard deviation of the successive difference between adjacent RR (SDSD). Several authors modified the chart construction to get parameters that are more informative. In particular, they used the time lag of not one RR interval, but of two to ten, because a heart beat influences not only the beat immediately following it, but also up to 6–10 beats downstream [37], possibly as a consequence of respiratory sinus arrhythmia.
Lerma et al. [38] researched the Poincaré plots of patients with chronic renal failure compared to healthy volunteers. The authors showed that the Poincaré plots built with time lags of four heart beats reflects the changes in HRV after haemodialysis. In other papers, Poincaré plot indices were informative at all lags from 1 to 10 [39,40].
Contreras et al. [41] researched correlations between linear parameters (HF and LF) and SD1 in the groups of healthy volunteers and diabetic patients. The Poincaré plot parameters have been calculated at different lags from 1 to 10. In both the groups, SD1 increases with the increase of the lag, but the correlations between SD1 and HF, as well as between SD1 and LF, have varied in healthy subjects and remained constant in diabetic patients.
Thakre and Smith [42] justify the use of Poincaré plot parameters to describe the vegetative regulation of heart rate in case of inconsistency of traditional methods. They showed that in congestive heart failure patients, the dependence of SD1/SD2 on time lag value was linear, while in control subjects it was nonlinear.
The further development of the method is possible through 3D Poincaré plots with the axes (RRn; RRn+1; RRn+2). The three projections could be analysed in this case: (RRn; RRn+1), (RRn+1; RRn+2), and (RRn; RRn+2) [31]. The authors of the indicated publications suggested using these facts as additional diagnostic criteria.
However, the current research practices do not favour any specific lag of Poincaré plot, thus complicating the comparison of results of different researchers in their analysis of heart rate of healthy subjects and patients.
Our primary goal was to complement the current research with our own data. We tested the informative nature of lagged Poincaré plots in three different models. The first model included persons with different autonomic balancing of heart rate regulation. The second model tested the age-related properties of dynamics of heart rate. We used such a model because of certain knowledge on the interrelation of neural regulation mechanisms and structural and functional development of organs and systems in different periods of human life. In the third model, we tested the differences in parameters between the patients with hypertension and healthy volunteers. It is a known fact that disturbances in normal function of the autonomic nervous system play an important role in the genesis and progression of arterial hypertension [43,44]. After discussing the results, we also compare them to the findings of other authors.

2. Materials and Methods

We used short-term (5-min) HRV indices analysis in both linear time and frequency domains and in the nonlinear dynamics domain [45]. The electrocardiogram (ECG) was recorded while the patients were in a sitting position after resting for at least 20 min. The measurements were taken in the morning and in the same room. All ECGs were recorded at a fixed time of day to avoid the effects of diurnal variations on HRV. We analysed the whole 5 min of the recording. Cardiac signal was then analysed visually and was only used for the HRV analysis if there were no obvious irregularities in the RR intervals. A 16-bit analog-to-digital converter was used to digitalise the ECG signal for the consecutive generation of RR interval time series. The sampling rate was 1000 Hz. The signal was averaged by a shifting window of 32 ms to eliminate the high-frequency noise. The modified Pan and Tompkins real-time QRS detection algorithm [46] allowed automatic detection of R-waves and obtaining RR interval time series with the efficiency rate of 99.3%.
RR recordings were then exported into Kubios HRV 2.2 for analysis [47]. To correct for artefacts, cubic spline interpolation method was used [48]. According to the heart rates, the different correction thresholds were defined (very low = 0.45 s, low = 0.35 s, medium = 0.25 s, strong = 0.15 s, very strong = 0.05 s) for detecting RR intervals differing “abnormally” from the local mean RR interval.
Trend component removal of the time series was carried out according to an “a priori” smoothing method. The detrending was performed using a smoothing parameter λ = 300 [49], and interpolation using cubic splines at a frequency of 1 Hz was applied to extract equally spaced samples.
The spectrum for the selected RR interval sample was calculated with Welch’s periodogram method (FFT spectrum). The value for window width was 128 samples and the overlap was 50% (corresponding to 64 samples).
The study involved 95 healthy subjects (Table 1). They were categorized into three groups based on their age: 35 children (15 girls and 20 boys) aged 8 to 10 (ChG), 28 young volunteers (20 women and 8 men) aged 19 to 21 (YG), and 32 adults (18 women and 14 men) aged 35–55 (AG). Besides the healthy subjects, we also analysed the data from 14 patients with essential hypertension aged 45–55 who were taking antihypertensive drugs (HG). All the subjects in this group had a confirmed diagnosis of the first- or second-stage essential hypertension based on clinical manifestations and 24-h ambulatory blood pressure monitoring. The control group for these subjects included 14 healthy volunteers of the same age from the AG group.
All subjects signed the informed consent form to participate in the study. The Ethics Committee of Karaganda State Medical University approved the research (protocol №8 от 17.10.2009 г.). Subjects were instructed to avoid caffeine, alcohol, and physical exertion the day before the study was performed.

2.1. Linear and Nonlinear Parameters

The Poincaré plot is a scatter plot of RRn vs. RRn+1, where RRn is the time between two successive R peaks and RRn+1 is the time between the next two successive R peaks. When the plot is adjusted by the ellipse-fitting technique, the analysis provides three indices: The standard deviation of instantaneous beat-to-beat interval variability (SD1), the continuous long-term RR interval variability (SD2), and the SD1/SD2 ratio. On the Poincaré plot, SD1 is the width and SD2 the length of the ellipse. In addition to this conventional plot (RRn+1 vs. RRn), we also used the generalized Poincaré plot with different intervals, including the m-lagged Poincaré plot (the plot of RRn+m vs. RRn). The values of SD1, SD2, and SD1/SD2 were calculated for lag = 1 to 10 [29]. Calculation was performed using the TISEAN software package.
The time-domain measures of heart rate (HR) variability were analysed by the methods recommended by the Task Force of the European Society of Cardiology [1]. We calculated SDNN—standard deviation of the RR interval, i.e., the square root of variance, RMSSD—the square root of the mean squared differences of successive RR intervals, SDSD—standard deviation of differences between contiguous RR intervals, and spectral components—low-frequency (LF), high-frequency (HF), LF/HF ratio.

2.2. The Surrogate Data Tests

The surrogate data analysis technique [50] was used to prove the null hypothesis that the heart rhythm is a linear process. The original HRV time series was transformed by a discrete Fourier transform, the phases were randomized and then the inverse Fourier transform was performed. When phases are randomized, the non-linearities in the original time series disappear and the new surrogate time series becomes a sum of only linear autocorrelations. If the differences between heart rate parameters calculated from the real and surrogate data sets were statistically significant, the conclusion could be made that the heart rhythm has nonlinear properties. By specifying the probability α that we are prepared to reject the null hypothesis although it is true, we obtain a test that is valid at the (1 − α) significance level. A rank-based one-sided test with significance (1 − α) may be employed by generating N = 1/α − 1 surrogates in order to test whether the studied measure γ0 is smaller than expected for data obeying the null hypothesis that the measure is linear. By computing the N values for the nonlinear measure γi (i = 1, …, N), we can reject the null hypothesis whenever γ0 is smaller than all of the γi. For our chosen significance level of 95%, we constructed 19 surrogates for each studied HRV time series, as required by the formula above.

2.3. Statistical Methods

Relationships between the Poincaré-plot parameters (SD1, SD2, and SD1/SD2) and linear (SDNN, RMSSD, and SDSD) indices were tested by the Spearman rank correlation test. We used the Wilcoxon signed-rank test to compare real and surrogate data, the nonparametric Mann-Whitney test for pairwise comparisons, and the nonparametric Kruskal-Wallis test for multiple comparisons to compare various groups. Using K-means clustering on HF and LF, we divided all healthy subjects into two groups with different balance of autonomic regulation [51]. Differences with p < 0.05 were considered to be statistically significant.

3. Results

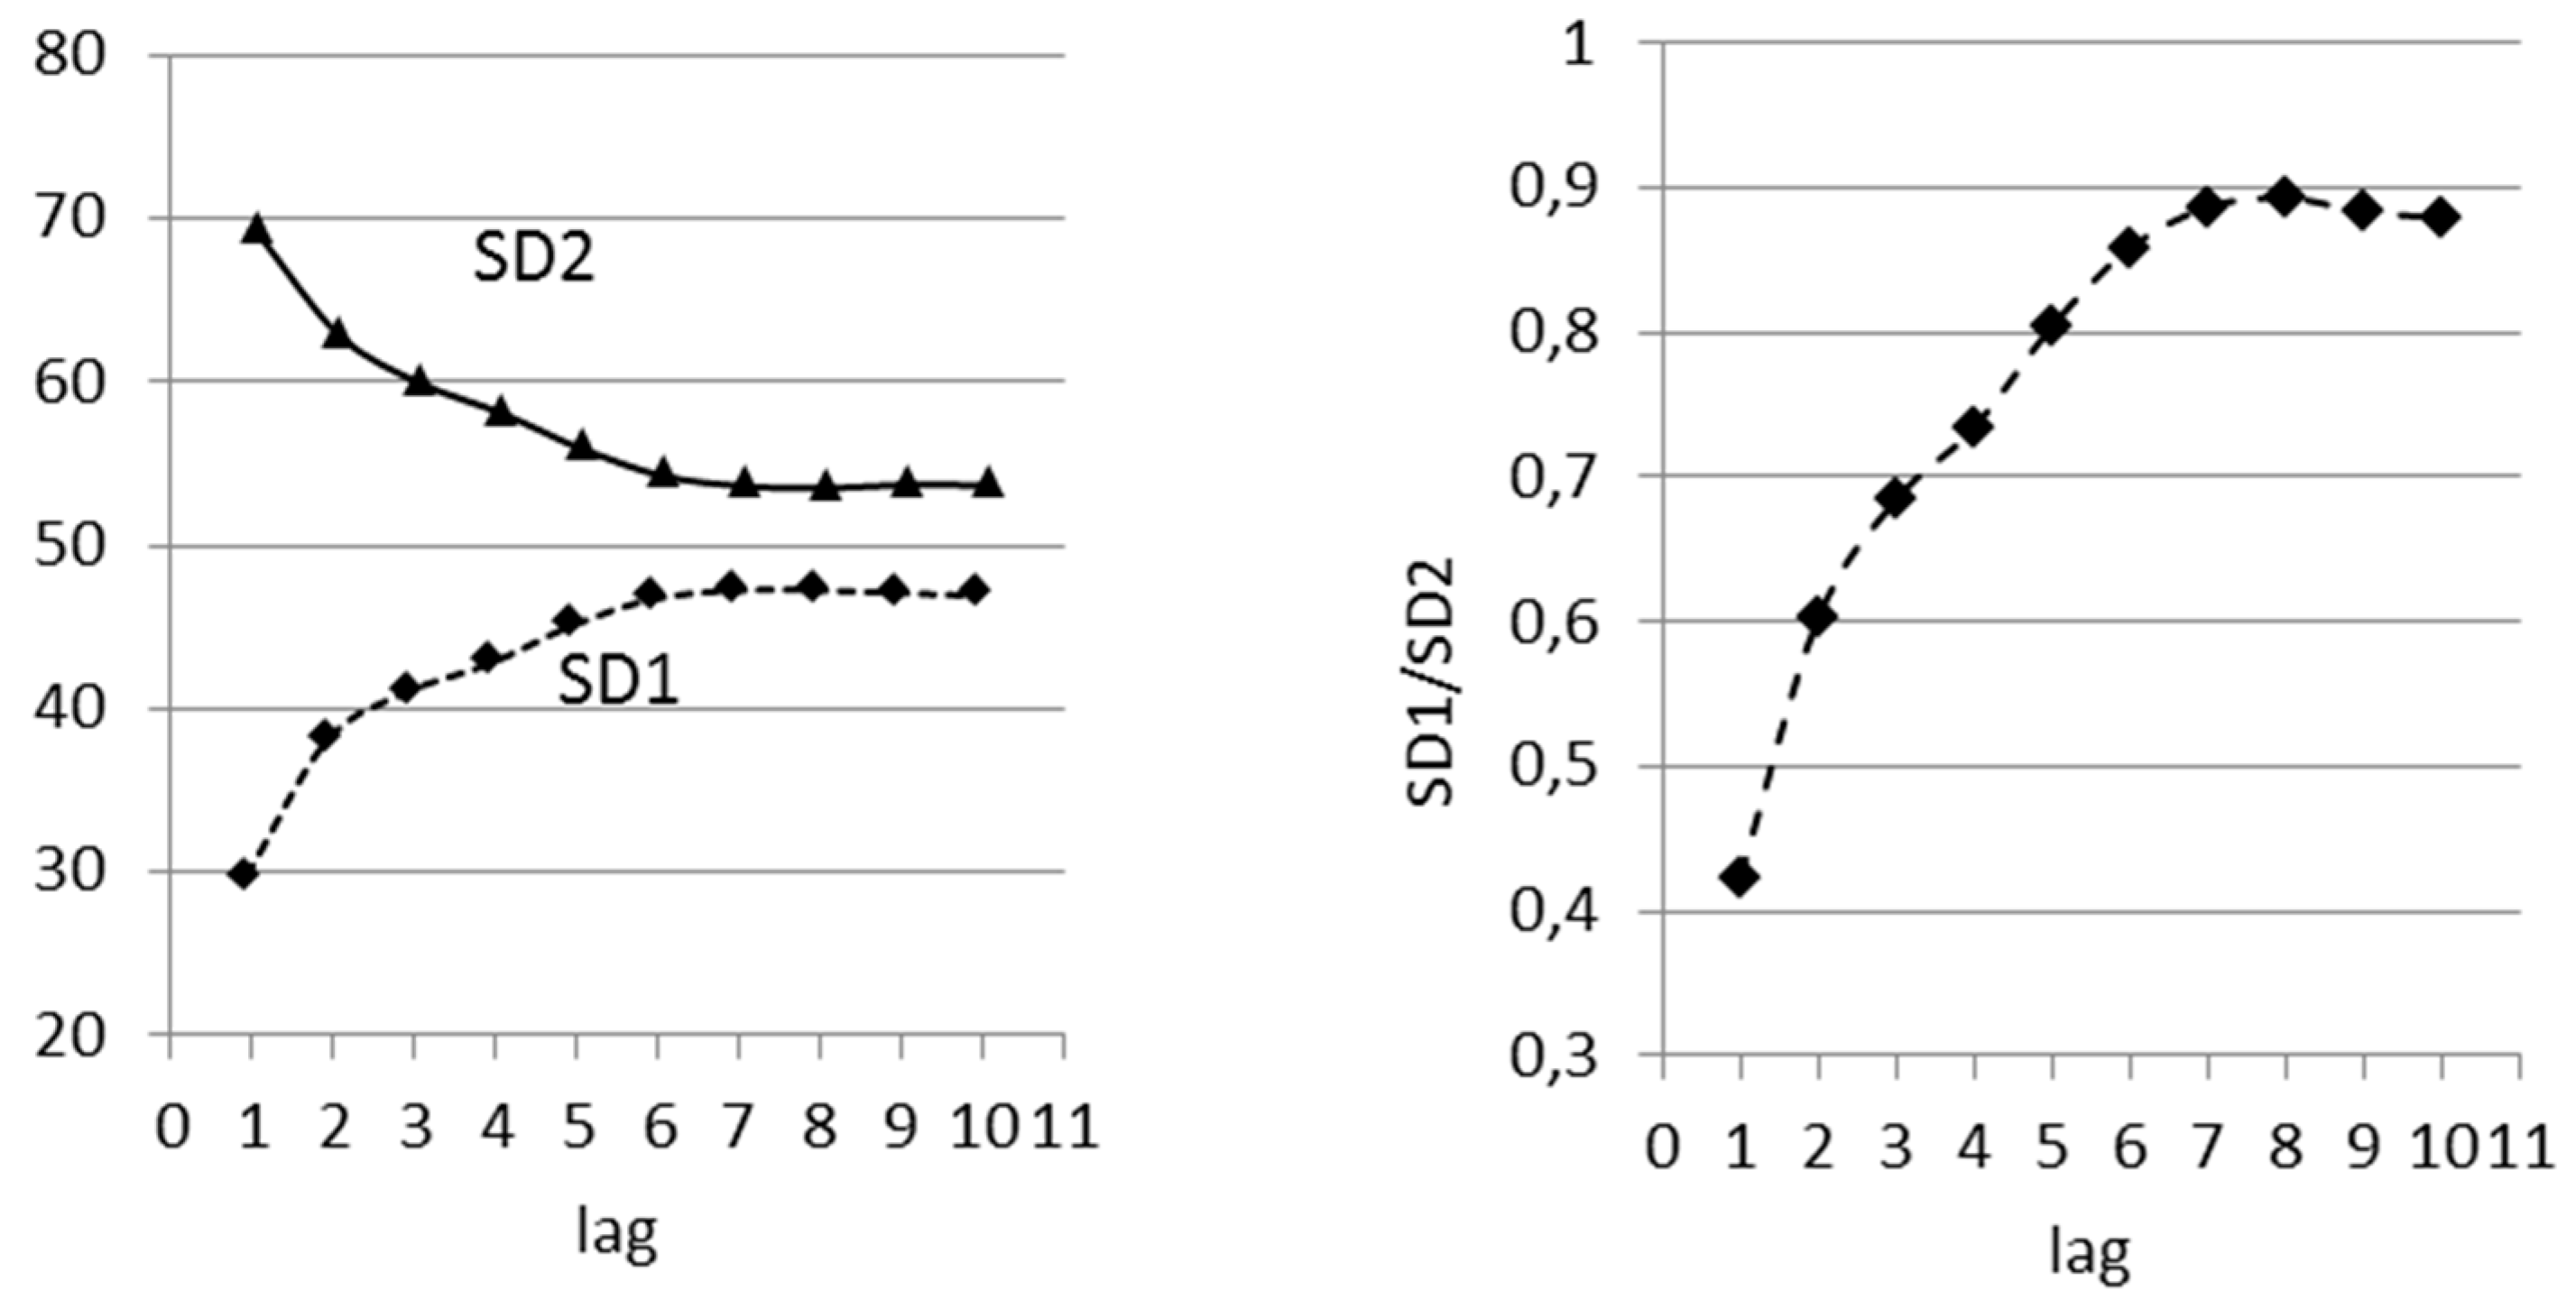
3.1. Influence of Time Lag on Poincaré Plot Indices

At first we explored the correlation between Poincaré plot indices and linear parameters of HRV in lag numbers l = 1 to 10 in the group of healthy volunteers. As seen from Table 1, both SD1 and SD2 continue to be highly correlated with SDNN, RMSSD, and SDSD (with a correlation coefficient from 0.9 to 1) for all lags. However, SD1/SD2 tends to lose the correlation with linear parameters at higher lags. When the lag equals to one RR interval, its correlation coefficient with both RMSSD and SDSD is 0.8; when the lag increases to 6 RR intervals, the correlation coefficient drops to 0.33 and continues to approach 0 at higher lags, though coefficients themselves are not significant (Table 2).
Exploring the absolute value of Poincaré plot indices at increasing time lag (Figure 1), we registered the increase in short-term variability (SD1), the decrease in long-term variability (SD2), and stabilising values of SD1/SD2 after their initial increase.
Table 3 shows the results of multiple comparisons of SD1/SD2 at different time lags; starting with l = 5, the changes in SD1/SD2 are statistically insignificant.
Thus, our research once again supports the theory of a high correlation of SD1 and SD2 with linear characteristics of HRV, such as RMSSD and SDSD, for all m-lagged Poincaré plots. In addition, SD1/SD2 has its standalone value, since starting with l = 6 it displays a low correlation with linear characteristics. When the time lag is greater than 6, the changes in SD1/SD2 become statistically insignificant, but its value slowly converges to 1 making the Poincaré plot more circular. This change was expected, since when intervals are plotted against immediately preceding intervals (lag 1), the correlation between these will be higher than if they were more widely separated. This indicates that increasing lag corresponds to increasingly unrelated beats. Cigar-shaped plots are typical of high correlation, whereas round clouds of points are typical of lack of correlation [52,53]. It has been reported that any given RR interval can influence up to eight subsequent RR intervals, possibly as a consequence of respiratory sinus arrhythmia [38,42].
We used the surrogate data to test whether SD1/SD2 really reflects the nonlinear properties of RR interval time series. SD1/SD2 calculated for real data was compared to SD1/SD2 calculated from surrogate data sets using the Wilcoxon signed-rank test.
The null hypothesis is that the heart rhythm is a linear process. If the differences between SD1/SD2 calculated from the real and surrogate data sets were statistically significant, the conclusion could be made that the heart rhythm has nonlinear properties. Results of testing the Poincaré plots with time lags of 1 to 10 show that the real SD1/SD2 was statistically different from its surrogate value in 69% to 82% of RR interval time-series (Table 4).

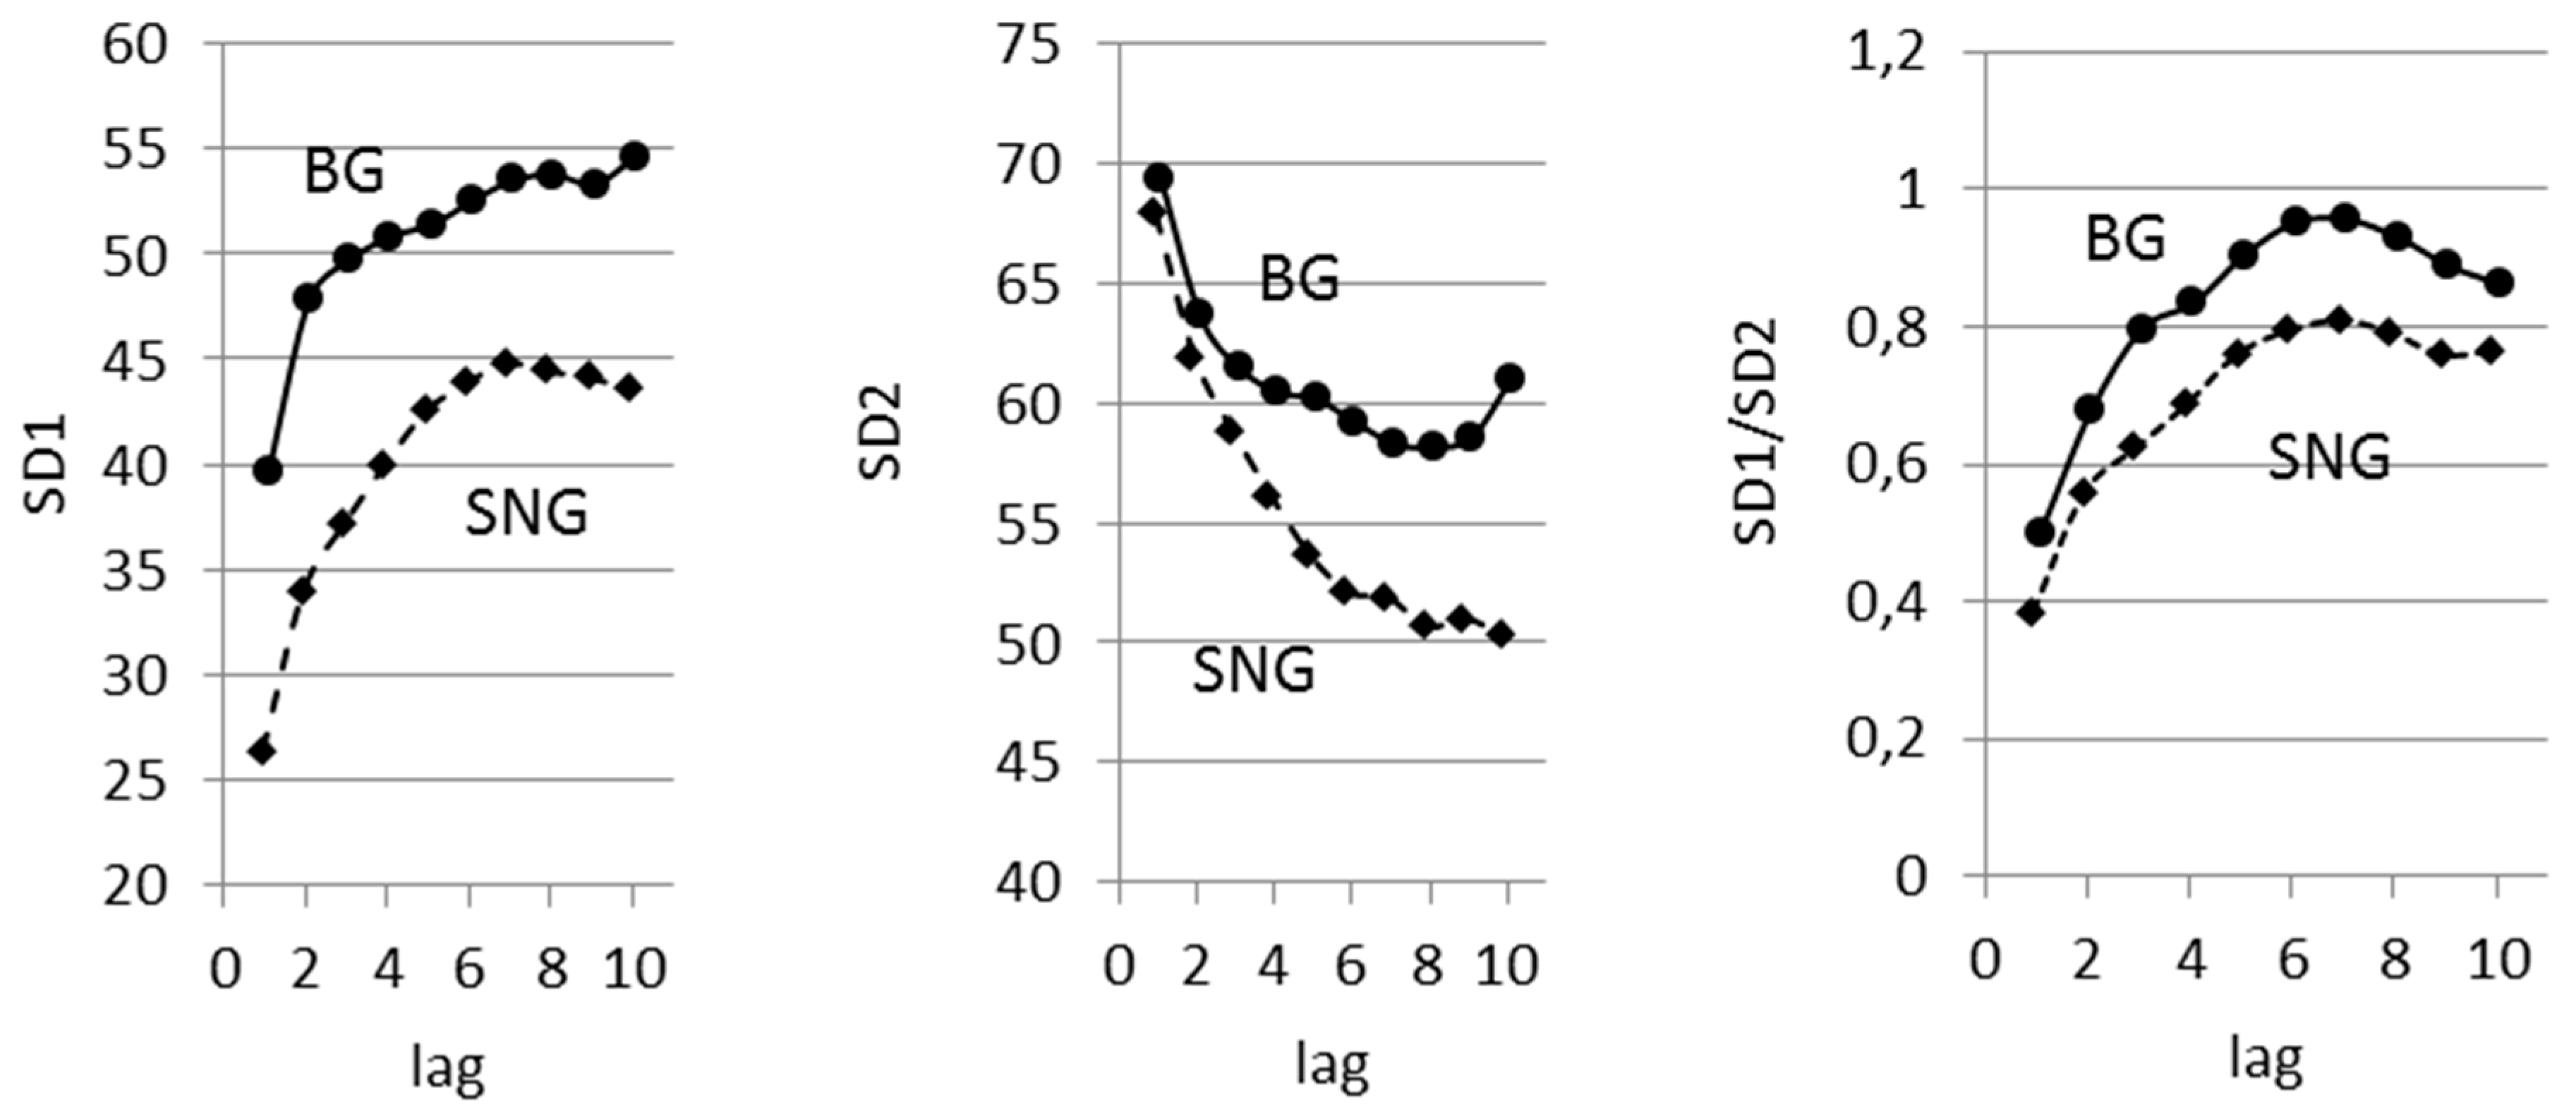
3.2. Lagged Poincaré Plot in Persons with Different Balancing of Autonomic Nervous System

It is known that Poincaré plot parameters reflect the state of the autonomic nervous system. As suggested by previous studies, the width of the Poincaré plot (SD1) could be considered as a nonlinear indicator of parasympathetic activity, while the length of Poincaré plot (SD2) is influenced by both sympathetic and parasympathetic components. In fact, the balance between sympathetic-parasympathetic arms can be represented by SD1/SD2 [30,54]. So we tested a technique of lagged Poincaré plot indices calculation in persons with different autonomic balancing that was measured by HRV spectral characteristics. The amplitude of the high-frequency (HF) component of the HRV spectrum is related to the vagal influence on heart rate [55]; the low frequency (LF) power is an index of vagal and sympathetic modulations [56]. Correspondingly, the LF/HF ratio could be used to measure the level of autonomic balancing of heart rate regulation.
Using K-means clustering on HF and LF we divided all healthy subjects into two groups (Groups 1 and 2). Table 5 presents some HRV measures in these groups. Group 2 has lower heart rate variability (RMSSD), total spectral power TP, and high-frequency power HF with elevated values of LF, and, correspondingly, twice as high LF/HF.
These comparisons allowed us to classify the second group as the one with higher sympathetic autonomic regulation (SNG, n = 38) and the first group as the one with balanced regulation (BG, n = 57).
Figure 2 presents the results of the calculation of SD1/SD2 in these two groups with the lags of 1 to 10. The change in SD1/SD2 in both groups is nonlinear, starting to level off at a lag of 5.
The SD1 value was higher in the BG group, but statistically significant differences were received only for l = 1, 2 и 3. At all other lags there were no significant differences. SD2 was also higher in the BG group, but it did not show significant differences when Poincaré plot was lagged. SD1/SD2 was also higher in subjects with a balanced autonomic nervous system than in subjects with elevated sympathetic regulation; this effect was significant for all lags (Table 6).
It could be expected that SD1 and SD2 would differ in the groups under consideration, as they have a high correlation with the linear HRV indices, which are significantly different in these groups. However, as we show above, SD1/SD2 does not correlate with linear indices and its differences between BG and SNG could highlight differences in the nonlinear dynamics of HRV in these groups.

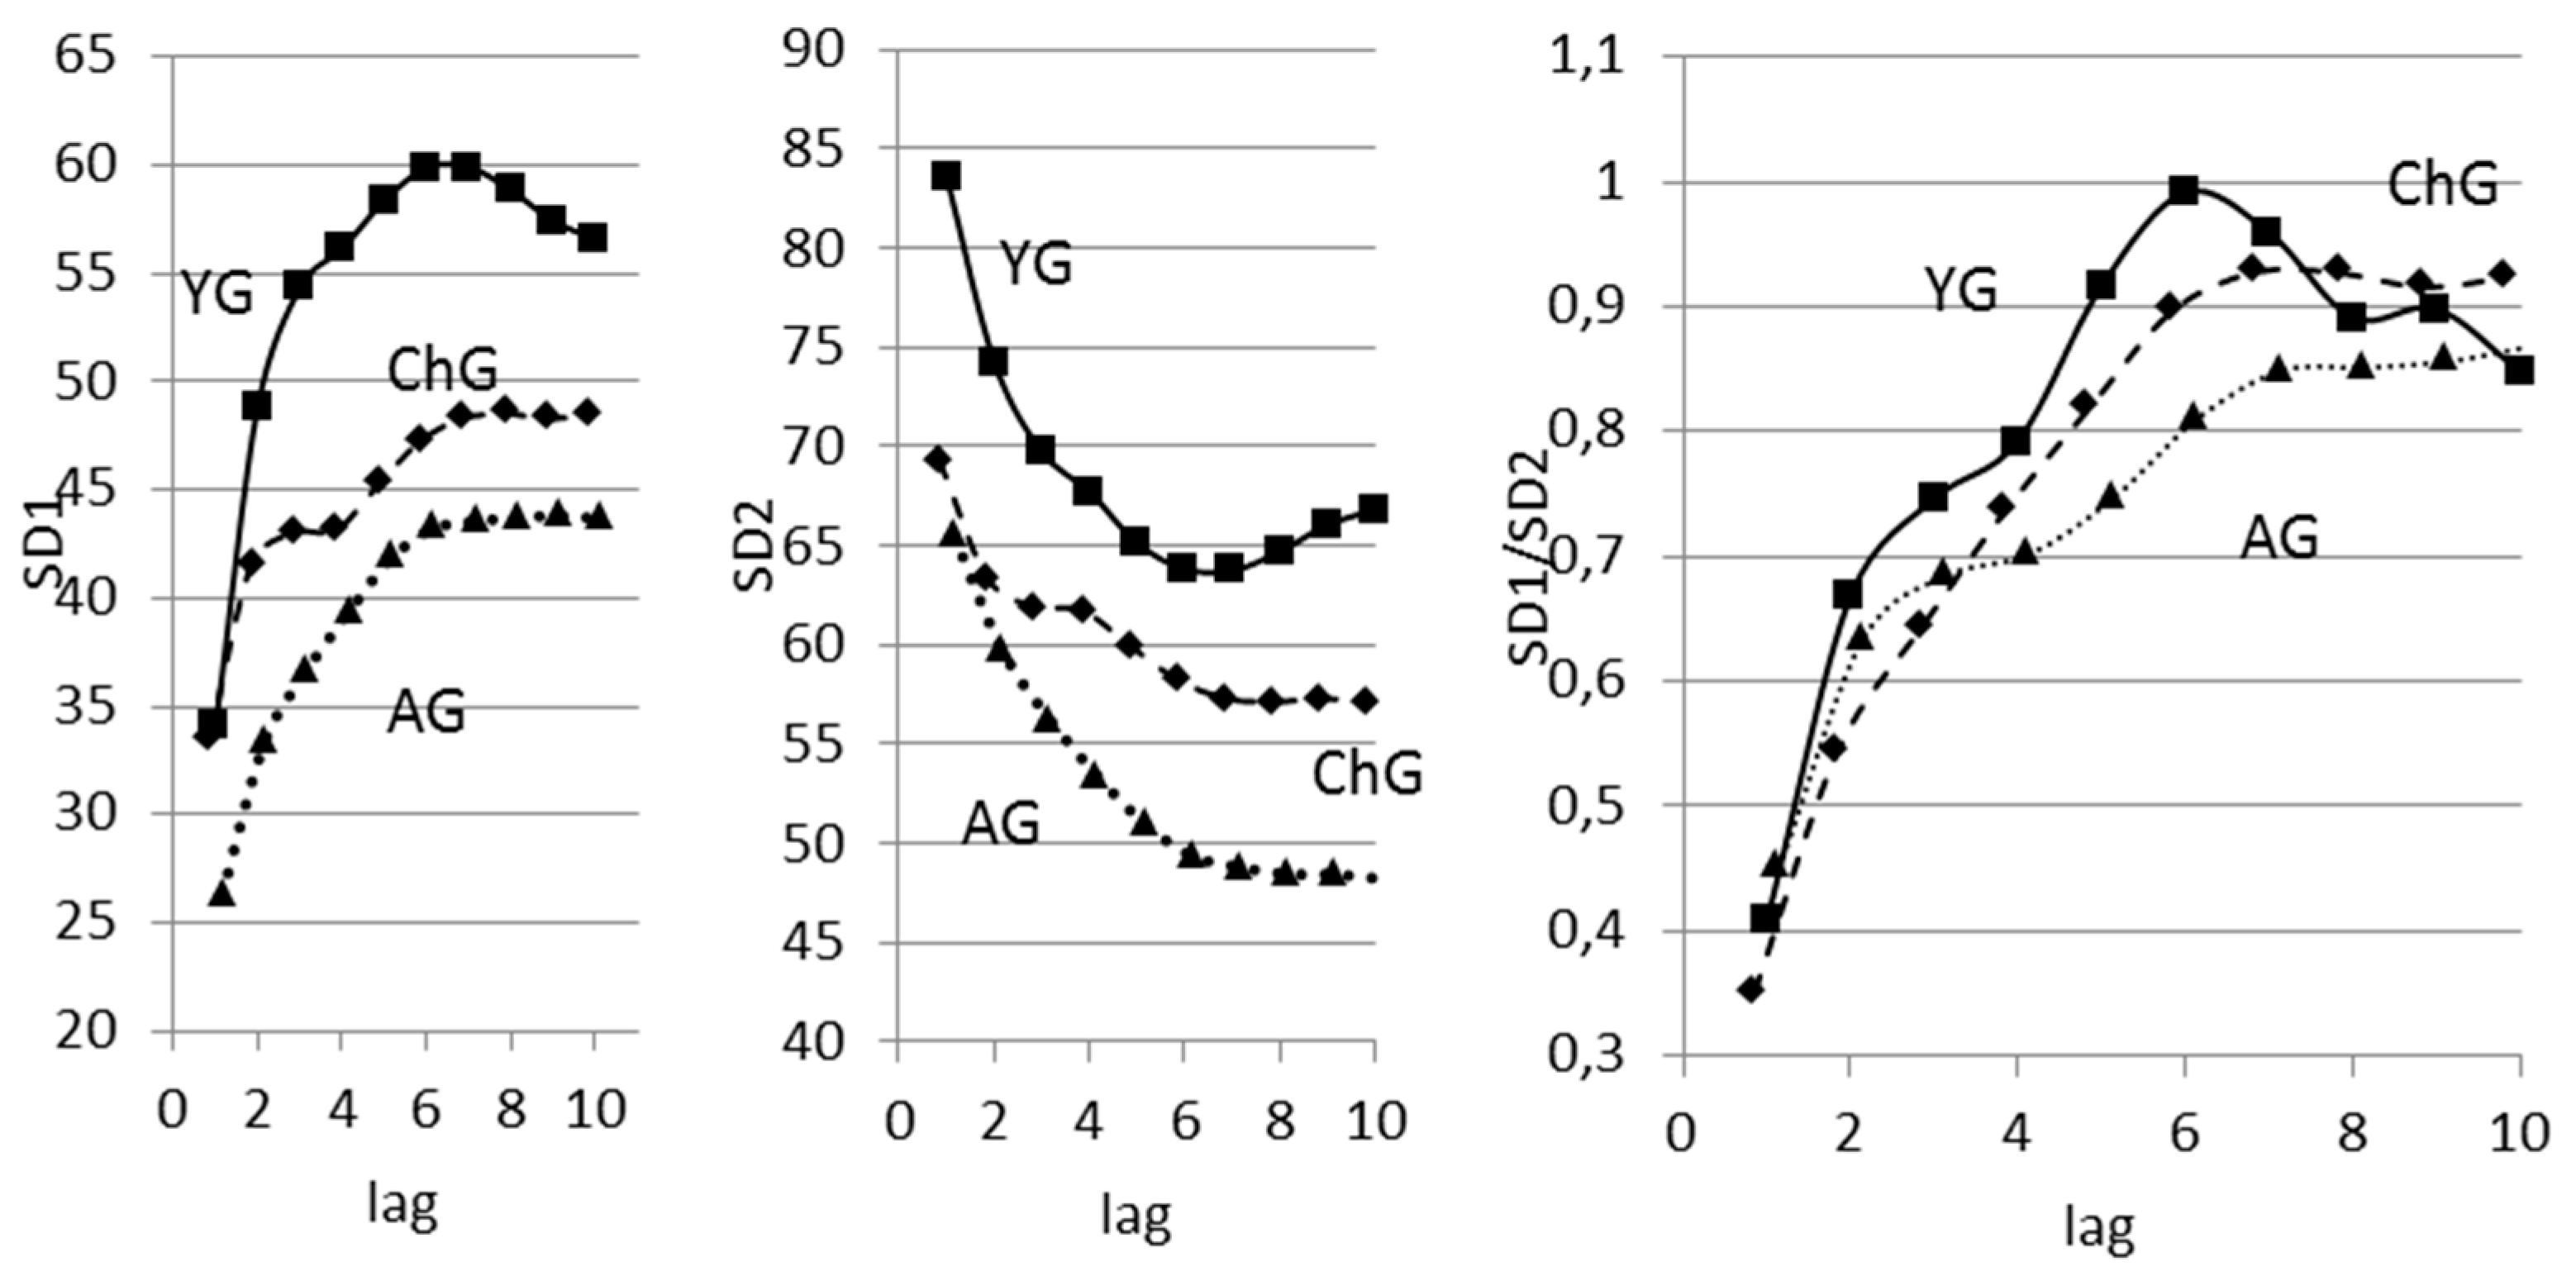
3.3. The Analysis of Age-Related Differences

We used an age-related model because of certain knowledge on the interrelation of neural regulation mechanisms and structural and functional development of organs and systems in different periods of human life [57,58]. Relying on this knowledge, we could make assumptions about involvement of different parts of the autonomic nervous system into the heart rate regulation and about mechanisms of aperiodic oscillations in HRV.
In all three age groups, with the increase of time lag there was the increase in short-term variability captured by SD1, the decrease in long-term variability captured by SD2, and initial increase of SD1/SD2 with levelling off at l = 5 (Figure 3). The situation mimicked the one outlined in the previous case.
At l = 1, SD1/SD2 shows statistically significant difference between the groups of children and adults. At l = 2, there are no differences between children and young adults. Not all the groups are different at time lags of 3, 4, 7, 8, 9, and 10. There are statistically significant differences in SD1/SD2 between all groups only for lags of 5 and 6 (Table 7).
Table 8 shows Poincaré plot indices estimated with lags of 5 and 6 heartbeats. The lowest value is in the group of children, the highest is in the group of young adults.

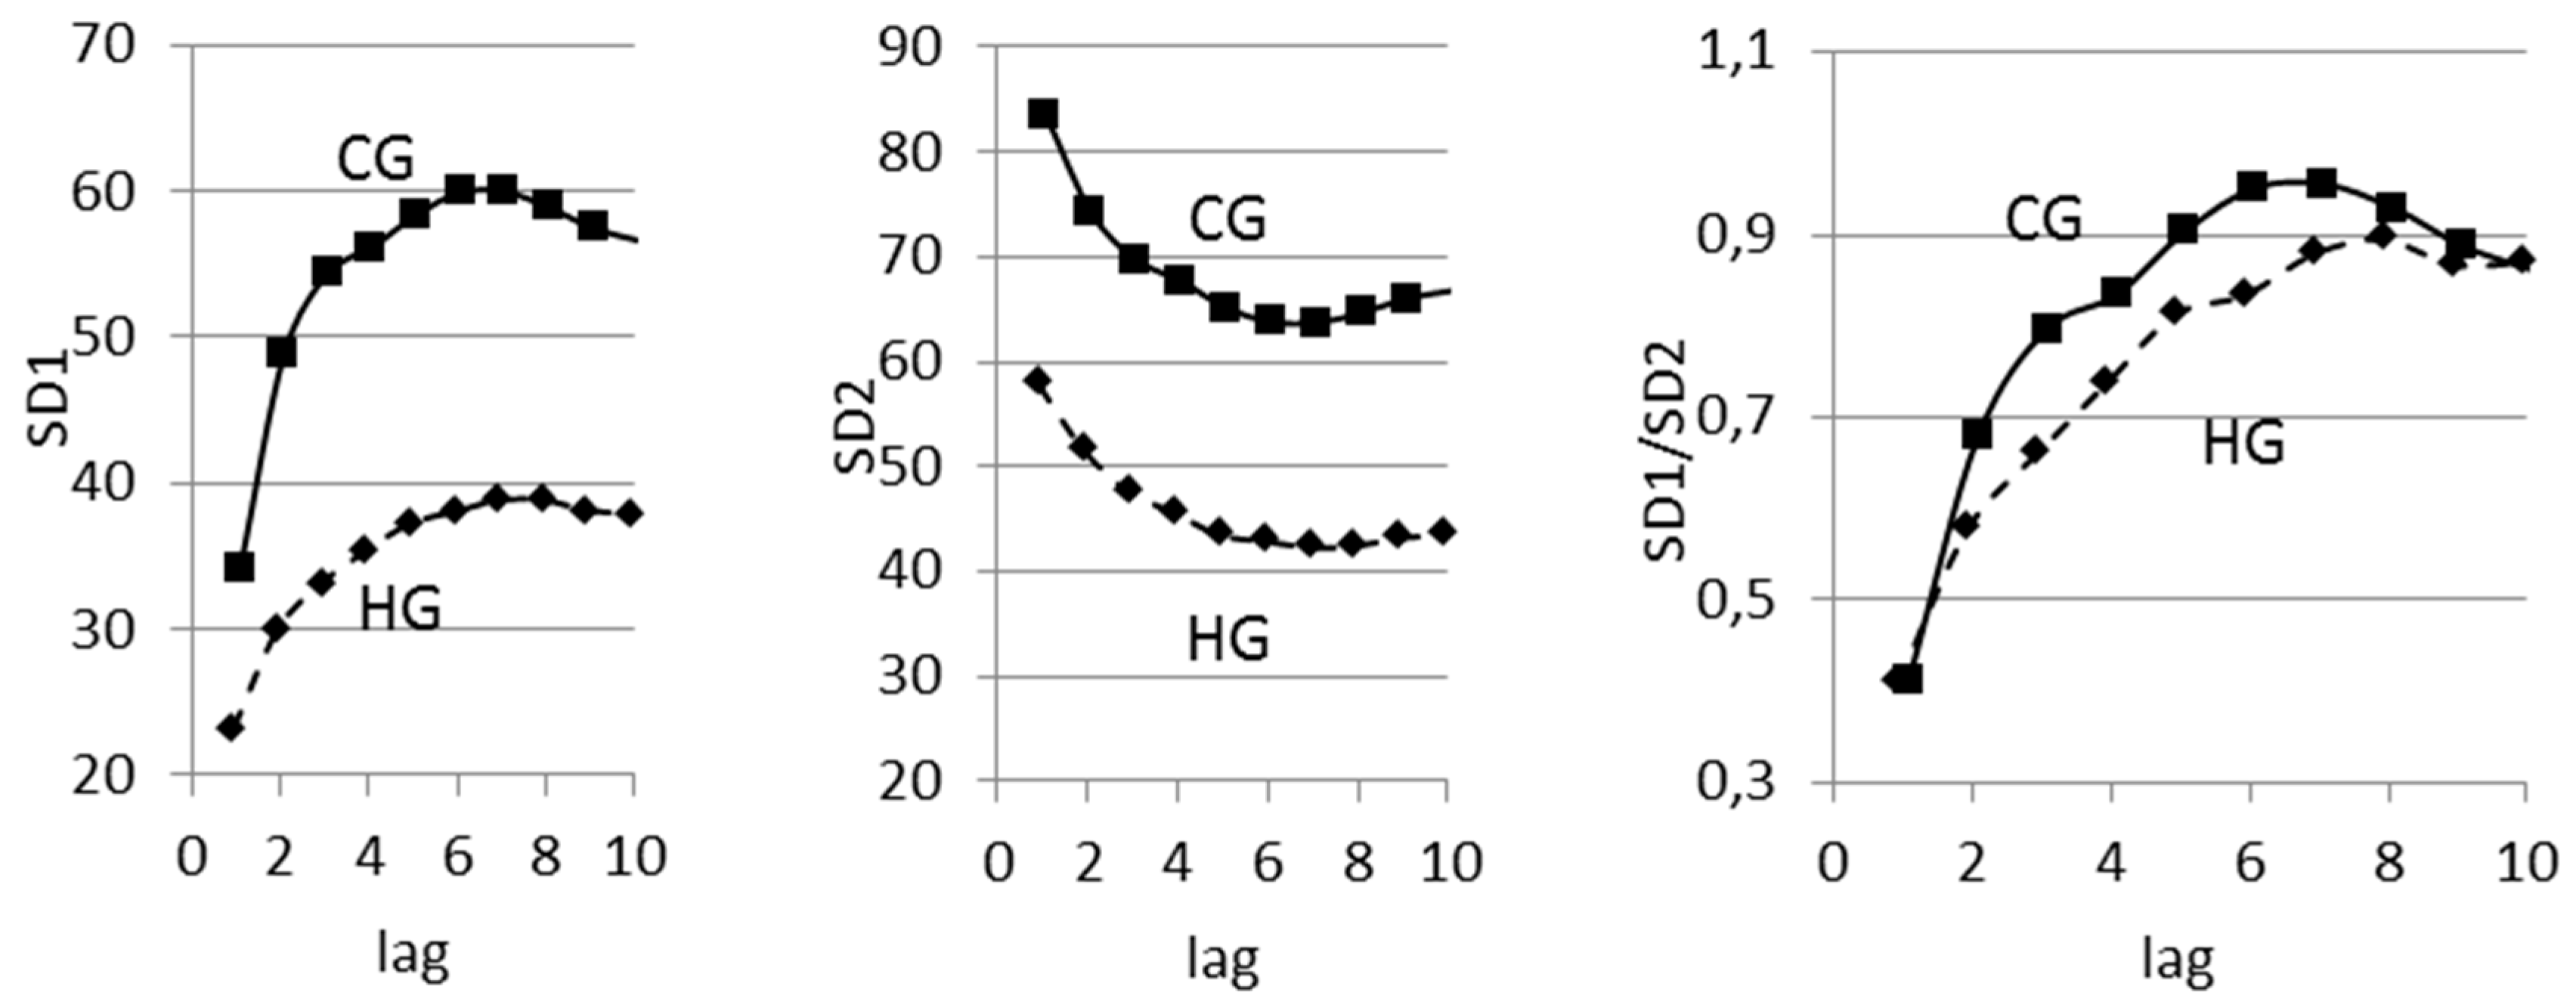
3.4. Lagged Poincaré Plot in Hypertension

There is considerable evidence to suggest that the autonomic nervous system plays an important role in blood pressure regulation and in the development of hypertension [59,60].
HRV may be of importance in identifying subjects at higher risk of developing hypertension, so the integrity of the autonomic modulation of heart rate is evaluated by using linear and nonlinear analysis of HRV.
According to our data, SD1 and SD2 in healthy volunteers are statistically higher than in hypertensive patients for all lags. SD1/SD2 ratio is also higher in healthy subjects, but the difference is statistically significant only for l = 5 and 6 (Figure 4).

4. Discussion

The interaction of the sympathetic and parasympathetic nervous systems shapes linear and nonlinear dynamics of heart rhythm, allowing HRV analysis to be widely used in assessing the autonomic nervous system in different functional and pathological states. At this time, the search is ongoing for the most informative measures that could be used as diagnostic or prognostic criteria.
However, the available literature information is scarce on m-lagged Poincaré plots. The use of keyword “lagged Poincaré plot” in PubMed and Web of Science databases resulted in 21 publications. Of these, PubMed returned only six publications, doubling the ones found in Web of Science.
Out of these 21 papers, 17 described lagged Poincaré plots in HRV and four papers described other biological signals. In 10 papers, authors calculated SD1, SD2, and SD1/SD2 using traditional approaches, while in other papers, the Poincaré plot was analysed using modified descriptors. The vast majority of publications were dedicated to the clinical aspect of nonlinear analysis of HRV. In all papers, the authors argue that differently lagged indices have important diagnostic and prognostic values.
However, the results of the published research still do not present some unified method of selecting the lag for Poincaré plot indices. Lerma et al. [38] examined the Poincaré plot indices to analyse the HRV after hemodialysis in chronic renal failure patients. They found that with l = 4, the SD1/SD2 ratio reduced after hemodialysis, but there were not significant differences between the indexes measured from l = 2 and 3, and between the lags of 4 and 5. With lags of 6, 7, and 8, the indices measured were the same as the ones obtained with smaller lags.
Goshvarpour et al. [39] examined the influence of different lags on the Poincaré plot indices of heart rate signals in a group of healthy subjects before and during meditation. The Poincaré plot indices were calculated using lags 1 and 6 heartbeats. It was noticed that the values of SD1/SD2 ratio increased significantly during meditation compared to that before meditation, especially when measured from Poincaré plots reconstructed with a lag of 6 (p < 0.05).
Thakre and Smith [42] compared the lag-responses of congestive heart failure (CHF) patients and normal subjects in light of the fact that HRV may have been potentially restored by the pharmacologic therapy in the CHF patients. They found that the SD1/SD2 ratio was significantly different in CHF patients as compared to that of normal subjects. They also consider m-lagged SD1/SD2 ratios to be more informative. However, they do not specify which time lag is optimal for comparison SD1/SD2 in research groups since they suggest an alternative analytic strategy—to test for curvilinearity of Poincaré plot indices based on the lag.
Another research paper focused on differences in HRV patterns between diabetic and age-matched healthy control subjects using nonlinear methods [41]. SD1/SD2 was statistically lower in the diabetic group than in control subjects at all time lags. The slope and curvature for SD1/SD2 in the diabetic group were also smaller. In the study of the effect of rotatory acoustic stimulus on the nervous system, the lagged Poincaré plot analysis showed a significant increase in SD1 and SD1/SD2 at all lags post stimulation, thus indicating an increase in parasympathetic modulation [61]. A similar effect was registered under the influence of a hazardous stimulus such as smoking [62].
In our research, we registered a high correlation of SD1 and SD2 with linear measures of RMSSD and SDSD for all lag numbers from 1 to 10, as was theoretically proved by Brennan [31]. Correlation of SD1/SD2 ratio with linear measures decreased with the increase of time lag. At l = 6, the correlation reached 0.3 and continued to decrease (even though the coefficient was not statistically significant). Also, SD1/SD2 was tested using surrogate data method, which depicted the vast majority of time series (69–82%) having the nonlinear component. In our opinion, according to these results, SD1/SD2 may better relate to the nonlinear component of HRV. Regarding the remaining 18–31% of cases with negated null hypothesis, we could argue that it was due to a methodology flaw such as measurement inaccuracies and limitations of the surrogates’ method itself, as mentioned even by its author [50].
According to many researchers, the increasing activity of the sympathetic nervous system leads to the changes in HRV nonlinear dynamics; it becomes less complex relative to the balanced state [22,28,63,64,65,66]. Our data suggest that sympathetic activity decreases the SD1/SD2 ratio. This is caused by uneven decrease in its components—the short-time variability (SD1) decreases more rapidly than long-time variability (SD2). SD1/SD2 ratio was statistically different between BG and SNG groups for all lags from 1 to 10. This was expected, since both groups had expressed differences in the regulation of heart rate. In addition, if SD1 and SD2 reflect the linear effects of HRV regulation, then SD1/SD2 is an indicator of nonlinear processes at different states of the ANS.
The balancing of the autonomic nervous system varies with age. We assumed that there would be changes in m-lag in different age groups. The more expressed changes in SD1/SD2 between younger and older subjects was at time lags of 5 and 6. The lowest values were in children, adults, and then young adults. Earlier research using such nonlinear measures as CD, ApEn, LLE, αs, and αl provided similar evidence that HRV complexity is lower in children and adults, but higher in young adults [67,68]. If we assume that SD1/SD2 captures nonlinear information [38], then our data conforms to the previous research and provides the evidence that SD1/SD2 is also a complexity measure.
The other model in which we decided to test Poincaré plot measures was hypertension. The reason for such selection was a known fact that hypertension causes significant decrease in HRV and decreases total spectral power, especially in the HF range. There is also data supporting changes in nonlinear dynamics of heart rate in hypertension, especially in lowering the complexity of heartbeat series [69,70,71,72]. Mäkikallio et al. note that generally a healthy person has higher values of entropy compared to that of a patient with an impaired cardiovascular system [73]. In our research of m-lagged Poincaré plots in hypertensive patients, SD1 and SD2 differed from healthy persons for all lags, but the SD1/SD2 ratio has been statistically different only at l = 5 and 6.
It is also worth mentioning that in all studied groups, the changes of SD1/SD2 depending on the lag have been nonlinear; the measure initially increased with the time lag and then starting with l = 6 levelled off. This is an additional argument that there is no need to calculate this ratio for the lags higher than 6.
In all three models, we could study the different functional states of the autonomic nervous system characterized by different involvement of its parasympathetic and sympathetic branches. This was reflected in various changes of linear and nonlinear characteristics of HRV. The Poincaré method is very simple in its calculations and is easily perceived visually. However, its wide use is tempered by the lack of standardization. Summarizing the evidence, we could discreetly conclude that SD1/SD2 is not correlated with a linear component of HRV for lag of 5 or 6 heartbeats. Moreover, this index is more informative in Poincaré plot reconstruction with a time lag of 5 or 6 heartbeats in all three models. Our recommendation is justified by the fact that at small lags (l < 4) the Poincaré plot index may not be sensitive enough due to the large autocorrelation function at these lags [38]. At the same time, the majority of authors do not use l > 10 since autocovariance functions monotonically decrease with increasing lag, and the current beat influences only about 6 to 8 successive beats [42]. We also account for some limitations in our deductions. Firstly, it is a small sample size, which does not allow for the wide generalization of our results. Secondly, it was not possible to consider gender differences in our research. Thirdly, our results do not always coincide with other available research conclusions. We also admit that it could be reasonable to reconstruct Poincaré plots with different time lags for different pathologies and functional states.

Acknowledgments

This work was supported by the Kazakhstan Republic Ministry of Healthcare—Scientific and technical program BP013.

Author Contributions

Lyudmila Turgunova and Yelena Laryushina conceived and designed the experiments; Ernur Bekov and Makhabbat Kultenova performed the experiments, Marina Sorokina and Ilya Korshukov analyzed the data, Riszhan Bakirova and Gulmira Muldaeva contributed analysis tools; Berik Koichubekov and Viktor Riklefs wrote the paper.

Conflicts of Interest

The authors declare no conflict of interest.

References

  1. Heart Rate Variability. Standards of Measurement, Physiological Interpretation and Clinical Use. Available online: http://circ.ahajournals.org/content/93/5/1043.long (accessed on 28 September 2017).
  2. Schumacher, J.M. Linear and Nonlinear Approaches to the Analysis of RR Interval Variability. Biol. Res. Nurs. 2004, 5, 211–221. [Google Scholar] [CrossRef] [PubMed]
  3. Buccelletti, F.; Bocci, M.G.; Gilardi, E.; Fiore, V.; Calcinaro, S.; Fragnoli, C.; Maviglia, R.; Franceschi, F. Linear and Nonlinear Heart Rate Variability Indexes in Clinical Practice. Comput. Math. Methods Med. 2012, 2012, 219080. [Google Scholar]
  4. Narin, A.; Isler, Y.; Ozer, M. Investigating the Performance Improvement of HRV Indices in CHF Using Feature Selection Methods Based on Backward Elimination and Statistical Significance. Comput. Biol. Med. 2014, 45, 72–79. [Google Scholar] [CrossRef] [PubMed]
  5. Shi, P.; Hu, S.; Yu, H. Recovery of Heart Rate Variability after Treadmill Exercise Analyzed by Lagged Poincaré Plot and Spectral Characteristics. Med. Biol. Eng. Comput. 2017, 1–11. [Google Scholar] [CrossRef] [PubMed]
  6. La Rovere, M.T.; Pinna, G.D.; Maestri, R.; Barlera, S.; Bernardinangeli, M.; Veniani, M.; Nicolosi, G.L.; Marchioli, R.; Tavazzi, L. Autonomic Markers and Cardiovascular and Arrhythmic Events in Heart Failure Patients: Still a Place in Prognostication? Data from the GISSI-HF Trial. Eur. J. Heart Fail. 2012, 14, 1410–1419. [Google Scholar] [CrossRef] [PubMed]
  7. Voss, A.; Schroeder, R.; Vallverdú, M.; Schulz, S.; Cygankiewicz, I.; Vázquez, R.; de Luna, A.B.; Caminal, P. Short-Term vs. Long-Term Heart Rate Variability in Ischemic Cardiomyopathy Risk Stratification. Front. Physiol. 2013, 4, 364. [Google Scholar] [CrossRef] [PubMed]
  8. Behbahani, S.; Dabanloo, N.J.; Nasrabadi, A.M.; Teixeira, C.A.; Dourado, A. Pre-ictal heart rate variability assessment of epileptic seizures by means of linear and non-linear analyses. Anadolu Kardiyol. Derg. 2013, 13, 797–803. [Google Scholar] [CrossRef] [PubMed]
  9. Neves, V.R.; Takahashi, A.C.; do Santos-Hiss, M.D.; Kiviniemi, A.M.; Tulppo, M.P.; de Moura, S.C.; Karsten, M.; Borghi-Silva, A.; Porta, A.; Montano, N.; et al. Linear and nonlinear analysis of heart rate variability in coronary disease. Clin. Auton. Res. 2012, 22, 175–183. [Google Scholar] [CrossRef] [PubMed]
  10. Linear and Nonlinear Analysis of Heart Rate Variability in Coronary Disease. Available online: https://link.springer.com/article/10.1007/s10286-012-0160-z (accessed on 28 September 2017).
  11. Kunz, V.C.; Borges, E.N.; Coelho, R.C.; Gubolino, L.A.; Martins, L.E.; Silva, E. Linear and nonlinear analysis of heart rate variability in healthy subjects and after acute myocardial infarction in patients. Braz. J. Med. Biol. Res. 2012, 45, 450–458. [Google Scholar] [CrossRef] [PubMed] [Green Version]
  12. Lee, H.G.; Kim, W.-S.; Noh, K.Y.; Shin, J.-H.; Yun, U.; Ryu, K.H. Coronary artery disease prediction method using linear and nonlinear feature of heart rate variability in three recumbent postures. Inf. Syst. Front. 2009, 11, 419–431. [Google Scholar] [CrossRef]
  13. Voss, A.; Kurths, J.; Kleiner, H.J.; Witt, A.; Wessel, N.; Saparin, P.; Osterziel, K.J.; Schurath, R.; Dietz, R. The application of methods of non-linear dynamics for the improved and predictive recognition of patients threatened by sudden cardiac death. Cardiovasc. Res. 1996, 31, 419–433. [Google Scholar] [CrossRef]
  14. Maestri, R.; Pinna, G.D.; Accardo, A.; Allegrini, P.; Balocchi, R.; D’Addio, G.; Ferrario, M.; Menicucci, D.; Porta, A.; Sassi, R.; et al. Nonlinear indices of heart rate variability in chronic heart failure patients: Redundancy and comparative clinical value. J. Cardiovasc. Electrophysiol. 2007, 18, 425–433. [Google Scholar] [CrossRef] [PubMed]
  15. Makikallio, T.H.; Huikuri, H.V.; Makikallio, A.; Sourander, L.B.; Mitrani, R.D.; Castellanos, A.; Myerburg, R.J. Prediction of sudden cardiac death by fractal analysis of heart rate variability in elderly subjects. J. Am. Coll. Cardiol. 2001, 37, 1395–1402. [Google Scholar] [CrossRef]
  16. Huikuri, H.V.; Makikallio, T.H.; Airaksinen, K.E.J.; Seppänen, T.; Puukka, P.; Räihä, I.J.; Sourander, L.B. Power-law relationship of heart rate variability as a predictor of mortality in the elderly. Circulation 1998, 97, 2031–2036. [Google Scholar] [CrossRef] [PubMed]
  17. Stein, P.K.; Barzilay, J.I.; Chaves, P.H.; Mistretta, S.Q.; Domitrovich, P.P.; Gottdiener, J.S.; Rich, M.W.; Kleiger, R.E. Novel measures of heart rate variability predict cardiovascular mortality in older adults independent of traditional cardiovascular risk factors: the cardiovascular health study (CHS). J. Cardiovasc. Electrophysiol. 2008, 19, 1169–1174. [Google Scholar] [CrossRef] [PubMed]
  18. Vikman, S.; Makikallio, T.H.; Yli-Mayry, S.; Pikkujamsa, S.; Koivisto, A.-M.; Reinikainen, P.; Airaksinen, K.E.; Huikuri, H.V. Altered complexity and correlation properties of RR interval dynamics before the spontaneous onset of paroxysmal atrial fibrillation. Circulation 1999, 100, 2079–2084. [Google Scholar] [CrossRef] [PubMed]
  19. Lake, D.E.; Richman, J.S.; Griffin, M.P.; Moorman, J.R. Sample entropy analysis of neonatal heart rate variability. Am. J. Physiol. Regul. Integr. Comp. Physiol. 2002, 283, 789–797. [Google Scholar] [CrossRef] [PubMed]
  20. Ryan, S.M.; Goldberger, A.L.; Pincus, S.M.; Mietus, J.; Lipsitz, L.A. Gender-and age-related differences in heart rate: Are women more complex than men? J. Am. Coll. Cardiol. 1994, 24, 1700–1707. [Google Scholar] [CrossRef]
  21. Yamasaki, Y.; Kodama, M.; Matsuhisa, M. Diurnal heart rate variability in healthy subjects: Effects of aging and sex differences. Am. J. Physiol. 1996, 271, 303–310. [Google Scholar]
  22. Beckers, F.; Verheyden, B.T.; Aubert, A.E. Aging and nonlinear heart rate control in a healthy population. Am. J. Physiol. Heart Circ. Physiol. 2006, 290, 2560–2570. [Google Scholar] [CrossRef] [PubMed]
  23. Owis, M.I.; Abou-Zied, A.H.; Youssef, A.B.M.; Kadah, Y.M. Study of features on nonlinear dynamical modeling in ECG arrhythmia detection and classification. IEEE Trans. Biomed. Eng. 2002, 9, 733–736. [Google Scholar] [CrossRef] [PubMed]
  24. Sun, Y.; Chan, K.L.; Krishnan, S.M. Arrhythmia detection and recognition in ECG signals using nonlinear techniques. Ann. Biomed. Eng. 2000, 28, 37. [Google Scholar]
  25. Cohen, M.; Hudson, D.L.; Deedwania, P.C. Heart rate variability and cardiovascular mortality. IEEE Eng. Med. Biol. Mag. 1996, 15, 97–102. [Google Scholar] [CrossRef]
  26. Sassi, R.; Cerutti, S.; Lombardi, F.; Malik, M.; Huikuri, H.V.; Peng, C.K.; Schmidt, G.; Yamamoto, Y. Advances in heart rate variability signal analysis: Joint position statement by the e-Cardiology ESC Working Group and the European Heart Rhythm Association co-endorsed by the Asia Pacific Heart Rhythm Society. Europace 2015, 17, 1341–1353. [Google Scholar] [CrossRef] [PubMed]
  27. Takens, F. Detecting strange attractors in turbulence. Lect. Notes Math. 1981, 898, 366–372. [Google Scholar]
  28. Kamen, P.W.; Krum, H.; Tonkin, A.W. The Correlation Dimension of Heart Rate Variability Reflects Cardiac Autonomic Activity. Ann. Noninvasive Electrocardiol. 1997, 2, 206–212. [Google Scholar] [CrossRef]
  29. Kamen, P.W.; Tonkin, A.M. Application of the Poincaré plot to heart rate variability: A new measure of functional status in heart failure. Aust. N. Z. J. Med. 1995, 25, 18–26. [Google Scholar] [CrossRef] [PubMed]
  30. Tulppo, M.; Makikallio, T.H.; Takala, T.E. Quantitative beat-to-beat analysis of heart rate dynamics during exercise. Am. J. Physiol. 1996, 71, 244–252. [Google Scholar]
  31. Brennan, M.; Palaniswami, M.; Kamen, P. Do existing measures of Poincaré plot geometry reflect nonlinear features of heart rate variability? IEEE Trans. Biomed. Eng. 2001, 48, 1342–1347. [Google Scholar] [CrossRef] [PubMed]
  32. Toichi, M.; Sugiura, T.; Murai, T.; Sengoku, A. A new method of assessing cardiac autonomic function and its comparison with spectral analysis and coefficient of variation of RR interval. J. Auton. Nerv. Syst. 1997, 62, 79–84. [Google Scholar] [CrossRef]
  33. Hayano, J.; Takahashi, H.; Toriyama, T.; Mukai, S.; Okada, A.; Sakata, S.; Yamada, A.; Ohte, N.; Kawahara, H. Prognostic value of heart rate variability during long-term follow-up in chronic haemodialysis patients with end-stage renal disease. Nephrol. Dial. Transplant. 1999, 14, 1480–1488. [Google Scholar] [CrossRef] [PubMed]
  34. Acharya, U.R.; Joseph, K.P.; Kannathal, N.; Lim, C.M.; Suri, J.S. Heart rate variability: A review. Med. Biol. Eng. Comput. 2006, 44, 1031–1051. [Google Scholar] [CrossRef] [PubMed]
  35. Woo, M.A.; Stevenson, W.G.; Moser, D.K.; Trelease, R.B.; Harper, R.M. Patterns of beat-to-beat heart rate variability in advanced heart failure. Am. Heart J. 1992, 123, 704–710. [Google Scholar] [CrossRef]
  36. Schechtman, V.L.; Lee, M.Y.; Wilson, A.J.; Harper, R.M. Dynamics of respiratory patterning in normal infants and infants who subsequently died of the sudden infant death syndrome. Pediatr. Res. 1996, 40, 571–577. [Google Scholar] [CrossRef] [PubMed]
  37. Makikallio, T.H.; Seppanen, T.; Airaksinen, K.E.; Koistinen, J.; Tulppo, M.P.; Peng, C.K.; Goldberger, A.L.; Huikuri, H.V. Dynamic analysis of heart rate may predict subsequent ventricular tachycardia after myocardial infarction. Am. J. Cardiol. 1997, 80, 779–783. [Google Scholar] [CrossRef]
  38. Lerma, C.; Infante, O.; Perez-Grovas, H. Poincaré plot indexes of heart rate variability capture dynamic adaptations after haemodialysis in chronic renal failure patients. Clin. Physiol. Funct. Imaging 2003, 23, 72–80. [Google Scholar] [PubMed]
  39. Goshvarpour, A.; Goshvarpour, A.; Rahati, S. Analysis of Lagged Poincare Plots in Heart Rate Signals during Meditation. Digit. Signal Process. 2011, 21, 208–214. [Google Scholar] [CrossRef]
  40. Bhaskar, R.; Sobhendu, G. Nonlinear Methods to Assess Changes in Heart Rate Variability in Type 2 Diabetic Patients. Arq. Bras. Cardiol. 2013, 101, 317–327. [Google Scholar]
  41. Contreras, P.; Canetti, R.; Migliaro, R. Correlations between frequency-domain HRV indices and lagged Poincaré plot width in healthy and diabetic subjects. Physiol. Meas. 2007, 28, 85–94. [Google Scholar] [CrossRef] [PubMed]
  42. Thakre, T.P.; Smith, M.L. Loss of lag-response curvilinearity of indices of heart rate variability in congestive heart failure. BMC Cardiovasc. Disord. 2006, 6, 27–33. [Google Scholar] [CrossRef] [PubMed]
  43. Martini, G.; Rabbia, F.; Gastaldi, L.; Riva, P.; Sibona, M.P.; Morra di Cella, S.; Chiandussi, L.; Veglio, F. Heart rate variability and left ventricular diastolic function in patients with borderline hypertension with and without left ventricular hypertrophy. Clin. Exp. Hypertens. 2001, 23, 77–87. [Google Scholar] [CrossRef] [PubMed]
  44. Garcia-Garcia, A.; Gomez-Marcos, M.A.; Recio-Rodriguez, J.I.; Patino-Alonso, M.C.; Rodríguez-Sánchez, E.; Agudo-Conde, C.; García-Ortiz, L.; Vaso-risk group. Office and 24-hour heart rate and target organ damage in hypertensive patients. BMC Cardiovasc. Disord. 2012, 12, 19. [Google Scholar] [CrossRef] [PubMed]
  45. Voss, A.; Heitmann, A.; Schroeder, R.; Peters, A.; Perz, S. Short-term heart rate variability—Age dependence in healthy subjects. Physiol. Meas. 2012, 33, 1289–1311. [Google Scholar] [CrossRef] [PubMed]
  46. Pan, J.; Tompkins, W.J. A real-time QRS detection algorithm. IEEE Trans. Biomed. Eng. 1985, 32, 230–236. [Google Scholar] [CrossRef] [PubMed]
  47. Tarvainen, M.P.; Niskanen, J.-P.; Lipponen, J.A.; Ranta-aho, P.O.; Karjalainen, P.A. Kubios HRV—A Software for Advanced Heart Rate Variability Analysis. In Proceedings of the 4th European Conference of the International Federation for Medical and Biological Engineering, Antwerp, Belgium, 23–27 November 2008; pp. 1022–1025. [Google Scholar]
  48. Heart Rate Variability. Available online: https://www.amazon.com/Heart-Rate-Variability-Marek-Malik/dp/087993607X (accessed on 28 September 2017).
  49. Tarvainen, M.P.; Ranta-Aho, P.O.; Karjalainen, P.A. An advanced detrending method with application to HRV analysis. IEEE Trans. Biomed. Eng. 2002, 49, 172–175. [Google Scholar] [CrossRef] [PubMed]
  50. Theiler, J.; Eubank, S.; Longtin, A. Testing for nonlinearity in time series: The method of surrogate data. Phys. D Nonlinear Phenom. 1992, 58, 77–94. [Google Scholar] [CrossRef]
  51. Some Methods for Classification and Analysis of Multivariate Observations. Available online: https://projecteuclid.org/download/pdf_1/euclid.bsmsp/1200512992 (accessed on 28 September 2017).
  52. Kaplan, D.; Glass, L. Time-Series Analysis Understanding Nonlinear Dynamics; Kaplan, D., Glass, L., Eds.; Springer: New York, NY, USA, 1995. [Google Scholar]
  53. Otzenberger, H.; Gronfier, C.; Simon, C.; Charloux, A.; Ehrhart, J.; Piquard, F.; Brandenberger, G. Dynamic heart rate variability: A tool for exploring sympathovagal balance continuously during sleep in men. Am. J. Physiol. 1998, 275, 946–950. [Google Scholar]
  54. De Vito, G.; Galloway, S.D.R.; Nimmo, M.A.; Maas, P.; McMurray, J.J.V. Efects of central sympathetic inhibition on heart rate variability during steady-state exercise in healthy humans. Clin. Physiol. Funct. Imaging 2002, 22, 32–38. [Google Scholar] [CrossRef] [PubMed]
  55. Jiang, W.; Hayano, J.; Coleman, E.R.; Hanson, M.W.; Frid, D.J.; O’Connor, C.; Thurber, D.; Waugh, R.A.; Blumenthal, J.A. Relation of cardiovascular responses to mental stress and cardiac vagal activity in coronary artery disease. Am. J. Cardiol. 1993, 72, 551–554. [Google Scholar] [CrossRef]
  56. Akselrod, S.; Gordon, D.; Ubel, F.A.; Shannon, D.C.; Berger, A.C.; Cohen, R.J. Power spectrum analysis of heart rate fluctuation: A quantitive probe of beat-to-beat cardiovascular control. Science 1981, 213, 220–222. [Google Scholar] [CrossRef] [PubMed]
  57. Bolis, L.; Licinio, J.; Govoni, S. Handbook of the Autonomic Nervous System in Health and Disease; CRC Press: Boca Raton, FL, USA, 2002. [Google Scholar]
  58. Amenta, F. Aging of the Autonomic Nervous System; CRC Press: Boca Raton, FL, USA, 1993. [Google Scholar]
  59. Julius, S. Autonomic nervous system dysregulation in human hypertension. Am. J. Cardiol. 1991, 67, 3B–7B. [Google Scholar] [CrossRef]
  60. Kaplan, N.M. Primary hypertension: Pathogenesis. In Clinical Hypertension; Kaplan, N.M., Ed.; Williams & Wilkins: Baltimore, MD, USA, 1990; pp. 55–111. [Google Scholar]
  61. Bhaskar, R.; Raghabendra, C.; Ambarish, P.; Sajal, B.; Sasmit, S.; Sobhendu, K.G. Effect of rotating acoustic stimulus on heart rate variability in healthy adults. Open Neurol. J. 2012, 6, 71–77. [Google Scholar]
  62. Manzano, B.M.; Vanderlei, L.C.; Ramos, E.M.; Ramos, D. Acute effects of smoking on autonomic modulation: Analysis by Poincaré plot. Arq. Bras. Cardiol. 2011, 96, 154–160. [Google Scholar] [CrossRef] [PubMed]
  63. Tulppo, M.P.; Makikallio, T.H.; Seppanen, T. Heart rate dynamics during accentuated sympathovagal interaction. Am. J. Physiol. Heart Circ. Physiol. 1998, 274, 810–816. [Google Scholar]
  64. Yamamoto, Y.; Nakamura, Y.; Sato, H. On the fractal nature of heart rate variability in humans: Effects of vagal blockade. Am. J. Physiol. Regul. Integr. Comp. Physiol. 1995, 269, 830–837. [Google Scholar]
  65. Hagerman, I.; Berglund, M.; Lorin, M. Chaos-related deterministic regulation of heart rate variability in time- and frequency domains: Effects of autonomic blockade and exercise. Cardiovasc. Res. 1996, 31, 410–418. [Google Scholar] [CrossRef]
  66. Peng, C.K.; Havlin, S.; Hausdorff, J.M. Fractal mechanisms and heart rate dynamics. Long-range correlations and their breakdown with disease. J. Electrocardiol. 1995, 28, 59–65. [Google Scholar] [CrossRef]
  67. Otsuka, K.; Cornellssent, G.; Halbergt, F. Age, gender and fractal scaling in heart rate variability. Clin. Sci. 1997, 93, 299–308. [Google Scholar] [CrossRef] [PubMed]
  68. Heart Rate Analysis in Normal Subjects of Various Age Groups. Available online: https://biomedical-engineering-online.biomedcentral.com/articles/10.1186/1475-925X-3-24 (accessed on 28 September 2017).
  69. Kagiyama, S.; Tsukashima, A.; Abe, I.; Fujishima, S.; Ohmori, S.; Onaka, U.; Ohya, Y.; Fujii, K.; Tsuchihashi, T.; Fujishima, M. Chaos and spectral analyses of heart rate variability during head-up tilting in essential hypertension. J. Auton. Nerv. Syst. 1999, 76, 153–158. [Google Scholar] [CrossRef]
  70. Shi, P.; Yu, H. Heart Rate Variability in Essential Hypertension Patients with Different Stages by Nonlinear Analysis: A Preliminary Study. Adv. Biomed. Eng. Res. 2013, 1, 33. [Google Scholar]
  71. Poddar, M.G.; Vinod, K.; Yash, P.S. Heart rate variability based classification of normal and hypertension cases by linear–nonlinear method. Def. Sci. J. 2014, 64, 542–548. [Google Scholar] [CrossRef]
  72. Moga, V.D.; Kurcalte, I.; Moga, M.; Vidu, F.; Rezus, C.; Cotet, I.; Avram, R. Dynamics of heart rate and blood pressure in hypertensive patients. J. Exp. Med. Surg. Res. Cercet. Exp. Med. Chir. 2013, 2, 11–16. [Google Scholar]
  73. Mäkikallio, T.H.; Tulppo, M.P.; Seppänen, T.; Huikuri, H.V. Analysis of nonlinear heart rate dynamics in cardiac arrhythmias. Herzschrittmachertherapie Elektrophys. 2000, 11, 131–138. [Google Scholar] [CrossRef]
Figure 1. Changes in Poincaré plot indices (medians) at different time lags.
Entropy 19 00523 g001
Figure 2. Poincaré plot indices (medians) in groups with different balancing of autonomic nervous system activity.
Entropy 19 00523 g002
Figure 3. Age-related differences of lagged Poincaré plot indices (medians).
Entropy 19 00523 g003
Figure 4. Lagged Poincaré plot indices (medians) in healthy volunteers (CG) and hypertensive patients (HG).
Entropy 19 00523 g004
Table 1. Characteristics of all volunteers (Mean (M) ± SD).
TitleSexNAgeHeight, cmWeight, kgBMISBP, mmHgDBP, mmHg
Healthyf158–10132.4 ± 5.528.0 ± 5.816.2 ± 3.1107.4 ± 10.270.5 ± 8.8
2019–21162.2 ± 6.265.4 ± 16.424.3 ± 5.8110 ± 13.573.6 ± 10.8
1835–55160.4 ± 6.469.5 ± 14.326.6 ± 5.3118 ± 14.378.4 ± 11.3
m208–10129.6 ± 4.225.6 ± 6.615.3 ± 4.1115.3 ± 11.675.2 ± 7.5
819–21174.7 ± 7.173.0 ± 14.523.8 ± 4.1118 ± 12.279.5 ± 9.9
1435–55173.4 ± 7.1181.5 ± 14.726.8 ± 4.3124 ± 12.984.6 ± 12.2
Hypertensionf435–55156.8 ± 6.374 ± 15.030.1 ± 5.6137.3 ± 20.386.5 ± 12.0
m1035–55168.1 ± 6.778 ± 16.027.6 ± 5.2140.5 ± 23.886.7 ± 13.3
Table 2. Spearman correlation coefficients between Poincaré plot indices and linear parameters of heart rate at different time lags.
LagTitleSDNNp-LevelRMSSDp-LevelSDSDp-Level
1SD10.94<0.051.00<0.051.00<0.05
SD20.97<0.050.84<0.050.84<0.05
SD1/SD20.63<0.050.80<0.050.80<0.05
2SD10.97<0.050.98<0.050.98<0.05
SD20.97<0.050.85<0.050.85<0.05
SD1/SD20.62<0.050.73<0.050.73<0.05
3SD10.98<0.050.95<0.050.95<0.05
SD20.99<0.050.91<0.050.91<0.05
SD1/SD20.50<0.050.54<0.050.54<0.05
4SD10.98<0.050.93<0.050.93<0.05
SD20.99<0.050.91<0.050.91<0.05
SD1/SD20.42<0.050.44<0.050.44<0.05
5SD10.98<0.050.95<0.050.95<0.05
SD20.99<0.050.90<0.050.90<0.05
SD1/SD20.44<0.050.47<0.050.47<0.05
6SD10.98<0.050.94<0.050.94<0.05
SD20.98<0.050.91<0.050.91<0.05
SD1/SD20.31<0.050.33<0.050.33<0.05
7SD10.98<0.050.93<0.050.93<0.05
SD20.99<0.050.92<0.050.92<0.05
SD1/SD20.07NS 0.09NS 0.09NS
8SD10.98<0.050.93<0.050.93<0.05
SD20.99<0.050.91<0.050.91<0.05
SD1/SD20.02NS 0.06NS 0.06NS
9SD10.98<0.050.95<0.050.95<0.05
SD20.99<0.050.90<0.050.90<0.05
SD1/SD20.06NS 0.15NS 0.15NS
10SD10.98<0.050.95<0.050.95<0.05
SD20.99<0.050.90<0.050.90<0.05
SD1/SD20.05NS 0.16NS 0.16NS
—NS stands for non significant (p > 0.05).
Table 3. Statistical significance (p-levels) of multiple comparisons of SD1/SD2 at different time lags.
Lag12345678910
1-0.000 0.022 0.001 0.000 0.000 0.000 0.000 0.000 0.000
20.000 -0.0650.000 0.000 0.000 0.000 0.000 0.000 0.000
30.0220.065-1.0000.000 0.000 0.000 0.000 0.000 0.000
40.001 0.000 1.000-0.011 0.005 0.024 0.003 0.009 0.012
50.000 0.000 0.000 0.011 -1.0001.0001.0001.0001.000
60.000 0.000 0.000 0.005 1.000-1.0001.0001.0001.000
70.000 0.000 0.000 0.024 1.0001.000-1.0001.0001.000
80.000 0.000 0.000 0.003 1.0001.0001.000-1.0001.000
90.000 0.000 0.000 0.009 1.0001.0001.0001.000-1.000
100.000 0.000 0.000 0.012 1.0001.0001.0001.0001.000-
Multiple Comparisons, Kruskal-Wallis test: p < 0.05.
Table 4. The results of surrogate data analysis.
Lag12345678910
%82787681788269747972
%—percentage of time series of RR intervals for which SD1/SD2 had statistically significant differences from SD1/SD2 calculated from surrogate data (Wilcoxon signed-rank test, p < 0.05) for l = 1 to 10.
Table 5. Linear heart rate variability (HRV) measures in groups with different balancing of the autonomic nervous system (ANS).
TitleGroup 1Group 2
NMeQ25Q75NMeQ25Q75p-Level
HR5769.0363.1874.323876.9168.4382.600.003
SDNN5760.5741.4080.003853.6941.5767.080.242
SDSD5757.4537.7083.123840.5924.9053.930.004
RMSSD5757.3537.6582.993840.5424.8753.850.004
TP575196.892418.439369.49383887.352540.308025.330.455
HFn.u.5736.8926.8354.163824.4317.3935.670.002
LFn.u.5729.2221.3337.223842.2531.8850.720.000
LF/HF570.860.441.23381.561.102.690.000
—statistically significant differences (Mann-Whitney U Test, p < 0.05).
Table 6. Statistical significance (p-levels) of Poincaré plot indices’ difference between groups with balanced and increased sympathetic regulation.
Lag12345678910
SD10.043 0.026 0.032 0.1390.2190.2750.3840.2050.2050.182
SD20.9820.6990.7670.9460.9270.8200.9740.7830.6830.635
SD1/SD20.000 0.000 0.000 0.000 0.016 0.015 0.008 0.001 0.001 0.003
—statistically significant differences (Mann-Whitney U-test, p < 0.05).
Table 7. Statistical significance of differences (p-levels) of SD1/SD2 at various time lags between the age groups.
LagGroupChGYGAG
l = 1ChG-0.4650.000
YG0.465-0.563
AG0.000 0.563-
l = 2ChG-1.0000.002
YG1.000-0.014
AG0.002 0.014 -
l = 3ChG-0.1680.329
YG0.168-0.005
AG0.3290.005 -
l = 4ChG-0.000 0.145
YG0.000 -0.030
AG0.1450.030 -
l = 5ChG-0.000 0.003
YG0.000 -0.048
AG0.003 0.048 -
l = 6ChG-0.000 0.005
YG0.000 -0.047
AG0.005 0.047 -
l = 7ChG-0.001 0.010
YG0.001 -0.264
AG0.010 0.264-
l = 8ChG-0.0580.007
YG0.058-1.000
AG0.007 1.000-
l = 9ChG-0.4010.007
YG0.401-1.000
AG0.007 1.000-
l = 10ChG-1.0000.014
YG1.000-0.590
AG0.014 0.590-
Multiple comparisons, Kruskal-Wallis test: p < 0.05.
Table 8. Lagged Poincaré plot indices in different age groups at l = 5 and 6.
LagAge GroupNSD1
Me (Q25; Q75)
SD2
Me (Q25; Q75)
SD1/SD2
Me (Q25; Q75)
5ChG3544.0 (36.3; 54.1)59.2 (47.9; 72.9)0.75 (0.66; 0.83)
YG2856.4 (42.8; 68.9)65.6 (49.4; 71.6)0.92 (0.82; 1.05)
AG3235.1 (23.2; 56.1)43.1 (30.8; 61.3)0.82 (0.71; 0.96)
6ChG3546.4 (37.7; 57.5)57.7 (45.8; 69.9)0.81 (0.73; 0.89)
YG2857.8 (46.7; 68.4)64.3 (46.2; 70.7)0.99 (0.89; 1.05)
AG3236.4 (24.3; 57.1)41.6 (29.6; 60.3)0.90 (0.77; 1.00)

