Abstract
In this paper the permutation entropy (PE) obtained from heart rate variability (HRV) is analyzed in a statistical model. In this model we also integrate other feature extraction techniques, the cepstrum coefficients derived from the same HRV and a set of band powers obtained from the electrocardiogram derived respiratory (EDR) signal. The aim of the model is detecting obstructive sleep apnea (OSA) events. For this purpose, we apply two statistical classification methods: Logistic Regression (LR) and Quadratic Discriminant Analysis (QDA). For testing the models we use seventy ECG recordings from the Physionet database which are divided into equal-size learning and testing sets. Both sets consist of 35 recordings, each containing a single ECG signal. In our experiments we have found that the features extracted from the EDR signal present a sensitivity of 65.6% and specificity of 87.7% (auc = 85) in the LR classifier, and sensitivity of 59.4% and specificity of 90.3% (auc = 83.9) in the QDA classifier. The HRV-based cepstrum coefficients present a sensitivity of 63.8% and specificity of 89.2% (auc = 86) in the LR classifier, and sensitivity of 67.2% and specificity of 86.8% (auc = 86.9) in the QDA. Subsequent tests show that the contribution of the permutation entropy increases the performance of the classifiers, implying that the complexity of RR interval time series play an important role in the breathing pauses detection. Particularly, when all features are jointly used, the quantification task reaches a sensitivity of 71.9% and specificity of 92.1% (auc = 90.3) for LR. Similarly, for QDA the sensitivity is 75.1% and the specificity is 90.5% (auc = 91.7).
1. Introduction
Obstructive sleep apnea (OSA) is characterized by repetitive pauses of breathing and hypoxia caused by upper airway collapse during sleep [1]. Apnea produces an alteration of the normal sleep architecture with major health implications, ranging from excessive daytime drowsiness to serious cardiac arrhythmias [2].
The most widely accepted diagnostic test for OSA is overnight polysomnography (PSG). However it is an expensive, time-consuming and user-disturbing technique. New variables obtained from electrocardiograms (ECG) can help to overcome the drawbacks from traditional PSG.
Previous studies have tried to diagnostic apnea with good performance using the RR series obtained from the electrocardiogram (ECG), especially after the Physionet Challenge 2000 [3,4]. However, the underlying regulatory mechanisms during apnea are still poorly understood. This fact makes it necessary to explore appropriate feature estimation techniques in order to extract new information.
Permutation entropy (PE) has been applied in different applications, including biomedical aspects [5], being particularly appropriate in the study of complexity of time series from biological systems. PE has been successfully applied to distinguish different heart rate variability (HRV) patterns [6]. The HRV has also been used with relative success in the detection of OSA events [7,8] but to our knowledge, no previous publication had evaluated the performance of this variable to separate patterns of HRV from OSA and normal segments.
The aim of our investigation was to evaluate the PE as a feature extraction technique to extract relevant characteristics present in the HRV. In the context of OSA detection, HRV performance detection is a challenge and the PE appears to be a promising technique to achieve this. This is proven in comparison with other two techniques, cepstrum coefficients derived from the HRV and power obtained at the output of a filter bank applied over the Electrocardiogram Derived Respiratory (EDR) signal. We have also checked the possibility of using the techniques jointly. In order to study the strengths and possibilities of these three feature extraction techniques, we have used two different classifiers, logistic regression (LR) and quadratic discriminant analysis (QDA).
2. Material and Methods
2.1. Database
The database contains 70 records generated for the Computers in Cardiology Challenge 2000, divided into two equal-sized sets: a learning set and a test set. Each recording includes a continuous digitized single channel ECG signal (100 samples per second and 12 bits per sample) and a set of apnea annotations, where a human expert classifies each minute indicating normal breathing or sleep disorder breathing, on the basis of simultaneously recorded breathing signals. In this scoring apnea and hypopnea events were not distinguished. The recordings vary in length, with a mean duration of eight hours.
For each recording, the total number of minutes with apnea was determined. According to the values obtained, the recordings were classified into three groups: Class C (recordings having less than 5 min of disordered breathing); Class A (recordings having 100 or more minutes with disordered breathing); and Class B, a borderline apnea class. The number of recordings of each class was: Class C, twenty, Class A, forty, and class B, ten. Both, the learning and the test sets, contain the same number of recordings of each class.
2.2. Extraction of RR Intervals and Post Processing
The RR series are segmented into five minutes frames, with one minute segment of displacement between adjacent frames. Once the ECG signal is segmented, it is band pass filtered between 40 and 70 Hz. Then the signal is full wave rectified and low pass filtered to 25 Hz.
An interval of values is set around a relative maximum of the output signal, locating the R peak as the maximum value of the ECG signal within that range. The time separation between successive R peaks provides the RR intervals.
The RR intervals obtained from the R-peaks often require the exclusion of artifacts and additional ectopic values so an adaptive filtering procedure for automatic artifact removal was applied [9]. As a result 1.4% of the initial heart beats were removed.
2.3. Variables Obtained from Heart Rate Variability
In this section we briefly explain the main concepts underlying the feature extraction techniques used in the paper. These techniques are permutation entropy, cepstral coefficients and power measures from the electrocardiogram derived respiratory signal.
2.3.1. Permutation Entropy
Heart rate variability originates from the interaction functioning of different control loops can not be completely described by standard linear methods and non-linearity in RR interval series has been reported in the literature [10,11]. Moreover the complexity of RR interval time series appear to be useful in OSA detection and it can be quantified by means of entropy measures [12]. It is well known that many entropy approaches neglect any effect stemming from the temporal order of the values in the successive samples.
Encoding the RR intervals into sequences of symbols is then an option as a feature extraction technique that takes into account this causal information. In this sense, some publications [13–15], have reported the use of PE in the study of heart rate variability.
The authors in [16] have proposed an encoding that reflects the rank order of successive samples in n-length sequences. Thus, permutation entropy (PE) could be defined by:
where
represents the relative frequencies of the possible patterns of symbol sequences which are termed permutations.
Permutation entropy per symbol can be defined by:
The example shown in Figure 1 allows us to see how the permutation entropy can be applied to any data series and to RR intervals in particular. In (a), an example of RR intervals is showed, and in (b) all the possible symbols in case of n = 3 are displayed. The next step in the encoding process consists in calculating the relative frequency of each symbol (for instance Figure 1c represents the frequencies of the sequences in the signal of Figure 1a). Finally, Equation (2) is applied to the corresponding relative frequencies.
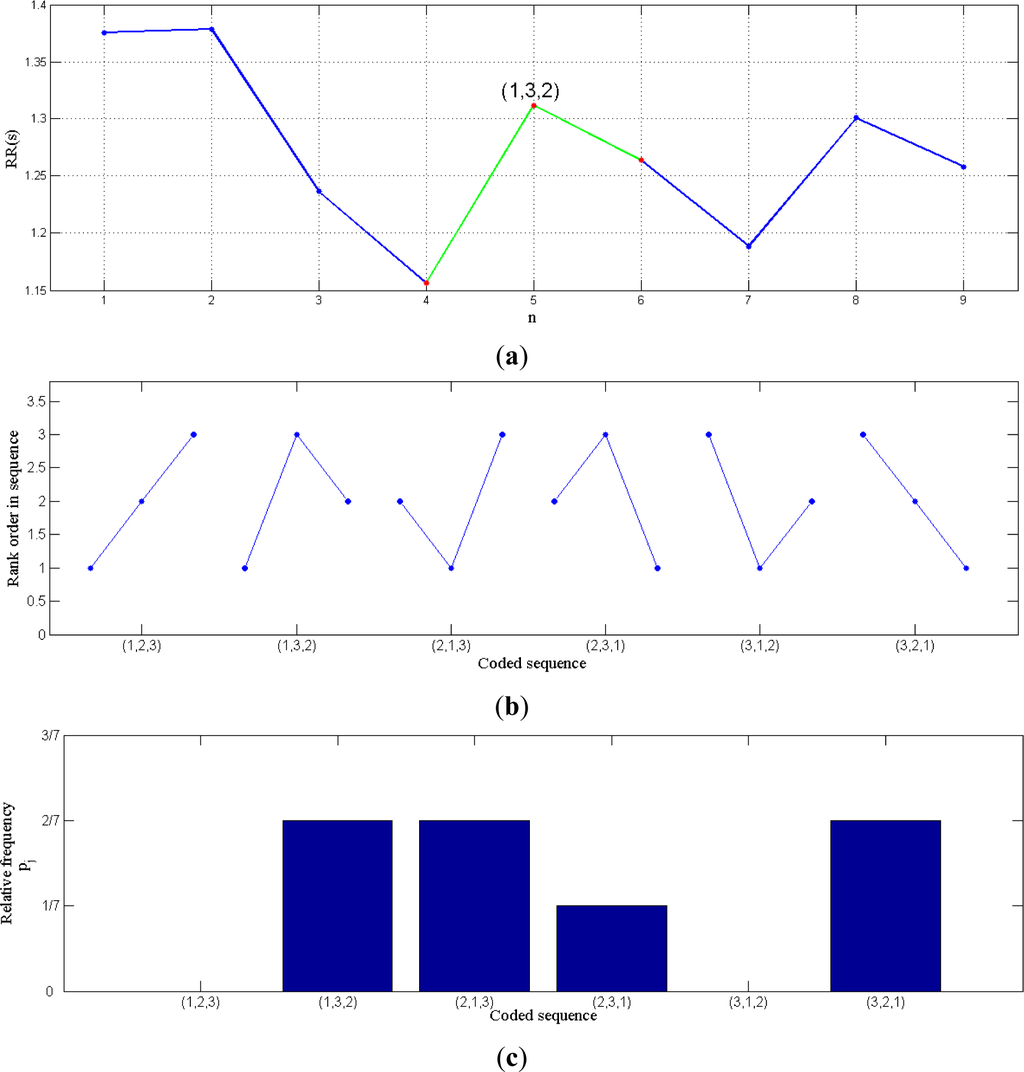
Figure 1.
(a) RR intervals in seconds; (b) All possible symbols for n = 3; (c) Relative frequencies of the sequences in the signal of (a).
In order to handle equal values in the RR intervals, in our study the ranks of the RR values are determined in accordance to their order in the sequence. The selection of the parameters n, determining the length of the sequence and t, as the time delay between successive points in the symbol sequences is a practical aspect that will be taken into consideration [15].
2.3.2. Cepstrum Analysis
Cepstrum is a well known technique for signal analysis and feature extraction. It has been widely used in different applications such as speech analysis, echo detection and removal, or machine diagnostics. In previous studies we have also applied cepstrum coefficients for OSA identification [17,18]. This technique is useful to detect repeated patterns or periodicities in a frequency spectrum, as they will be sensed as specific significant components in the cepstrum.
A key property of the cepstrum analysis is its ability to separate the contribution of two signals which are combined by convolution. Thus, cepstrum analysis is a good choice to extract information from the RR intervals. Let us see why. The RR series carry two different kinds of signals: firstly, a low frequency periodic signal that shows a behavior during apnea episodes, and secondly, a high frequency periodicity called Respiratory Sinus Arrhythmia (RSA). The periodic characteristics of the signal under analysis turn into peaks in both, RSA component and low frequency oscillation due to apnea, in the cepstral representation.
The cepstrum of a signal is usually calculated by computing the inverse Fourier transform (e.g., through the fast version) of the logarithm of the magnitude of the Fourier transform. In our work on the RR series, we use the so-called real cepstrum (see Equation (3)):
From an analysis point of view, we must take into consideration that the independent variable of a cepstral graph is called the quefrency which is a measure of time, though not in the sense of a signal in the time domain. For the results shown in this paper, we take the first 20 of the cepstrum coefficients (Figure 2), as it seems to be sufficient to contain the relevant information of the underlying system.
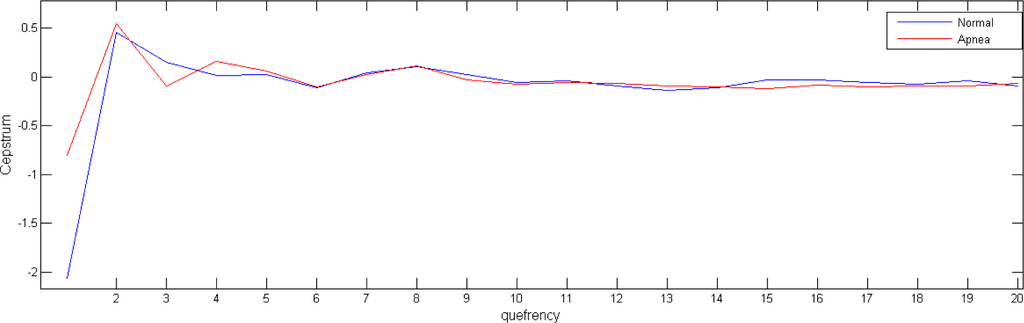
Figure 2.
Cepstrum coefficients obtained in two 5-minutes HRV data windows.
2.3.3. Power Measures from the Electrocardiogram Derived Respiratory Signal
A signal commonly used in apnea detection [10] and used in the experiments is the Electrocardiogram Derived Respiratory (EDR) signal. The usefulness of the EDR comes from the fact that breathing causes a detectable effect on it and can be measured by an appropriate technique.
In our work, the construction of this signal has been performed following the procedure: “R-peak amplitude interpolation”, referred to as Method I in [10] with slight modifications. The EDR is estimated as follows: (1) Generation of two vectors, one with the R-peak occurrence times and one with the R-peak amplitudes. These vectors are further processed to obtain the EDR signal. (2) Generation of an all-zero discrete-time sequence with a sampling rate of 100 Hz. (3) Posting its values with the R-peak amplitudes located at the sample nearest to the R-peak occurrence time. (4) Filtering this new signal with a fifth order low pass digital Butterworth filter with cut-off frequency of 0.4 Hz.
Once the EDR signal is obtained, it is necessary to estimate the feature vectors that will be introduced in the classifier. Each feature vector is obtained from a one-minute epoch of the EDR signal. After estimating the EDR, its power spectral density is estimated by means of a fast Fourier transform (FFT) (see Figure 3c,d). Since the information of interest is in the lower bands [19], a bank of 20 equally spaced filters ranging from 0 to 0.3 Hz is used for feature extraction. Thus power spectrum is obtained over bands of width 0.015 Hz, extracting 20 features, one feature per band.
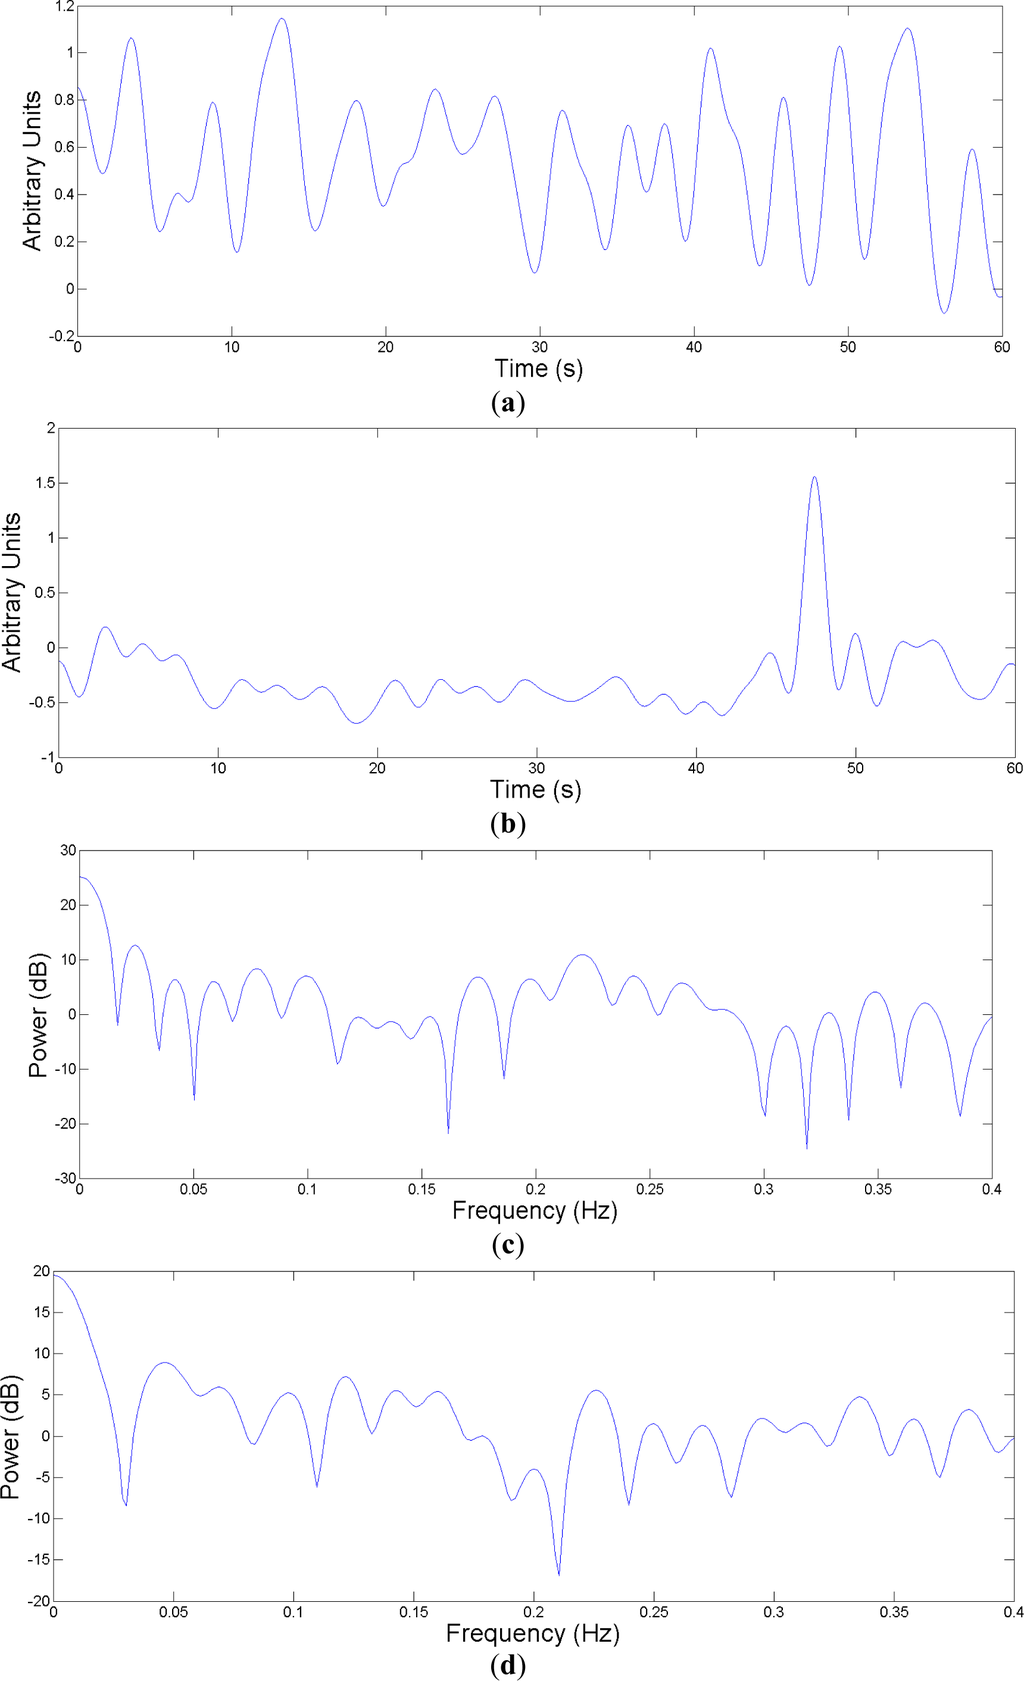
Figure 3.
(a) 1 minute-EDR of a normal breathing; (b) One minute-EDR of an apnea event; (c) and (d) Power spectral density estimates of (a) and (b) respectively.
2.4. Classifiers
In this paper we use two different classifiers to study the strength and possibilities of PE in combination with the rest of feature extraction techniques.
2.4.1. Logistic Regression
In this work, logistic regression (LR) has been proposed in order to discriminate OSA. LR is useful to model the probability of OSA in function of the variables studied. The probability of apnea can be modeled by:
where Xi1, …,Xip represents the input feature vector in the instant i and β0, …, βp, the model parameters. Based on this probability, a threshold-based diagnostic rule that optimizes the classifier performance is defined.
2.4.2. Quadratic Discriminant Analysis
Quadratic discriminant analysis (QDA) [20] is another classifier used to detect breathing pauses. This classifier provides a parametric model that maps the feature inputs to the required output classes and has a set of adjustable parameters that are calculated with the learning data. The models in this study assume that the feature have a class-dependent multivariate Gaussian distribution:
where μk and ∑k are the mean vector and covariance matrix of each class k (apnea and no-apnea class). QDA defines a linear boundary between the classes as:
where πk is the prior probability of class k.
2.5. Experiment Definition
The feature vectors are generated as the concatenation of 20 EDR-based features, 20 cepstral coefficients and 1 PE feature. Once the feature vectors are generated we proceed as follows: a 50 repeated random sub-sampling validation is used with the learning set recordings in order to find the variables that are most highly correlated witch the presence of apnea. On each iteration a random partition of half of the feature vectors is used to train with the rest then used to test. The features are selected greedily. After 50 iterations a corresponding ranking of features has been obtained according to the number of times a specific feature is selected.
In a second step (with the features ordered according to their rankings), the mean misclassification error is calculated for an increasing number of features, using a training and a validation set also chosen through random sub-sampling validation in the learning set repeated 50 times. The final number of selected features is based on the minimum average error per feature count obtained in this last validation process.
Only Group A and C training recordings have been used during this learning phase leaving out group B. Finally, the performance of the classifier is evaluated for the independent 35 test recordings with the features selected in the previous step. Group A, B and C test recordings were taken into account in this phase.
3. Results
The apnea quantification task is defined for intervals of one minute and for each interval the classifiers (LR and QDA) give a decision on the presence of OSA. PE and Cepstrum coefficients are obtained in five minutes RR segments with one minute of displacement. EDR has been obtained in one minute RR segments and also one minute of displacement.
A set of experiments were conducted to determine the capacity of PE to discriminate between intervals with and without OSA. We have tested different orders for PE between 3 and 7 and delays of 2 and 3 as indicated in [15] for HRV applications. One-way analysis of variance is calculated for PE with different orders and delays (Table 1). We tested for differences among groups obtaining F statistic as the quotient between the variances between and within groups and p value. We denote PE calculations as PEnt where n is the order, t the delay and the entropy value as hn. Minimal variations in performance were obtained for different orders and delays but finally, we selected PE53 for its slightly better statistical properties.

Table 1.
One-way analysis of variance of PEnt where n is the order and t the delay.
Boxplots are also presented in Figure 4 for different PE calculations where it is possible to observe the degree of dispersion of the features for both groups. Table 2 summarizes the results of evaluating the independent 35 test recordings with the features selected for both classifiers. The optimal number of selected features is also shown after performing the training process and feature selection. Logarithm transformation of PE and EDR-derived features is applied in order to reduce the skew of these variables. From our classification score we can see that the LR and QDA classifiers are robust against violations of gaussianity, and it is in line with other results in literature [21,22].
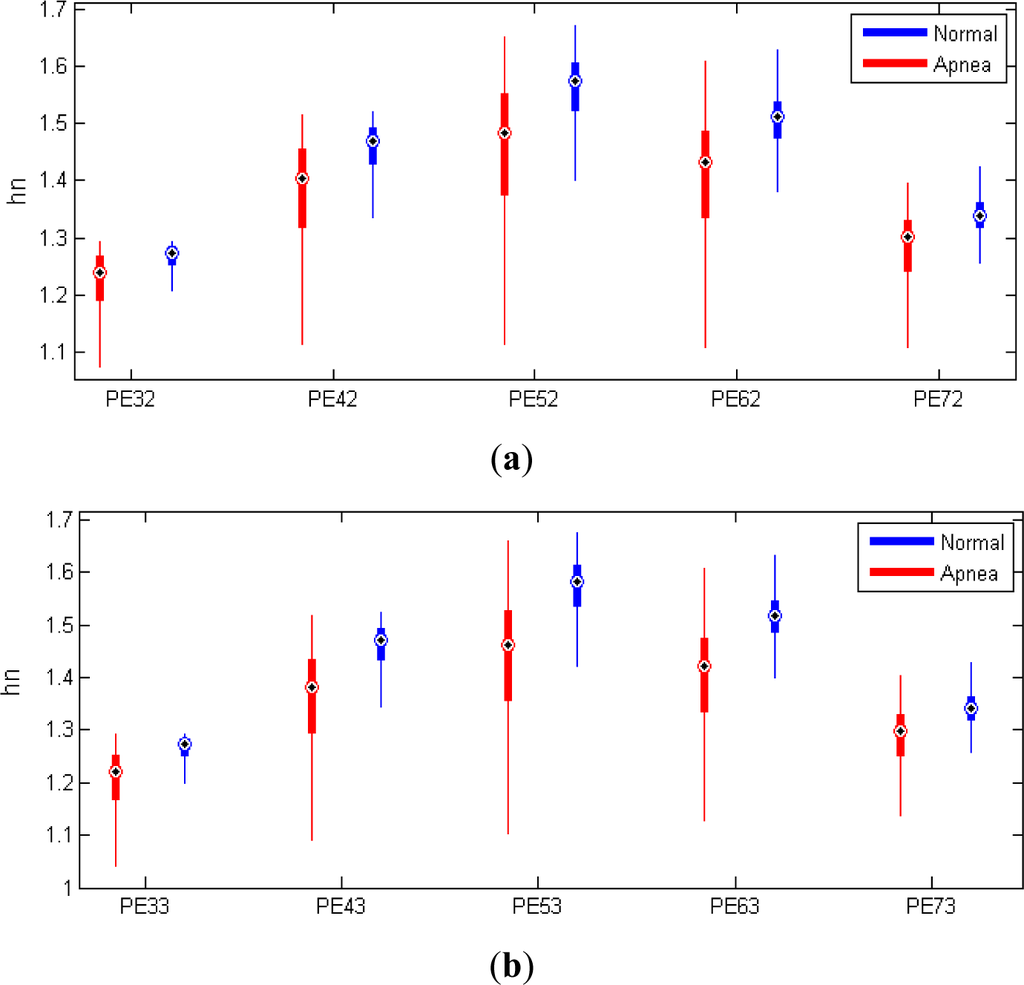
Figure 4.
Boxplot for the variables PEnt in apnea and normal segments for different values of order n and delay t. (a) Order = 2; (b) Order = 3.
Table 2.
Classifier performance in terms of the feature types, classifier and the number of features.
In a first stage, only EDR-derived features have been studied for both LR and QDA classifier. The addition of PE in the feature vector allowed an increase in accuracy from 79.3% to 84.1% for LR and from 78.5% to 83.1% for QDA. PE occupied the first position in the ranking of selected features, expressing its high discrimination capacity. Regarding the cepstrum coefficients, also in this case the addition of PE in the feature vector, allowed an increase of performance from 79.7% to 82.3% for LR and from 79.3% to 82.7% for QDA. Also in these experiments, PE was selected the first, in the feature selection process.
A final experiment was also carried out with the inclusion of the entire feature set reaching a sensitivity of 71.9% and specificity of 92.1% (auc = 90.3) for LR and sensitivity of 75.1% and specificity of 90.5% (auc = 91.7) for QDA. In this case, performance increased from 82.7% to 84.4% for LR and from 83.3% to 84.6% for QDA when PE was added to the set of features composed by EDR and cepstrum.
Figure 5 shows the misclassification error obtained for the learning set for LR and QDA with EDR, cepstrum and PE. The graphics show the evaluation of the error for cross validation and training data from the learning set in function of the number of variables selected, for each combination of features.
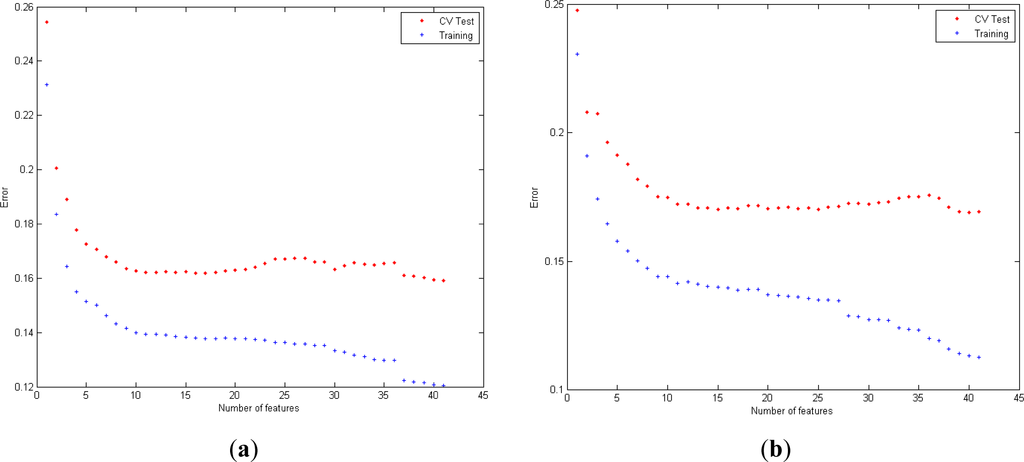
Figure 5.
Evaluation of misclassification error for variables obtained from EDR+Cepstrum+PE series with LR classifier (a) and with QDA classifier (b).
Concerning the relevance of the feature selected in EDR, optimal performance for LR is reached with all the features (20). Regarding QDA, the following features are selected (spectral power of EDR in bands (2, 3, 1, 7, 6, 11, 8, 9, 10, 12, 5 and 14).
In the case of cepstrum analysis, optimal accuracy in both LR and QDA is reached when all the coefficients (20) are selected. The contribution of variables situated in frequency 4, related to the respiratory sinus arrhythmia (RSA) component (0.25 cycles/beat), is selected the first, in the feature selection process. Cepstrum in frequencies 15 and 16 are also selected as one of the most significant groups of variables and are related to the low frequency fluctuation in breathing sleep pauses.
Similar significant information of the variable PE can be found in the combination EDR+Cepstrum+PE, being selected in first place in a set of 41 features when it is added to the rest of variables (cepstrum coefficients and EDR).
4. Discussion
To our knowledge this is the first publication that evaluates the introduction of permutation entropy in the detection of apnea. This evaluation has been performed starting with feature vectors extracted from the HRV and the EDR signals. The validation of the proposed model has demonstrated an increase in classification performance when this variable was added to the rest of features, EDR and cepstrum.
Temporal order of the values in the successive RR intervals seems to present relevant information according to the results obtained by the inclusion of that variable. Moreover, permutation entropy has shown the efficiency at distinguishing between OSA from normal patterns. Some of the most interesting features of permutation entropy are its simplicity and ability to detect OSA pattern in the heart rhythm.
PE is selected in the feature selection process in the first positions in any combination (EDR+PE, Cepstrum+PE and EDR+Cepstrum+PE), showing a good OSA quantification performance and presenting a classifier with a reduced complexity.
From our experiments and results, we have found that new significant information can be extracted from the Permutation Entropy. The corresponding features have a promising discriminative capacity which is coherent with the results reported by other authors in different fields. When used jointly with the rest of features extracted from the HRV, the PE-based feature can provide more complete elements for the diagnosis systems.
Author Contributions
Antonio G. Ravelo-García: conception and design of the study, analysis of the data, interpretation of the data, drafting the article. Juan L. Navarro-Mesa: interpretation of the data, drafting the article, critical revision of the manuscript. Ubay Casanova-Blancas: analysis of the data, drafting the article, critical revision of the manuscript. Sofía Martín-González: interpretation of the data, drafting the article, critical revision of the manuscript. Pedro Quintana-Morales: analysis tools, critical revision of the manuscript. Iván Guerra-Moreno: analysis tools, critical revision of the manuscript. Jose M. Canino-Rodríguez: analysis tools, critical revision of the manuscript. Eduardo Hernández-Pérez: analysis tools, critical revision of the manuscript. All authors have read and approved the final manuscript.
Conflicts of Interest
The authors declare no conflict of interest.
References
- Becker, H.F.; Jerrentrup, A.; Ploch, T.; Grote, L.; Penzel, T.; Sullivan, C.E.; Peter, J.H. Effect of nasal continuous positive airway pressure treatment on blood pressure in patients with obstructive sleep apnea. Circulation 2003, 107, 68–73. [Google Scholar]
- Ravelo, A.; Travieso, C.; Lorenzo, F.; Navarro, J.; Martin, S.; Alonso, J.; Ferrer, M. Application of support vector machines and gaussian mixture models for the detection of obstructive sleep apnoea based on the RR series. WSEAS Trans. Comput. 2006, 5, 121–124. [Google Scholar]
- Penzel, T.; Moody, G.B.; Mark, R.G.; Goldberger, A.L.; Peter, J.H. The apnea-ECG database. Proceedings of Computers in Cardiology 2000, Cambridge, MA, USA, 24–27 September 2000; pp. 255–258.
- Goldberger, A.L.; Amaral, L.A.N.; Glass, L.; Haussdorff, J.M.; Ivanov, P.C.; Mark, R.G.; Mietus, J.E.; Moody, G.B.; Peng, C.K.; Stanley, H.E.; Physiobank, PhysioToolkit. PhysioNet: Components of a New Research Resource for Complex Physiologic Signals. Circulatio 2000, 101, 215–220. [Google Scholar]
- Zanin, M.; Zunino, L.; Rosso, O.A.; Papo, D. Permutation Entropy and Its Main Biomedical and Econophysics Applications: A Review. Entropy 2012, 14, 1553–1577. [Google Scholar]
- Bian, C.; Qin, C.; Ma, Q.D.Y.; Shen, Q. Modified permutation-entropy analysis of heartbeat dynamics. Phys. Rev. E 2012, 85, 021906. [Google Scholar]
- Penzel, T.; McNames, J.; Murray, A.; de Chazal, P.; Moody, G.; Raymond, B. Systematic comparison of different algorithms for apnoea detection based on electrocardiogram recordings. Med. Biol. Eng. Comput. 2002, 40, 402–407. [Google Scholar]
- Ravelo-García, A.G.; Saavedra-Santana, P.; Juliá-Serdá, G.; Navarro-Mesa, J.L.; Navarro-Esteva, J.; Álvarez-López, X.; Gapelyuk, A.; Penzel, T.; Wessel, N. Symbolic dynamics marker of heart rate variability combined with clinical variables enhance obstructive sleep apnea screening. Chaos 2014, 24, 024404. [Google Scholar]
- Wessel, N.; Voss, A.; Malberg, H.; Ziehmann, C.; Schirdewan, A.; Meyerfeldt, U.; Kurths, J. Nonlinear analysis of complex phenomena in cardiological data. Herzschrittmachertherapie und Elektrophysiologie 2000, 11, 159–173. [Google Scholar]
- Kurths, J.; Voss, A.; Witt, A.; Saparin, P.; Kleiner, H.J.; Wessel, N. Quantitative analysis of heart rate variability. Chaos 1995, 5, 88–94. [Google Scholar]
- Voss, A.; Kurths, J.; Kleiner, H.J.; Witt, A.; Wessel, N.; Saparin, P.; Osterziel, K.J.; Schumann, R.; Dietz, R. The application of methods of non-linear dynamics for the improved and predictive recognition of patients threatened by sudden cardiac death. Cardiovasc. Res. 1996, 31, 419–433. [Google Scholar]
- Riedl, M.; Müller, A.; Wessel, N. Practical considerations of permutation entropy. Eur. Phys. J. Spec. Top. 2013, 222, 249–26. [Google Scholar]
- Zanin, M.; Zunino, L.; Rosso, O.A.; Papo, D. Permutation Entropy and Its Main Biomedical and Econophysics Applications: A Review. Entropy 2012, 14, 1553–1577. [Google Scholar]
- Parlitz, U.; Berg, S.; Luther, S.; Schirdewan, A.; Kurths, J.; Wessel, N. Classifying cardiac biosignals using ordinal pattern statistics and symbolic dynamics. Comput. Biol. Med. 2012, 42, 319–327. [Google Scholar]
- Frank, B.; Pompe, B.; Schneider, U.; Hoyer, D. Permutation entropy improves fetal behavioural state classification based on heart rate analysis from biomagnetic recordings in near term fetuses. Med. Biol. Eng. Comput. 2006, 44, 179–187. [Google Scholar]
- Bandt, C.; Pompe, B. Permutation Entropy: A Natural Complexity Measure for Time Series. Phys. Rev. Lett. 2002, 88, 174102. [Google Scholar]
- Ravelo-Garcia, A.; Navarro-Mesa, J.L.; Martin-González, S.; Hernández-Pérez, E.; Quintana-Morales, P.; Guerra-Moreno, I.; Navarro-Esteva, J.; Juliá-Serdá, G. Cepstrum Coefficients of the RR Series for the Detection of Obstructive Sleep Apnea Based on Different Classifiers. Proceedings of the 14th International Conference on Computer Aided Systems Theory, Las Palmas de Gran Canaria, Spain, 10–15 February 2013; pp. 266–271.
- Ravelo-Garcia, A.; Navarro-Mesa, J.; Hernádez-Pérez, E.; Martin-González, S.; Quintana-Morales, P.; Guerra-Moreno, I.; Juliá-Serdá, G. Cepstrum Feature Selection for the Classification of Sleep Apnea-Hypopnea Syndrome based on Heart Rate Variability. Proceedings of 2013 Computing in Cardiology Conference (CinC), Zaragoza, Spain, 22–25 September 2013; pp. 959–962.
- O’Brien, C.; Heneghan, C. A comparison of algorithms for estimation of a respiratory signal from the surface electrocardiogram. Comput. Biol. Med. 2007, 37, 305–314. [Google Scholar]
- Hastie, T.J.; Tibshirani, R.J. Generalized Additive Models; Chapman & Hall: London, UK, 1986; pp. 297–310. [Google Scholar]
- Clarke, W.; Lachenbruch, P.; Broffitt, B. How non-normality affects the quadratic discriminant function. Commun. Stat.-theory Methods 1979, 8, 1285–1301. [Google Scholar]
- Patuwo, E.; Michael, Y.H.; Ming, S. Two-Group Classification Using Neural Networks. Decis. Sci. 1993, 24, 825–845. [Google Scholar]
© 2015 by the authors; licensee MDPI, Basel, Switzerland This article is an open access article distributed under the terms and conditions of the Creative Commons Attribution license (http://creativecommons.org/licenses/by/4.0/).