
Tone Entropy Analysis of Foetal Heart Rate Variability


Abstract
:1. Introduction
2. Methods
2.1. Data
2.2. Multi-Lag T-E Analysis of HRV Signal
2.3. Statistics
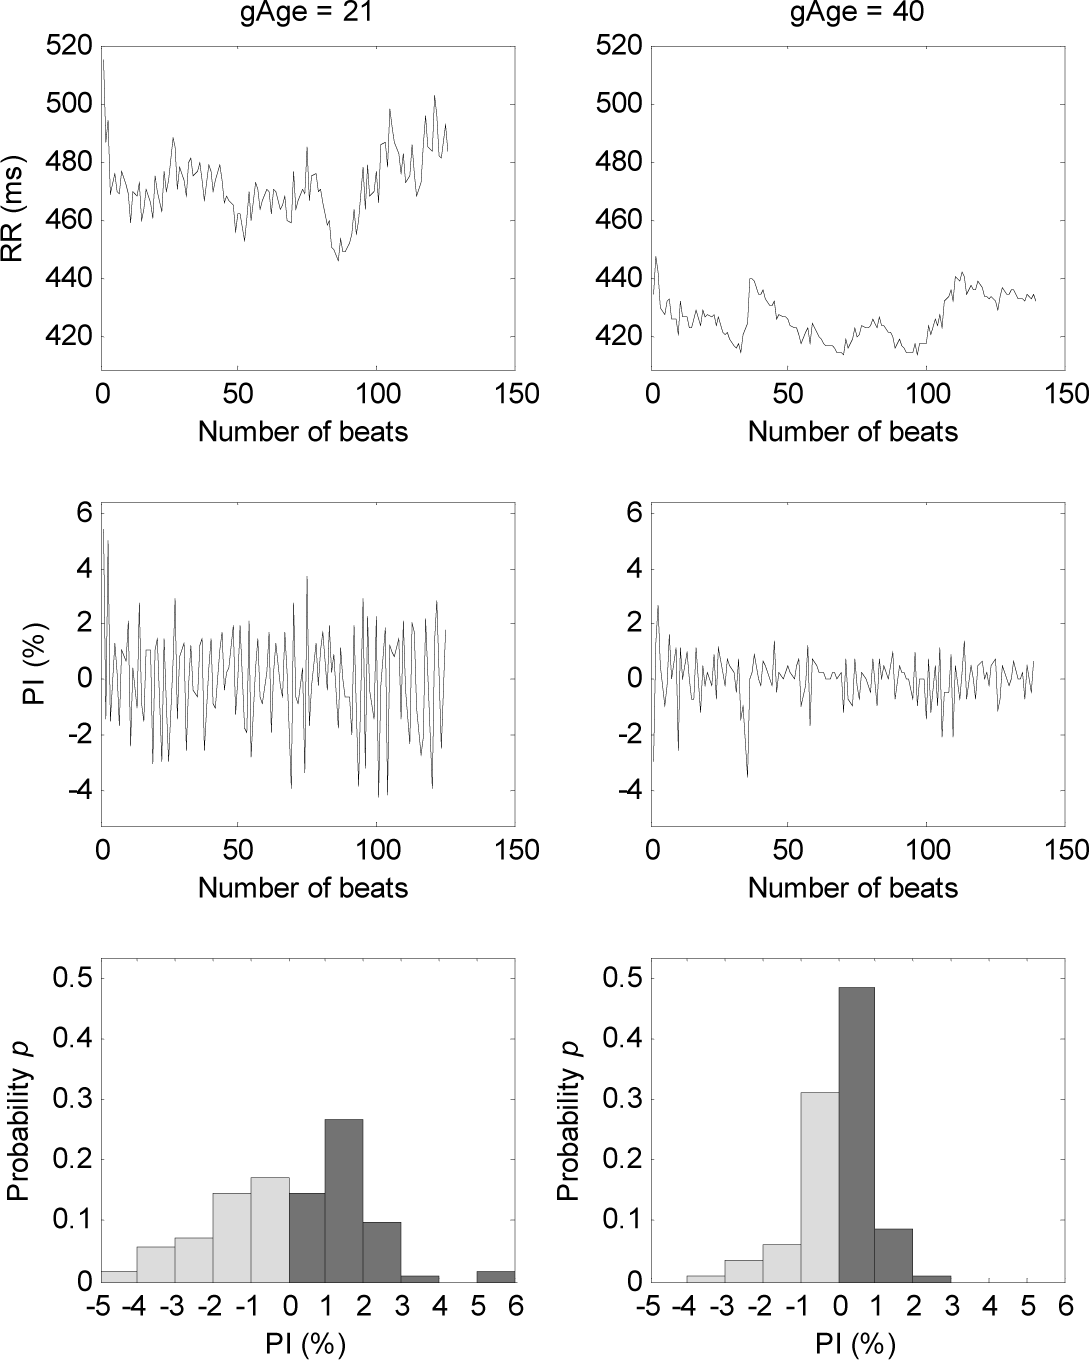
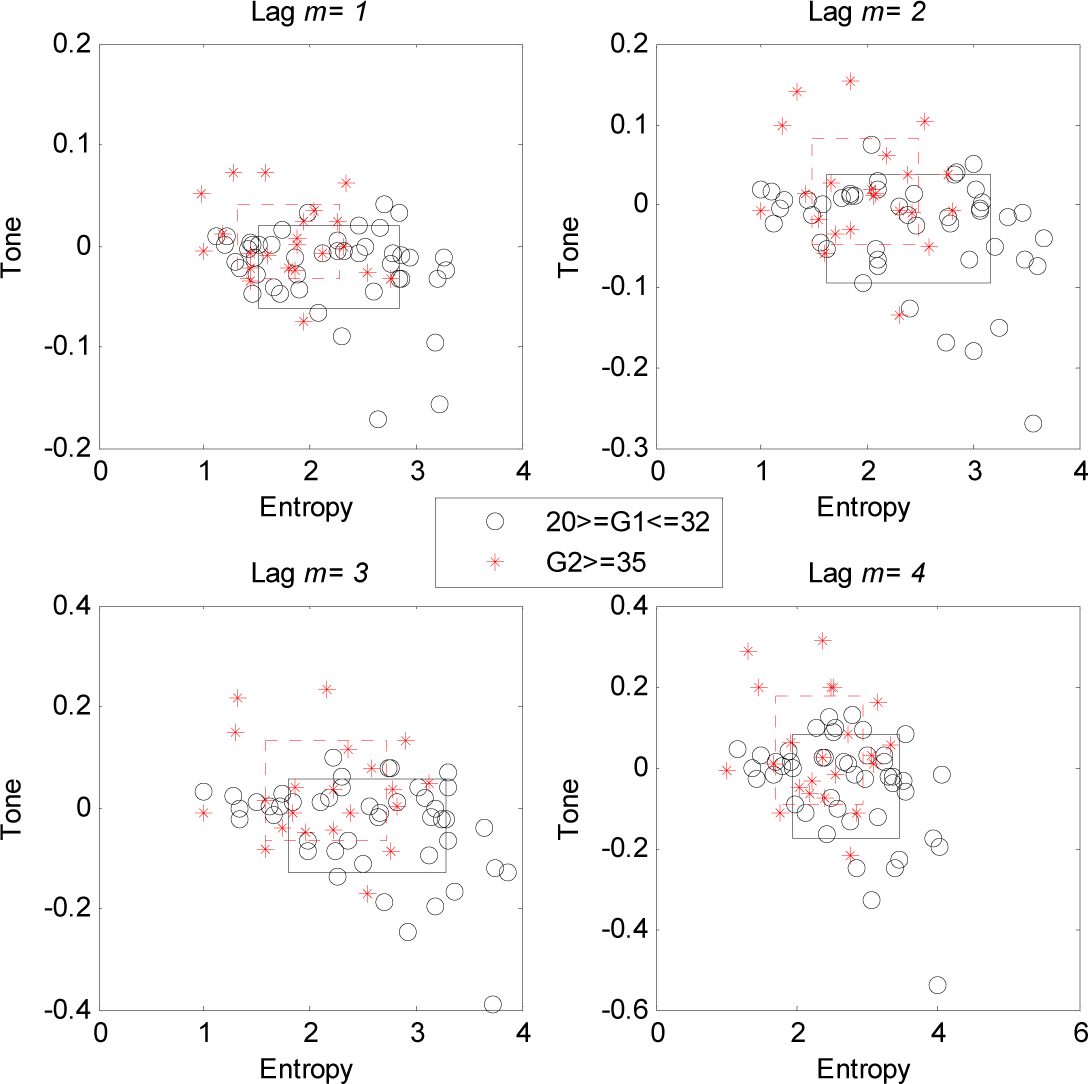
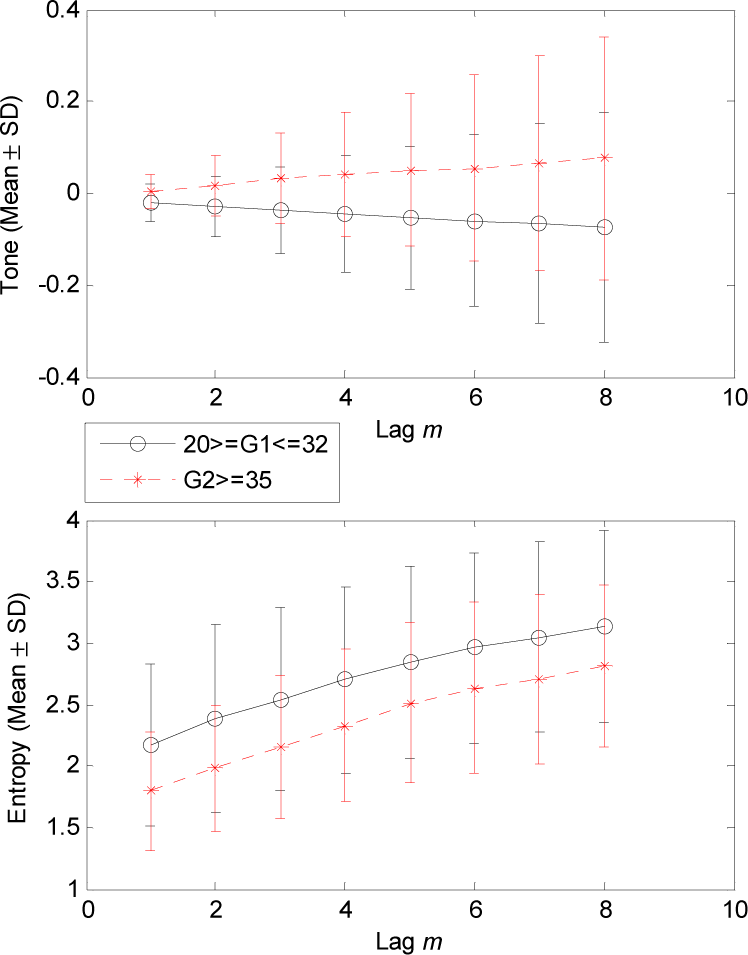
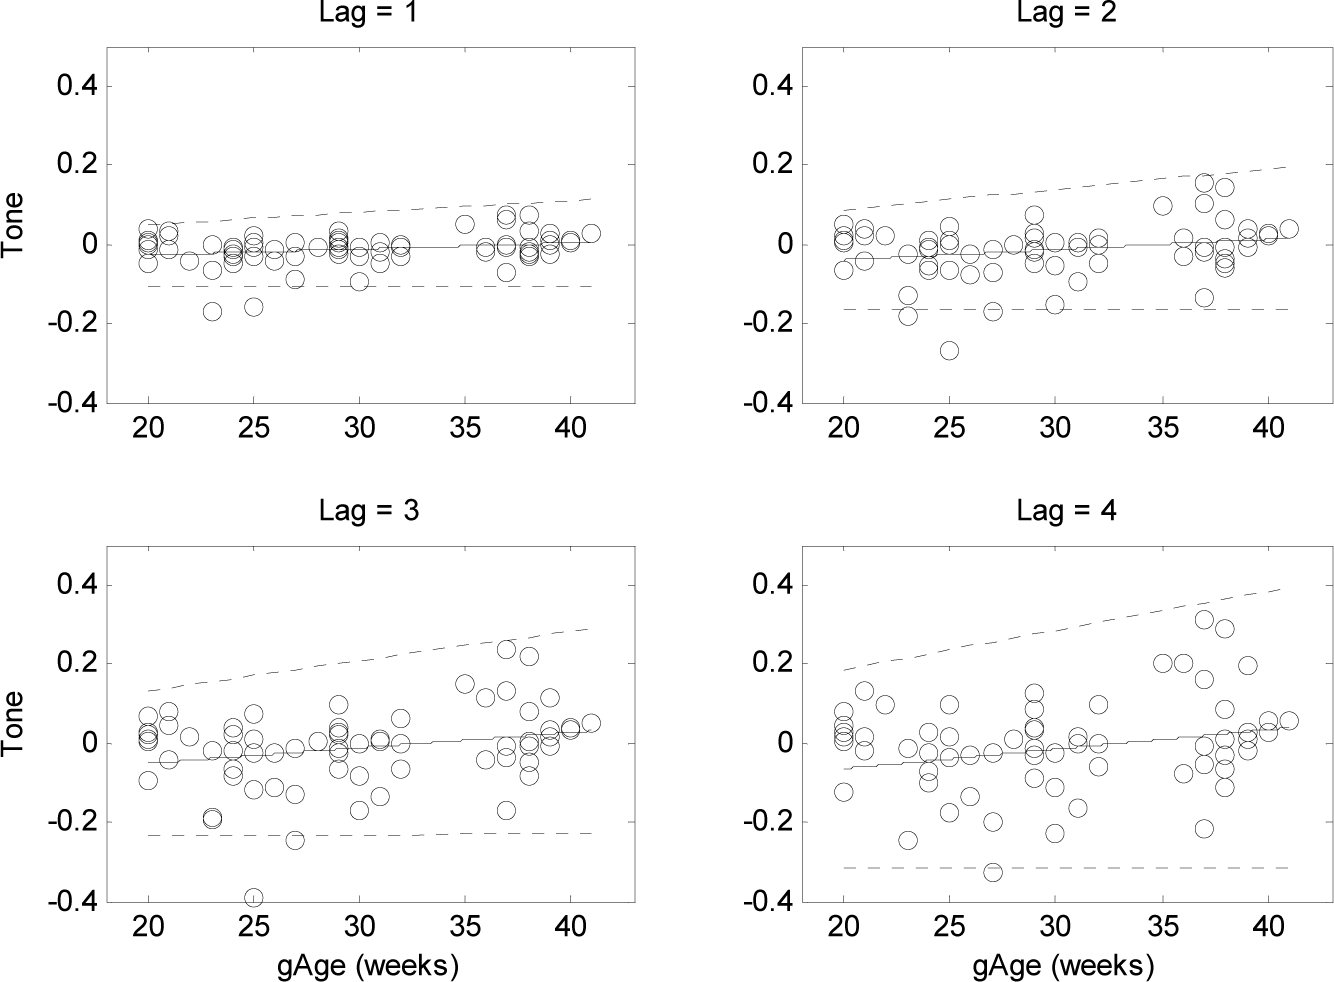
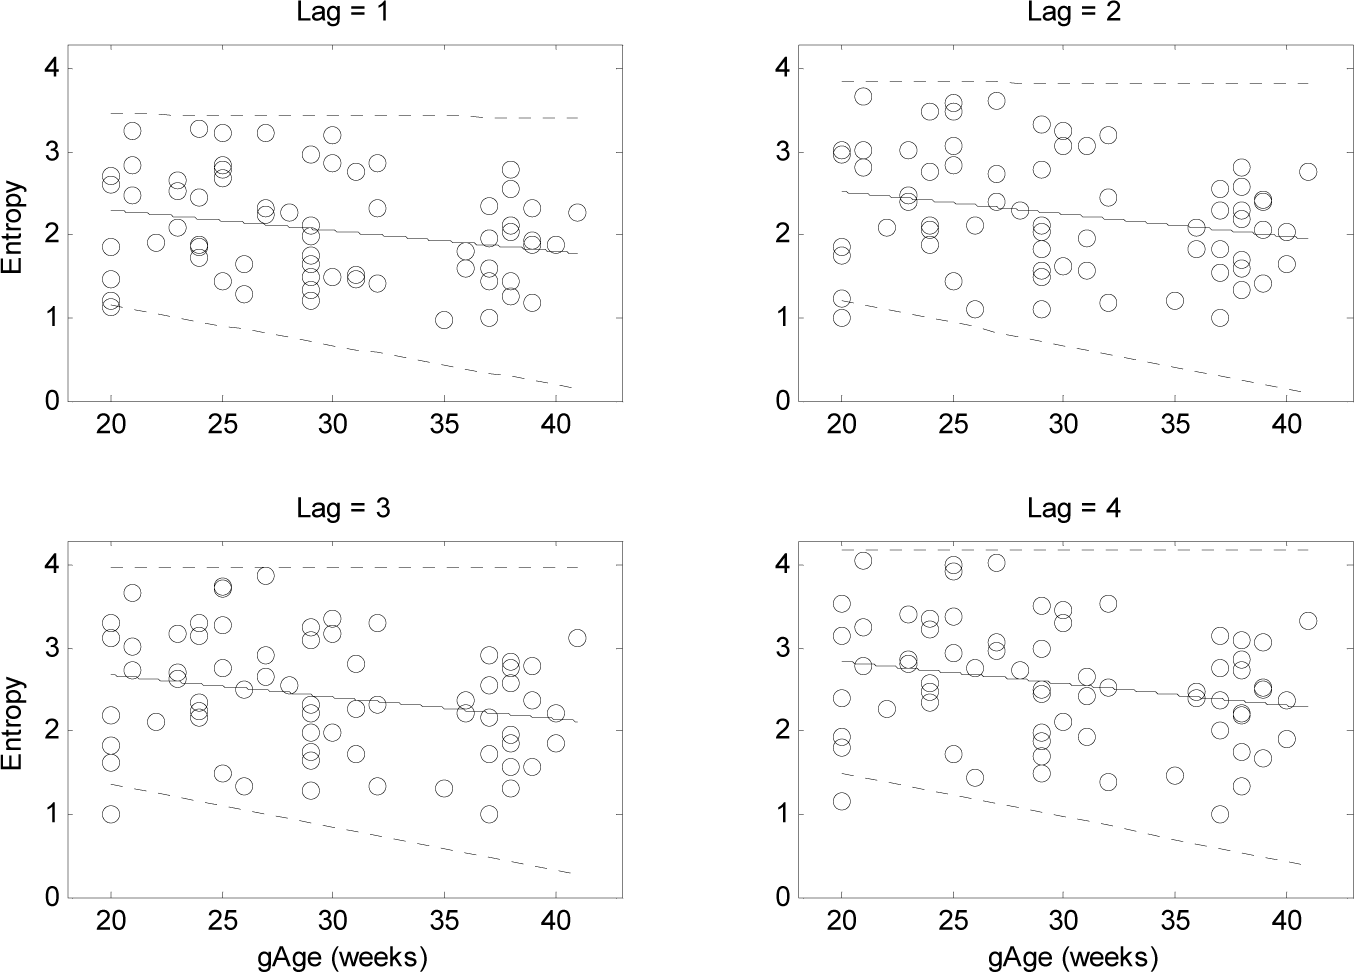
3. Results
4. Discussion
4.1. Changes of T-E Values at Different Lags
4.2. Gradual Increase in Sympathetic Activity with Foetal Cardiovascular Development
4.3. Alteration of Sympatho-Vagal Balance with the Gestational Ages
5. Conclusions
Acknowledgments
Author Contributions
Conflicts of Interest
References
- Ohta, T.; Okamura, K.; Kimura, Y.; Suzuki, T.; Watanabe, T.; Yasui, T.; Yaegashi, N.; Yajima, A. Alteration in the low-frequency domain in power spectral analysis of fetal heart beat fluctuations. Fetal Diagn. Ther. 1999, 14, 92–97. [Google Scholar]
- Renou, P.; Newman, W.; Wood, C. Autonomic control of fetal heart rate. Am. J. Obstet. Gynecol. 1969, 105, 949–953. [Google Scholar]
- Gagnon, R.; Campbell, K.; Hunse, C.; Patrick, J. Patterns of human-fetal heart-rate accelerations from 26 weeks to term. Am. J. Obstet. Gynecol. 1987, 157, 743–748. [Google Scholar]
- Druzin, M.L. Antepartum fetal heart-rate monitoring. State of the art. Clin. Perinatol. 1989, 16, 627–642. [Google Scholar]
- Oida, E.; Moritani, T.; Yamori, Y. Tone-entropy analysis on cardiac recovery after dynamic exercise. J. Appl. Physiol. 1997, 82, 1794–1801. [Google Scholar]
- Oida, E.; Kannagi, T.; Moritani, T.; Yamori, Y. Aging alteration of cardiac vagosympathetic balance assessed through the tone-entropy analysis. J. Gerontol. A 1999, 54, M219–M224. [Google Scholar]
- Karmakar, C.K.; Khandoker, A.H.; Jelinek, H.F.; Palaniswami, M. Risk stratification of cardiac autonomic neuropathy based on multi-lag tone-entropy. Med. Biol. Eng. Comput. 2013, 51, 537–546. [Google Scholar]
- Lerma, C.; Infante, O.; Perez-Grovas, H.; Jose, M.V. Poincare plot indexes of heart rate variability capture dynamic adaptations after haemodialysis in chronic renal failure patients. Clin. Physiol. Funct. Imaging. 2003, 23, 72–80. [Google Scholar]
- Sato, M.; Kimura, Y.; Chida, S.; Ito, T.; Katayama, N.; Okamura, K.; Nakao, M. A novel extraction method of fetal electrocardiogram from the composite abdominal signal. IEEE Trans. Biomed. Eng. 2007, 54, 49–58. [Google Scholar]
- Pan, J.; Tompkins, W.J. A real-time QRS detection algorithm. IEEE Trans. Biomed. Eng. 1985, 32, 230–236. [Google Scholar]
- Amano, M.; Oida, E.; Moritani, T. Age-associated alteration of sympatho-vagal balance in a female population assessed through the tone-entropy analysis. Eur. J. Appl. Physiol. 2005, 94, 602–610. [Google Scholar]
- Shannon, C.E. A mathematical theory of communication. Bell Syst. Tech. J. 1948, 27, 379–423. [Google Scholar]
- Gierałtowski, J.; Hoyer, D.; Tetschke, F.; Nowack, S.; Schneider, U.; Żebrowski, J. Development of multiscale complexity and multifractality of fetal heart rate variability. Auton. Neurosci. 2013, 178, 29–36. [Google Scholar]
- Van Leeuwen, P.; Cysarz, D.; Edelhäuser, F.; Grönemeyer, D. Heart rate variability in the individual fetus. Auton. Neurosci. 2013, 178, 24–28. [Google Scholar]
- Khandoker, A.H.; Jelinek, H.F.; Moritani, T.; Palaniswami, M. Association of cardiac autonomic neuropathy with alteration of sympatho-vagal balance through heart rate variability analysis. Med. Eng. Phys. 2010, 32, 161–167. [Google Scholar]
- Bootsma, M.; Swenne, C.A.; Vanbolhuis, H.H.; Chang, P.C.; Cats, V.M.; Bruschke, A.V.G. Heart-rate and heart-rate-variability as indexes of sympathovagal balance. Am. J. Physiol. 1994, 266, H1565–H1571. [Google Scholar]
- Tulppo, M.P.; Hughson, R.L.; Makikallio, T.H.; Airaksinen, K.E.J.; Seppanen, T.; Huikuri, H.V. Effects of exercise and passive head-up tilt on fractal and complexity properties of heart rate dynamics. Am. J. Physiol. Heart Circ. Physiol. 2001, 280, H1081–H1087. [Google Scholar]
- James, T.N. Cardiac conduction system: Fetal and postnatal development. Am. J. Cardiol. 1970, 25, 213–226. [Google Scholar]
- Assali, N.S.; Brinkman, C.R.; Woods, J.R.; Dandavino, A.; Nuwayhid, B. Development of neurohumoral control of fetal, neonatal, and adult cardiovascular functions. Am. J. Obstet. Gynecol. 1977, 129, 748–759. [Google Scholar]
- Hayashi, R.; Nakai, K.; Fukushima, A.; Itoh, M.; Sugiyama, T. Development and significance of a fetal electrocardiogram recorded by signal-averaged high-amplification electrocardiography. Int. Heart J. 2009, 50, 161–171. [Google Scholar]
- Porges, S.W. The polyvagal theory: Phylogenetic substrates of a social nervous system. Int. J. Psychophysiol. 2001, 42, 123–146. [Google Scholar]


| Parameter | Lag m | G1 (46) Mean ± SD | G2 (22) Mean ± SD | p |
|---|---|---|---|---|
| Tone | 1 | −0.02 ± 0.04 | 0.00 ± 0.04 | 0.019 |
| 2 | −0.03 ± 0.07 | 0.02 ± 0.07 | 0.009 | |
| 3 | −0.04 ± 0.09 | 0.03 ± 0.10 | 0.008 | |
| 4 | −0.05 ± 0.13 | 0.04 ± 0.14 | 0.013 | |
| 5 | −0.05 ± 0.16 | 0.05 ± 0.17 | 0.014 | |
| 6 | −0.06 ± 0.19 | 0.06 ± 0.20 | 0.023 | |
| 7 | −0.07 ± 0.22 | 0.07 ± 0.23 | 0.026 | |
| 8 | −0.07 ± 0.25 | 0.08 ± 0.26 | 0.026 | |
| Entropy | 1 | 2.18 ± 0.66 | 1.80 ± 0.49 | 0.019 |
| 2 | 2.39 ± 0.77 | 1.98 ± 0.51 | 0.028 | |
| 3 | 2.54 ± 0.74 | 2.15 ± 0.58 | 0.034 | |
| 4 | 2.70 ± 0.76 | 2.33 ± 0.62 | 0.049 | |
| 5 | 2.84 ± 0.78 | 2.51 ± 0.65 | NS | |
| 6 | 2.96 ± 0.78 | 2.63 ± 0.69 | NS | |
| 7 | 3.05 ± 0.78 | 2.71 ± 0.69 | NS | |
| 8 | 3.14 ± 0.78 | 2.82 ± 0.66 | NS | |
| Parameter | Lag m | R | p |
|---|---|---|---|
| Tone | 1 | 0.23 | 0.05 |
| 2 | 0.25 | 0.04 | |
| 3 | 0.25 | 0.04 | |
| 4 | 0.24 | 0.05 | |
| 5 | 0.23 | 0.05 | |
| 6 | 0.21 | NS | |
| 7 | 0.21 | NS | |
| 8 | 0.20 | NS | |
| Entropy | 1 | −0.26 | 0.03 |
| 2 | −0.24 | 0.04 | |
| 3 | −0.24 | 0.05 | |
| 4 | −0.24 | 0.05 | |
| 5 | −0.20 | NS | |
| 6 | −0.20 | NS | |
| 7 | −0.20 | NS | |
| 8 | −0.20 | NS | |
| Parameter | G1 (46) Mean ± SD | G2 (22) Mean ± SD | p |
|---|---|---|---|
| MeanRR (ms) | 416.4 ± 28.0 | 409.3 ± 29.8 | 0.34 |
| SDRR (ms) | 13.0 ± 9.1 | 9.9 ± 5.7 | 0.14 |
| RMSSD (ms) | 6.6 ± 4.1 | 4.7 ± 3.8 | 0.09 |
© 2015 by the authors; licensee MDPI, Basel, Switzerland This article is an open access article distributed under the terms and conditions of the Creative Commons Attribution license (http://creativecommons.org/licenses/by/4.0/).
Share and Cite
Khandoker, A.; Karmakar, C.; Kimura, Y.; Endo, M.; Oshio, S.; Palaniswami, M. Tone Entropy Analysis of Foetal Heart Rate Variability. Entropy 2015, 17, 1042-1053. https://doi.org/10.3390/e17031042
Khandoker A, Karmakar C, Kimura Y, Endo M, Oshio S, Palaniswami M. Tone Entropy Analysis of Foetal Heart Rate Variability. Entropy. 2015; 17(3):1042-1053. https://doi.org/10.3390/e17031042
Chicago/Turabian StyleKhandoker, Ahsan, Chandan Karmakar, Yoshitaka Kimura, Miyuki Endo, Sayaka Oshio, and Marimuthu Palaniswami. 2015. "Tone Entropy Analysis of Foetal Heart Rate Variability" Entropy 17, no. 3: 1042-1053. https://doi.org/10.3390/e17031042
APA StyleKhandoker, A., Karmakar, C., Kimura, Y., Endo, M., Oshio, S., & Palaniswami, M. (2015). Tone Entropy Analysis of Foetal Heart Rate Variability. Entropy, 17(3), 1042-1053. https://doi.org/10.3390/e17031042