Article

Land-Use Planning for Urban Sprawl Based on the CLUE-S Model: A Case Study of Guangzhou, China

1
State Key Joint Laboratory of Environment Simulation and Pollution Control, School of Environment, Beijing Normal University, Beijing 100875, China
2
China Environmental Press Co., Ltd., No. 16, Guangqumennei Street, Dongcheng District, Beijing 100062, China
*
Author to whom correspondence should be addressed.
Entropy 2013, 15(9), 3490-3506; https://doi.org/10.3390/e15093490
Submission received: 9 May 2013 / Revised: 17 August 2013 / Accepted: 28 August 2013 / Published: 2 September 2013
(This article belongs to the Special Issue Entropy and Urban Sprawl)

Abstract

:
In recent years, changes in land use resulting from rapid urbanization or urban sprawl have brought about many negative effects to land ecosystems, and have led to entropy increases. This study introduces the novel ideas of a planning regulation coefficient for sustainable land-use planning in order to decrease entropy, combined with the CLUE-S model to predict land-use change. Three scenarios were designed as the basis for land-use projections for Guangzhou, China, in 2015, and the changes in the land ecological service function for each scenario were predicted. The results show that, although the current land-use plan is quite reasonable, it will be necessary to further strengthen the protection of farmland and important ecological service function areas.

1. Introduction

In urban areas all over the World, the expansion of built environments to accommodate escalating urban populations has resulted in the loss of agricultural land and an increased potential for soil erosion, leading to inefficient use of land resources and consequent entropy increases. The land ecosystem provides many of the basic materials and services for urban development. Ways in which urban development might reasonably be planned to maintain a low level of entropy within the city boundaries, and at the same time guarantee that the land ecological function will be sustained, have become important focal points in land-use planning research. The purpose of a sustainable land-use plan is to ensure that the land ecosystem maintains a healthy, balanced structure and function within certain spatial and temporal ranges, and with sufficient natural resources to support the development of sustainable, complex nature-economy-society systems. In pursuit of this goal, a large number of fundamental and innovative ecological studies of land planning methods in the literature have been based on entropy and relevant aspects of ecological theory—land health, landscape ecological security and land ecological risk [1,2,3]—all founded on land ecological balance.
A review of the literature on land-use planning reveals that the index system (IS) method and Land Use/Cover Change (LUCC) model are widely used. The IS method operates broadly as follows: choose suitable indicators to set up a plan index system, and confirm the target for each indicator; then choose a suitable model to synthesize these indicators and evaluate whether the overall target fulfills the requirement of land ecological balance. Some researchers choose indicators on the basis of the composition of available land resources, such as water, soil and biology [4]; others set up an index system that relies on an assessment of the integrated natural/social/economic complexity of the ecosystem [5]. For example, urban sprawl analysis using the index methods of Shannon entropy (SE) in information theory were carried out in Asmara, Eritrea [6]: variables such as SE, the urban sprawl index (USI), the land consumption rate (LCR), and the land absorption coefficient (LAC) related to urbanization revealed interesting facts about that city [7].
However, subjectivity influences the assessment process to a great extent, so it is important to determine which are suitable indicators and how best to determine the weight of each indicator. Recent studies have generally adopted the pressure-state-response (PSR) model developed by the OECD to establish an index system [8]. Some have set up an index system based on the ecological network [9]. In general, the methods used to establish an index system differed in the various case studies. Methods of determining the weight of indicators developed in recent studies have included entropy, the Delphi technique, principal component analysis (PCA), and analytic hierarchy process (AHP) [10,11,12,13].
The LUCC model, which reflects the ecological balance response to changes in land use, is useful for studying the dynamics of land-use planning [14,15]. Al Bassam investigated LUCC along with remote sensing (RS) interpretation methods to analyze LUCC dynamics in the city of Puding in China from 1995 to 2002 [16]. Most studies have focused on LUCC analysis of environmental response and driving forces, but few have looked at land-use planning. Considering the spatial characteristics of land use, most investigators have used geospatial information system (GIS) RS as a research tool for preparing land-use maps, which is an intuitive approach to displaying planning programs [17]. Some have also set up scenarios and constructed models that integrate socioeconomic and ecological aspects to support land-use planning decisions [18].
Entropy, the concept originally derived from thermodynamics and adapted to information theory, describes the amount of uncertainty and disorder within a system [19]. The concept of entropy is expressed in terms of the probability of various states, which is considered to be relevant to land-use planning [20]. On this basis, in the present study an index system for urban land-use planning from the perspective of the human demand for ecological security was established, using GIS/RS to analyze the land use/cover change that is predicted to result from different scenarios.

2. Methods

2.1. The Model for Land Ecological Service Supply Index

Land ecosystems provide living space and resources for human habitation, but the service function depends on the type of land use; for example, the main function of an agricultural ecosystem is to provide food (the raising function); the main function of land for buildings is to provide space for living and productivity (the bearing function); forest ecosystem in the long run are considered to provide a part of the mineral resources, such as copper, coal, and natural gas etc., which are otherwise mainly obtained from the Earth’s crust (the warehousing function); and the main function of landscape is the comfort and aesthetic values it provides (the landscape function). However, the degree of importance of each eco-function changes when residents’ living conditions themselves change: when their living standard is relatively low, food supply is the most important function, and the degree of importance of an urban greenbelt is seen as relatively low. Thus, in this study a supply distribution index (LESS) was introduced to take the spatial variability of the service supply into account; it is defined in Equation (1):
L E S S = s x = 1 s y δ s x S S s x   s x = 1 ,   2     s y
where SSsx is the element value of sx, the service supplied by the land ecosystem (i.e., bearing service, raising service, warehousing service, landscape service); and δsx is the weighting of each element of sx.
Land-use change leads to a quantitative change in the land ecosystem; technological developments help to improve its quality. For example, crop rotation reduces the pressure on the land ecosystem and improves the way existing resources are used; adding fertilizer increases the soil nutrient and more food is produced; and so on. Therefore a “technology contribution” index Tagri was introduced to allow for the effects of technological development; see Equation (2):
T agri = exp ( G D P a g r i G D P )
where GDPagri is the agricultural output from the introduction of a new technology to the enterprise.
Dividing the land area into a grid comprising a large number of cells using GIS/RS tools allows the spatial heterogeneity of each equal-area land unit to be characterized. The supply index of each unit may then be calculated from:
U L E S S i = k R i T a g r i L E S S
where ULESSi is the land ecological supply index of unit i; LESS is the supply index obtained from Equation (1); k is a constant for numerical standardization; Tagri is the “technology contribution” index from Equation (2); and Ri is the supply distribution coefficient of the ith unit, and is similar in meaning to the output factor in ecological footprint theory [21], and its value depends on the land-use category of unit i. Ecological footprint theory provides an estimate of human impact on natural ecosystems, and considers human demand for ecological services in six land-use categories: farmland, forest, meadow, wetland, building land, garden.

2.2. The CLUE-S Model for Land-Use Transfer Probability

A transfer, or conversion, matrix analysis model of land-use categories simulates land-use change before implementing a land-use plan. This model calculates the conversion relationship between different categories of land use in the same region at different times, thus comprehensively depicting the structure, attributes and direction of the land-use change [22]; however, it only predicts the probability of conversion of land-use categories overall, not in each grid cell. By contrast, the conversion of land use and its effects over small regions (CLUE-S) model quantitatively analyzes the relationship between the effects of land-use change on society, the economy, technology and the natural environment, which coincides with the target of the present study. The CLUE-S model (Figure 1) was derived from the CLUE model [23,24], modified to simulate land-use change based on an empirical analysis of location suitability, combined with the dynamic simulation of competition between, and interaction of, the spatial and temporal dynamics of land-use systems.
Figure 1. Structure of the CLUE-S model framework.
Entropy 15 03490 g001
The CLUE-S model has two parts: analysis of land-use driving forces based on logistic methods, to calculate the relationship between the driving factors and each land-use category, followed by simulation of land-use change by setting rules of land transfer, policy and restrictions, demand and other parameters, using Dyna-CLUE software. The main module of Dyna-CLUE is summarized by:
{ T P R O P i , m = P i , m + E L A S m + I T E R m P i , m = exp ( β 0 + β 1 x i , 1 + β 2 x i , 2 + + β k x i , k ) 1 + exp ( β 0 + β 1 x i , 1 + β 2 x i , 2 + + β k x i , k )
In Equation (4), i = 1, 2, …, 6; m is a land-use category as listed above (i.e., cropland, grazing land, fishing ground, forest, built-up area, or land for carbon absorption) and thus m = 1, 2, …, 6; TPROPi,m is the probability that land-use category m fits the plan target for unit i, and an iterative procedure determines the highest probability that unit i will be converted to land-use category m in the following year (or following time period), then the spatial simulations are completed; Pi,m is the suitability of unit i to be used for land-use category m, obtained from the logistic regression model (β refers to the correlation between the various driving factors and the categories of land use); ELASm is the conversion elasticity for land-use category m (i.e., the ease, or otherwise, of converting land-use category m to another category), and is added only if unit i is already categorized as land-use m during the time period considered; and ITERm is a land-use category-specific iteration variable that indicates the relative competitiveness of land-use category m.

2.3. Dynamic Model of Land-Use Planning

The dynamic change of land ecological service function is closely related to changes in land use. In this study, a planning regulation coefficient was introduced as a measure of changes in land use that are mainly driven by the implementation of land use planning.
Human demands are always infinite and the influence of human activities on the ecosystem is serious and, in many cases, devastating. Because cities are highly intelligent and artificial systems, disturbance to the ecosystem by the urban population in order to satisfy their demands upon it is more evident; natural evolution has significantly less influence on the processes of spatial change than artificial modification by humans. In recognition of this, the present study considered mainly the impact of artificial factors on spatial change in urban land use.
Here it was assumed that the spatial expansion processes in urban areas are the result of demands placed on land ecological services by anthropogenic activity which changes the spatial structure of the land ecosystem, thus influencing both the service supply of urban land and balance or sustainability. Modification of urban space may be done in one of two ways: either by the irrational use of more land for city expansion, leading to uneven land development and a reduction in the ecological supply level of the land ecosystem or, alternatively, by a rational spatial reconfiguration of urban land incorporating reasoned planning and construction that takes into account the stress that development places on ecological services.
Urban space may be relatively stable for a certain period of time but, because the demands on it are limitless, decision-makers need to meet the best interests of society, the economy and the environment; the decision-making process often needs to strike a balance between the positive and negative consequences of the decision. With this in mind, in the present study the positive effects (positive planning drive factors) and the negative effects (negative planning drive factors) of rational planning were both considered.
A planning regulation coefficient was introduced to enable calculation of the environmental impact of implementing land-use plans. This was determined on the hypothesis that urban land-use planning is the driving force behind urban land-use change during a period of urban development. This study seems to indicate that planning does not significantly influence land ecosystem security supply, however, so long as land use is changed as planned, in which case the impact is to some extent determinate. This study explored the interaction between the driving force and land-use change, and calculated the impact of land-use planning on the land ecological supply capacity:
  F ( t 1 ) = α i F ( t 0 )
U L E S S i m T P R O P i , m = α i U L E S S i n
α i = U L E S S i m / U L E S S i n T P R O P i , m
where F(t) is the supply function of land ecosystem; α i is the planning regulation coefficient based on the land ecological supply, and is equal to the ratio of land ecological service supply in different years, such that αi > 1 indicates that the supply ability of the target unit would be strengthened by implementing the land use plan (which means that the land ecosystem is stable and in good condition), αi = 1 indicates that planning implementation would not impact significantly on the ecological sustainability of the target unit, and αi < 1 indicates the opposite effect; ULESSin is the unit supply index of unit i in the current year t0; ULESSim is the unit supply index of unit i in plan year t1; TPROPi,m is the probability of unit i fitting land-use category m. The target unit i = 1, 2, … ; n is the land-use category in the current year; m is the land-use category in the plan year; n, m = 1, …, 6. The six land-use category codes are: farmland = 1, forest = 2, meadow = 3, wetland = 4, building land = 5, garden = 6.

3. A Case Study of Guangzhou, China

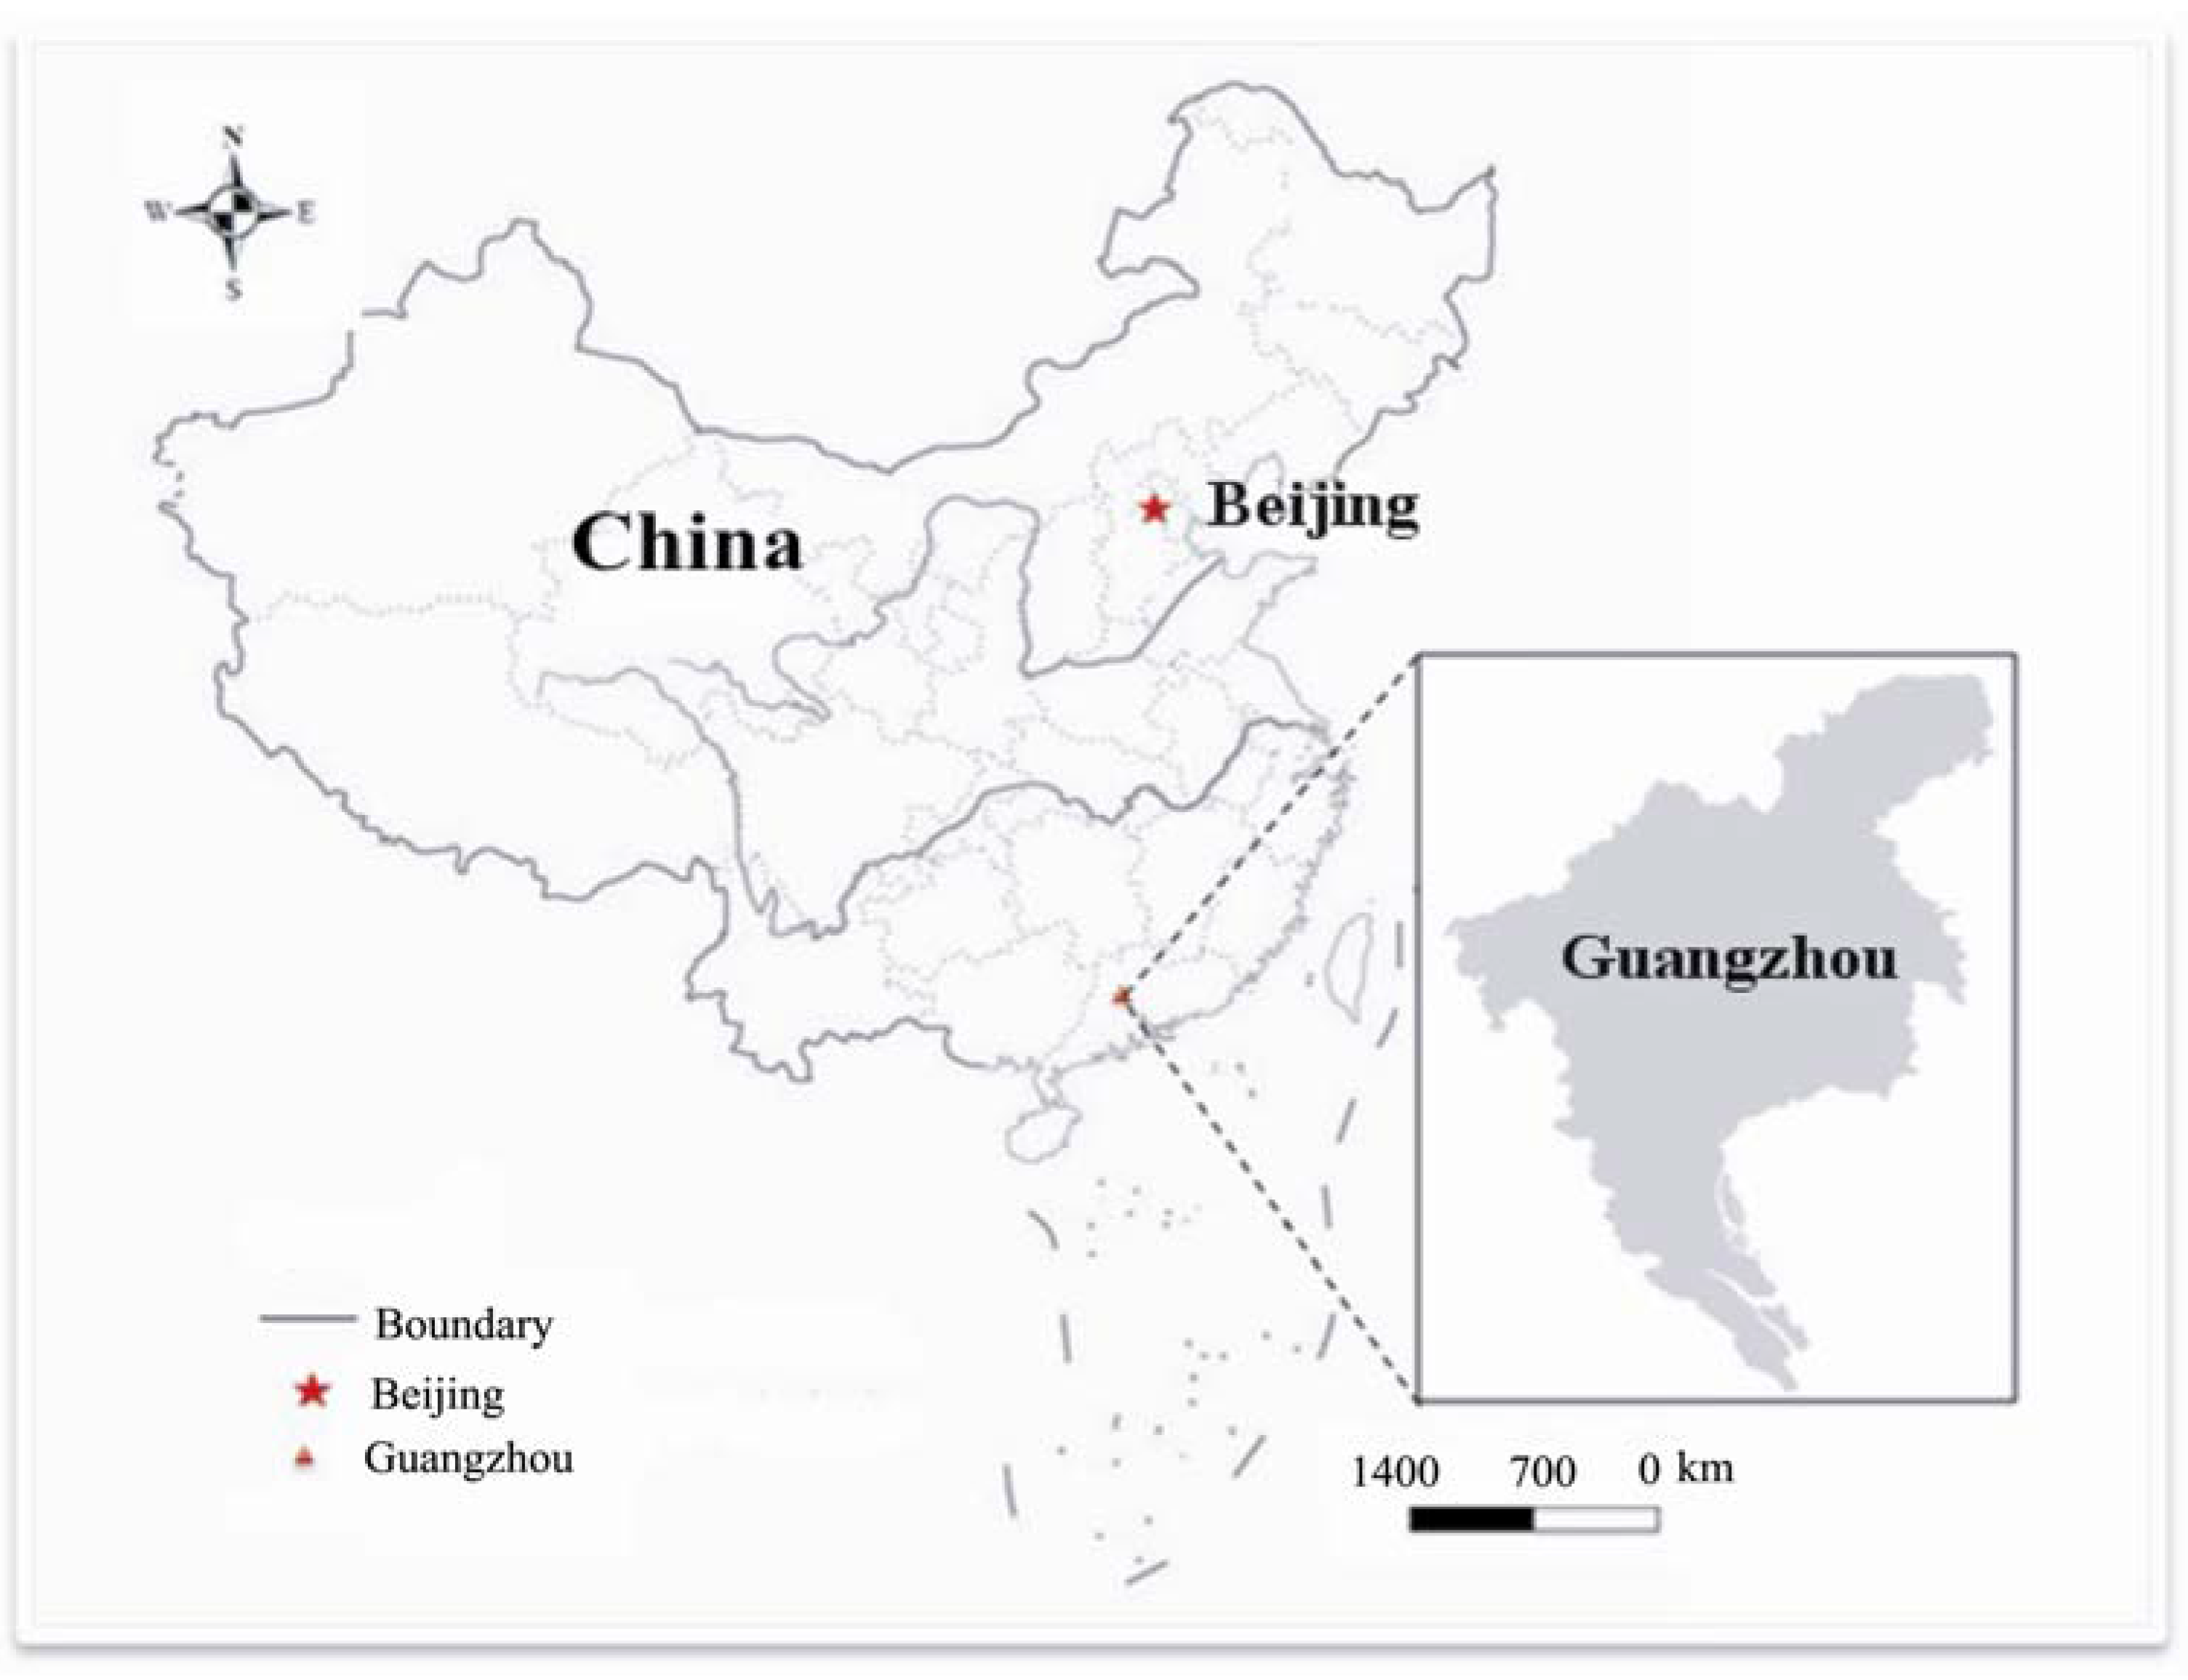
Guangzhou city is the capital of Guangdong Province and is one of the most important industrial centers in China (Figure 2). Guangzhou covers an area of 7434 km2 and has a population of over six million. Guangzhou stands at the confluence of the East River, West River and North River, with the terrain sloping from NE to SW, and includes an alluvial plain in the southern and south-western regions. Guangzhou has a southern subtropical marine climate, with an annual average temperature of 21.8 °C, rainfall 1694 mm, and 345 frost-free days per year.
Figure 2. Map of China showing location of Guangzhou.
Entropy 15 03490 g002

3.1. Land-Use Data Collection, Standardization and Logistic Regression Analysis

3.1.1. Data Collection and Standardization

The data for the land ecological service supply index was standardized using the improved efficacy coefficient method [25] to ensure that comparable requirements are met in different years. This is given by:
a i j = 0.5 ( X i j X j m i n ) / ( X j m a x X j m i n ) + 0.5
where aij is the score for unit i and element j (the efficacy coefficient); Xij is the actual value for unit i and element j; Xjmax, Xjmin are the upper and lower limits of element j; i = 1, 2 ...; j = 1, 2 ...
The CLUE-S computation process is in two parts: first, the logistic method of land-use change-driven analysis is used to gauge the selected driving factors and calculate their relationship with each land-use category; second, the land transition rules to be used by the Dyna-CLUE program are defined; the program calculates the probability of each grid unit, i, being assigned a particular land-use category m, as described above. After comparing a number of units, the land category most likely to be converted to the target category is selected for the planning year, and the spatial simulation process is then completed using a standard iteration routine.
Land ecological supply is closely related to the service functions that the land provides. The main functions of land ecosystems were described above as the raising, bearing, warehousing and landscape functions [22]. When the land ecosystem is capable of providing acceptable service functions, the entropy and the disorder of the ecosystem decreases. The land-use plan indicators defined for Guangzhou are listed in Table 1.

3.1.2. Analysis of Land-Use Change Drivers Based on Logistic Methods

The spatial land-use data for Guangzhou in 2000, 2006 and 2009 was taken from land-use maps, electronic maps of rivers and lakes, traffic routes, settlements and other information in 2000. The source of the digital elevation model (DEM) data was from World Geodetic System (WGS) with 3 arc-second (approximately 90 m) resolution.
For the present study it was necessary to consider whether the data could be obtained, whether the factors could be quantified, and whether the data would correlate reasonably well with land-use change in the case study district, when equal attention was given to both natural and socioeconomic factors. On this basis, seven factors driving land-use change were selected: see Table 2.
The data was extracted from remote-sensing images based on the six land-use categories shown on land-use maps of Guangzhou, then analyzed by the logistic method.
The relative operating characteristics (ROC) validation method [26] was used to test the logistic regression results from the CLUE-S model. ROC values lie between 0 and 1: a ROC of 0.5 indicates that the predictions are completely random; values > 0.5 indicate that a prediction by the model is relatively good.
Table 1. Land-use plan indicator set for Guangzhou, based on land ecological services supply index.
Land ecological services supply indexElementOriginal data (year)Standardized data (year)
200020062009200020062009
BearingRoad area per capita (m2/person)5.6713.4910.630.561.000.84
Residential area per capita (m2/person)13.1318.8721.010.610.891.00
RaisingGrain (kg/year/person)106.7177.9864.610.740.950.64
Vegetables and their products (kg/year/person)112.92104.5656.490.911.000.93
Oil and fat (kg/year/person)6.876.74.590.680.840.82
Meat (kg/year/person)47.4146.3720.300.770.900.88
Eggs (kg/year/person)8.626.244.310.861.000.72
WarehousingCoal (tonnes/year/10,000 yuan GDP)0.780.650.351.000.970.83
LandscapeRate of urban green coverage (%)31.636.3838.210.720.860.91
Green space area in parks (m2/person)7.8711.3213.760.500.780.97
Proportion of woodland area (%)0.390.370.341.000.940.84
Proportion of wetland area (%)0.120.140.180.630.751.00
Data source: Guangzhou Statistic Yearbook 2000, 2006 and 2009; The elements were chosen based on the questionnaire survey in Guangzhou.
Table 2. Factors driving land-use change in Guangzhou.
Factor classificationDriving factorFactor descriptionCode
DistanceDistance to rivers, lakes and seasThe distance of each evaluation unit center to the nearest rivers, lakes and seasX0
Distance to national highway or urban roadThe distance of each evaluation unit center to the nearest national highway or urban roadX1
Distance to urban settlementsThe distance of each evaluation unit center to the distance to the nearest town settlementsX2
DEMSlope X3
Elevation X4
Population densityPopulation X5
Per-capita GDP X6
A logistic regression was run for each current land-use category (Table 3). Appropriate driving factors selected from those listed in Table 2 were used to evaluate the suitability of a given unit to be developed into a particular land-use category. The spatial distribution of all categories of land use was explained well by the selected driving factors, as indicated by the ROC value ≥ 0.7 in all cases.
Table 3. Values of β from logistic regression of spatial distribution of land use in Guangzhou.
Land use categoryPopulation densityPer capita GDPSlopeElevationDistance to waterDistance to roadDistance to rural settlementConstantROC
Farmland–0.860.66–1.10.3980.873
Garden0.550.51–0.89–0.770.8200.680
Woodland–0.651.08–0.731.291.7680.850
Grassland–0.96–0.600.87–0.92–1.084.5380.665
Build-up0.51–0.96–0.521.67–1.33–1.213.7720.984
Wetland0.52–1.26–1.681.511.246.4860.993
As discussed in the notes to Equation (4), the β values for the regression analysis results of the spatial distribution of land are the correlations between the various driving factors and the land-use categories. These are substituted into Equation (9), which is Equation (4) rearranged; see Equation (4) for definitions of terms and variables:
p i 1 p i =  exp ( β 0 + β 1 X 1 , j + β 2 X 2 , j + + β n X n , j )
Note that exp (β) indicates the change in the probability of one unit change in the independent variable x. When exp (β) > 0, the probability increases as the value of x increases; when exp (β) < 0, the probability decreases. An increase in the value of exp (β) in any individual unit produces a change of land-use category in that unit. The results are finally filtered to exclude the least significant factors.

3.2. Calculation of Planning Regulation Coefficient

For the present study, the area covered by Guangzhou was divided into 28,523 units, each with an area of 500 m × 500 m. Land use in the area was then grouped into six categories, based on available information.
The supply distribution coefficient of each land use category (Ri in Equation (3); Table 4) was calculated on the basis of the main biological production potential and the output factor in the ecological footprint model [27].
Table 4. Supply distribution coefficient (Ri) for the different land uses.
YearFarmlandGardenWoodlandGrasslandBuilt-upWetland
20002.241.201.203.292.241.00
20061.481.691.121.622.691.12
20091.221.861.111.632.941.53
A technology contribution coefficient, T (Table 5) is proposed mainly as a measure of the effect of utilizing scientific and technological developments to improve land productivity and ecosystem services.
Table 5. Technology contribution coefficient (T) in Guangzhou.
Year200020062009
T1.00371.00471.0049
The unit supply indices [ULESS, Equation (3)] are summarized for Guangzhou in Table 6, which shows the number of units affected in the years 2000, 2006 and 2009. The index of all units lay in the range 0.6–0.9. For any of the three years, the supply index of most units was 0.6–0.7. The number of units within a given range fell as its supply index rose. The number of units in the range 0.6–0.7 gradually declined from 2000 to 2009. The number of units in the range 0.7–0.8 firstly decreased, and then increased. The number of units in the range 0.8–0.9 rose year by year. High unit scores indicate that the entropy of the land ecosystem is predicted to be low in those particular units.
Table 6. ULESS values for 2000, 2006 and 2009.
Year0–0.60.6–0.70.7–0.80.8–0.90.9–1.0
200016,92810,759808
200616,07174415018
200910,66388419019
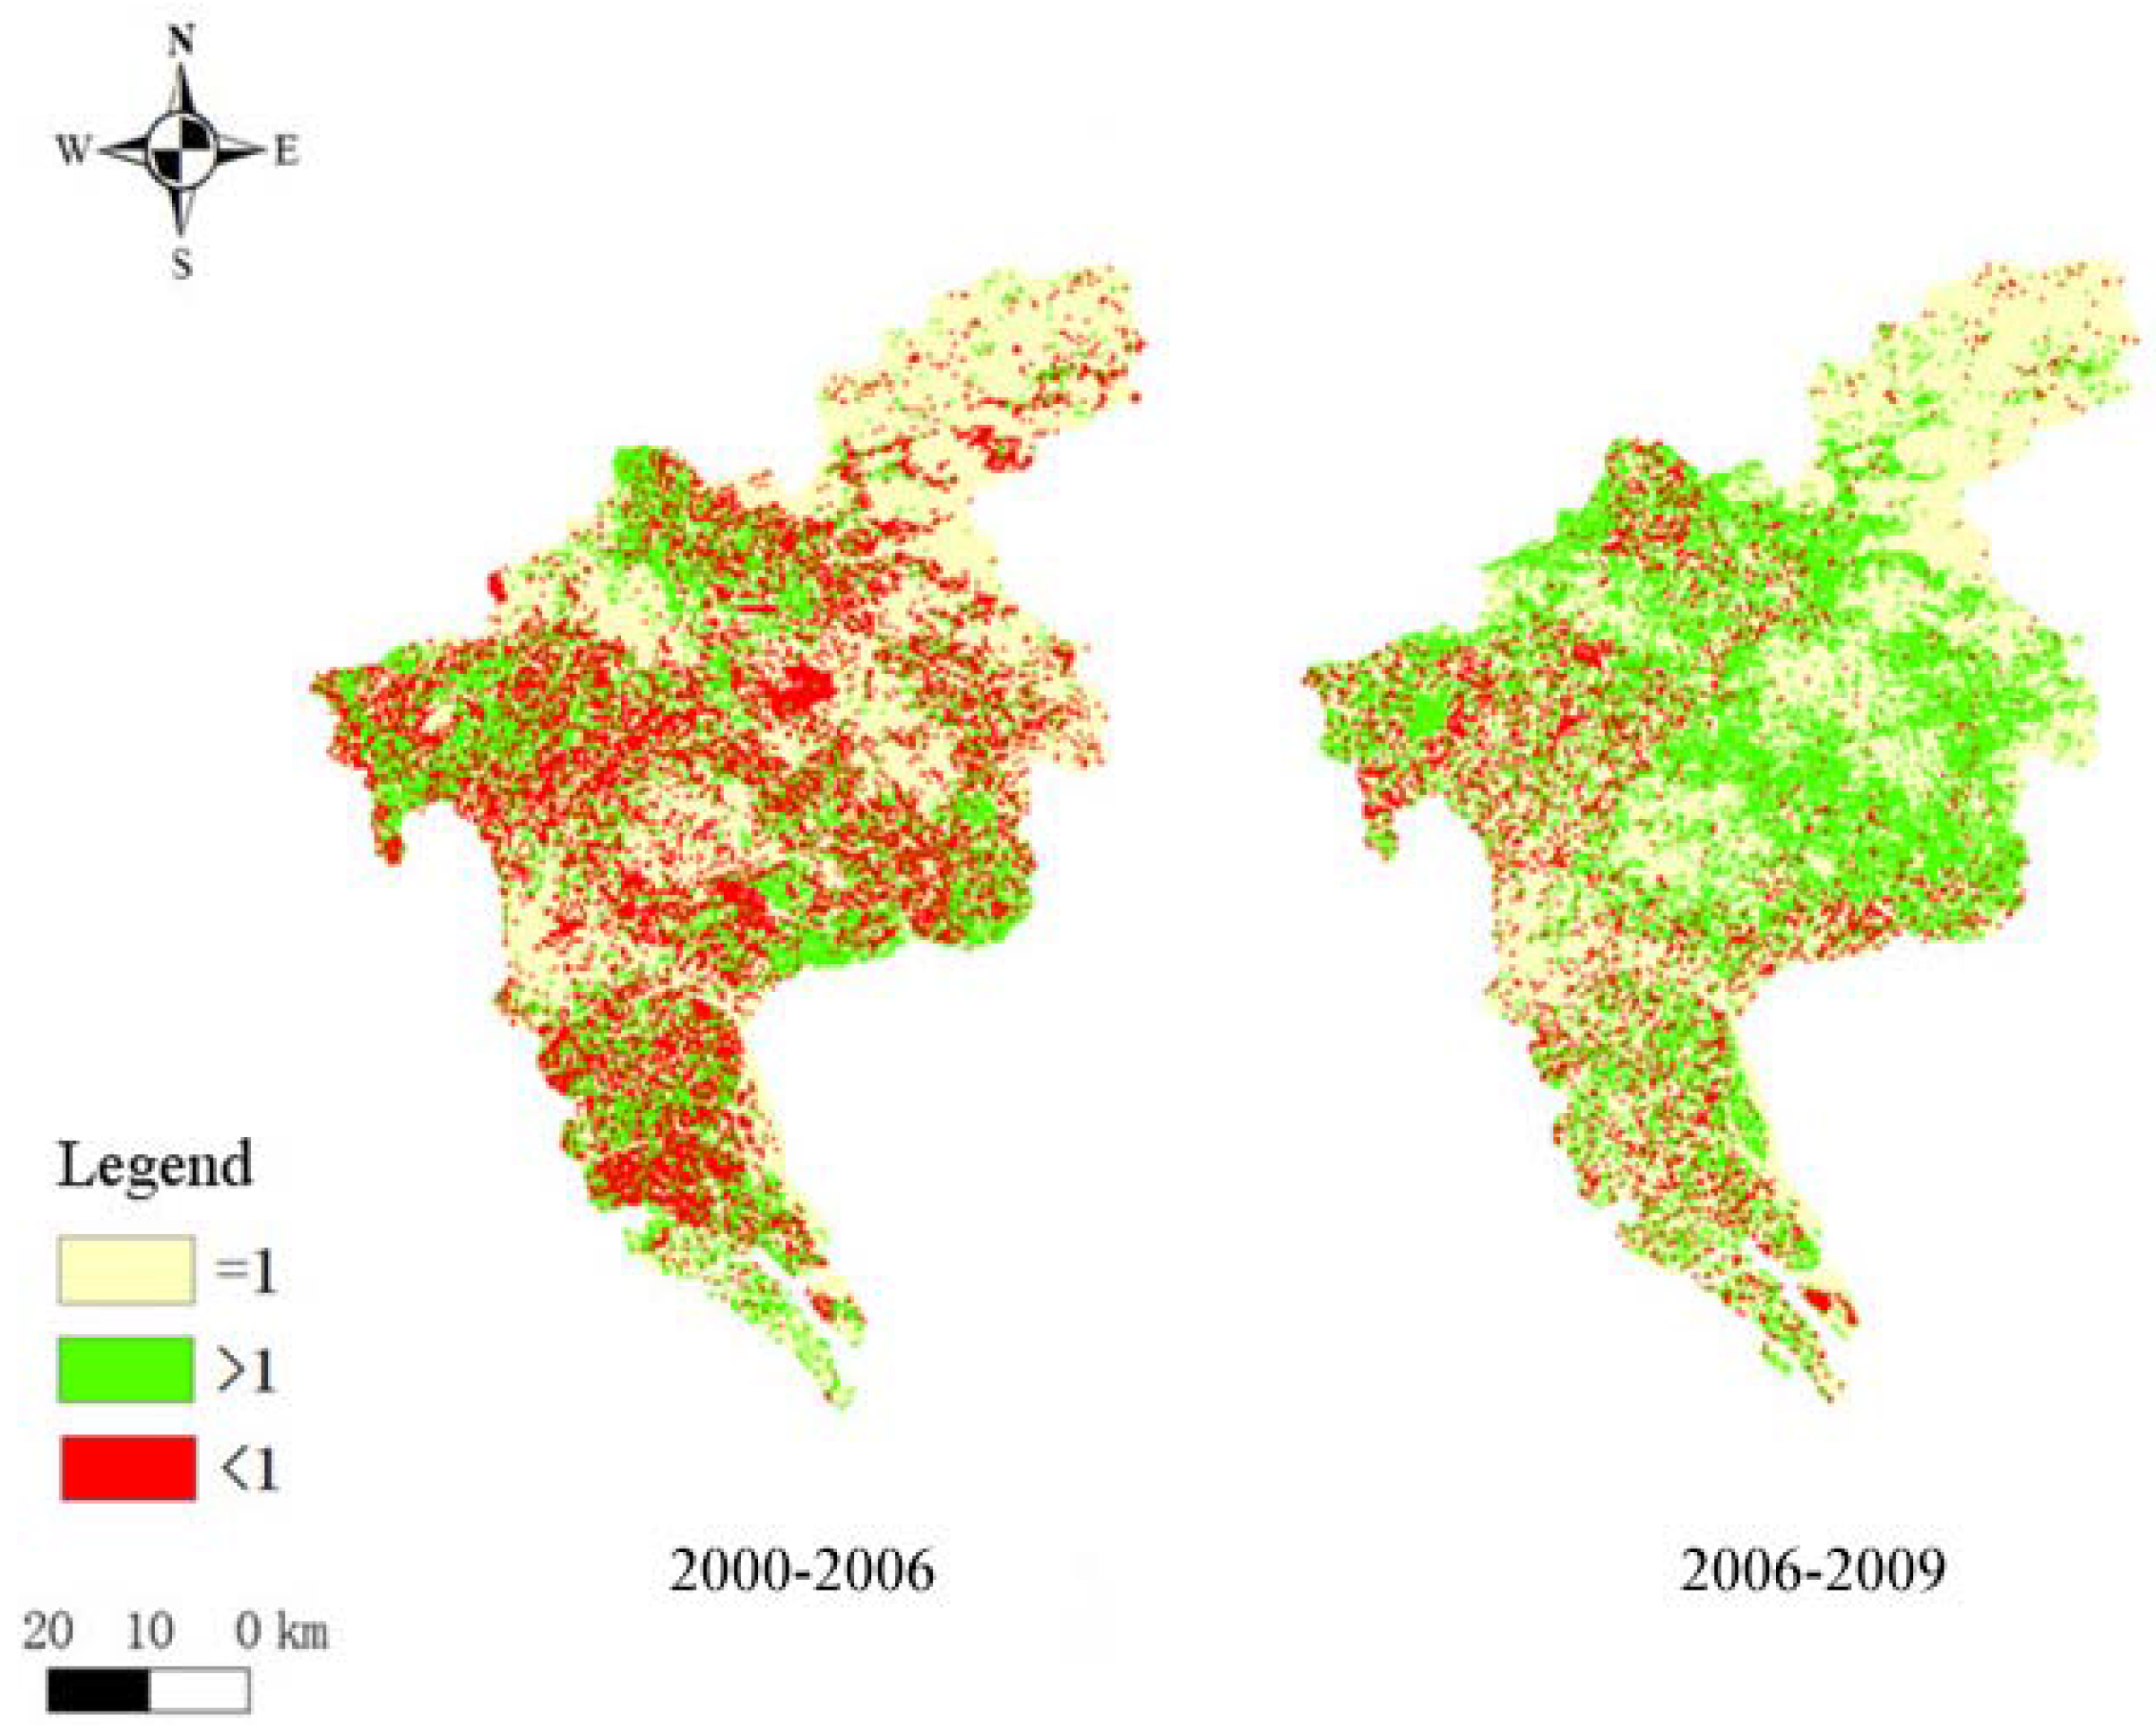
The purpose of land-use planning regulation coefficients was to measure the effectiveness of the ecological service supply generated by land-use planning and implementation in Guangzhou between 2000 and 2009. These indicate that land-use planning in Guangzhou increased the ecological service supply ability; the impact of regulation was higher in 2006–2009 than in 2000–2006, and the implementation of the 2006–2009 planning played a more active role (Table 7). Urban land-use planning is thus seen to be increasingly important in maintaining the entropy of the city at a low level.
Table 7. Land-use planning regulation coefficient in Guangzhou.
Year2000–20062006–2009
Coefficient1.0341.067
Figure 3 shows the spatial variation of the planning regulation coefficient. In 2000 and 2006, the implementation of the land-use planning reinforced the ecosystem supply capacity in the central, southern and western parts of Guangzhou. Between 2006 and 2009, most of the supply capacity for central and southern Guangzhou continued to improve despite increasing land-use changes.

3.3. Land-Use Plan Prediction Scenarios in Guangzhou for 2015

This study adopted the CLUE-S model to test three scenarios of land-use planning (Plans 1, 2 and 3) to provide decision-makers in Guangzhou with appropriate plan predictions for 2015.
  • Plan 1: Total amount control target (2009–2015): Mainly refers to extrapolation of current trends.
  • Plan 2: Total amount control target (2009–2015): Mainly refers to targets in the Guangzhou Land-use Planning Standard (2006–2020).
  • Plan 3: Total amount control target (2009–2015): Plan 2 plus: (1) Area restriction 1: Conversion to other land-use categories restricted to farmland; (2) Area restriction 2: Protect ecological security zone in northern area of Guangzhou.
Figure 3. Spatial variation of the coefficient of regulation of land-use planning in Guangzhou.
Entropy 15 03490 g003
The input parameters for the CLUE-S model were determined by the constraint conditions of the three plans in order to predict land-use change in Guangzhou in 2015. The land-use planning index ULESS for the current year and the plan year was also calculated to obtain the planning regulation coefficient αi for the CLUE-S model. In order to check the accuracy of each index, data from 2000, 2006 and 2009 were used to simulate the driving factors of land-use change with the logistic model.

3.4. Simulated Land-Use Changes for 2015
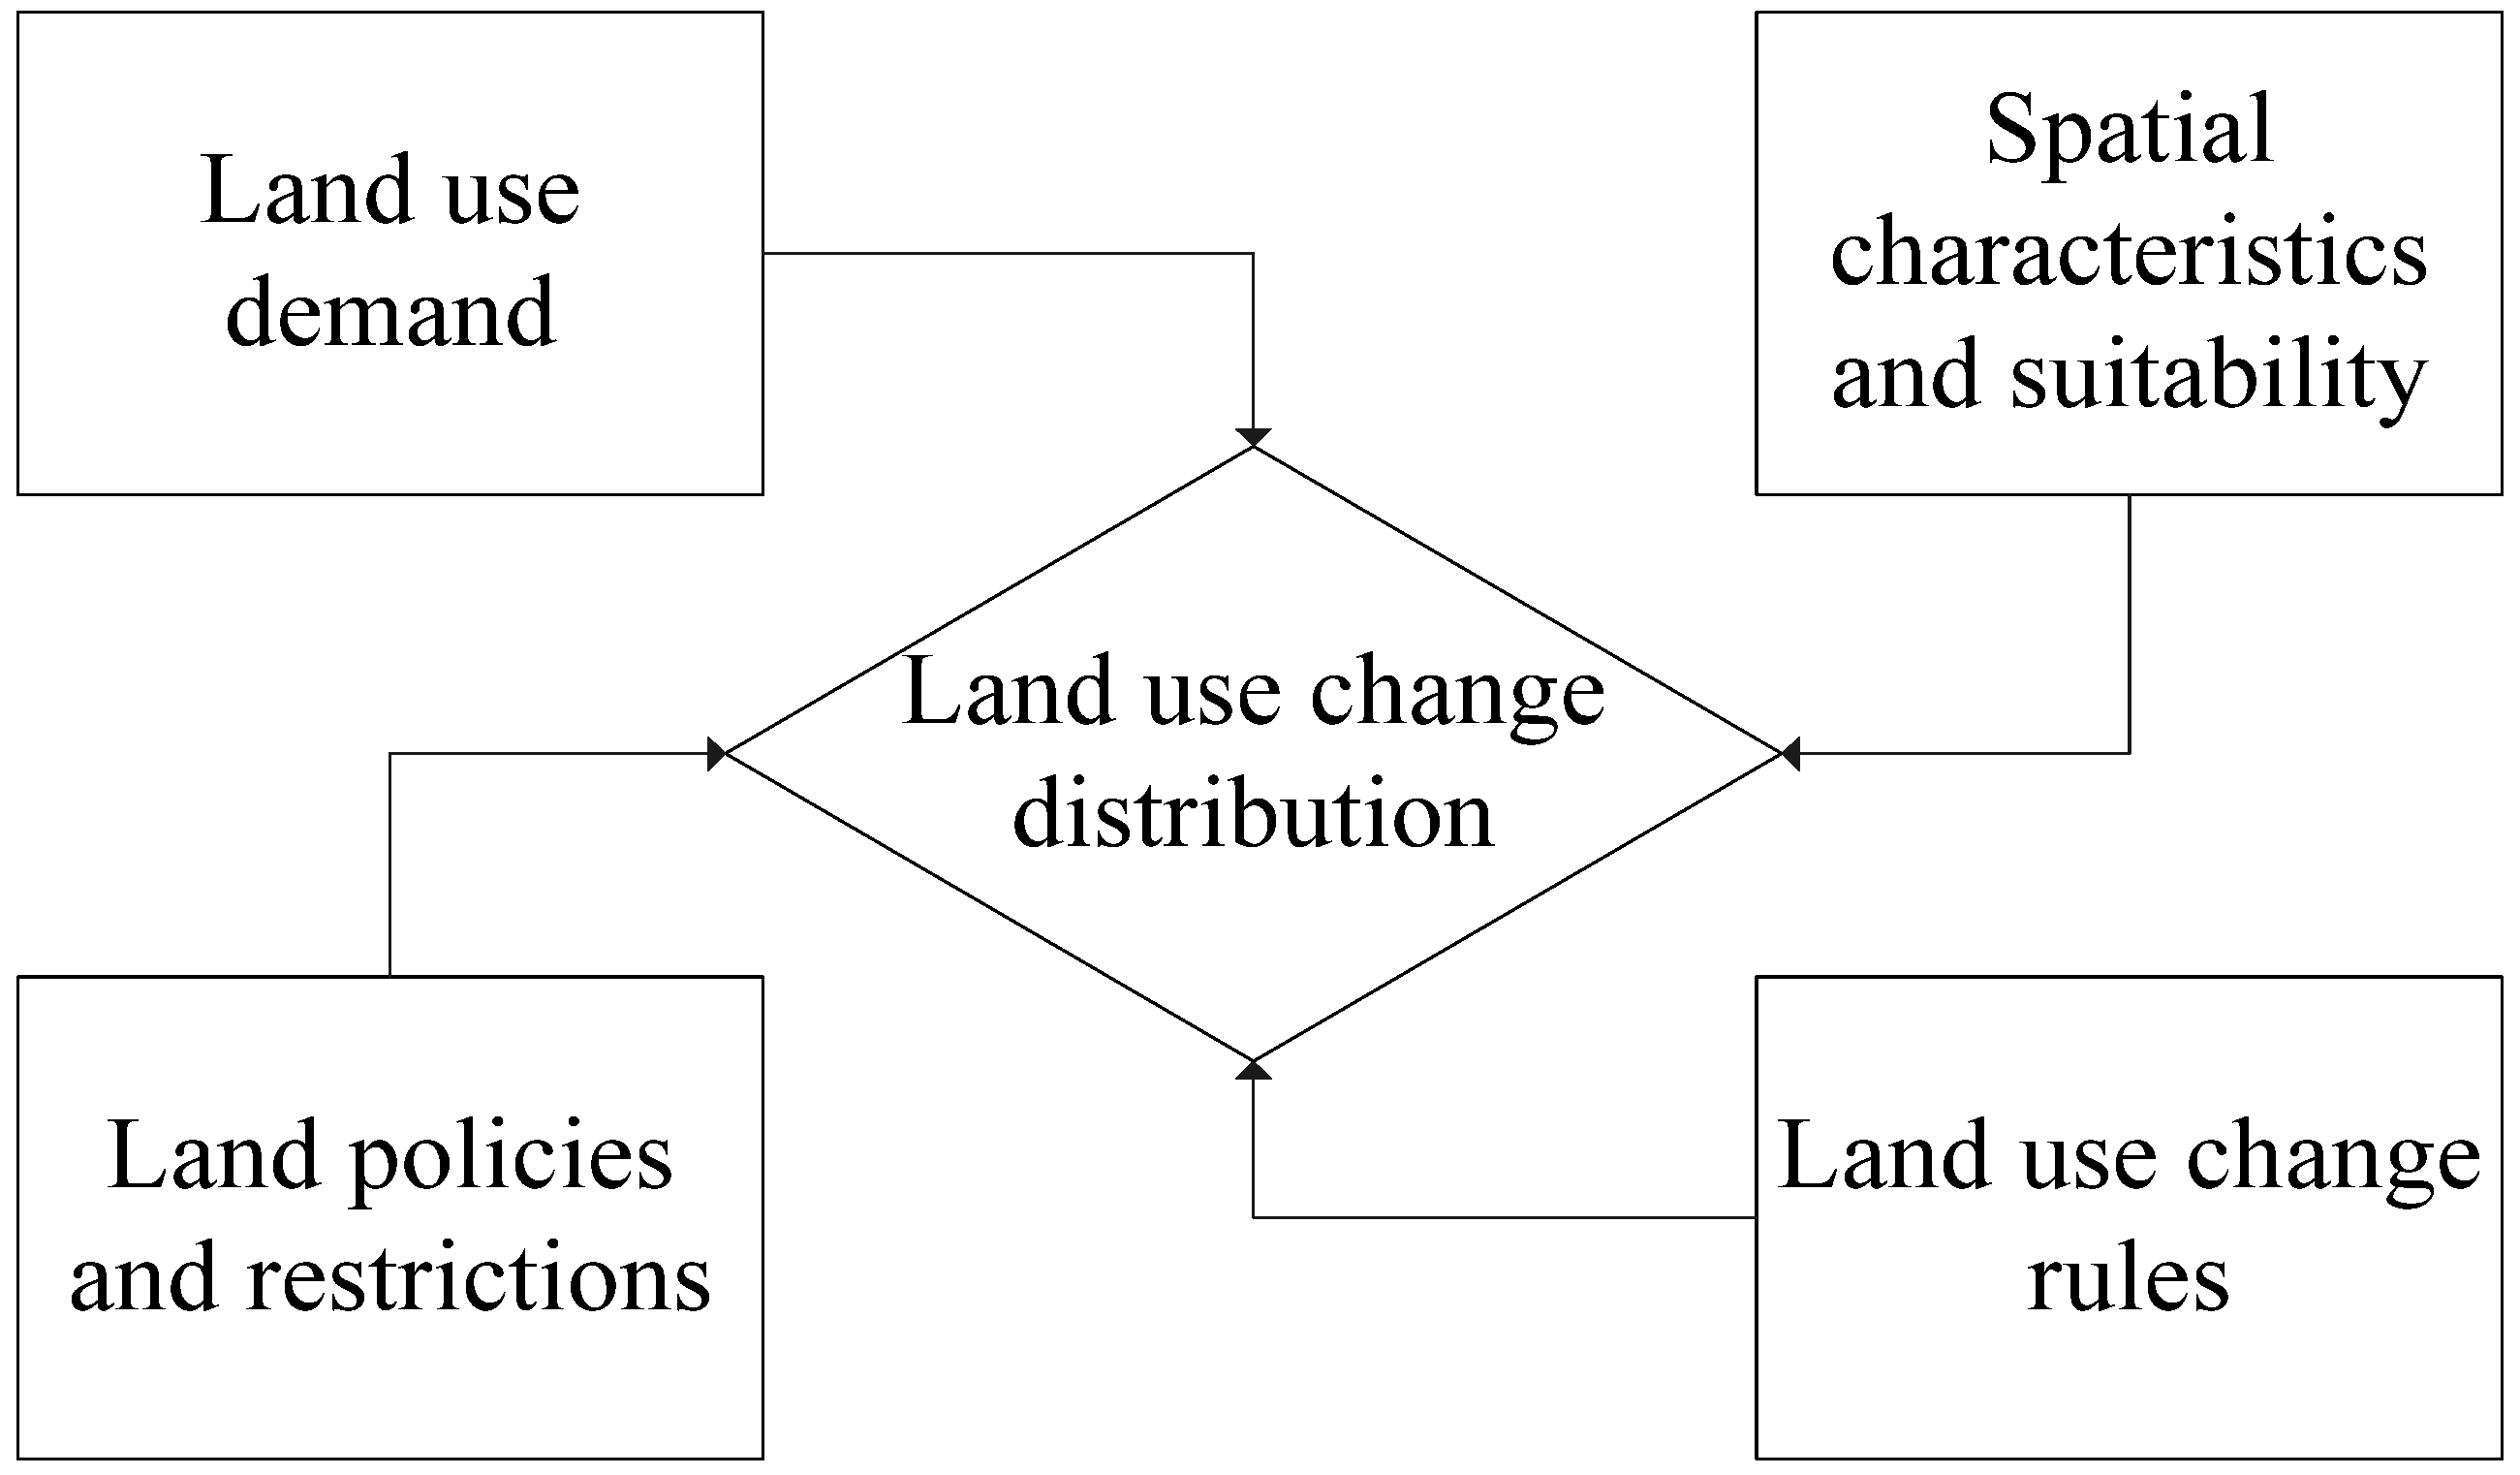
As shown in Figure 1, input for the CLUE-S model includes land-use requirements, location characteristics and suitability, spatial policies and restrictions, and specific conversion settings of land-use category.
Land-use distribution: The six categories of land-use distribution for the three plans are given in Table 8, Table 9 and Table 10.
Table 8. Plan 1 land-use changes in Guangzhou, 2009–2015 (areas in hectares).
YearFarmlandGardenWoodlandGrasslandBuilt-upWetland
2009100,784129,915253,426104148,60252,550
2010102,810129,213253,958104150,07352,487
2011104,876128,516254,491104151,55852,424
2012106,984127,822255,026104153,05952,361
2013109,135127,131255,561104154,57452,298
2014111,328126,445256,098104156,10452,236
2015113,566125,762256,636104157,65052,173
Table 9. Plan 2 land-use changes in Guangzhou, 2009–2015 (areas in hectares).
YearFarmlandGardenWoodlandGrasslandBuilt-upWetland
2009100,784129,915253,426104148,60252,550
2010102,810129,213253,958104150,07352,487
2011104,876128,516254,491104151,55852,424
2012106,984127,822255,026104153,05952,361
2013109,135127,131255,561104154,57452,298
2014111,328126,445256,098104156,10452,236
2015113,566125,762256,636104157,65052,173
Table 10. Plan 3 land-use changes in Guangzhou, 2009–2015 (areas in hectares).
YearFarmlandGardenWoodlandGrasslandBuilt-upWetland
2009100,784129,915253,426104148,60252,550
2010102,810129,213253,958104150,07352,487
2011104,876128,516254,491104151,55852,424
2012106,984127,822255,026104153,05952,361
2013109,135127,131255561104154,57452,298
2014111,328126,445256,098104156,10452,236
2015113,566125,762256,636104157,65052,173
Location characteristics and suitability: The location suitability is a major determinant of the competitive capacity of the different land-use categories at specific locations. Logistic regression models using input from a GIS dataset were constructed to determine the relationships between land-use change and a set of potential driving factors.
Spatial policies and restrictions: For each land-use category, the model took into account the spatial policies and restrictions that influenced land-use category conversion and caused differences in spatiotemporal behavior. In this study, Plan 3 restricted changes to other land-use categories in northern Guangzhou.
Land-use category-specific conversion setting: For each plan, land-use category-specific conversion settings were defined and implemented by adopting the relative elasticity to change approach [ELAS value from the Dyna-CLUE module; see Equation (4)], which takes a value between 0 (easy change) to 1 (irreversible change), and transition rules (1 = transition, 0 = no transition): that is, the higher the defined elasticity, the more difficult it is to convert the land-use category. The transfer matrix of land use in the study area was calculated to ensure that the relative elasticity—and especially the relative elasticity of different land-use categories from 2009 to 2015—was extrapolated from current data (Table 11). By judging whether or not a specific category could be converted to another category, the transition rule was determined, the 2009 transition rules were extrapolated to 2015 for all three plans (Table 12, Table 13 and Table 14) in accordance with the land use transfer matrix.
Table 11. Land-use relative elasticity, Guangzhou, 2009–2015.
Relative elasticityFarmlandWoodlandGrasslandWetlandBuilt-upGarden
Plan 110.90.60.900.950.88
Plans 2 and 30.920.90.60.900.950.88
Table 12. Land-use transition rule for Guangzhou, 2009–2015 (Plan 1).
FarmlandWoodlandGrasslandWetlandBuilt-upGarden
Farmland100000
Woodland111111
Grassland111111
Wetland111111
Built-up111111
Garden111111
Table 13. Land-use transition rule, Guangzhou, 2009–2015 (Plan 2).
FarmlandWoodlandGrasslandWetlandBuilt-upGarden
Farmland111111
Woodland111111
Grassland111111
Wetland111111
Built-up111111
Garden111111
Table 14. Land-use transition rule, Guangzhou, 2009–2015 (Plan 3).
FarmlandWoodlandGrasslandWetlandBuilt-upGarden
Farmland111111
Woodland111111
Grassland111111
Wetland111111
Built-up111111
Garden111111
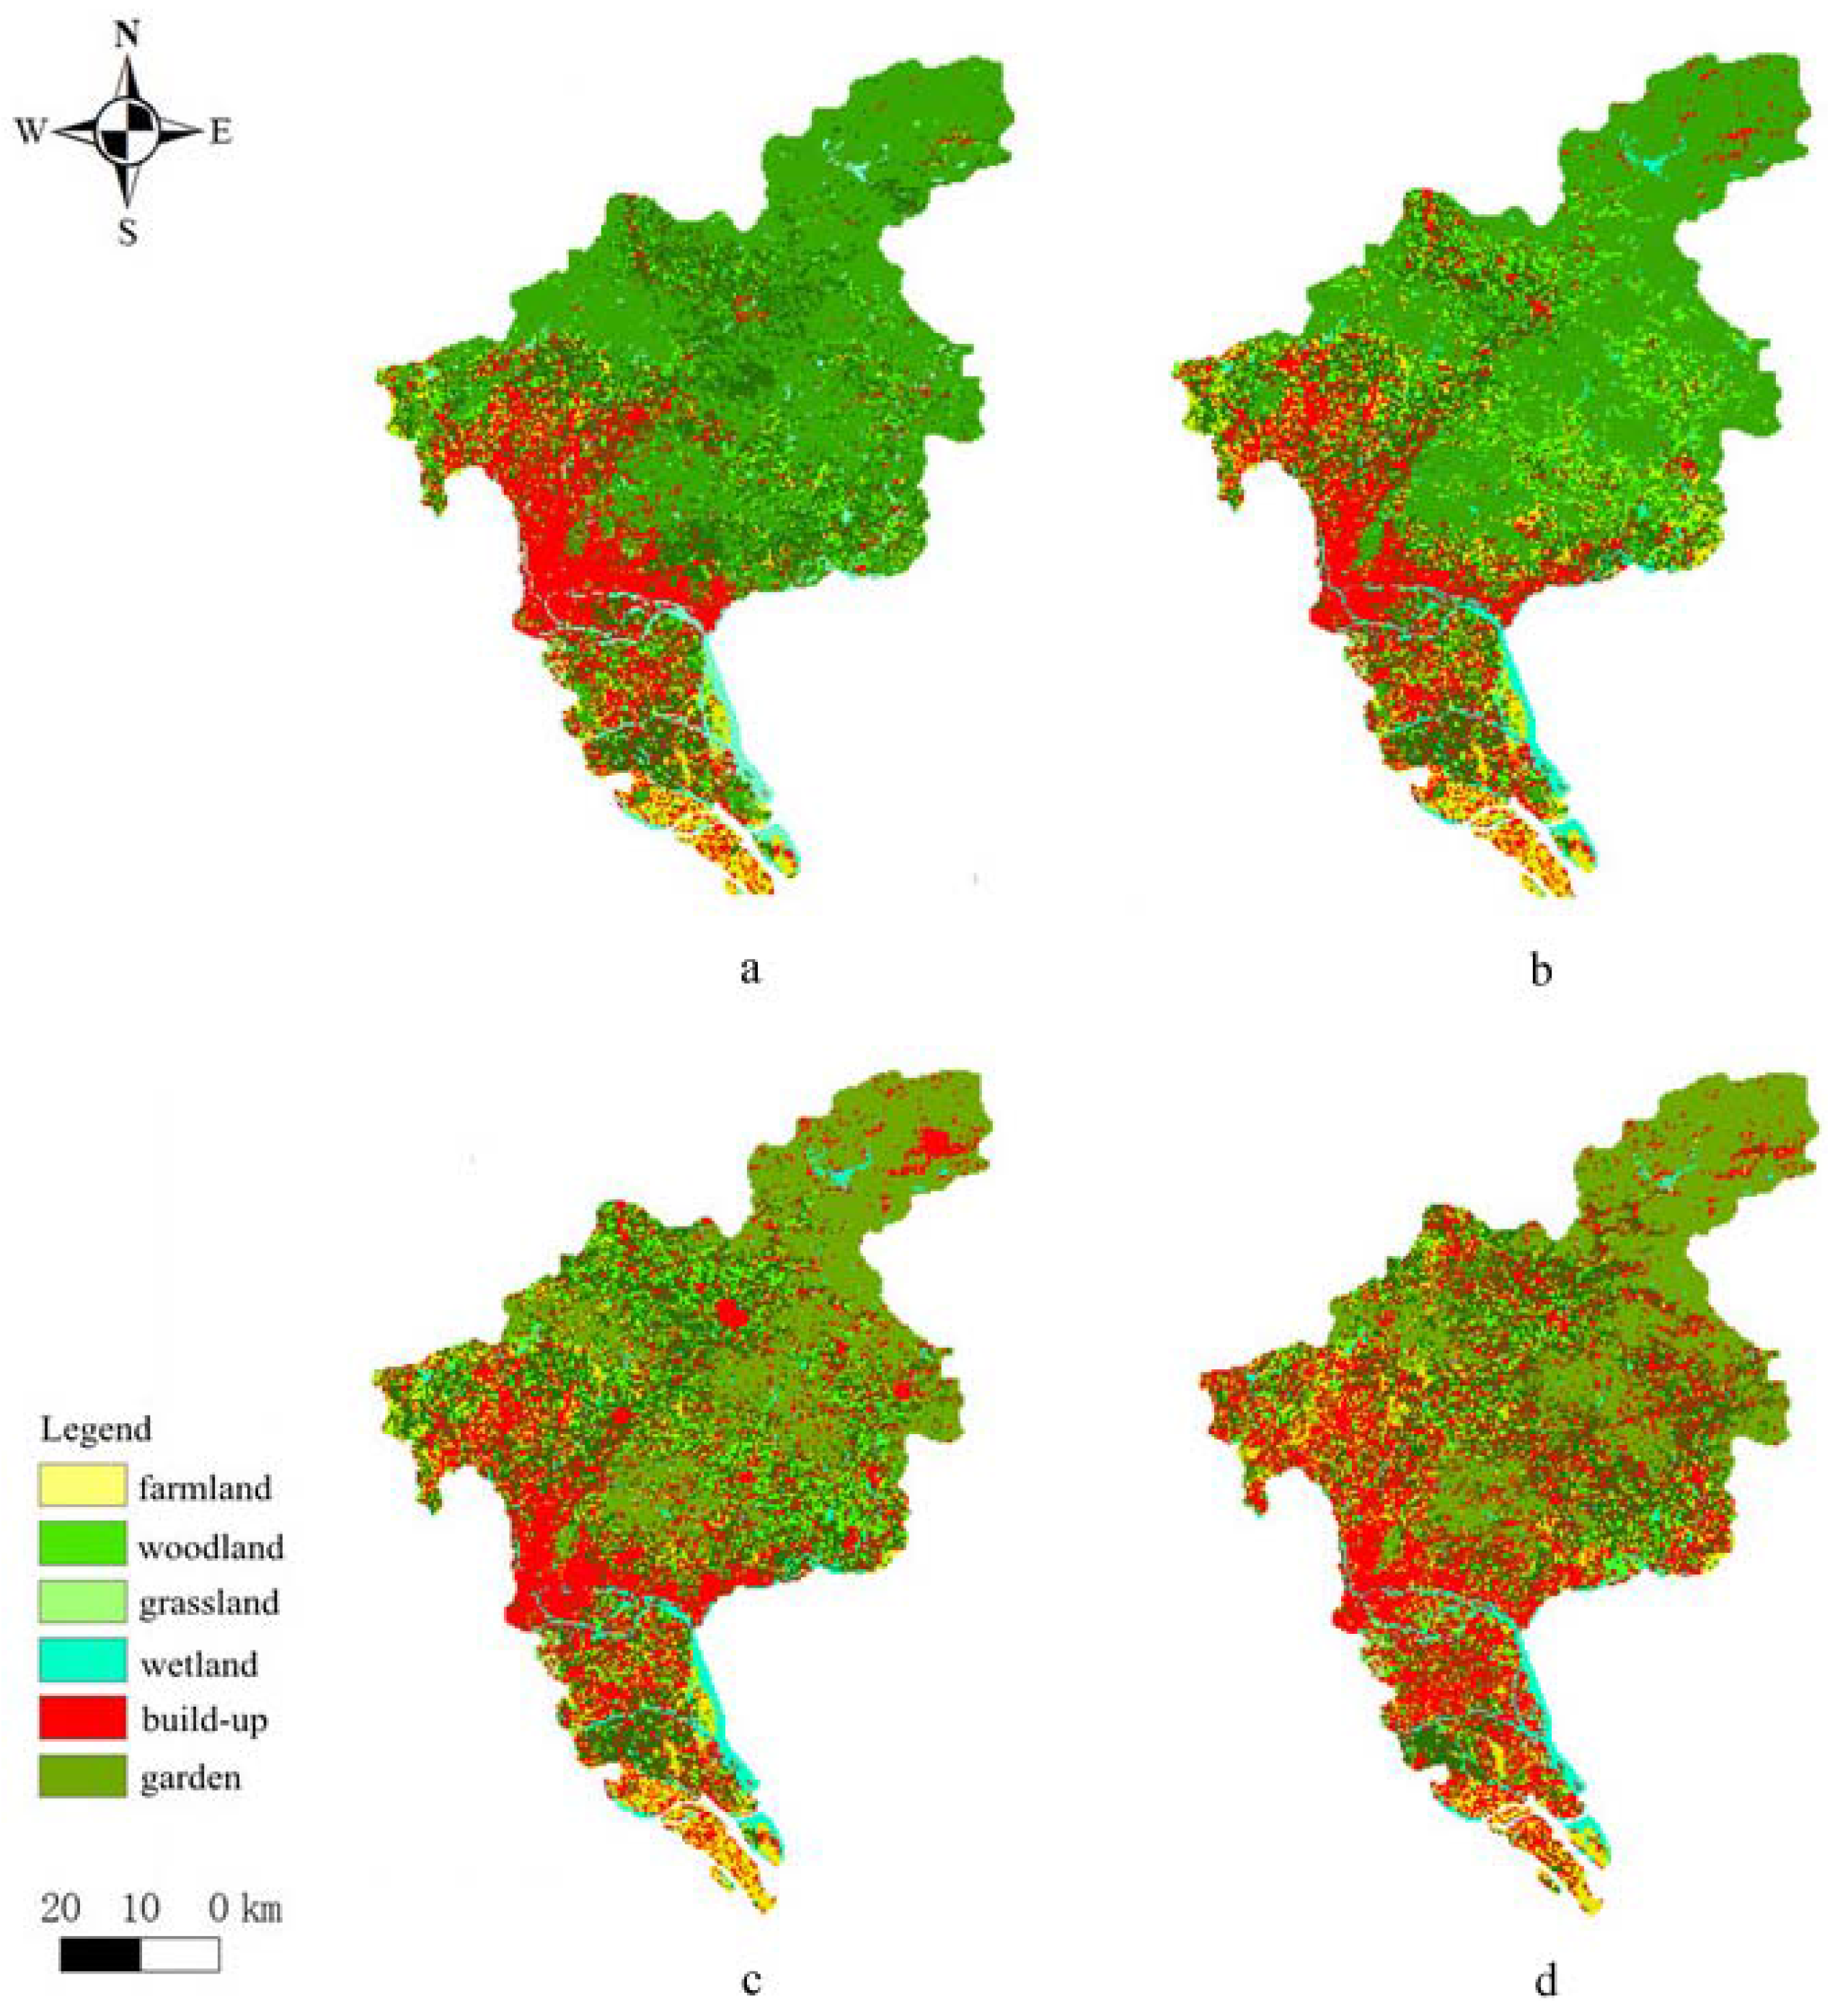
CLUE-S software calculated the distribution probability of a particular land-use type occurring in each cell in the grid. All the resulting land-use categories were then compared for individual cells; the category with the highest value was then assigned to that cell, and the total areas for each land-use category were calculated. The 2006 and 2009 results were used to calibrate the model, specifying the model parameters and variables. Figure 4 shows the actual and simulated land use in 2006 and 2009. 
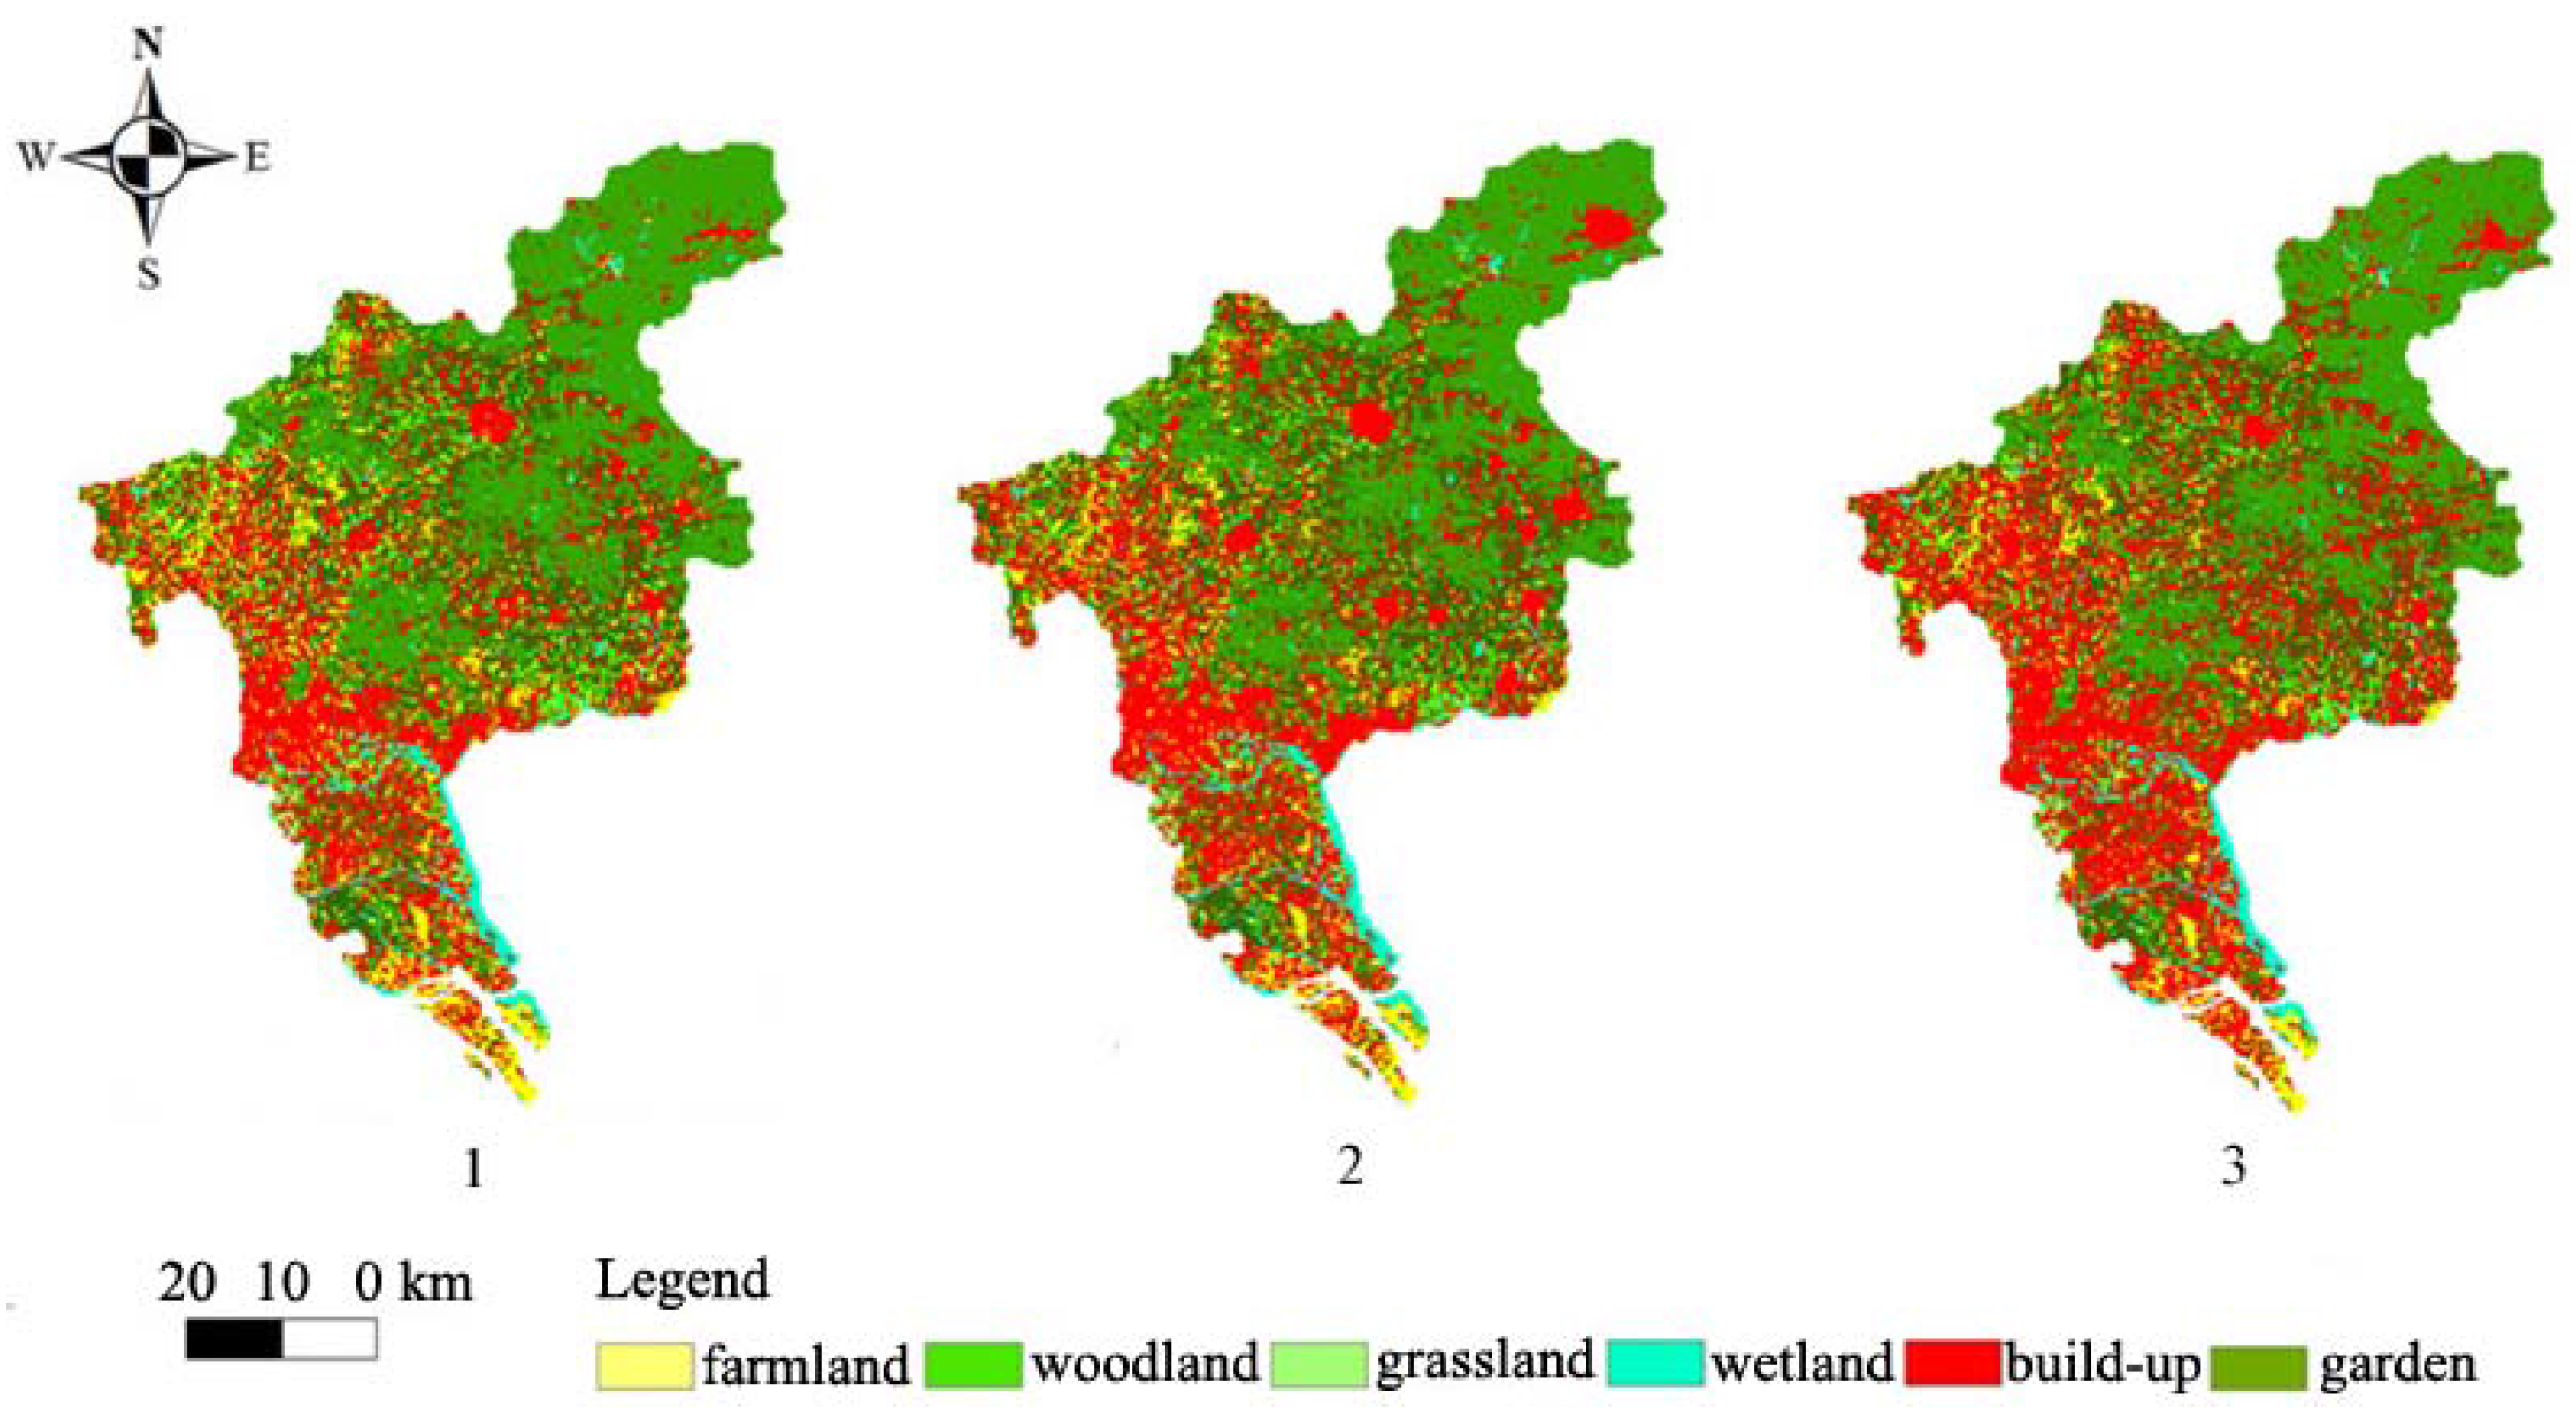
Figure 5 shows the predicted land-use pattern for each plan in 2015. Greater than 80% agreement was attained between the simulated and observed values for 2006 and 2009.
Table 15 shows that the values of the planning regulation coefficients for land ecological service supply exceeded 1 in both Plans 2 and 3, indicating that both plans guaranteed the safety of the land ecosystem. Plan 3, with stricter constraints imposed, might produce a stable ecosystem structure and function in its own right, although it would provide a slightly lowered service supply capability for the human population than Plan 2; we cannot exploit natural resources and change land-use categories based solely on our demands. In summary, the planning regulation coefficient both in Plans 2 and 3 was relatively effective in sustaining the entropy of land ecosystem at a low level.
Generally speaking, Plan 3 had a set overall controlled target based on The General Plans for Land Use of Guangzhou (2009–2015), with the addition of the area restrictions factors—that is, the protection of the land ecological security zone and farmland. The simulation results showed that the unit land ecological service index and the planning regulation coefficient for Plan 3 were superior to those for Plans 1 and 2, but there was no clear difference between Plans 3 and 2. This indicated that the total degree of control and regulation under Plan 2 was adequate, but farmland protection and vital ecological service protection would need to be strengthened.
Figure 4. Diagram of comparative land usage in 2006 and 2009. (a) Simulated land-use diagram for 2006; (b) Actual land-use diagram for 2006; (c) Simulated land-use diagram for 2009; (d) Actual land-use diagram for 2009.
Entropy 15 03490 g004
Figure 5. Predicted land use in Guangzhou in 2015 for the three plans.
Entropy 15 03490 g005
Table 15. Planning regulation coefficient for the three plans.
ScenariosPlan 1Plan 2Plan 3
αi0.9901.0441.011

4. Conclusions

In the present study a dynamic model of urban land ecological planning was established by applying the CLUE-S model to predict land-use change in Guangzhou in 2015. Some suggestions are put forward here in light of the results:
(1)
A technology contribution coefficient and supply distribution coefficient were added to evaluate the land ecological service supply of each land unit. The planning regulation coefficient dynamically analyzed how the implementation of land-use planning affects the land ecosystem. Various combinations of the coefficients enabled dynamic research of land-use planning, both temporally and spatially, to be carried out.
(2)
Spatial variation of the coefficient of regulation of land-use planning indicated that the central and southern regions of Guangzhou suffered a shortage of land ecological service supply in 2000–2006. In 2006–2009, implementation of land-use planning improved the supply capacity in the central, southern and western districts. In the present study the target of the overall controls and area restrictions was adjusted, and three categories of plan (Plans 1, 2 and 3) were designed using the CLUE-S mathematical model to predict land-use change for Guangzhou in 2015. The three plans introduced different distributions of land-use categories, and attempted to predict their different effects on the area. Larger areas of farmland, woodland and gardens were predicted to be better controlled in Plan 3 than in Plans 1 and 2, in which a rapid increase in built-up areas would be expected due to looser development constraints. Plan 3 allowed stricter protection of farmland and woodland areas, which was then predicted to provide greater land ecological service supply.
(3)
The results showed that combining the CLUE-S model with land ecological service research predicted land-use change reasonably well. Simulated land usage for 2006 and 2009 using the computer model demonstrated more than 80% agreement with actual land usage. From this we inferred that continued use of current land policy and overall control planning will be reasonable for Guangzhou until 2015, provided that protection of farmland and the important ecological service function areas are strengthened. The three planning scenarios produced practical alternatives for bringing the Guangzhou urban sprawl to a desirably low entropy level, which is imperative for sustainable development of the city in the future. The entropy is low for land-use Plan 1, whereas Plans 2 and 3 would result in relatively high entropy.

Acknowledgments

This study was sponsored by the National Science & Technology Pillar Program, China (No. 2012BAC05B02), National Environmental Protection Special Fund for Public Welfare Scientific Research, China (No. 201209032) and the National Natural Science Foundation of China (No. 41271105).

Conflicts of Interest

The authors declare no conflict of interest.

References

  1. Berkes, F.; Doubleday, N.C.; Cumming, G.S. Aldo leopold’s land health from a resilience point of view: Self-renewal capacity of social-ecological systems. EcoHealth 2012, 9, 1–10. [Google Scholar] [CrossRef] [PubMed]
  2. Yu, K. Security patterns and surface model in landscape ecological planning. Landsc. Urban Plan. 1996, 36, 1–17. [Google Scholar] [CrossRef]
  3. Xie, H.; Wang, P.; Huang, H. Ecological risk assessment of land use change in the poyang lake eco-economic zone, china. Int. J. Environ. Res. Public Health 2013, 10, 328–346. [Google Scholar] [CrossRef] [PubMed]
  4. Yu, G.; Feng, J.; Che, Y.; Lin, X.; Hu, L.; Yang, S. The identification and assessment of ecological risks for land consolidation based on the anticipation of ecosystem stabilization: A case study in hubei province, China. Land Use Policy 2010, 27, 293–303. [Google Scholar] [CrossRef]
  5. Spyce, A.; Weber, M.; Adamowicz, W. Cumulative effects planning: Finding the balance using choice experiments. Ecol. Soc. 2012, 17, 22:1–22:11. [Google Scholar] [CrossRef]
  6. Kiran, G.S.; Joshi, U.B. Estimation of variables explaining urbanization concomitant with land-use change: A spatial approach. Int. J. Remote Sens. 2013, 34, 824–847. [Google Scholar] [CrossRef]
  7. Tewolde, M.G.; Cabral, P. Urban sprawl analysis and modeling in Asmara, Eritrea. Remote Sens. 2011, 10, 2148–2165. [Google Scholar] [CrossRef]
  8. Li, Y.; Sun, X.; Zhu, X.; Cao, H. An early warning method of landscape ecological security in rapid urbanizing coastal areas and its application in Xiamen, China. Ecol. Model. 2010, 221, 2251–2260. [Google Scholar] [CrossRef]
  9. Li, Z.; Xu, L. Evaluation indicators for urban ecological security based on ecological network analysis. Procedia Environ. Sci. 2010, 2, 1393–1399. [Google Scholar] [CrossRef]
  10. Soofi, E.S.; Retzer, J.J.; Yasai-Ardekani, M. A framework for measuring the importance of variables with applications to management research and decision models*. Decis. Sci. 2000, 31, 595–625. [Google Scholar] [CrossRef]
  11. Bélanger, V.; Vanasse, A.; Parent, D.; Allard, G.; Pellerin, D. Development of agri-environmental indicators to assess dairy farm sustainability in Quebec, Eastern Canada. Ecol. Indic. 2012, 23, 421–430. [Google Scholar] [CrossRef]
  12. Hosseini, H.M.; Kaneko, S. Dynamic sustainability assessment of countries at the macro level: A principal component analysis. Ecol. Indic. 2011, 11, 811–823. [Google Scholar] [CrossRef]
  13. Banai, R. Land resource sustainability for urban development: Spatial decision support system prototype. J. Environ. Manage. 2005, 36, 282–296. [Google Scholar] [CrossRef] [PubMed]
  14. Lopez-Carr, D.; Davis, J.; Jankowska, M.M.; Grant, L.; Lopez-Carr, A.C.; Clark, M. Space versus place in complex human-natural systems: Spatial and multi-level models of tropical land use and cover change (LUCC) in Guatemala. Ecol. Model. 2012, 229, 64–75. [Google Scholar] [CrossRef] [PubMed]
  15. Mas, J.F.; Pérez-Vega, A.; Clarke, K.C. Assessing simulated land use/cover maps using similarity and fragmentation indices. Ecol. Complex. 2012, 11, 38–45. [Google Scholar] [CrossRef]
  16. Al Bassam, B.F. Dynamics of land use/cover change in Puding city area using remotely sensed data. Earth Sci. J. China 2007, 18, 165–167. [Google Scholar]
  17. Ikiel, C.; Ustaoglu, B.; Dutucu, A.A.; Kilic, D.E. Remote sensing and GIS-based integrated analysis of land cover change in Duzce plain and its surroundings (north western Turkey). Environ. Monit. Assess. 2012, 185, 1699–1709. [Google Scholar] [CrossRef] [PubMed]
  18. Wahren, A.; Berkhoff, K.; Münch, A.; Herrmann, S.; Feger, K.H. A setup for a scenario-driven water balance at landscape scale—assessment with AKWA-M®-Embedded in a model framework for land-use planning’s decision support in mountainous southwest China. J. Earth Sci. China 2010, 21, 974–978. [Google Scholar] [CrossRef]
  19. Hirsh, J.B.; Mar, R.A.; Peterson, J.B. Psychological entropy: A framework for understanding uncertainty-related anxiety. Psychol. Rev. 2012, 119, 304–320. [Google Scholar] [CrossRef] [PubMed]
  20. Leopold, L.B.; Langbein, W.B. The Concept of Entropy in Landscape Evolution; US Government Printing Office: Washington, Washington DC, USA, 1962.
  21. Rees, W.; Wackernagel, M. Urban ecological footprints: Why cities cannot be sustainable- and why they are a key to sustainability. Environ. Impact Assess. 1996, 16, 223–248. [Google Scholar] [CrossRef]
  22. Appiah-Opoku, S.; Taylor, C. Environmental land use and the ecological footprint of higher learning. In Environmental Land Use Planning; Appiah-Opoku, S., Ed.; InTech: New York, NY, USA, 2012; Chapter 6; pp. 117–134. [Google Scholar]
  23. Verburg, P.H.; de Koning, G.; Kok, K.; Veldkamp, A.; Bouma, J. A spatial explicit allocation procedure for modelling the pattern of land use change based upon actual land use. Ecol. Model. 1999, 116, 45–61. [Google Scholar] [CrossRef]
  24. Veldkamp, A.; Fresco, L. Clue-cr: An integrated multi-scale model to simulate land use change scenarios in costa rica. Ecol. Model. 1996, 91, 231–248. [Google Scholar] [CrossRef]
  25. Wang, L.; Su, H.; Cui, Z. Optimization of coarse aggregate content based on efficacy coefficient method. J. Wuhan Univ. Technol. Mater. Sci. Ed. 2011, 26, 329–334. [Google Scholar] [CrossRef]
  26. Pontius, R.G.; Schneider, L.C. Land-cover change model validation by an roc method for the ipswich watershed, massachusetts, USA. Agr. Ecosyst. Environ. 2001, 85, 239–248. [Google Scholar] [CrossRef]
  27. Yang, Z. Eco-Cities: A Planning Guide; CRC Press: Boca Raton, FL, USA, 2012. [Google Scholar]

