Article

Classification of Knee Joint Vibration Signals Using Bivariate Feature Distribution Estimation and Maximal Posterior Probability Decision Criterion

School of Information Science and Technology, Xiamen University, 422 Si Ming South Road,Xiamen 361005, China
*
Author to whom correspondence should be addressed.
Entropy 2013, 15(4), 1375-1387; https://doi.org/10.3390/e15041375
Submission received: 4 February 2013 / Revised: 8 April 2013 / Accepted: 15 April 2013 / Published: 17 April 2013
(This article belongs to the Special Issue Maximum Entropy and Bayes Theorem)

Abstract

:
Analysis of knee joint vibration or vibroarthrographic (VAG) signals using signal processing and machine learning algorithms possesses high potential for the noninvasive detection of articular cartilage degeneration, which may reduce unnecessary exploratory surgery. Feature representation of knee joint VAG signals helps characterize the pathological condition of degenerative articular cartilages in the knee. This paper used the kernel-based probability density estimation method to model the distributions of the VAG signals recorded from healthy subjects and patients with knee joint disorders. The estimated densities of the VAG signals showed explicit distributions of the normal and abnormal signal groups, along with the corresponding contours in the bivariate feature space. The signal classifications were performed by using the Fisher’s linear discriminant analysis, support vector machine with polynomial kernels, and the maximal posterior probability decision criterion. The maximal posterior probability decision criterion was able to provide the total classification accuracy of 86.67% and the area ( A z ) of 0.9096 under the receiver operating characteristics curve, which were superior to the results obtained by either the Fisher’s linear discriminant analysis (accuracy: 81.33%, A z : 0.8564) or the support vector machine with polynomial kernels (accuracy: 81.33%, A z : 0.8533). Such results demonstrated the merits of the bivariate feature distribution estimation and the superiority of the maximal posterior probability decision criterion for analysis of knee joint VAG signals.

1. Introduction

The knee is composed of the femur, tibia, fibula, and patella (or knee cap), the extensive ligaments, and two main muscle groups (i.e., quadriceps and the hamstrings) [1]. The knee joint has a crescent-shaped fibrocartilaginous structure, named meniscus, which fits into the joint between the tibia and the femur. It allows the bones to slide freely on each other in the joint. A pair of knees support nearly the entire weight of the human body, and help the body perform different mobility functions in the locomotion [2]. The knee joint can afford moderate stress without much internal injury, but it is not able to withstand rotational forces that commonly occur in athletic activities. In addition to the sports injury, the degeneration or damage of cartilage in the articular surface may cause rheumatic disorders such as osteoarthritis [3]. Screening of knee joint disorders at an early stage can provide preliminary information for physicians to undertake some appropriate therapy options in order to retard the degenerative process of arthritis [1].
Detection of knee joint disorders requires a thorough medical history, physical examination, and may need some additional tests such as magnetic resonance imaging (MRI) or computed tomography (CT). MRI is commonly used to characterize the in vivo orthopaedic condition of articular cartilage in the knee joint [4]. It is a popular noninvasive method for the assessment of knee joint degeneration. Although MRI provides good image contrast that helps discriminate the articular cartilage and synovial fluid of the joint, it only displays anatomical morphology of the knee joint rather than the functional condition illustration during leg movement. In the standard CT scanning procedure, the X-ray beam moves in a circle around the body. CT images can provide much detailed information about the bone tissue and bone structure [4]. However, CT scanning takes the risks of radiation exposure due to the cumulative number of X-ray examinations.
Arthroscopy is a common surgical procedure to visualize, diagnose, and sometimes treat the interior damage of a knee joint [1]. In an arthroscopy examination, orthopaedic surgeons insert an arthroscope fiber through a small incision in the knee to inspect the structure inside the joint. Compared with the traditional open surgery, arthroscopy is a semi-invasive method that does not require to open up the joint fully. The knee arthroscopy just needs to make two small incisions: one for the arthroscope and the other for the surgical instruments to be used in the knee cavity. It could reduce recovery time and may also increase the rate of surgical success due to less trauma to the connective tissue. Although arthroscopy is widely used as the “gold standard” for relatively low-risk assessment of knee joint injury [3], it is not suited for the patients whose knees are in a highly degenerated state due to ligamentous instability, meniscectomy, or patellectomy. In addition, arthroscopy cannot be used for routine examinations of articular cartilage because the same incision may not undergo repeated arthroscope invasions.
Vibration arthrometry is an alternative and useful technology for the screening of knee joint pathology [5,6]. The protocol usually requires the subject to perform voluntary leg movement, and uses accelerometers or electro-stethoscope sensors attached on skin of the knee to record the acceleration time series called vibroarthrographic (VAG) signal. The healthy articular surfaces are bathed by joint fluid and can prevent any collision in the knee joint during leg movements. For the patients who suffer from the degeneration of cartilages, the articular surface frictions are very likely to occur in walking and sporting activities [3,7]. Knee vibration arthrometry can provide more information about the stability behavior of a knee joint, and is used as a noninvasive detection technique to study knee joint disorders [1].
The purpose of knee joint VAG signal analysis is to interpret distinct features in the temporal and frequency scales [8,9,10,11]. With the statistical features extracted [12,13,14,15], computational algorithms can be utilized to distinguish anomalous patterns associated with pathology [10,16,17,18]. The aim of the present study is to use the kernel density estimation method with two-dimensional Gaussian kernels to represent the knee joint VAG signals in the bivariate feature space. The classification task is then performed by using the maximal posterior probability decision criterion that can distinguish the VAG signals into the normal or pathological group.

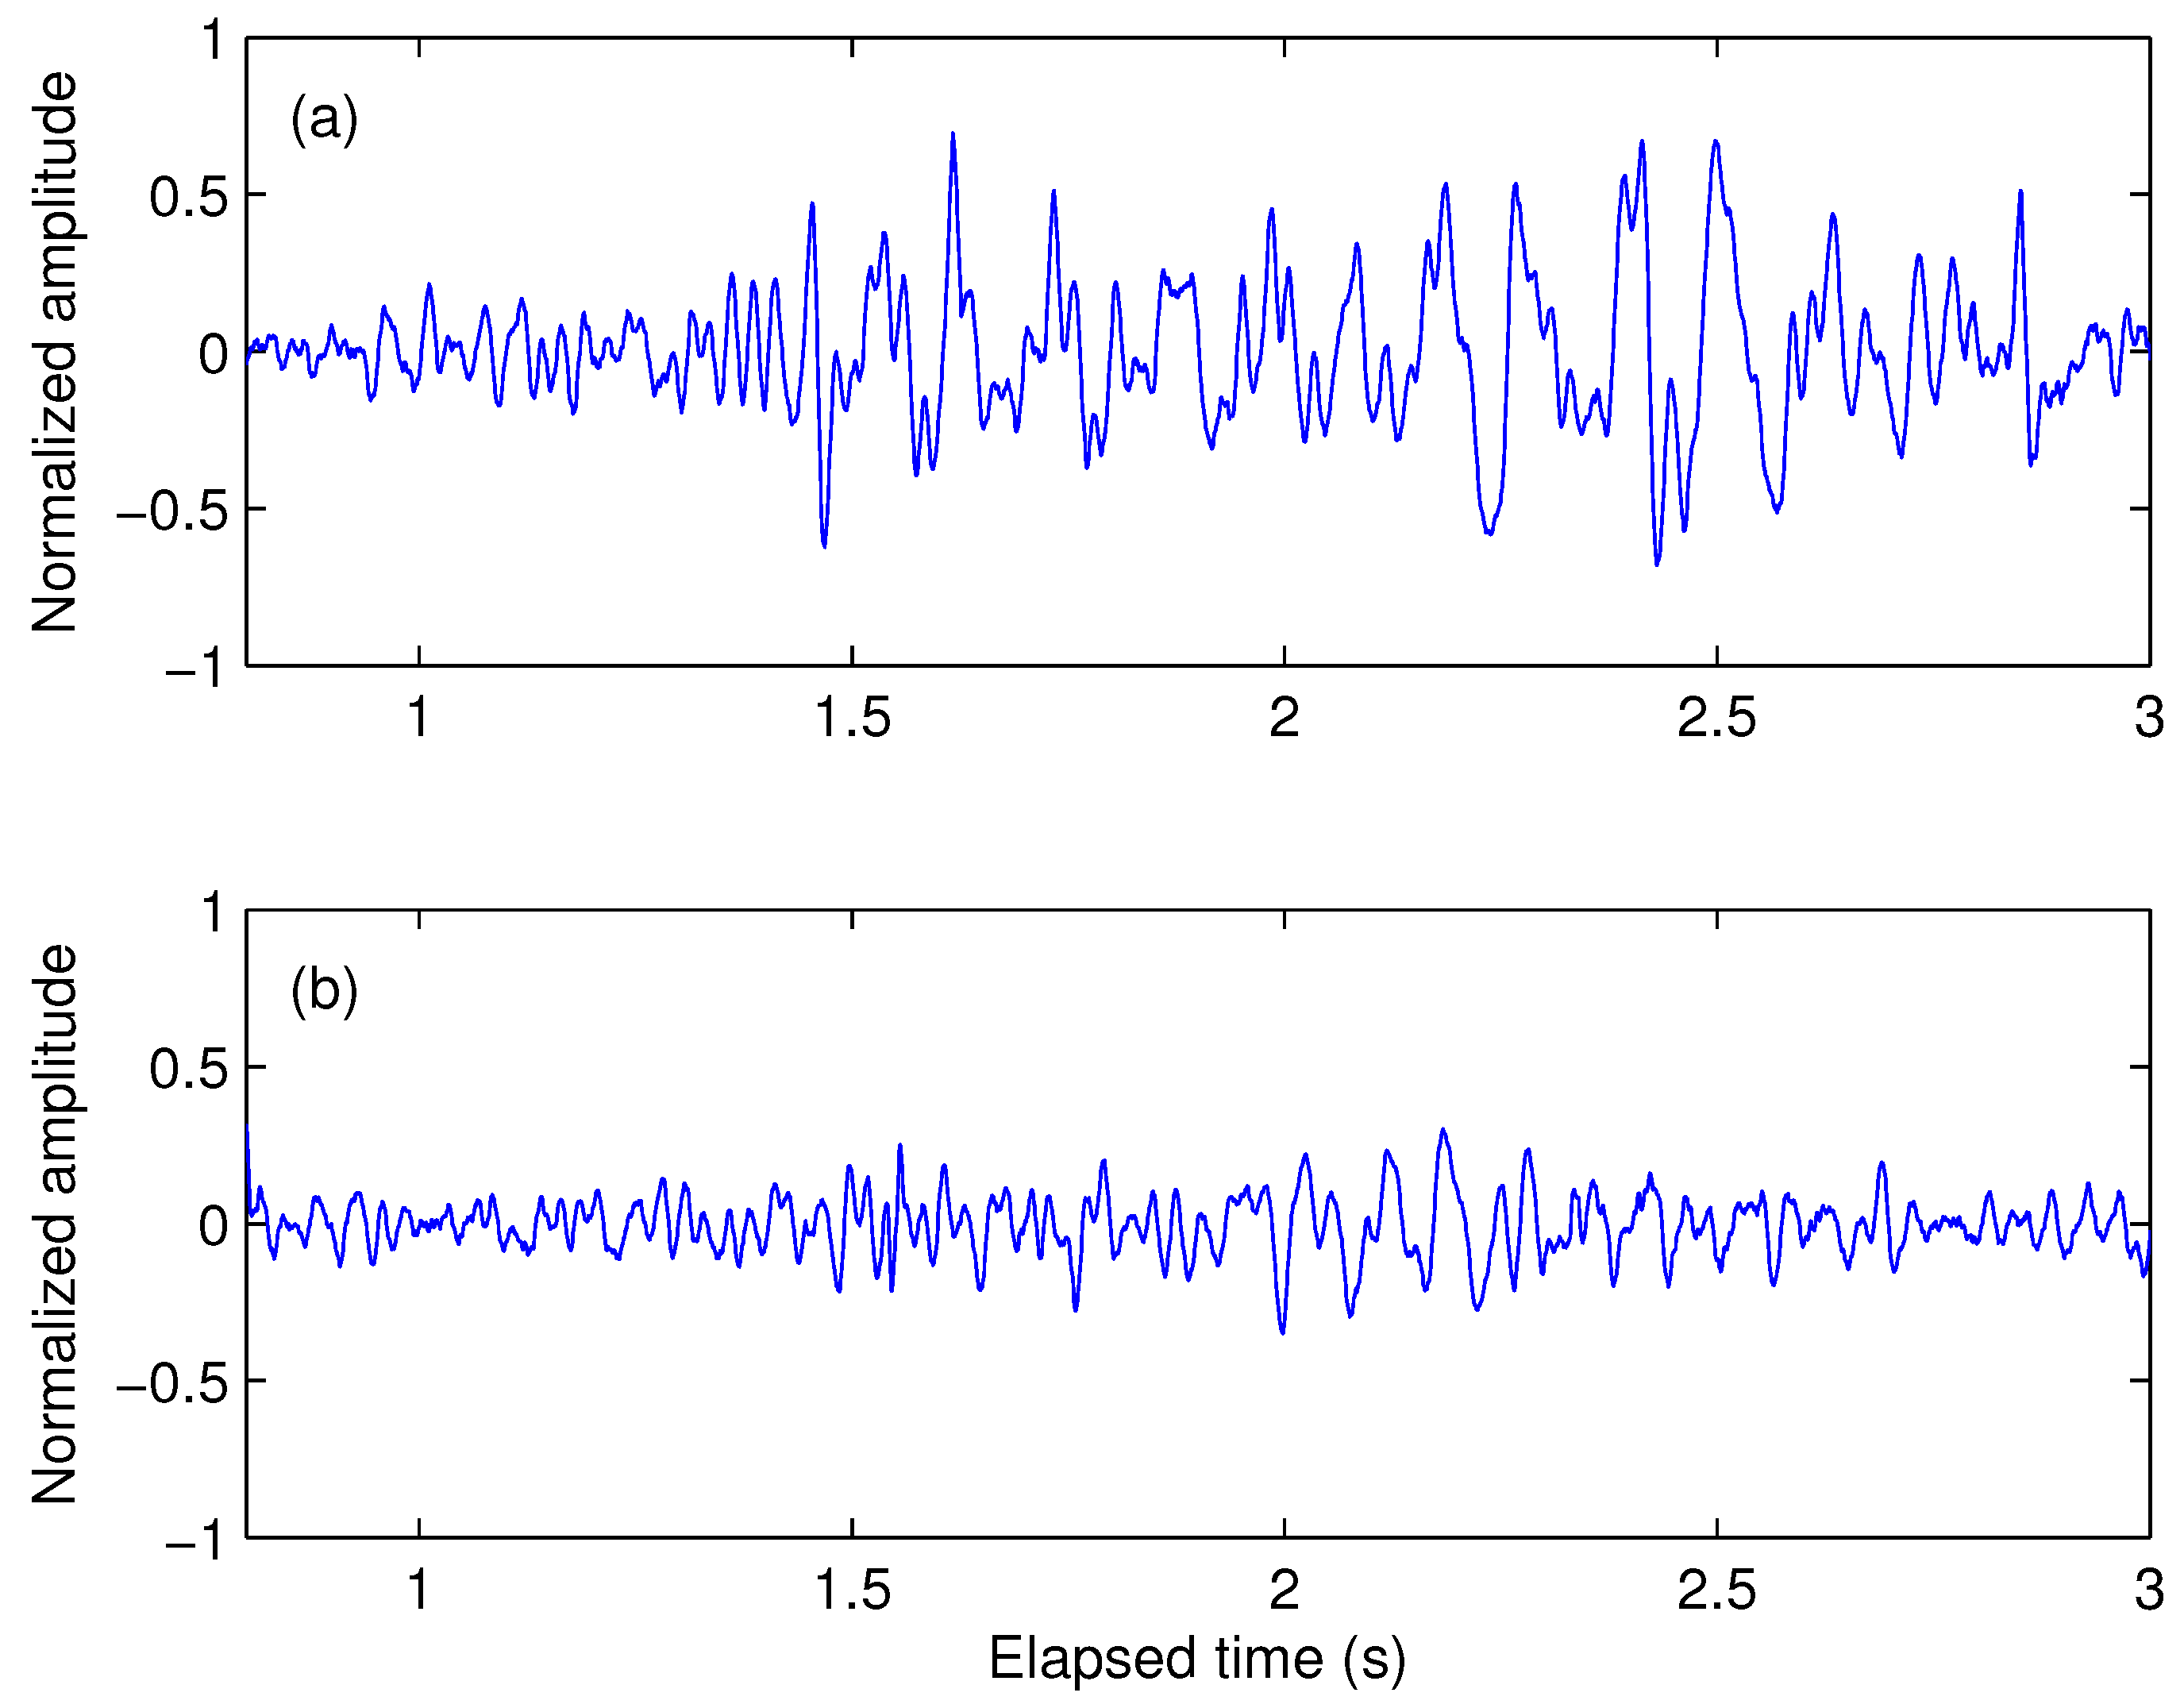
2. VAG Signal Acquisition and Feature Description

2.1. Dataset

The knee joint VAG signals analyzed in the present work were selected from the dataset used in a few previous related studies [10,12,13,14,15]. The signals were recorded from 75 subjects (47 healthy volunteers and 28 patients with knee joint disorders). The healthy volunteers were confirmed by medical history and physical examination. The patients were suffering from different pathologies, such as chondromalacia, meniscus tear, and anterior cruciate ligament injuries, which were confirmed by arthroscopy examinations.
In the data acquisition procedure, an accelerometer was attached at the middle position of the patella. The subjects who sit on a rigid table were requested to voluntarily swing the leg over the angle range from 135º (approximately full flexion) to 0º (full extension), and then back to 135º in 4 seconds [16]. The first half and the second half of the leg swinging are also referred to as extension and flexion movements, respectively. Auscultation of the knee joint using a stethoscope was also performed, and a qualitative description of sound intensity and type was recorded in correspondence with the joint angle. Each VAG signal was digitized with a sampling rate of 2 kHz and the resolution of 12 bit per sample. Prior to feature analysis, the baseline wander in each raw signal was removed by a cascade moving average filter [19], and the random noise was eliminated by a time-delay neural filter [20].

2.2. Features Description

Noting that the knee joint VAG signals recorded from the symptomatic patients with knee joint pathologies commonly exhibit higher variability or complexity, the corresponding signal patterns should possess different shape characteristics from those of healthy subjects. For a better representation of the normal and abnormal VAG signals, we considered two waveshape features extracted in the time scale for the classification task.
The first feature was the variance of the mean-squared (VMS) values in every fixed-duration segment (5 ms each) of a given VAG signal [13]. The VMS values can be used to describe the local spread or dispersion degree of the signal in a short time span. The Kruskal–Wallis test results showed that the VMS values of the normal and abnormal VAG signals reached the level of significant difference (p < 0 . 01 ) [13]. On the other hand, the form factor (FF) value was computed for each VAG signal to measure the shape complexity [12]. The FF is computed as the ratio of mobility of the first derivative of the signal M s to the mobility of the signal itself M s [21]:
F F = M s M s
where the mobility M s denotes the square root of the ratio of the variance of the first derivative of the signal σ s to the variance of the original signal σ s :
M s = σ s 2 σ s 2 1 2 = σ s σ s
Then the FF can be rewritten as
F F = σ s σ s σ s σ s σ s σ s σ s σ s
where σ s represents the square root of the variance of the second derivative of the signal s . The p value of the FF feature estimated by the Kruskal–Wallis test was lower than 0.01 [12], which implied that the distributions for the normal and abnormal VAG signals were also significantly different.

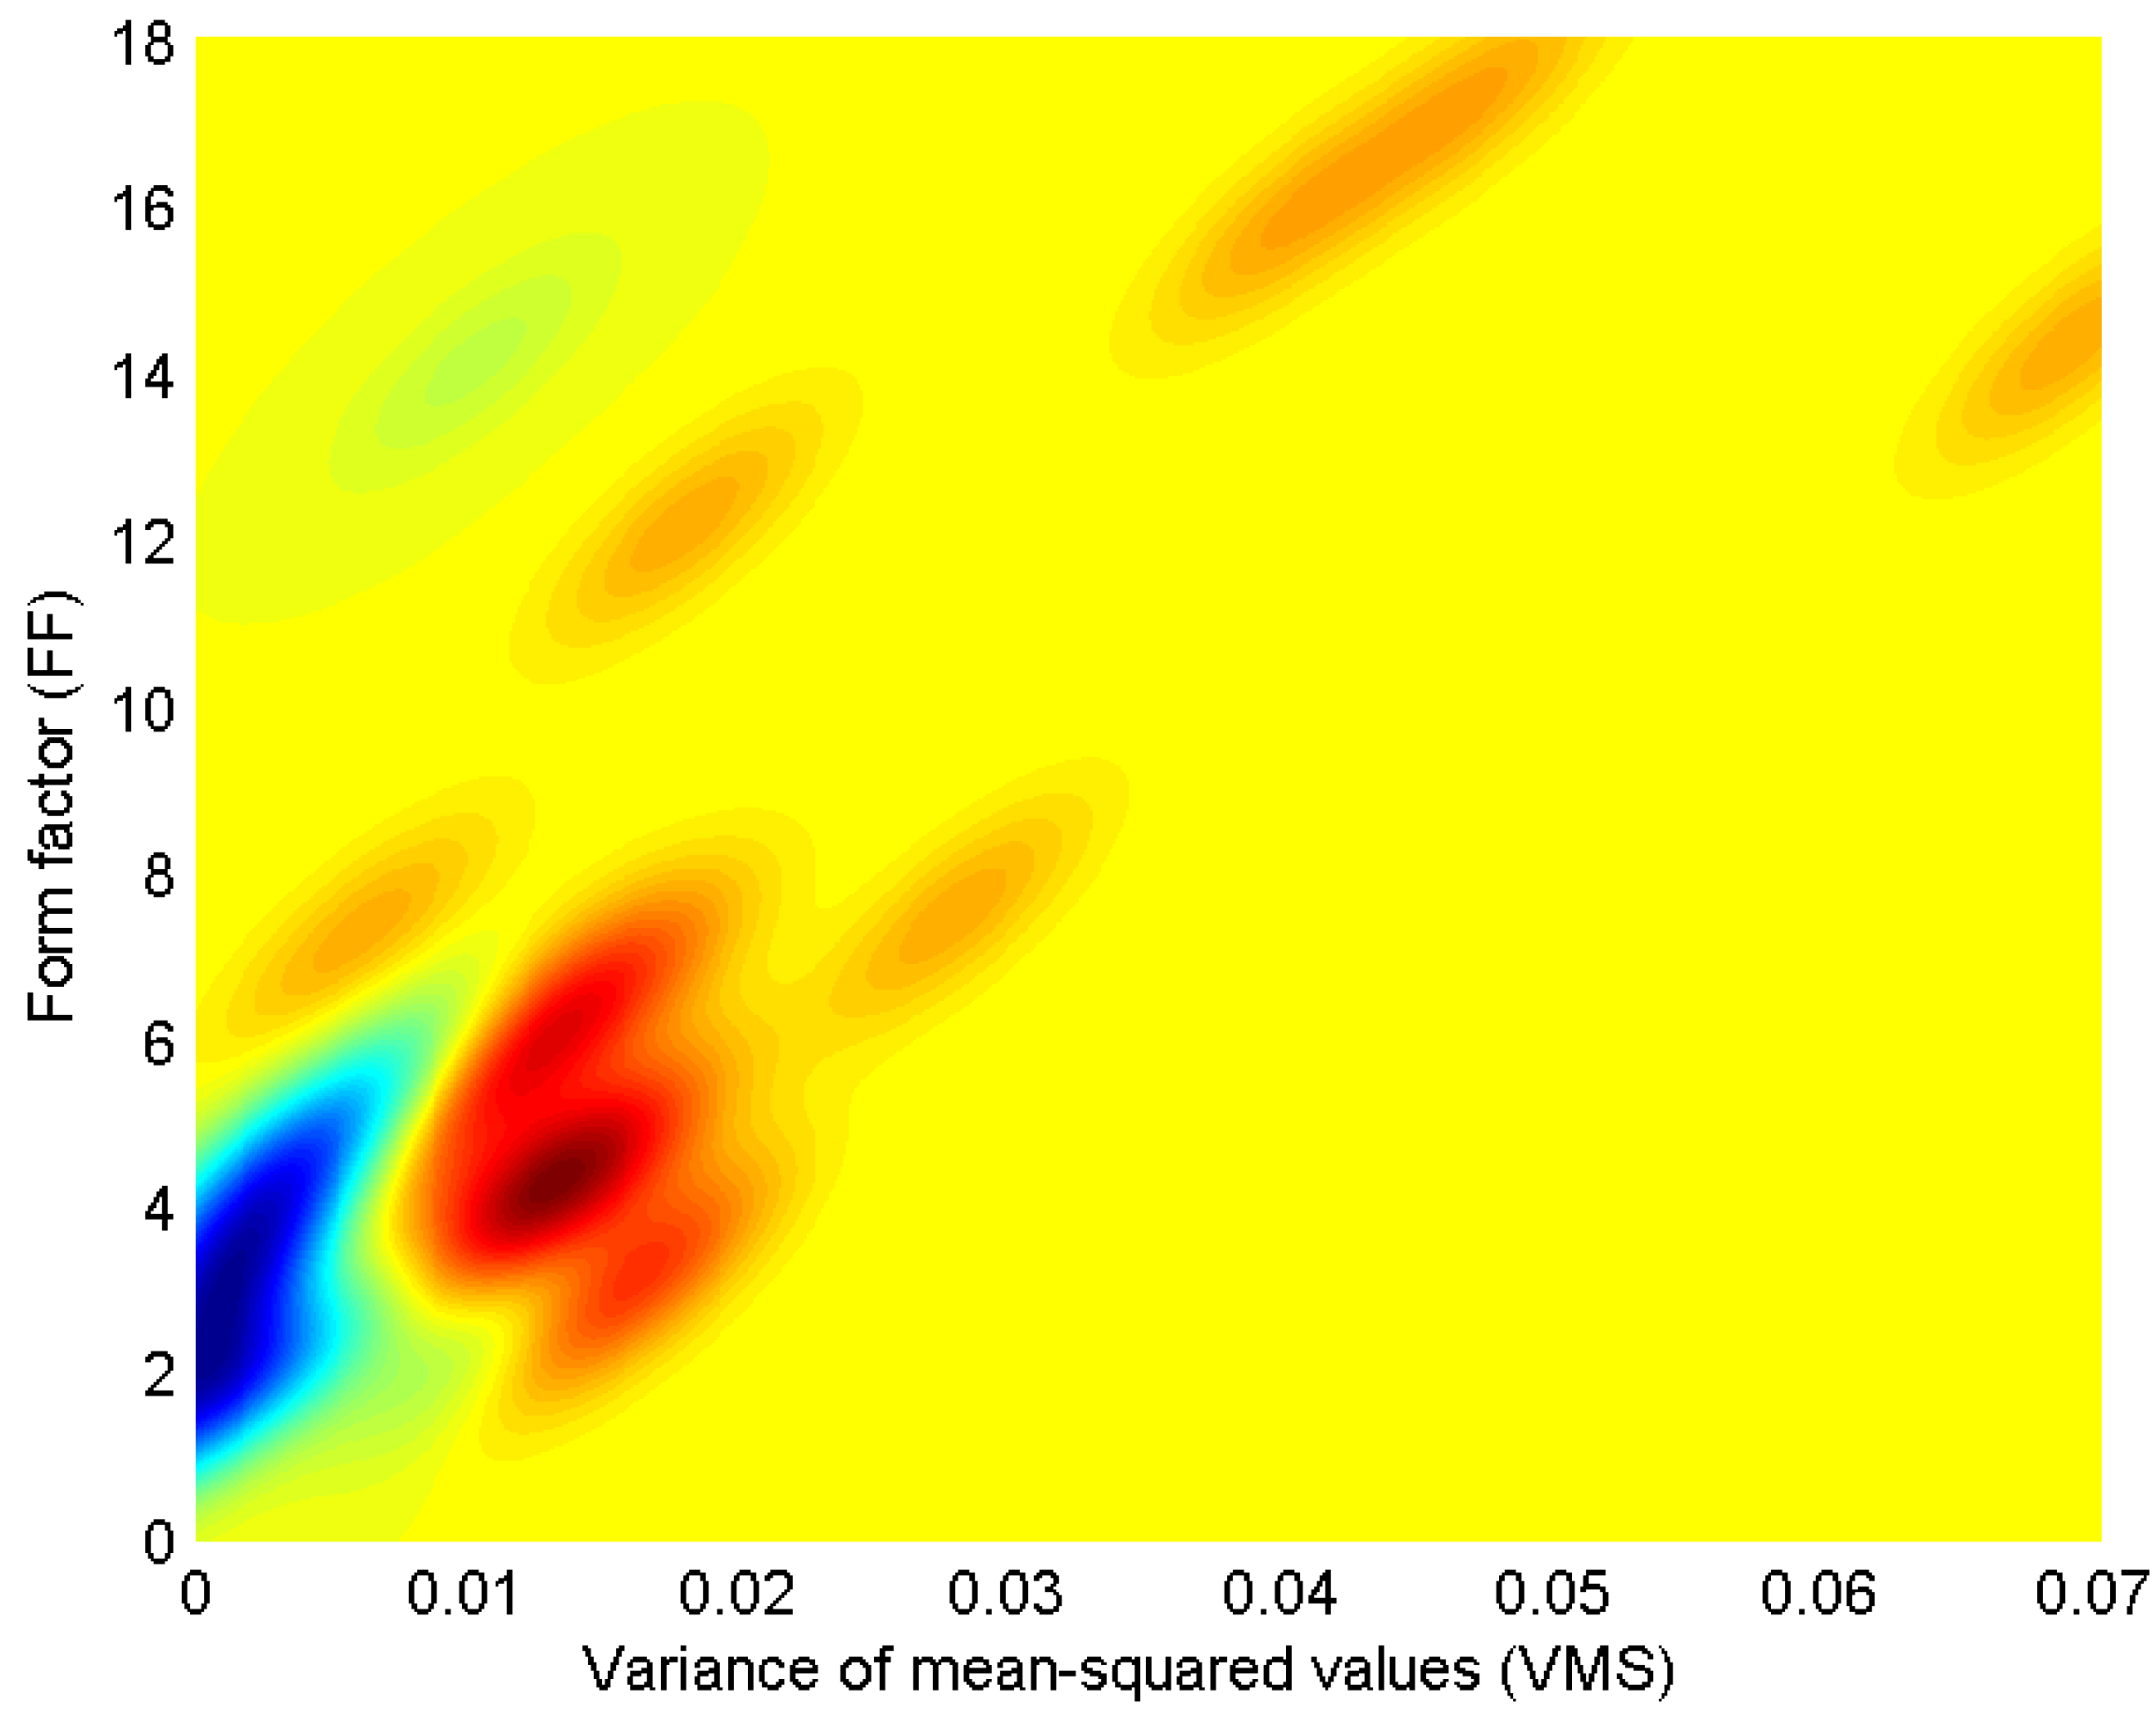
3. Bivariate Probability Distribution Modeling

In order to estimate the distribution of the knee joint VAG signals in the bivariate feature space, we applied the multivariate kernel density estimation method. The kernel density estimation can be used to approximate arbitrary multimodal distributions without the assumption of underlying density functions [22,23]. In the present study, we used the kernel functions to estimate the class-conditional probability density of the bivariate features for the two VAG signal groups respectively. Let u = u x , u y T be the vector of the VMS and FF features. Suppose that a particular VAG group ω, ( ω { ω N , ω A } , ω N and ω A indicating the normal and abnormal signal groups respectively) contains K signals in total. The class-conditional probability density is then estimated as [22]:
p ^ ( u ω ) = 1 K k = 1 K f ( u ω )
The bivariate Gaussian kernel function f ( · ) N ( μ , ) is written as
f ( u ω ) = 1 2 π 1 / 2 exp - 1 2 ( u - μ k ) T - 1 ( u - μ k )
The center of Gaussian kernel is μ k = μ x k , μ y k T , which is the location of the k-th VAG signal in the group ω. The spread area of the Gaussian kernel is determined by the symmetric and positive definite covariance matrix, which is given by
Σ = g σ x 2 ρ σ x σ y ρ σ x σ y σ y 2
where σ x = 0 . 0109 and σ y = 3 . 1436 represent the standard deviation of the VMS and FF features respectively, ρ = 0 . 7756 denotes the correlation coefficient between these two features, and g is the scaling factor that controls the bandwidth of the Gaussian kernel. In order to estimate the appropriate probability distributions in the bivariate feature space, we searched the scaling factor in the range from 0.01 to 1, and chose the optimal scaling factor g = 0 . 1 that helped minimize the class-conditional probability error or risk between the normal and abnormal signal groups.

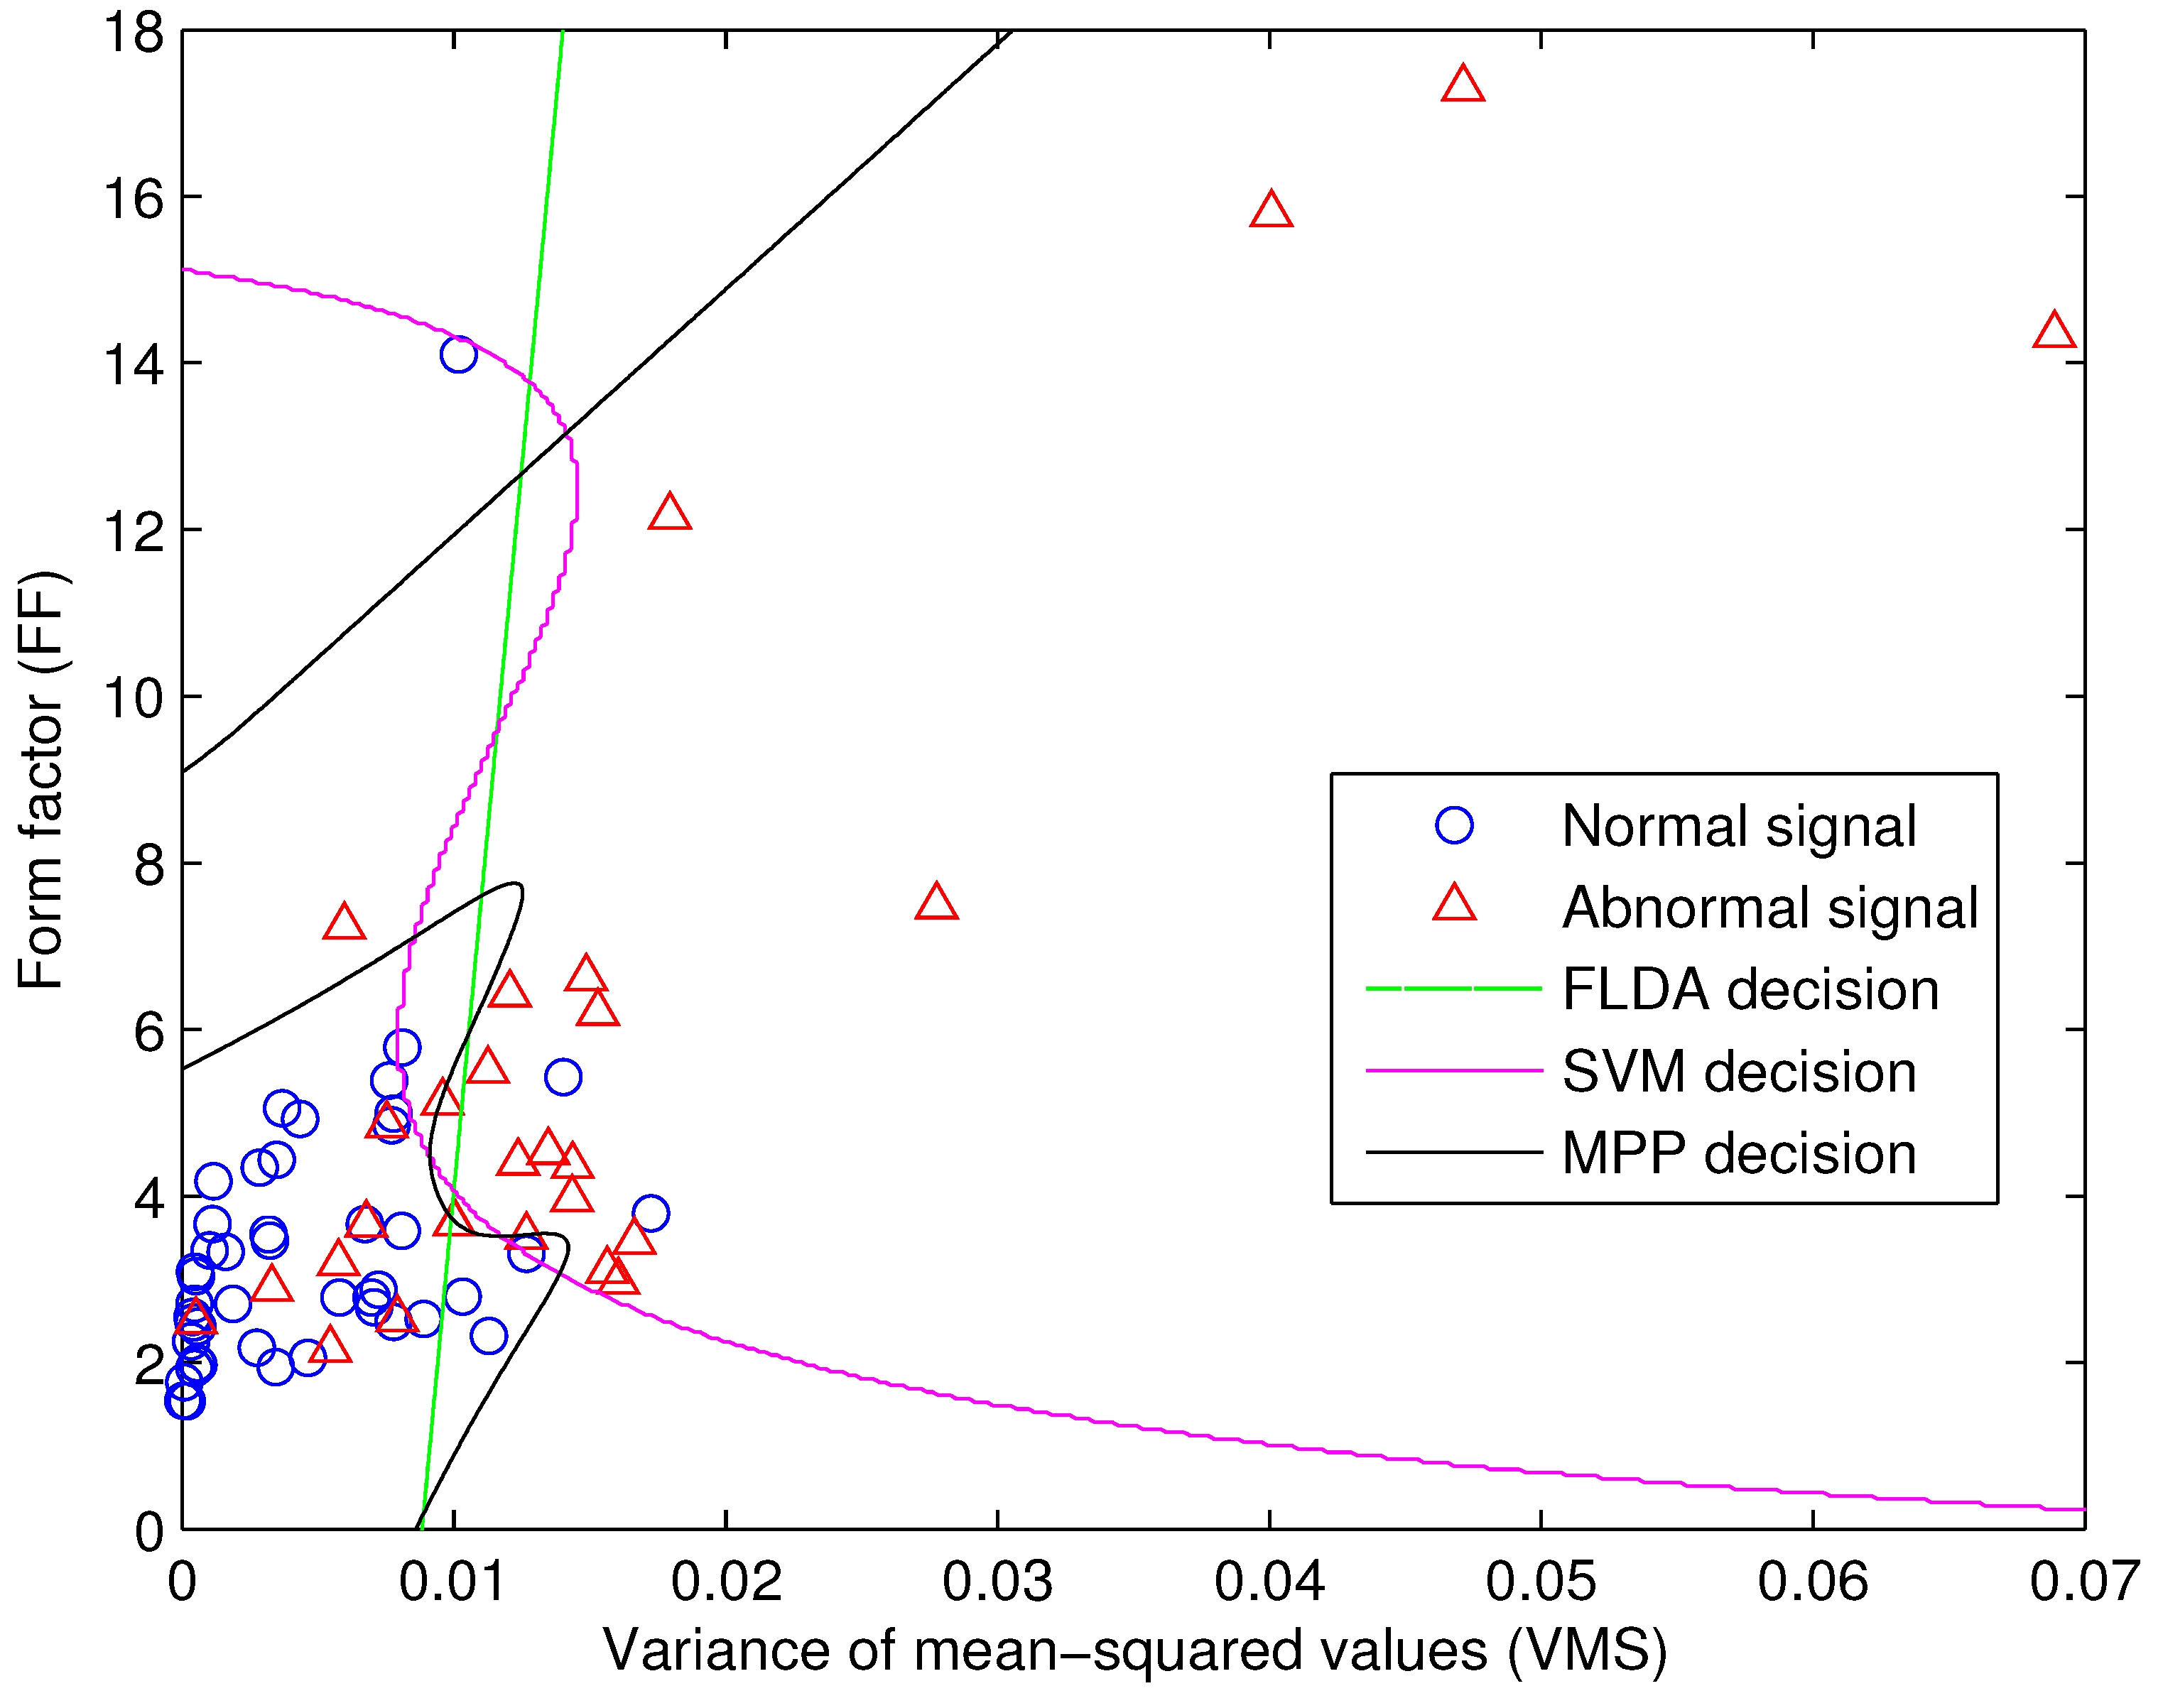
4. Signal Classification

In the present study, we performed the nonlinear classifications for the normal and abnormal signal groups. The linear classification was implemented by the Fisher’s linear discriminant analysis and the nonlinear classification was performed according to the maximal posterior probability decision criterion. For a performance comparison, the support vector machine with polynomial kernels was also employed to distinguish the normal and abnormal signal groups. The details of the algorithms and experiment settings are presented as follows.

4.1. Fisher’s Linear Discriminant Analysis

Fisher’s linear discriminant analysis (FLDA) is a simple but effective pattern classification tool that searches a mapping orientation that leads to the best separation among the classes [24]. In other words, the FLDA performs a projection of the multidimensional data onto a straight line so that the dimensionality of the complex dataset can be reduced [25]. The FLDA is widely used in practical applications because it does not require the prior assumption that the classes are with normal distributions or equal covariances [26].
The objective of the FLDA algorithm is to seek a linear combination of features that yields the maximization of the discriminant function [27]:
J ( w ) = w T S B w w T S W w
where w is the linear combination vector that indicates projection direction, S B represents the inter-class (or between-class) scatter matrix, and S W denotes the intra-class (or within-class) scatter matrix. For the binary classification of the knee joint VAG signals, the scatter matrices S B and S W are defined as [26]:
S B = ( m N - m A ) ( m N - m A ) T
and
S W = u ω N ( u - m N ) ( u - m N ) T + u ω A ( u - m A ) ( u - m A ) T
where m N and m A denotes the mean of u for the normal and abnormal signal groups, respectively. If the intra-class scatter matrix S W is nonsingular, the discriminant function J ( w ) can be maximized by the Lagrange multiplier method, and the projection direction that makes the best linear separation of the VAG signal groups is given by the solution w * = S W - 1 ( m N - m A ) [27].

4.2. Maximal Posterior Probability Decision Criterion

According to Bayes’ formula, the joint probability density of finding a signal with the feature vector u in a particular group ω can be written as
p ( u , ω ) = p ( u ω ) P ( ω ) = P ( ω u ) p ( u )
where P ( ω ) is the prior probability that indicates the occurrence of a signal group, P ( ω u ) is the posterior probability that describes the probability of the state of a signal being in the group ω with respect to the corresponding measured feature vector u . For the VAG signal classification, the evidence factor p ( u ) is the sum of the product between the class-conditional probability density and prior probability for the normal and abnormal signal groups, i.e.,
p ( u ) = ω ω N , ω A p ( u ω ) P ( ω )
Therefore, the posterior probability P ω u can be computed as [27]:
P ( ω u ) = p ( u ω ) P ( ω ) ω ω N , ω A p ( u ω ) P ( ω )
With the measured feature vector u , a given VAG signal is then assigned the class label according to the maximal posterior probability (MPP) criterion as
arg max ω ω N , ω A P ( ω u )

4.3. Support Vector Machine

The support vector machine (SVM) with inner-product kernels is a supervised learning model that can be used to perform nonlinear classification by mapping the inputs into high-dimensional spaces [28,29]. By choosing different nonlinear inner-product kernels, the architecture of the SVM is equivalent to the polynomial learning machine (with polynomial kernels), the radial basis function network (with Gaussian kernels), or the multilayer perceptron with a single hidden layer (with sigmoid kernels) [27]. The learning of the SVM follows the structural risk minimization rule by means of solving the quadratic programming problem [30]. During the model parameter optimization process, a subset of the representative training data is selected as support vectors, with which the SVM constructs a hyperplane as the decision surface to maximize the margin of separation between the classes [27].
To select the appropriate kernels for the SVM, we compared the polynomial kernels, Gaussian kernels, and sigmoid kernels, and found that the polynomial kernels can help the SVM produce the best classification accuracy and confusion matrix results over the current dataset. Therefore, we employed the SVM with polynomial kernels to perform the knee joint VAG signal classification task in the present work. The polynomial kernel is expressed as [30]:
δ ( u i , u j ) = ( u i T u j + t ) d
where d denotes the degree of the polynomial and t represents the intercept. We searched the polynomial kernel parameters in the range from 1 to 10, and chose d = 3 and t = 4 , which could make the SVM achieve the best classification performance.

5. Results

The estimated distributions of the normal and abnormal knee joint VAG signals in the bivariate VMS-FF feature space are illustrated in Figure 1. It can be observed that the normal and abnormal VAG signals locate in the distinctive regions in the feature space. The majority of the normal signals aggregates in the area with the VMS value smaller than 0.012 and the FF value lower than 6. The normal signals recorded from the healthy subjects possess the unimodal probability density, whereas the abnormal signals associated with pathological conditions in the knee joint present more of multimodal characteristics.
Figure 1. Distributions of the bivariate features for the normal and abnormal knee joint vibration signals. The distribution of the normal signals is shown with the cold color map (blue representing the highest density), whereas the distribution of the abnormal signals is illustrated with the hot color map (red representing the highest density).
Entropy 15 01375 g001
The decision boundaries given by the FLDA, the SVM, and the MPP classifiers are shown in Figure 2. The FLDA made a linear decision boundary close to the vertical line to split the bivariate VMS-FF feature space into two parts. The SVM and MPP produced the different nonlinear discriminant boundaries to separate the normal and abnormal VAG signals. The SVM provided the decision boundary similar to an S-shape curve based on the selected support vectors. The MPP treated the normal signal locating in the left-top corner separately and distinguished the other VAG signals based on the contours of the estimated bivariate feature distribution.
Figure 2. Decision boundaries provided by the Fisher’s linear discriminant analysis (FLDA), the support vector machine (SVM) with polynomial kernels, and the maximum posteriori probability (MPP) estimation method.
Entropy 15 01375 g002
The FLDA and the SVM produced the same total classification accuracy of 81.33%, and the MPP method provided a higher correct accurate rate of 86.67%. The confusion matrices provided by the FLDA, SVM and MPP classifiers are listed in Table 1, Table 2 and Table 3, respectively. The true negative rate of the FLDA (specificity: 0.8936) was worse than that of the SVM (specificity: 0.9149), whereas the FLDA provided a better true positive rate (sensitivity: 0.6786) than the SVM (sensitivity: 0.6429), with an additional abnormal VAG signal correctly classified. Compared with the FLDA and SVM classifiers, the MPP method was able to correctly distinguish more VAG signals for the both normal and abnormal groups, with the highest values of sensitivity (0.75) and specificity (0.9362). The area under the receiver operating characteristic (ROC) curve A z of the SVM was 0.8533 (standard error, SE: 0.0467). Such results was slightly worse than that of the FLDA ( A z ± SE: 0 . 8564 ± 0 . 0447 ), because the FLDA successfully classified one more abnormal signal than the SVM. The best ROC curve was obtained with the MPP method, with the highest A z value of 0.9096 (SE: 0.0332). It is very clear that the MPP method outperformed the linear FLDA and the SVM with nonlinear inner-product kernels for the knee joint VAG signal classification. Moreover, the results of the MPP method were better than those of the radial-basis function neural network with the features of form factors, skewness, kurtosis, entropy ( A z : 0.8172) [12], or with the features of variance of mean-squared values and turns count with adaptive threshold ( A z : 0.857) [13].
Table 1. The confusion matrix and area under the receiver operating characteristic (ROC) curve of the Fisher’s linear discriminant analysis (FLDA). A z : area under ROC curve. SE: standard error.
actual group
Total numberpositivenegative
2847
classified grouppositive24195
negative51942
sensitivity 19 / 28 = 0 . 6786
specificity 42 / 47 = 0 . 8936
A z ± SE 0 . 8564 ± 0 . 0447
Table 2. The confusion matrix and area under the receiver operating characteristic (ROC) curve of the support vector machine (SVM) with polynomial kernels. A z : area under ROC curve. SE: standard error.
actual group
Total numberpositivenegative
2847
classified grouppositive25187
negative50743
sensitivity 18 / 28 = 0 . 6429
specificity 43 / 47 = 0 . 9149
A z ± SE 0 . 8533 ± 0 . 0467
Table 3. The confusion matrix and area under the receiver operating characteristic (ROC) curve of the maximal posterior probability (MPP) decision. A z : area under ROC curve. SE: standard error.
actual group
Total numberpositivenegative
2847
classified grouppositive27216
negative48444
sensitivity 21 / 28 = 0 . 75
specificity 44 / 47 = 0 . 9362
A z ± SE 0 . 9096 ± 0 . 0332
Most of the misclassified normal signals were recorded from the elderly healthy subjects. These subjects were suspected in the course of chronic articular cartilage disorders, although there was no symptom found in the current physical examinations for them. By checking with the arthroscopy surgery records, we found that majority of the misclassified abnormal VAG signals were associated with the lateral or medial meniscus tears, and the most of the corrected distinguished abnormal signals were recorded from patients who suffered chondromalacia at different grades. Figure 3 shows a pair of abnormal signal segment samples recorded from the patients with Grade I–II chondromalacia (upper trace) and lateral meniscus tear (lower trace), respectively. It can be observed that the morphological characteristics of the two abnormal signal segments were different. The signal with chondromalacia exhibited a higher degree of fluctuations, and the morphology of the signal with lateral meniscus tear was closer to that of the signal recorded from healthy adults.
Figure 3. Segments of the knee joint vibration signals associated with (a) Grade I–II chondromalacia and (b) lateral meniscus tear.
Entropy 15 01375 g003

6. Discussion and Conclusions

Computer-aided analysis of knee joint vibration signals helps improve the noninvasive detection and localization of articular cartilage disorders at an early stage. The present study used the kernel-based probability density modeling method and maximal posterior probability decision criterion to study the VAG signals. The estimated densities showed the distributions of the VAG signals in the bivariate feature space, and the contours of the normal and abnormal signal groups were more explicit than the scatter plot of these signals. Experiment results of the signal classifications, in terms of total accuracy and area under the receiver operating characteristic curve, demonstrated the merits and superiority of the maximal posterior probability decision criterion, compared with the Fisher’s linear discriminant analysis and support vector machine with polynomial kernels.
The present study still has some limitations because the number of the abnormal signals with chondromalacia and meniscus tears was not large enough to support the further study of the pathological subclasses. It is important to extract other morphological features to describe the dynamics characteristics of the abnormal VAG signals with chondromalacia and meniscus tears in the future work. The present protocol did not consider the knee flexion and extension under the loaded conditions, because some subjects with severe knee joint disorders were not able to perform the requested leg movement under loaded conditions. Further experiments will recruit more subjects with knee joint disorders at different stages and some subjects with knee pain but without knee injury. We are interested in studying the morphological features of VAG signals recorded from these subjects at different loaded conditions. We also plan to incorporate the methodology presented in this paper in a follow-up investigation to establish the feature distributions of the subjects with degenerative articular cartilage disorders at different stages. It is positively considered that the progressive changes of feature density distributions could provide useful information about the progress of articular cartilage degeneration, which could assist physicians and medical experts to assess the pathological conditions of patients.

Acknowledgment

The authors would like to thank Rangaraj M. Rangayyan, Cyril B. Frank, and Gordon D. Bell, for the work of data acquisition. This work was supported in part by the National Natural Science Foundation of China under Grant Number 81101115 and 31200769, the Natural Science Foundation of Fujian Province of China under Grant Number 2011J01371, and the Fundamental Research Funds for the Central Universities of China under Grant Number 2010121061 and 2010121062. N. Xiang was supported by Xiamen University Undergraduate Innovation Training Project under Grant Number XDDC201210384072, and the Fundamental Research Funds for the Central Universities under Grant Number CXB2011023.

References

  1. Wu, Y.F.; Krishnan, S.; Rangayyan, R.M. Computer-aided diagnosis of knee-joint disorders via vibroarthrographic signal analysis: A review. Crit. Rev. Biomed. Eng. 2010, 38, 201–224. [Google Scholar] [PubMed]
  2. Vigorita, V.J. Orthopaedic Pathology; Lippincott Williams & Wilkins: Philadelphia, PA, USA, 1999. [Google Scholar]
  3. Frank, C.B.; Rangayyan, R.M.; Bell, G.D. Analysis of knee sound signals for non-invasive diagnosis of cartilage pathology. IEEE Eng. Med. Biol. Mag. 1990, 9, 65–68. [Google Scholar] [CrossRef] [PubMed]
  4. Manaster, B.J.; Crim, J.; Rosenberg, Z.S. Diagnostic and Surgical Imaging Anatomy: Knee, Ankle, Foot; Lippincott Williams & Wilkins: Philadelphia, PA, USA, 2007. [Google Scholar]
  5. Tanaka, N.; Hoshiyama, M. Vibroarthrography in patients with knee arthropathy. J. Back Musculoskelet. Rehabil. 2012, 25, 117–122. [Google Scholar] [PubMed]
  6. Jiang, C.C.; Lee, J.H.; Yuan, T.T. Vibration arthrometry in the patients with failed total knee replacement. IEEE Trans. Biomed. Eng. 2000, 47, 218–227. [Google Scholar]
  7. Reddy, N.P.; Rothschild, B.M.; Verrall, E.; Joshi, A. Noninvasive measurement of acceleration at the knee joint in patients with rheumatoid arthritis and spondyloarthropathy of the knee. Ann. Biomed. Eng. 2001, 29, 1106–1111. [Google Scholar] [CrossRef] [PubMed]
  8. Kim, K.S.; Seo, J.H.; Kang, J.U.; Song, C.G. An enhanced algorithm for knee joint sound classification using feature extraction based on time-frequency analysis. Comput. Methods Progr. Biomed. 2009, 94, 198–206. [Google Scholar] [CrossRef] [PubMed]
  9. Krishnan, S.; Rangayyan, R.M. Automatic de-noising of knee-joint vibration signals using adaptive time-frequency representations. Med. Biol. Eng. Comput. 2000, 38, 2–8. [Google Scholar] [CrossRef] [PubMed]
  10. Wu, Y.F.; Krishnan, S. Combining least-squares support vector machines for classification of biomedical signals: A case study with knee-joint vibroarthrographic signals. J. Exp. Theor. Artif. Intell. 2011, 23, 63–77. [Google Scholar] [CrossRef]
  11. Krishnan, S.; Rangayyan, R.M.; Bell, G.D.; Frank, C.B. Adaptive time-frequency analysis of knee joint vibroarthrographic signals for noninvasive screening of articular cartilage pathology. IEEE Trans. Biomed. Eng. 2000, 47, 773–783. [Google Scholar] [CrossRef] [PubMed]
  12. Rangayyan, R.M.; Wu, Y.F. Screening of knee-joint vibroarthrographic signals using statistical parameters and radial basis functions. Med. Biol. Eng. Comput. 2008, 46, 223–232. [Google Scholar] [CrossRef] [PubMed]
  13. Rangayyan, R.M.; Wu, Y.F. Analysis of vibroarthrographic signals with features related to signal variability and radial-basis functions. Ann. Biomed. Eng. 2009, 37, 156–163. [Google Scholar] [CrossRef] [PubMed]
  14. Rangayyan, R.M.; Oloumi, F.; Wu, Y.F.; Cai, S.X. Fractal analysis of knee-joint vibroarthrographic signals via power spectral analysis. Biomed. Signal Process. Control 2013, 8, 26–29. [Google Scholar] [CrossRef]
  15. Rangayyan, R.M.; Wu, Y.F. Screening of knee-joint vibroarthrographic signals using probability density functions estimated with Parzen windows. Biomed. Signal Process. Control 2010, 5, 53–58. [Google Scholar] [CrossRef]
  16. Rangayyan, R.M.; Krishman, S.; Bell, G.D.; Frank, C.B.; Ladly, K.O. Parametric representation and screening of knee joint vibroarthrographic signals. IEEE Trans. Biomed. Eng. 1997, 44, 1068–1074. [Google Scholar] [CrossRef] [PubMed]
  17. Umapathy, K.; Krishnan, S. Modified local discriminant bases algorithm and its application in analysis of human knee joint vibration signals. IEEE Trans. Biomed. Eng. 2006, 53, 517–523. [Google Scholar] [CrossRef] [PubMed]
  18. Cai, S.X.; Yang, S.S.; Zheng, F.; Lu, M.; Wu, Y.F.; Krishnan, S. Knee joint vibration signal analysis with matching pursuit decomposition and dynamic weighted classifier fusion. Comput. Math. Methods Med. 2013, 2013, 904267:1–904267:11. [Google Scholar] [CrossRef] [PubMed]
  19. Cai, S.X.; Wu, Y.F.; Xiang, N.; Zhong, Z.T.; He, J.; Shi, L.; Xu, F. Detrending Knee Joint Vibration Signals with a Cascade Moving Average Filter. In Proceedings of the 34th Annual International Conference of IEEE Engineering in Medicine and Biology Society (EMBC 2012), San Diego, CA, USA, 28 August–1 September 2012; pp. 4357–4360.
  20. Wu, Y.F.; Cai, S.X.; Lu, M.; Yang, S.S.; Zheng, F.; Xiang, N.; He, J.; Zhong, Z.T. Noise cancellation in knee joint vibration signals using a time-delay neural filter and signal power error minimization method. J. Converg. Inf. Technol. 2013, 8, 912–919. [Google Scholar]
  21. Rangayyan, R.M. Biomedical Signal Analysis: A Case-Study Approach; IEEE and Wiley: New York, NY, USA, 2002. [Google Scholar]
  22. Parzen, E. On estimation of a probability density function and mode. Ann. Math. Stat. 1962, 33, 1065–1076. [Google Scholar] [CrossRef]
  23. Xiang, N.; Cai, S.X.; Yang, S.S.; Zhong, Z.T.; Zheng, F.; He, J.; Wu, Y.F. Statistical analysis of gait maturation in children using nonparametric probability density function modeling. Entropy 2013, 15, 753–766. [Google Scholar] [CrossRef]
  24. Fisher, R.A. The use of multiple measurements in taxonomic problems. Ann. Eugen. 1936, 7, 179–188. [Google Scholar] [CrossRef]
  25. Jain, A.K.; Duin, R.P.W.; Mao, J.C. Statistical pattern recognition: A review. IEEE Trans. Pattern Anal. Mach. Intell. 2000, 22, 4–37. [Google Scholar] [CrossRef]
  26. Martinez, A.M.; Kak, A.C. PCA versus LDA. IEEE Trans. Pattern Anal. Mach. Intell. 2001, 23, 228–233. [Google Scholar] [CrossRef]
  27. Duda, R.O.; Hart, P.E.; Stork, D.G. Pattern Classification, 2nd ed.; Wiley: New York, NY, USA, 2001. [Google Scholar]
  28. Vapnik, V.N. Statistical Learning Theory; Wiley: New York, NY, USA, 1998. [Google Scholar]
  29. Cortes, C.; Vapnik, V.N. Support-vector networks. Mach. Learn. 1995, 20, 273–297. [Google Scholar] [CrossRef]
  30. Suykens, J.A.K.; van Gestel, T.; de Brabanter, J.; de Moor, B.; Vandewalle, J. Least Squares Support Vector Machines; World Scientific Publishing: Singapore, 2002. [Google Scholar]

