Tsallis Mutual Information for Document Classification


Abstract
:
1. Introduction
2. Related Work
2.1. Information-Theoretic Measures
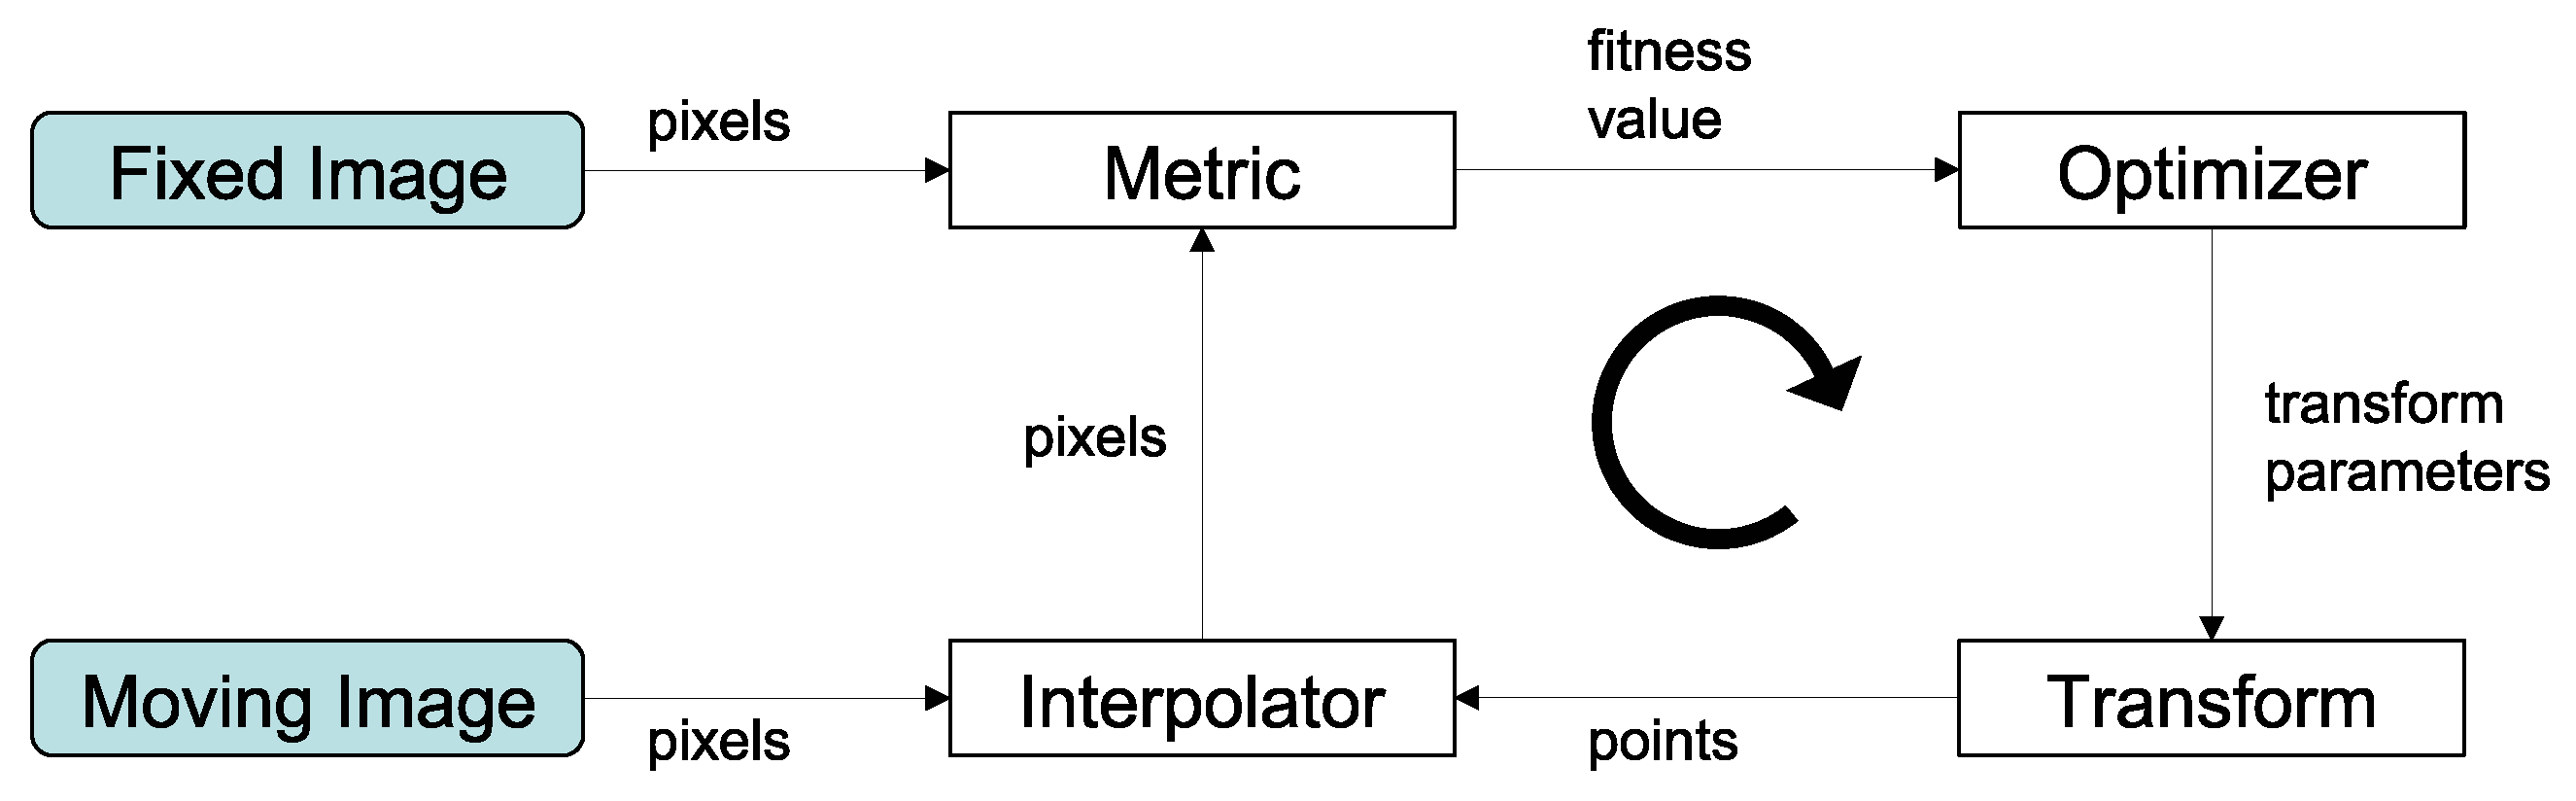
2.2. Image Registration
2.3. Document Image Similarity
3. Generalized Mutual Information
3.1. Mutual Information
3.2. Mutual Entropy
3.3. Jensen–Tsallis Information
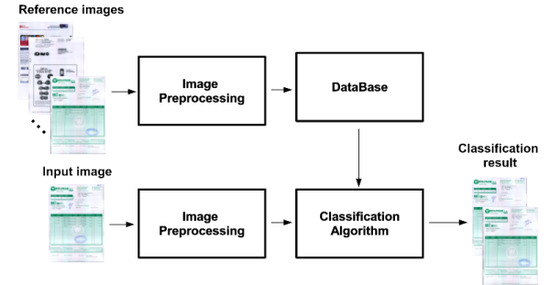
4. Overview

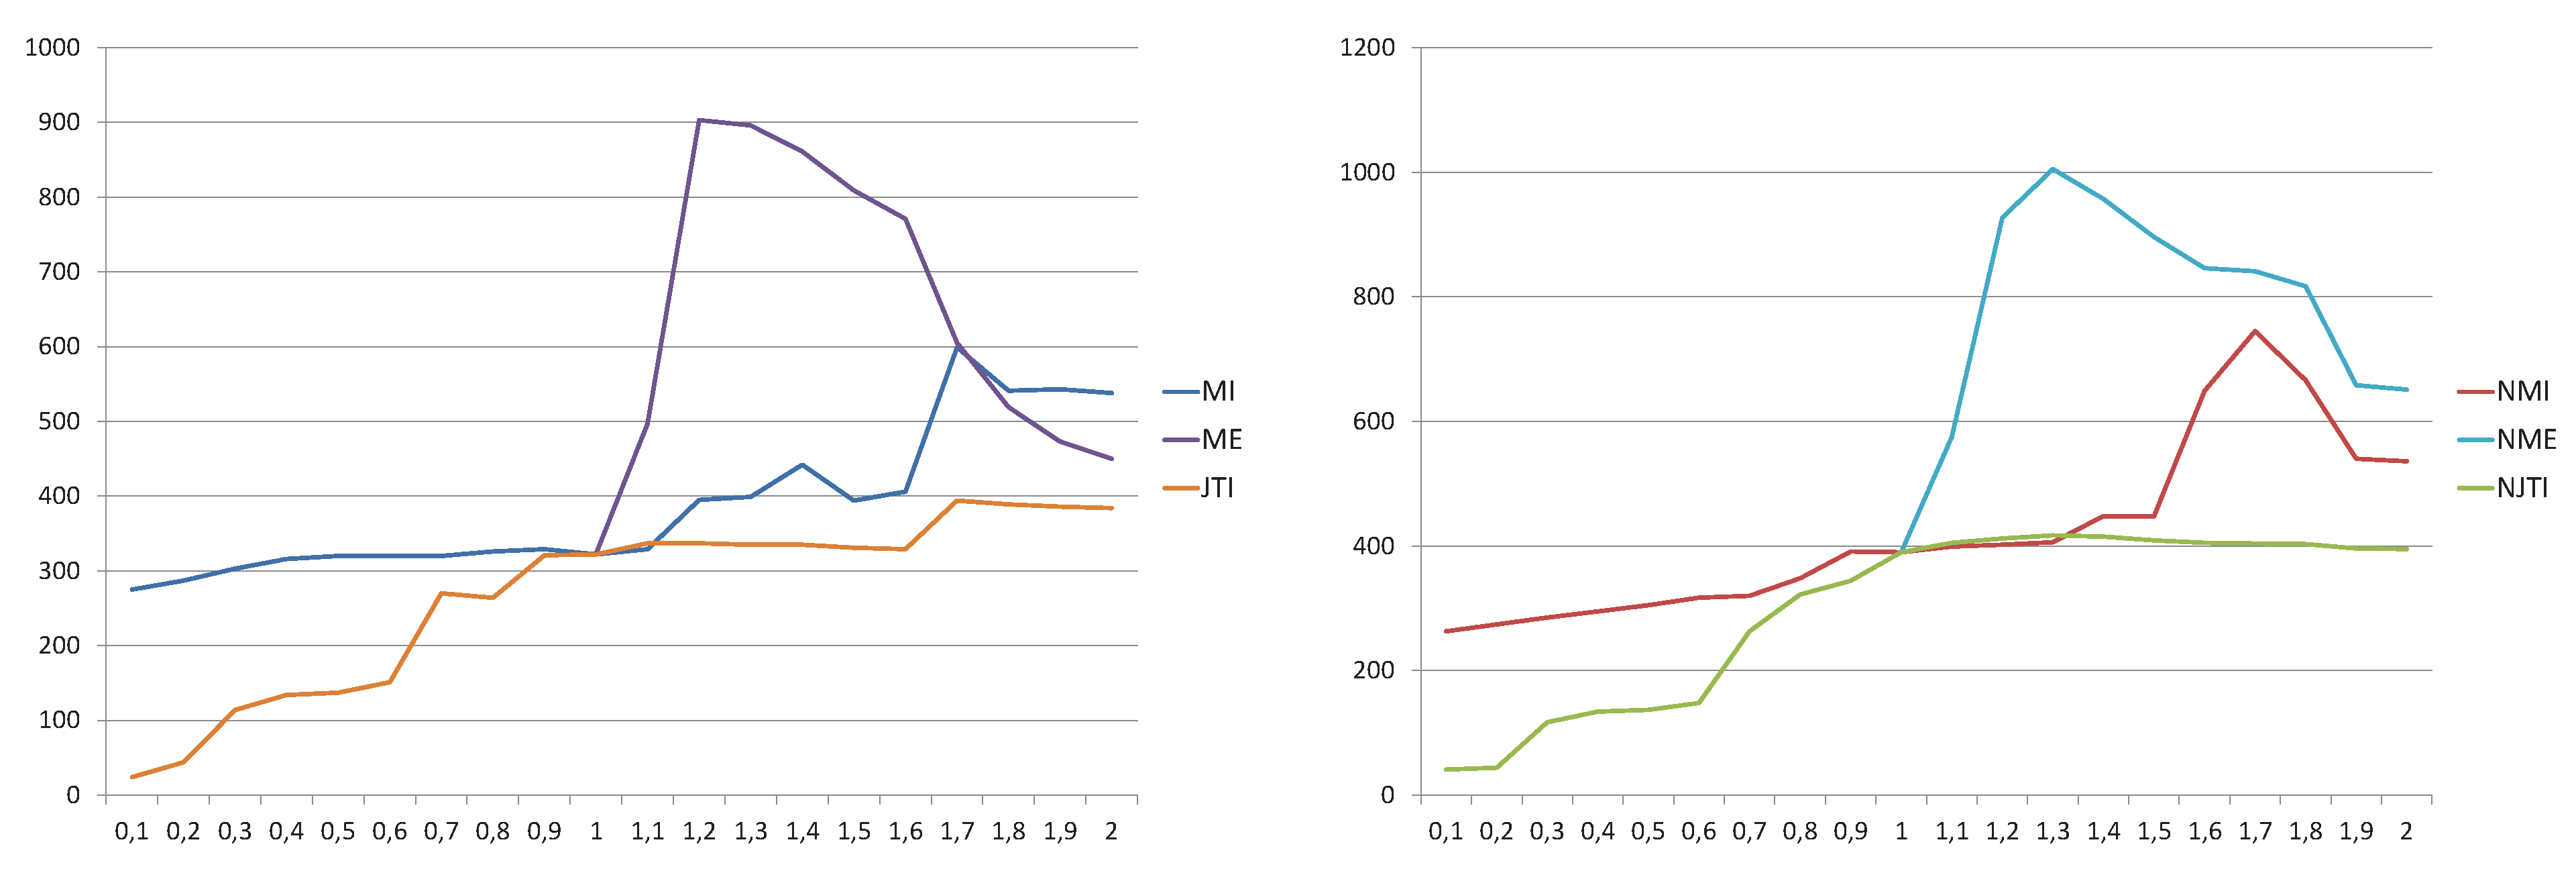
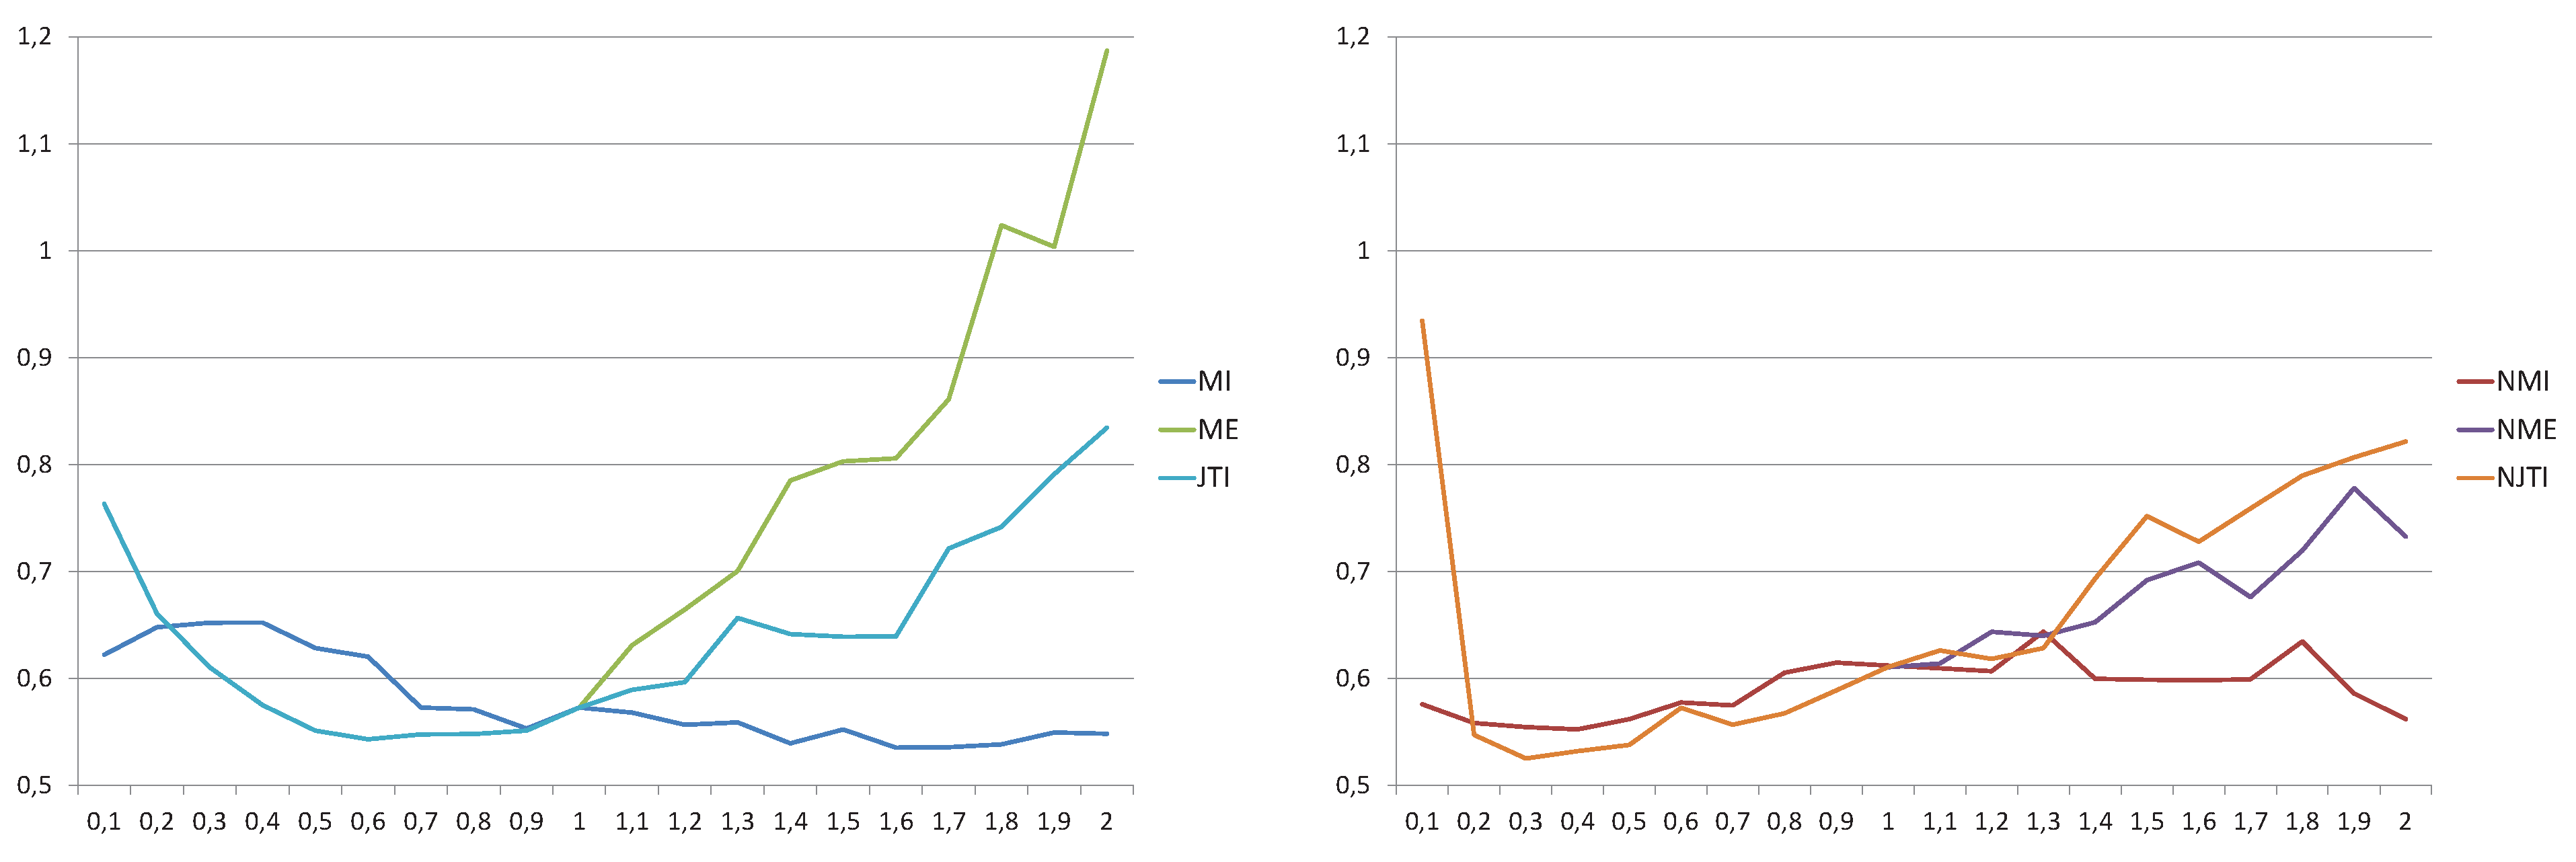
5. Results and Discussion

| α values | ||||||||||||
|---|---|---|---|---|---|---|---|---|---|---|---|---|
| 0.2 | 96.84 | (1.67) | 92.63 | (1.29) | 71.58 | (6.26) | 69.47 | (9.00) | ||||
| 0.4 | 98.95 | (2.00) | 100.0 | (0.00) | 80.00 | (2.58) | 81.05 | (3.39) | ||||
| 0.6 | 98.95 | (1.00) | 100.0 | (0.00) | 90.53 | (1.67) | 89.47 | (1.30) | ||||
| 0.8 | 98.95 | (1.00) | 100.0 | (0.00) | 94.74 | (1.40) | 94.74 | (1.00) | ||||
| 1.0 | 98.95 | (2.00) | 100.0 | (0.00) | 98.95 | (2.00) | 100.0 | (0.00) | 98.95 | (2.00) | 100.0 | (0.00) |
| 1.2 | 98.95 | (2.00) | 100.0 | (0.00) | 87.37 | (2.58) | 100.0 | (0.00) | 97.89 | (1.00) | 100.0 | (0.00) |
| 1.4 | 97.89 | (1.50) | 97.89 | (1.00) | 78.95 | (6.40) | 100.0 | (0.00) | 97.89 | (1.50) | 100.0 | (0.00) |
| 1.6 | 94.74 | (1.40) | 94.74 | (1.00) | 72.63 | (8.27) | 97.89 | (1.50) | 96.84 | (1.33) | 97.89 | (1.00) |
| 1.8 | 89.47 | (2.10) | 90.53 | (1.56) | 67.37 | (9.65) | 93.68 | (2.50) | 96.84 | (1.33) | 97.89 | (1.00) |
| 2.0 | 87.37 | (2.33) | 86.32 | (2.15) | 63.16 | (10.66) | 91.58 | (4.86) | 96.84 | (1.33) | 97.89 | (1.00) |
| 2.2 | 75.79 | (2.13) | 77.89 | (2.10) | 54.74 | (10.23) | 88.42 | (6.64) | 96.84 | (1.33) | 97.89 | (1.00) |
| 2.4 | 67.37 | (2.61) | 70.53 | (2.50) | 52.63 | (10.78) | 86.32 | (8.31) | 96.84 | (1.33) | 97.89 | (1.00) |
| 2.6 | 65.26 | (3.06) | 66.32 | (2.97) | 46.32 | (10.55) | 85.26 | (9.50) | 96.84 | (1.33) | 97.89 | (1.00) |
| 2.8 | 64.21 | (3.50) | 64.21 | (3.38) | 42.11 | (10.60) | 81.05 | (8.67) | 96.84 | (1.33) | 97.89 | (1.00) |
| 3.0 | 63.16 | (3.80) | 64.21 | (3.79) | 38.95 | (10.93) | 77.89 | (8.67) | 97.89 | (1.50) | 100.0 | (0.00) |
6. Conclusions
Acknowledgements
References
- Peng, H.; Long, F.; Chi, Z. Document image recognition based on template matching of component block projections. IEEE Trans. Pattern Anal. Mach. Intell. 2003, 25, 1188–1192. [Google Scholar] [CrossRef]
- Lopresti, D.P. String techniques for detecting duplicates in document databases. IJDAR 2000, 2, 186–199. [Google Scholar] [CrossRef]
- Tseng, L.Y.; Chen, R.C. The Recognition of Form Documents Based on Three Types of Line Segments. In Proceedings of the 4th International Conference on Document Analysis and Recognition, ICDAR’97, Ulm, Germany, 18–20 August 1997; pp. 71–75.
- Hu, J.; Kashi, R.S.; Wilfong, G.T. Document Image Layout Comparison and Classification. In Proceedings of the Fifth International Conference on Document Analysis and Recognition, ICDAR’99, Bangalore, India, 20–22 September 1999; pp. 285–288.
- Shin, C.; Doermann, D.S.; Rosenfeld, A. Classification of document pages using structure-based features. IJDAR 2001, 3, 232–247. [Google Scholar] [CrossRef]
- Hajnal, J.; Hawkes, D.; Hill, D. Medical Image Registration; CRC Press Inc.: Boca Raton, FL, USA, 2001. [Google Scholar]
- Portes de Albuquerque, M.; Esquef, I.; Gesualdi Mello, A.; Portes de Albuquerque, M. Image thresholding using Tsallis entropy. Pattern Recognit. Lett. 2004, 25, 1059–1065. [Google Scholar] [CrossRef]
- Cover, T.M.; Thomas, J. Elements of Information Theory; John Wiley and Sons Inc.: Hoboken, NJ, USA, 1991. [Google Scholar]
- Yeung, R.W. Information Theory and Network Coding; Springer: Berlin, Heidelberg, Germany, 2008. [Google Scholar]
- Burbea, J.; Rao, C.R. On the convexity of some divergence measures based on entropy functions. IEEE Trans. Inf. Theory 1982, 28, 489–495. [Google Scholar] [CrossRef]
- Tsallis, C. Possible generalization of Boltzmann-Gibbs statistics. J. Stat. Phys. 1988, 52, 479–487. [Google Scholar] [CrossRef]
- Hill, D.L.G.; Batchelor, P.G.; Holden, M.; Hawkes, D.J. Medical image registration. Phys. Med. Biol. 2001, 46, R1–R45. [Google Scholar] [CrossRef] [PubMed]
- Maes, F.; Collignon, A.; Vandermeulen, D.; Marchal, G.; Suetens, P. Multimodality image registration by maximization of mutual information. IEEE Trans. Med. Imaging 1997, 16, 187–198. [Google Scholar] [CrossRef] [PubMed]
- Viola, P.A. Alignment by Maximization of Mutual Information. PhD thesis, MIT Artificial Intelligence Laboratory (TR 1548), Cambridge, MA, USA, 1995. [Google Scholar]
- Studholme, C. Measures of 3D Medical Image Alignment. PhD thesis, Computational Imaging Science Group, Division of Radiological Sciences, United Medical and Dental school’s of Guy’s and St Thomas’s Hospitals, University of London, London, UK, 1997. [Google Scholar]
- Wachowiak, M.P.; Smolikova, R.; Tourassi, G.D.; Elmaghraby, A.S. Similarity Metrics Based on Non-additive Entropies for 2D-3D Multimodal Biomedical Image Registration. In Proceedings of SPIE Medical Imaging 2003: Image Processing, San Diego, CA, USA, 15 May 2003; Volume 5032, pp. 1090–1100.
- Bardera, A.; Feixas, M.; Boada, I. Normalized Similarity Measures for Medical Image Registration. In Proceedings of Medical Imaging SPIE 2004: Image Processing, San Diego, CA, USA, 12 May 2004; Volume 5370, pp. 108–118.
- Mohamed, W.; Ben Hamza, A. Nonextensive Entropic Image Registration. In Image Analysis and Recognition; Springer: Berlin, Heidelberg, Germany, 2009; Volume 5627, pp. 116–125. [Google Scholar]
- Khader, M.; Ben Hamza, A.; Bhattacharya, P. Multimodality Image Alignment Using Information-Theoretic Approach. In Image Analysis and Recognition; Springer: Berlin, Heidelberg, Germany, 2010; Volume 6112, pp. 30–39. [Google Scholar]
- Hamza, H.; Belaïd, Y.; Belaïd, A.; Chaudhuri, B.B. An End-to-End Administrative Document Analysis System. In Proceedings of the 2008 The 8th IAPR International Workshop on Document Analysis Systems, DAS’08, Nara, Japan, 16–19 September 2008; pp. 175–182.
- Chen, N.; Blostein, D. A survey of document image classification: Problem statement, classifier architecture and performance evaluation. Int. J. Doc. Anal. Recognit. 2007, 10, 1–16. [Google Scholar] [CrossRef]
- Trier, Ø.D.; Jain, A.K.; Taxt, T. Feature extraction methods for character recognition—A survey. Pattern Recognit. 1996, 29, 641–662. [Google Scholar] [CrossRef]
- Appiani, E.; Cesarini, F.; Colla, A.M.; Diligenti, M.; Gori, M.; Marinai, S.; Soda, G. Automatic document classification and indexing in high-volume applications. IJDAR 2001, 4, 69–83. [Google Scholar] [CrossRef]
- Shin, C.; Doermann, D.S. Document Image Retrieval Based on Layout Structural Similarity. In Proceedings of the 2006 International Conference on Image Processing, Computer Vision and Pattern Recognition, IPCV’06, Las Vegas, NV, USA, 26–29 June 2006; pp. 606–612.
- Gupta, M.D.; Sarkar, P. A Shared Parts Model for Document Image Recognition. In Proceedings of the 9th International Conference on Document Analysis and Recognition, ICDAR’07, Curitiba, Brazil, 23–26 September 2007; Volume 2, pp. 1163–1172.
- Costa e Silva, A.; Jorge, A.M.; Torgo, L. Design of an end-to-end method to extract information from tables. IJDAR 2006, 8, 144–171. [Google Scholar] [CrossRef]
- Alippi, C.; Pessina, F.; Roveri, M. An Adaptive System for Automatic Invoice-Documents Classification. In Proceedings of the IEEE International Conference on Image Processing, ICIP’05, Genova, Italy, 11–14 September 2005; Volume 2, pp. II-526–II-529.
- Arai, H.; Odaka, K. Form Processing based on Background Region Analysis. In Proceedings of the 4th International Conference on Document Analysis and Recognition, ICDAR’97, Ulm, Germany, 18–20 August 1997; pp. 164–169.
- Cesarini, F.; Gori, M.; Marinai, S.; Soda, G. INFORMys: A flexible invoice-like form-reader system. IEEE Trans. Pattern Anal. Mach. Intell. 1998, 20, 730–745. [Google Scholar] [CrossRef]
- Tang, Y.Y.; Liu, J. Information Acquisition and Storage of Forms in Document Processing. In Proceedings of the 4th International Conference on Document Analysis and Recognition, ICDAR’97, Ulm, Germany, 18–20 August 1997; pp. 170–174.
- Duygulu, P.; Atalay, V. A hierarchical representation of form documents for identification and retrieval. IJDAR 2002, 5, 17–27. [Google Scholar] [CrossRef]
- Behera, A.; Lalanne, D.; Ingold, R. Combining color and layout features for the identification of low-resolution documents. Int. J. Signal Process. 2005, 2, 7–14. [Google Scholar]
- Tsallis, C. Generalized entropy-based criterion for consistent testing. Phys. Rev. E 1998, 58, 479–487. [Google Scholar] [CrossRef]
- Taneja, I.J. Bivariate measures of type α and their applications. Tamkang J. Math. 1988, 19, 63–74. [Google Scholar]
- Furuichi, S. Information theoretical properties of Tsallis entropies. J. Math. Phys. 2006, 47, 023302. [Google Scholar] [CrossRef]
- Ben Hamza, A. Nonextensive information-theoretic measure for image edge detection. J. Electron. Imaging 2006, 15, 13011.1–13011.8. [Google Scholar] [CrossRef]
- Gatos, B.; Papamarkos, N.; Chamzas, C. Skew detection and text line position determination in digitized documents. Pattern Recognit. 1997, 30, 1505–1519. [Google Scholar] [CrossRef]
- Capek, M.; Mroz, L.; Wegenkittl, R. Robust and Fast Medical Registration of 3D-Multi-Modality Data Sets. In Proceedings of Medicon 2001, Pula, Croatia, 12–15 June 2001; pp. 515–518.
- Press, W.; Teulokolsky, S.; Vetterling, W.; Flannery, B. Numerical Recipes in C; Cambridge University Press: Cambridge, UK, 1992. [Google Scholar]
© 2011 by the authors; licensee MDPI, Basel, Switzerland. This article is an open access article distributed under the terms and conditions of the Creative Commons Attribution license (http://creativecommons.org/licenses/by/3.0/).
Share and Cite
Vila, M.; Bardera, A.; Feixas, M.; Sbert, M. Tsallis Mutual Information for Document Classification. Entropy 2011, 13, 1694-1707. https://doi.org/10.3390/e13091694
Vila M, Bardera A, Feixas M, Sbert M. Tsallis Mutual Information for Document Classification. Entropy. 2011; 13(9):1694-1707. https://doi.org/10.3390/e13091694
Chicago/Turabian StyleVila, Màrius, Anton Bardera, Miquel Feixas, and Mateu Sbert. 2011. "Tsallis Mutual Information for Document Classification" Entropy 13, no. 9: 1694-1707. https://doi.org/10.3390/e13091694
APA StyleVila, M., Bardera, A., Feixas, M., & Sbert, M. (2011). Tsallis Mutual Information for Document Classification. Entropy, 13(9), 1694-1707. https://doi.org/10.3390/e13091694