A Risk Profile for Information Fusion Algorithms

1. Introduction
2. Background
2.1. Alpha-Beta Fusion Algorithm
2.2. Modeling Risk with Coupled-Surprisal
 led to an entropy function
 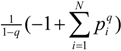 which is non-additive for independent systems Hq(AB) = Hq(A) + Hq(B) + (1 − q)Hq(A)Hq(B). The maximum entropy distribution for non-additive entropy constrained by the deformed probabilities is referred to as a q-exponential or q-Gaussian
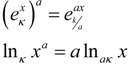
 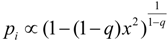 . This methodology has been shown to provide an effective model of the origin of power-law phenomena in a variety of complex system [26] such as turbulence, dynamics of solar wind, stock market fluctuations, and biological processes to name just a few. Further theoretical evidence including generalized central limit theorems [15,27], probabilistic models [28,29,30], and models of statistical fluctuations [31,32] have demonstrated a foundational justification for this approach. Nevertheless, a direct physical interpretation of the symbol q has remained elusive. One of the difficulties is that the original convention based on raising probabilities to a power, results in an asymmetry between the mathematical model and the physical principal of non-additivity. By directly modeling the degree of non-additivity as κ = 1 − q other physical interpretations are more direct and the mathematical symmetry simplifies the development of consistent models [6,10,33,34]. Kappa is choosen as a symbol because of its usage for coupling coefficients, such as the spring constant and its relation to curvature in geometry. The definition used here is related to Kaniadakis’ deformed logarithm
 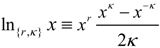 by κcoupling = 2κKaniadakis with r = 2κKaniadakis [35,36].
 , whose name implies that the deformation does not encode new physical information. However, considering this function in relation to the degree of non-additivity, makes evident that it is the probability of a coupled state, which we will refer to as the ‘coupled-probability’:
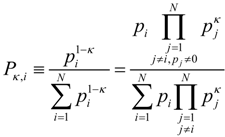
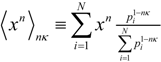

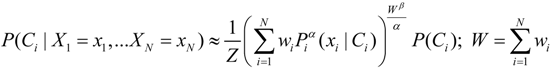
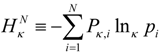
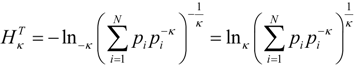
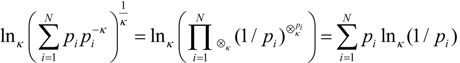
 . This form is typically used to define the generalized information form as in [10,22,23,24]. However, the alternative using the coupled-probability for averaging
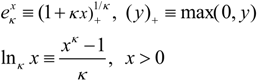
  and an information metric of −lnκ(pi), which is shown in Figure 1, has some advantages with regard to a consistent interpretation of κ specifying the negative risk or optimism. Positive values of κ lower the information cost, which is equivalent to a reduction in risk or an optimistic belief. This domain has a finite cost for probability zero and is associated with the maximum entropy distributions with compact-support domain, which have a finite domain of non-zero probabilities. The cost of information for negative values of κ approaches infinity faster than the Shannon surprisal. This domain is associated with the heavy-tail maximum entropy distributions, and is consistent with the higher cost of information selecting distributions which are more ‘robust’ in that they model a slower decay to states which can be ignored.
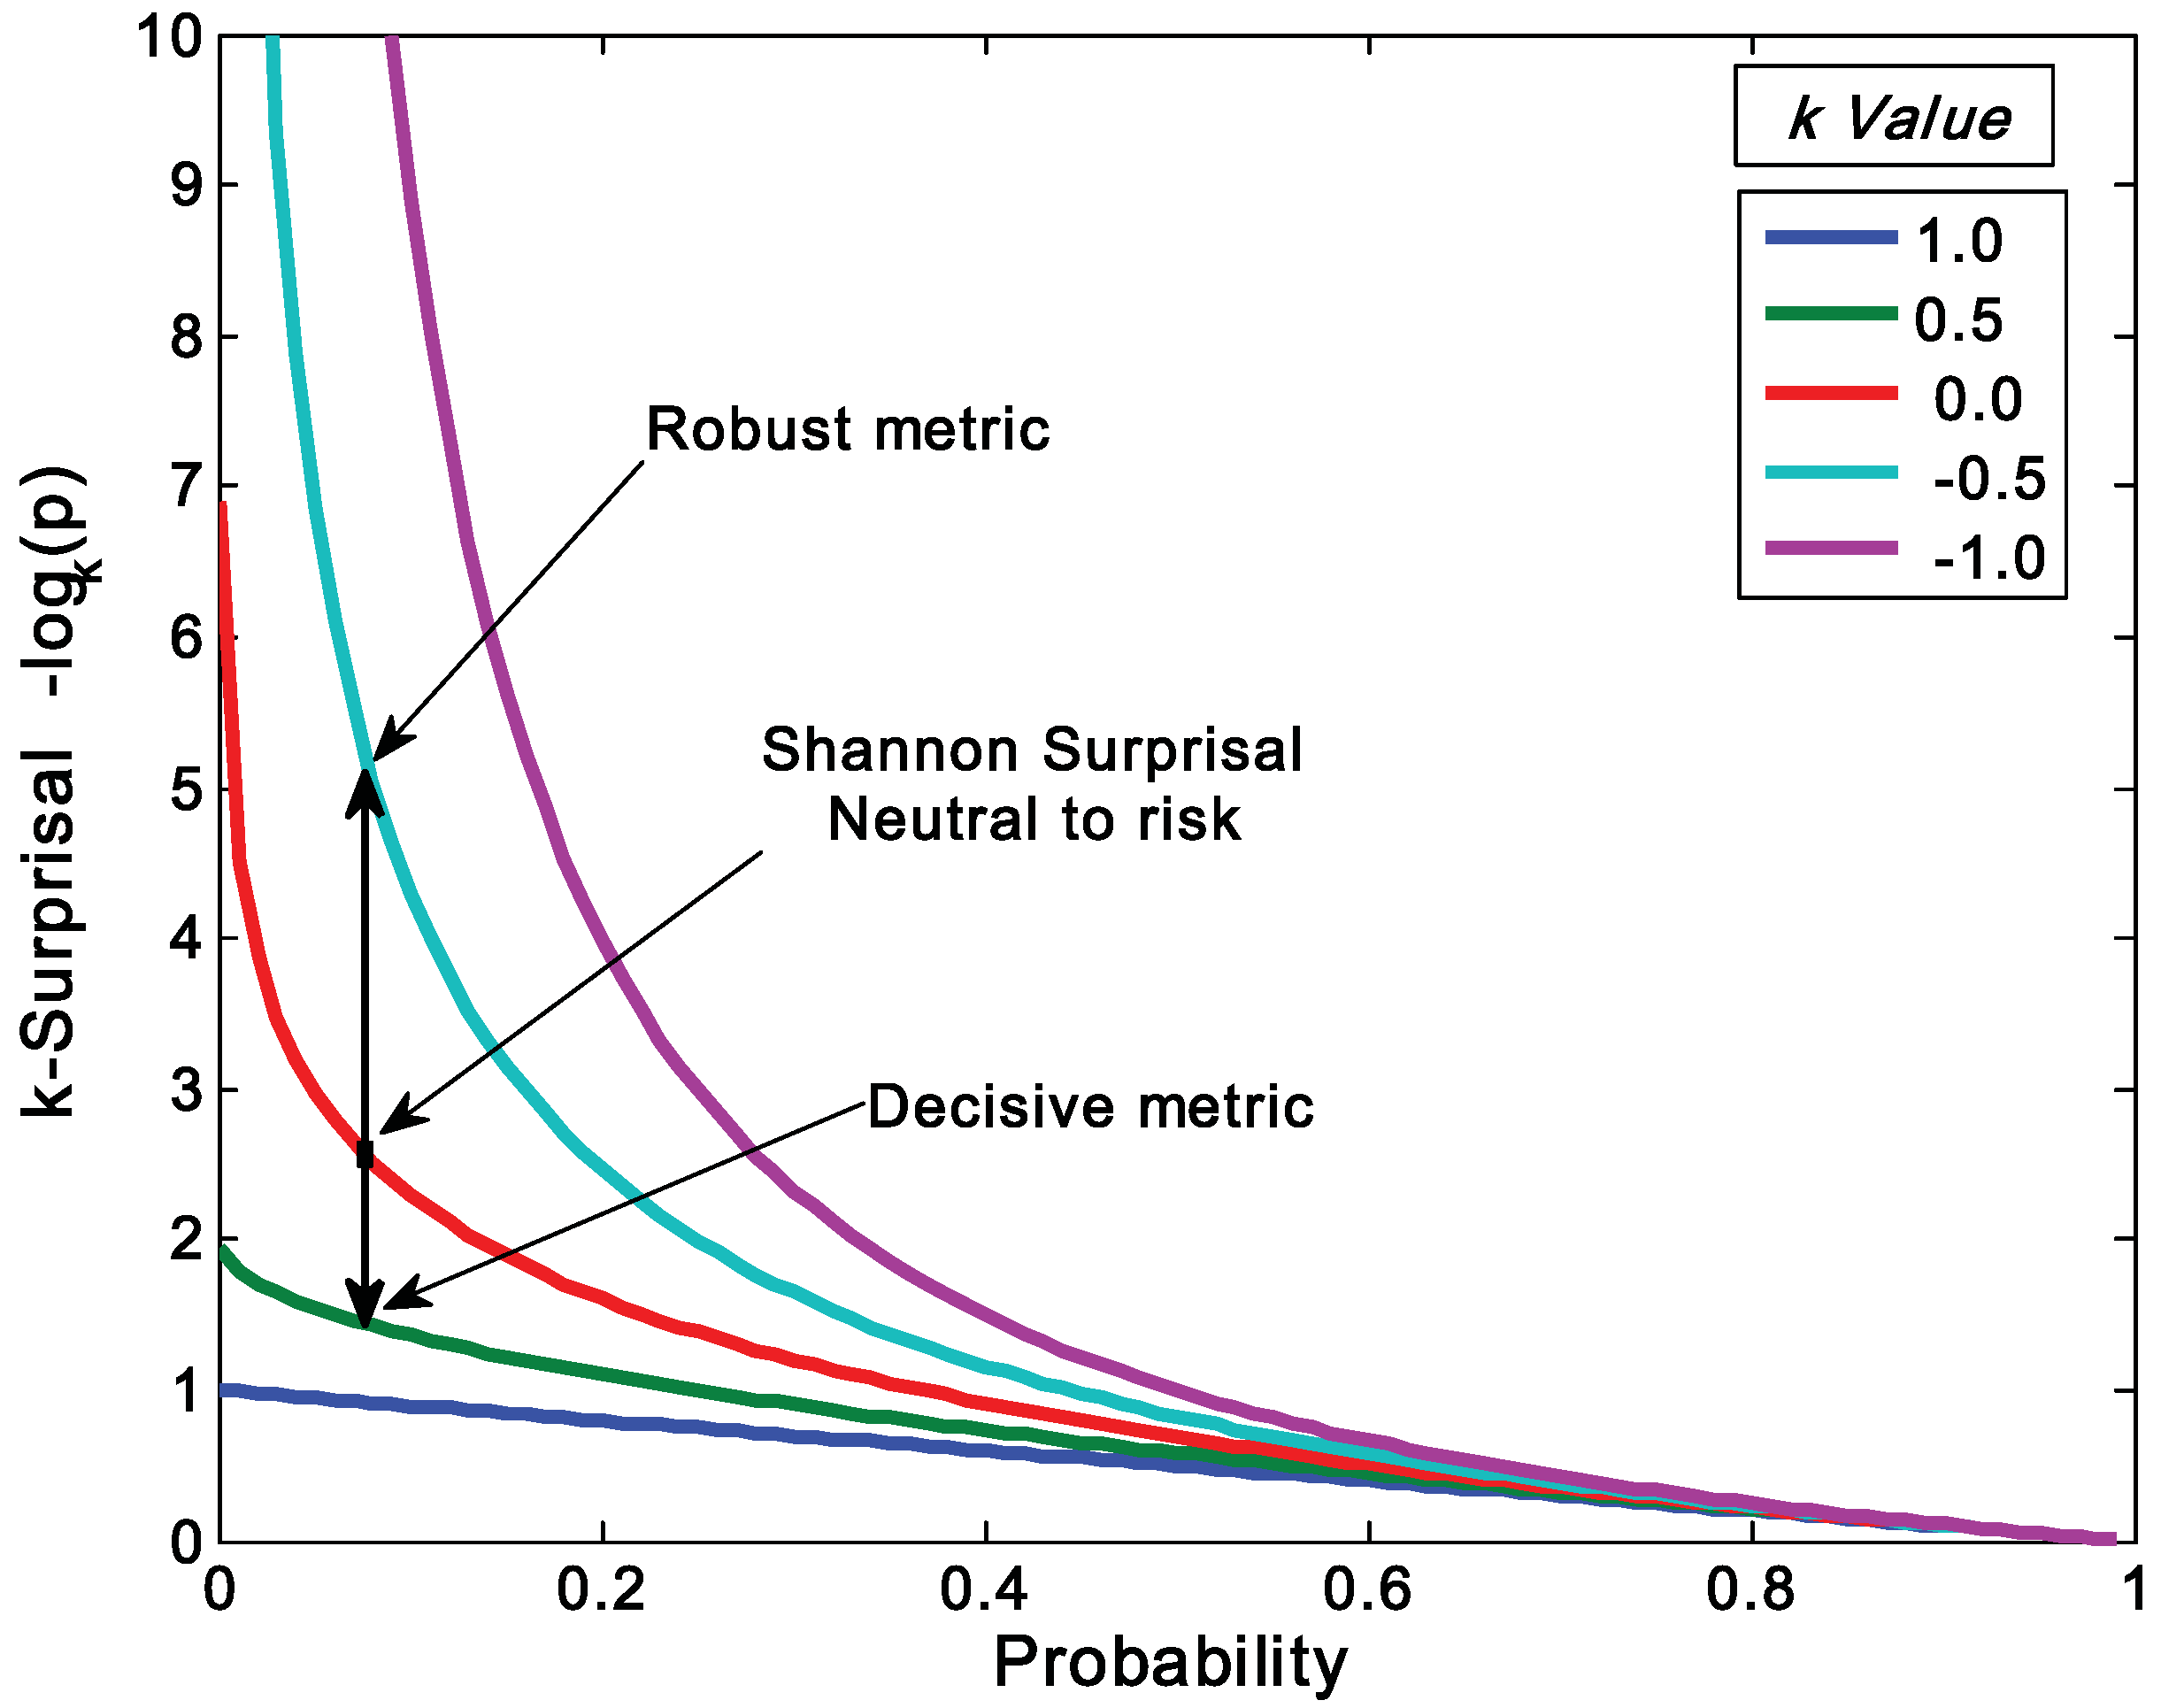
3. Relationship between Generalized Mean and Generalized Entropies

 :
:
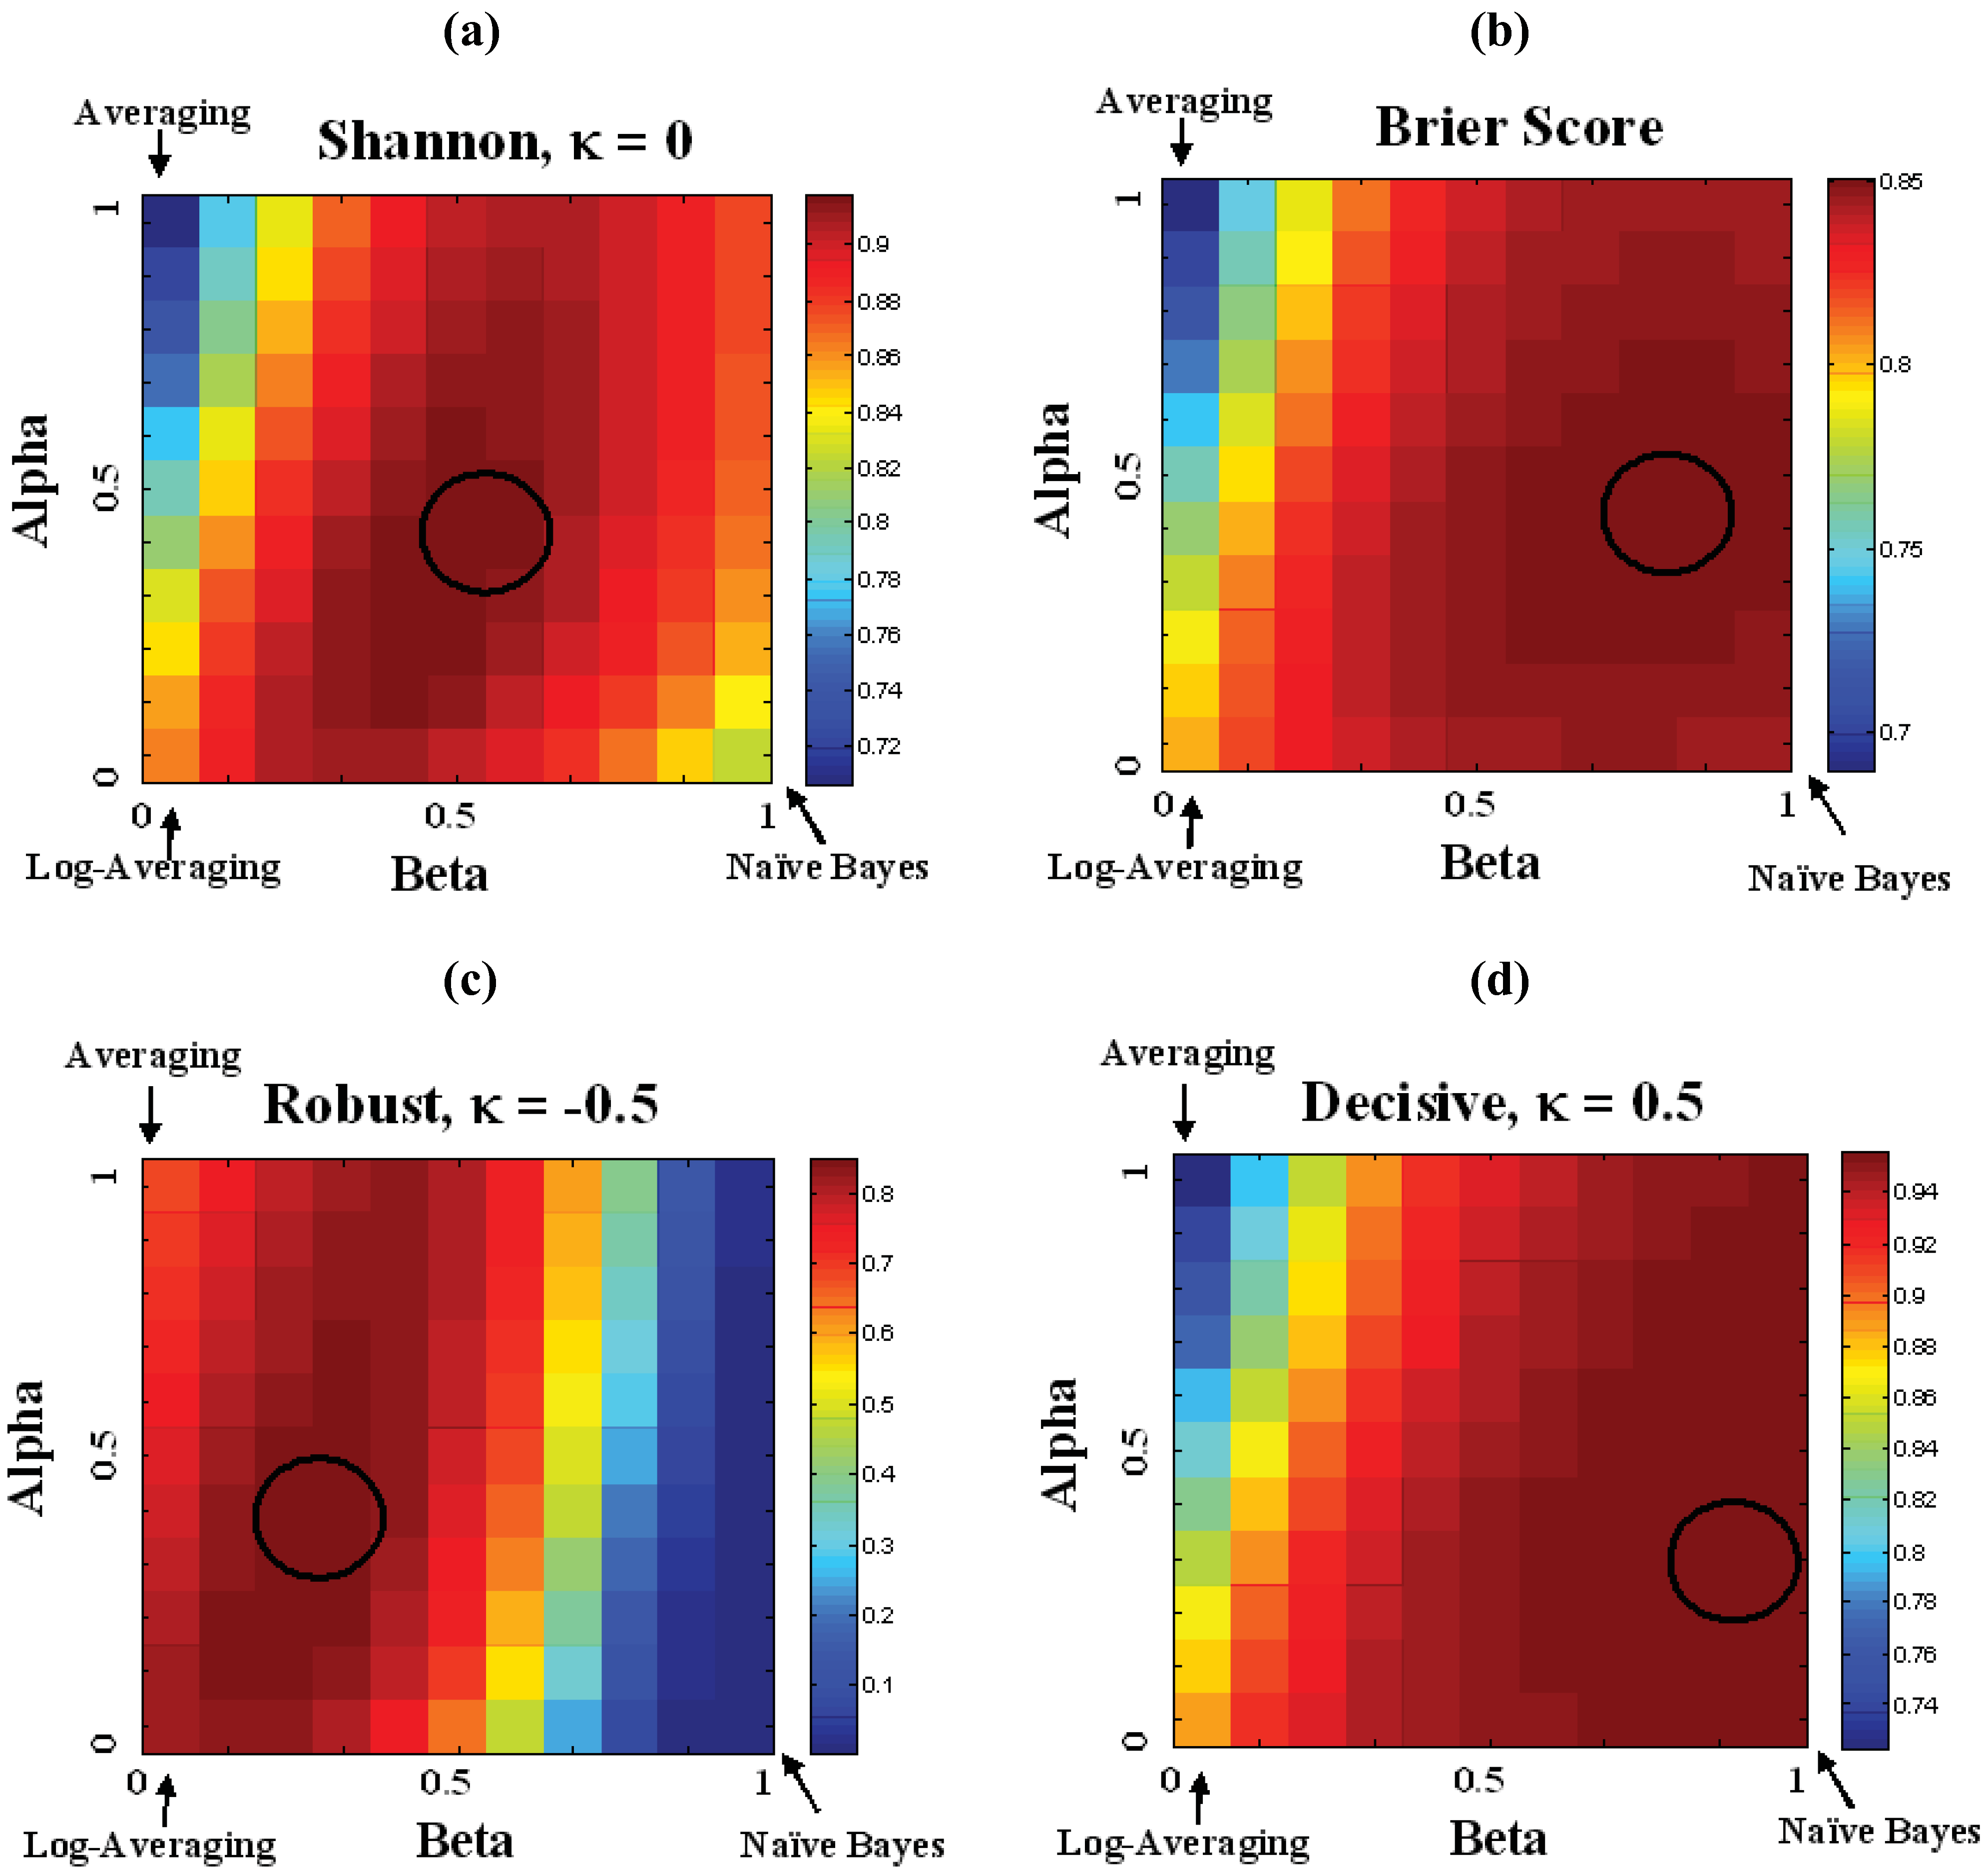
 and a portion which is the output confidence wβ−1 = 1 − κo. Thus the fusion method can be viewed as controlling the risk bias on the input, fusion, and output of the probabilities:
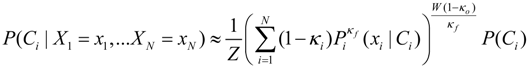
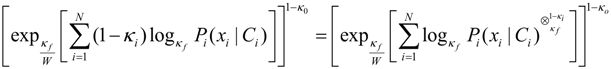
 which is the expression for the coupled-probability. Likewise, the output probability is modified by the coupled-probability term 1 − κo.
4. Application to Designing and Assessing a Fusion Algorithm

5. Conclusions
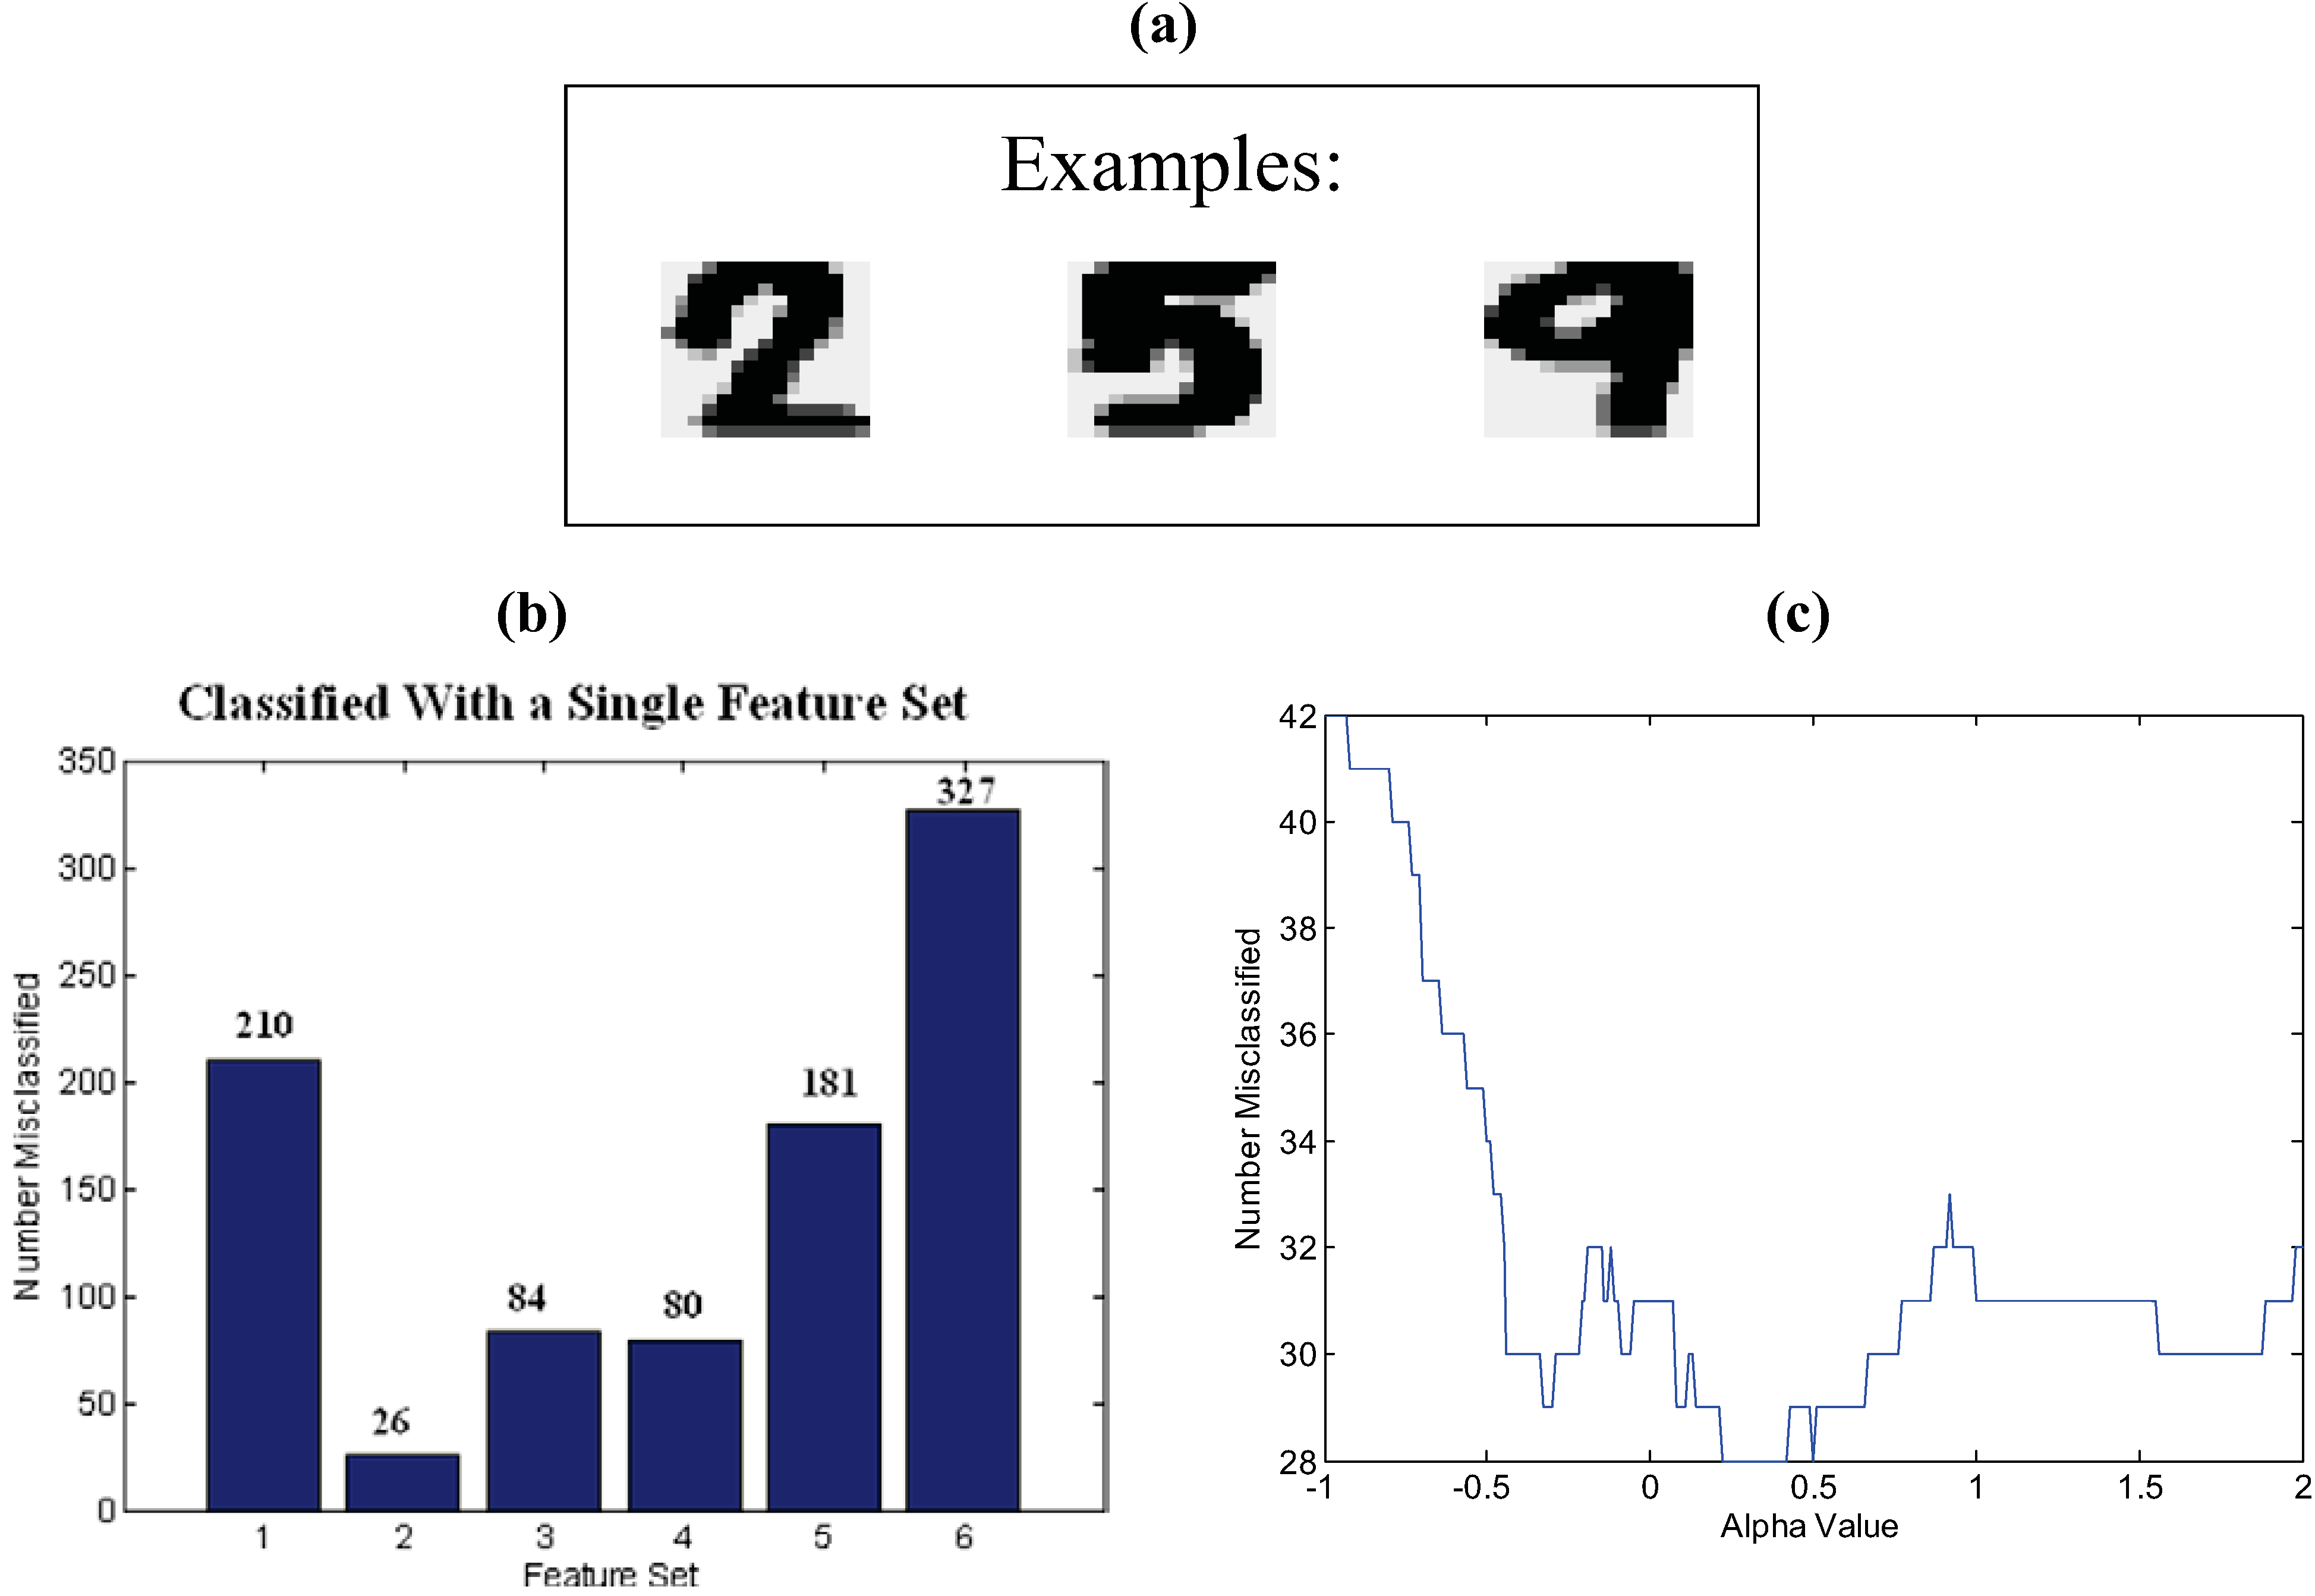
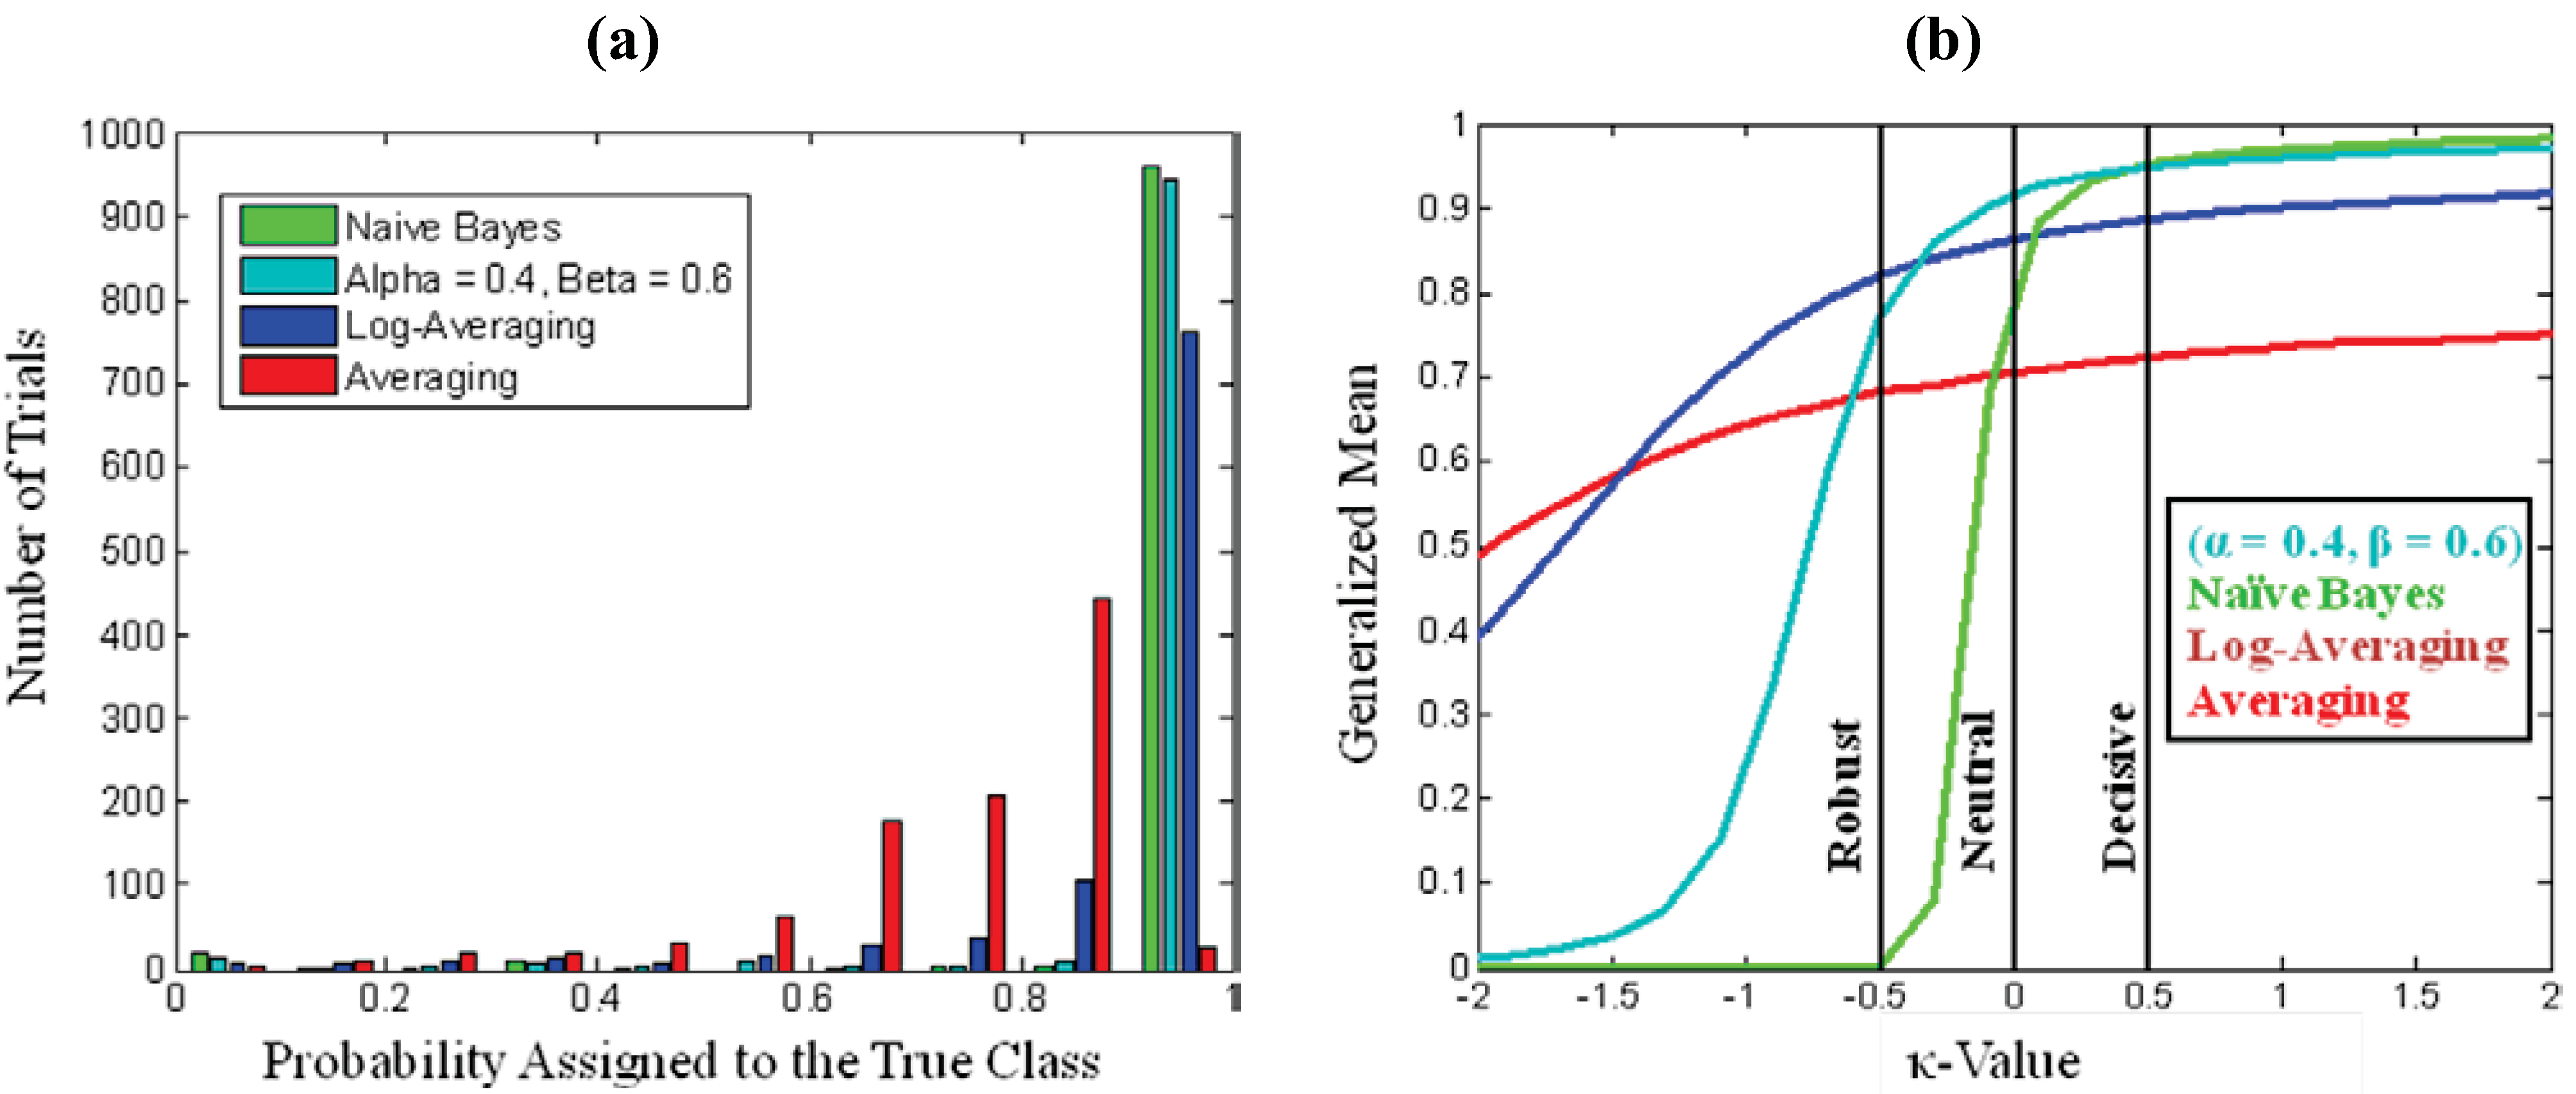
 . As a starting point for exploring applications of this metric, we define Decisive (κ = 0.5), Neutral or Accurate (κ = 0.0), and Robust (κ = −0.5) probability metrics. Together these metrics highlight the balance between decisiveness and robustness for a fusion algorithm to be effective.
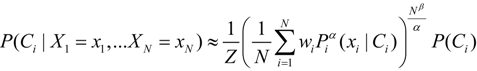
Acknowledgements
References
- Dawid, A.P. The geometry of proper scoring rules. Ann. Inst. Stat. Math. 2007, 59, 77–93. [Google Scholar] [CrossRef]
- Gneiting, T.; Raftery, A.E. Strictly proper scoring rules, prediction, and estimation. J. Am. Stat. Assoc. 2007, 102, 359–378. [Google Scholar] [CrossRef]
- Jose, V.; Nau, R.F.; Winkler, R.L. Scoring rules, generalized entropy, and utility maximization. Oper. Res. 2008, 56, 1146. [Google Scholar] [CrossRef]
- Jaynes, E.T. Probability Theory: The Logic of Science; Cambridge University Press: Cambridge, UK, 2003. [Google Scholar]
- Rosen, D.B. How good were those probability predictions? The expected recommendation loss (ERL) scoring rule. In Proceedings of the Thirteenth International Workshop on Maximum Entropy and Bayesian Methods; Heidbreder, G.R., Ed.; Kluwer Academic Pub.: Santa Barbara, CA, USA, 1993; p. 401. [Google Scholar]
- Wang, Q.A.; Nivanen, L.; Le Mehaute, A.; Pezeril, M. On the generalized entropy pseudoadditivity for complex systems. J. Phys. A 2002, 35, 7003–7007. [Google Scholar] [CrossRef]
- Furuichi, S.; Yanagi, K.; Kuriyama, K. Fundamental properties of Tsallis relative entropy. J. Math. Phys. 2004, 45, 4868. [Google Scholar] [CrossRef]
- Beck, C. Generalised information and entropy measures in physics. Cont. Phys. 2009, 50, 495–510. [Google Scholar] [CrossRef]
- Tsallis, C. Nonadditive entropy and nonextensive statistical mechanics-an overview after 20 years. Braz. J. Phys. 2009, 39, 337–356. [Google Scholar] [CrossRef]
- Nelson, K.P.; Umarov, S. Nonlinear statistical coupling. Phys. A 2010, 389, 2157–2163. [Google Scholar] [CrossRef]
- Borges, E.P. A possible deformed algebra and calculus inspired in nonextensive thermostatistics. Phys. A 2004, 340, 95–101. [Google Scholar] [CrossRef]
- Pennini, F.; Plastino, A.; Ferri, G.L. Fisher information, Borges operators, and q-calculus. Phys. A 2008, 387, 5778–5785. [Google Scholar] [CrossRef]
- Suyari, H.; Tsukada, M. Law of error in Tsallis statistics. IEEE Trans. Inf. Theory 2005, 51, 753–757. [Google Scholar] [CrossRef]
- Wada, T.; Suyari, H. κ-generalization of Gauss' law of error. Phys. Lett. A 2006, 348, 89–93. [Google Scholar] [CrossRef]
- Umarov, S.; Tsallis, C.; Steinberg, S. On a q-central limit theorem consistent with nonextensive statistical mechanics. Milan J. Math. 2008, 76, 307–328. [Google Scholar] [CrossRef]
- Kittler, J.; Hatef, M.; Duin, R.; Matas, J. On combining classifers. IEEE Trans. Patt. Anal. Mach. Intel. 1998, 20, 226. [Google Scholar] [CrossRef]
- Tax, D.; Van Breukelen, M.; Duin, R. Combining multiple classifiers by averaging or by multiplying? Patt. Recognit. 2000, 33, 1475–1485. [Google Scholar] [CrossRef]
- Kuncheva, L.I. Combining Pattern Classifiers: Methods and Algorithms; Wiley-Interscience: Hoboken, NJ, USA, 2004. [Google Scholar]
- Hero, A.O.; Ma, B.; Michel, O.; Gorman, J. Alpha-divergence for classification, indexing and retrieval. Technical Report CSPL-328, U. Mich., Communication and Signal Processing Laboratory, May 2011. [Google Scholar]
- Amari, S. Integration of stochastic models by minimizing α-divergence. Neural Comp. 2007, 19, 2780–2796. [Google Scholar] [CrossRef] [PubMed]
- Scannell, B.J.; McCann, C.; Nelson, K.P.; Tgavalekos, N.T. Fusion algorithm for the quantification of uncertainty in multi-look discrimination. In Presented at the 8th Annual U.S. Missile Defense Conference, Washington, DC, USA, 22–24 March 2010.
- Anteneodo, C.; Tsallis, C.; Martinez, A.S. Risk aversion in economic transactions. Europhys. Lett. 2002, 59, 635–641. [Google Scholar] [CrossRef]
- Anteneodo, C.; Tsallis, C. Risk aversion in financial decisions: A nonextensive approach. arXiv, 2003; arXiv:cond-mat/0306605v1. [Google Scholar]
- Topsoe, F. On truth, belief and knowledge. In ISIT’09, Proceedings of the 2009 IEEE International Symposium on Information Theory, Seoul, Korea, 28 June–3 July 2009; Volume 1, pp. 139–143.
- Tsallis, C. Possible generalization of Boltzmann-Gibbs statistics. J. Stat. Phys. 1988, 52, 479–487. [Google Scholar] [CrossRef]
- Gell-Mann, M.; Tsallis, C. Nonextensive Entropy: Interdisciplinary Applications; Oxford University Press: New York, NY, USA, 2004. [Google Scholar]
- Vignat, C.; Plastino, A. Central limit theorem and deformed exponentials. J. Phys. A 2007, 40, F969–F978. [Google Scholar] [CrossRef]
- Marsh, J.A.; Fuentes, M.A.; Moyano, L.G.; Tsallis, C. Influence of global correlations on central limit theorems and entropic extensivity. Phys. A 2006, 372, 183–202. [Google Scholar] [CrossRef]
- Moyano, L.G.; Tsallis, C.; Gell-Mann, M. Numerical indications of a q-generalised central limit theorem. Europhys. Lett. 2006, 73, 813. [Google Scholar] [CrossRef]
- Hanel, R.; Thurner, S.; Tsallis, C.C. Limit distributions of scale-invariant probabilistic models of correlated random variables with the q-Gaussian as an explicit example. Eur. Phys. J. B 2009, 72, 263–268. [Google Scholar] [CrossRef]
- Beck, C.; Cohen, E. Superstatistics. Phys. A 2003, 322, 267–275. [Google Scholar] [CrossRef]
- Wilk, G.; Wodarczyk, Z. Fluctuations, correlations and the nonextensivity. Phys. A 2007, 376, 279–288. [Google Scholar] [CrossRef]
- Nelson, K.P.; Umarov, S. The relationship between Tsallis statistics, the Fourier transform, and nonlinear coupling. arXiv, 2008; arXiv:0811.3777v1 [cs.IT]. [Google Scholar]
- Souto Martinez, A.; Silva González, R.; Lauri Espíndola, A. Generalized exponential function and discrete growth models. Phys. A 2009, 388, 2922–2930. [Google Scholar] [CrossRef]
- Kaniadakis, G.; Scarfone, A.M. A new one-parameter deformation of the exponential function. Phys. A 2002, 305, 69–75. [Google Scholar] [CrossRef]
- Kaniadakis, G.; Lissia, M.; Scarfone, A.M. Two-parameter deformations of logarithm, exponential, and entropy: A consistent framework for generalized statistical mechanics. Phys. Rev. E 2005, 71, 46128. [Google Scholar] [CrossRef]
- Tsallis, C.; Plastino, A.R.; Alvarez-Estrada, R.F. Escort mean values and the characterization of power-law-decaying probability densities. J. Math. Phys. 2009, 50, 043303. [Google Scholar] [CrossRef]
- Abe, S. Stability of Tsallis entropy and instabilities of Renyi and normalized Tsallis entropies: A basis for q-exponential distributions. Phys. Rev. E 2002, 66, 46134. [Google Scholar] [CrossRef]
- Oikonomou, T. Tsallis, Renyi and nonextensive Gaussian entropy derived from the respective multinomial coefficients. Phys. A 2007, 386, 119–134. [Google Scholar] [CrossRef]
- Machine Learning Repository. Available online: http://www.ics.uci.edu/~mlearn/MLRepository.html (accessed on 15 November 2010).
- Duin, R.; Tax, D. Experiments with classifier combining rules. In Multiple Classifier Systems; Springer: Berlin, Germany, 2000; Volume 1857, pp. 16–29. [Google Scholar]
- Shafer, G. A Mathematical Theory of Evidence; Princeton University Press: Princeton, NJ, USA, 1976. [Google Scholar]
© 2011 by the authors licensee MDPI, Basel, Switzerland. This article is an open access article distributed under the terms and conditions of the Creative Commons Attribution license ( http://creativecommons.org/licenses/by/4.0/).
Share and Cite
Nelson, K.P.; Scannell, B.J.; Landau, H. A Risk Profile for Information Fusion Algorithms. Entropy 2011, 13, 1518-1532. https://doi.org/10.3390/e13081518
Nelson KP, Scannell BJ, Landau H. A Risk Profile for Information Fusion Algorithms. Entropy. 2011; 13(8):1518-1532. https://doi.org/10.3390/e13081518
Chicago/Turabian StyleNelson, Kenric P., Brian J. Scannell, and Herbert Landau. 2011. "A Risk Profile for Information Fusion Algorithms" Entropy 13, no. 8: 1518-1532. https://doi.org/10.3390/e13081518
APA StyleNelson, K. P., Scannell, B. J., & Landau, H. (2011). A Risk Profile for Information Fusion Algorithms. Entropy, 13(8), 1518-1532. https://doi.org/10.3390/e13081518