Ecological Economic Evaluation Based on Emergy as Embodied Cosmic Exergy: A Historical Study for the Beijing Urban Ecosystem 1978–2004

Abstract
:1. Introduction
2. Methodology
2.1. General Introduction for Cosmic Emergy
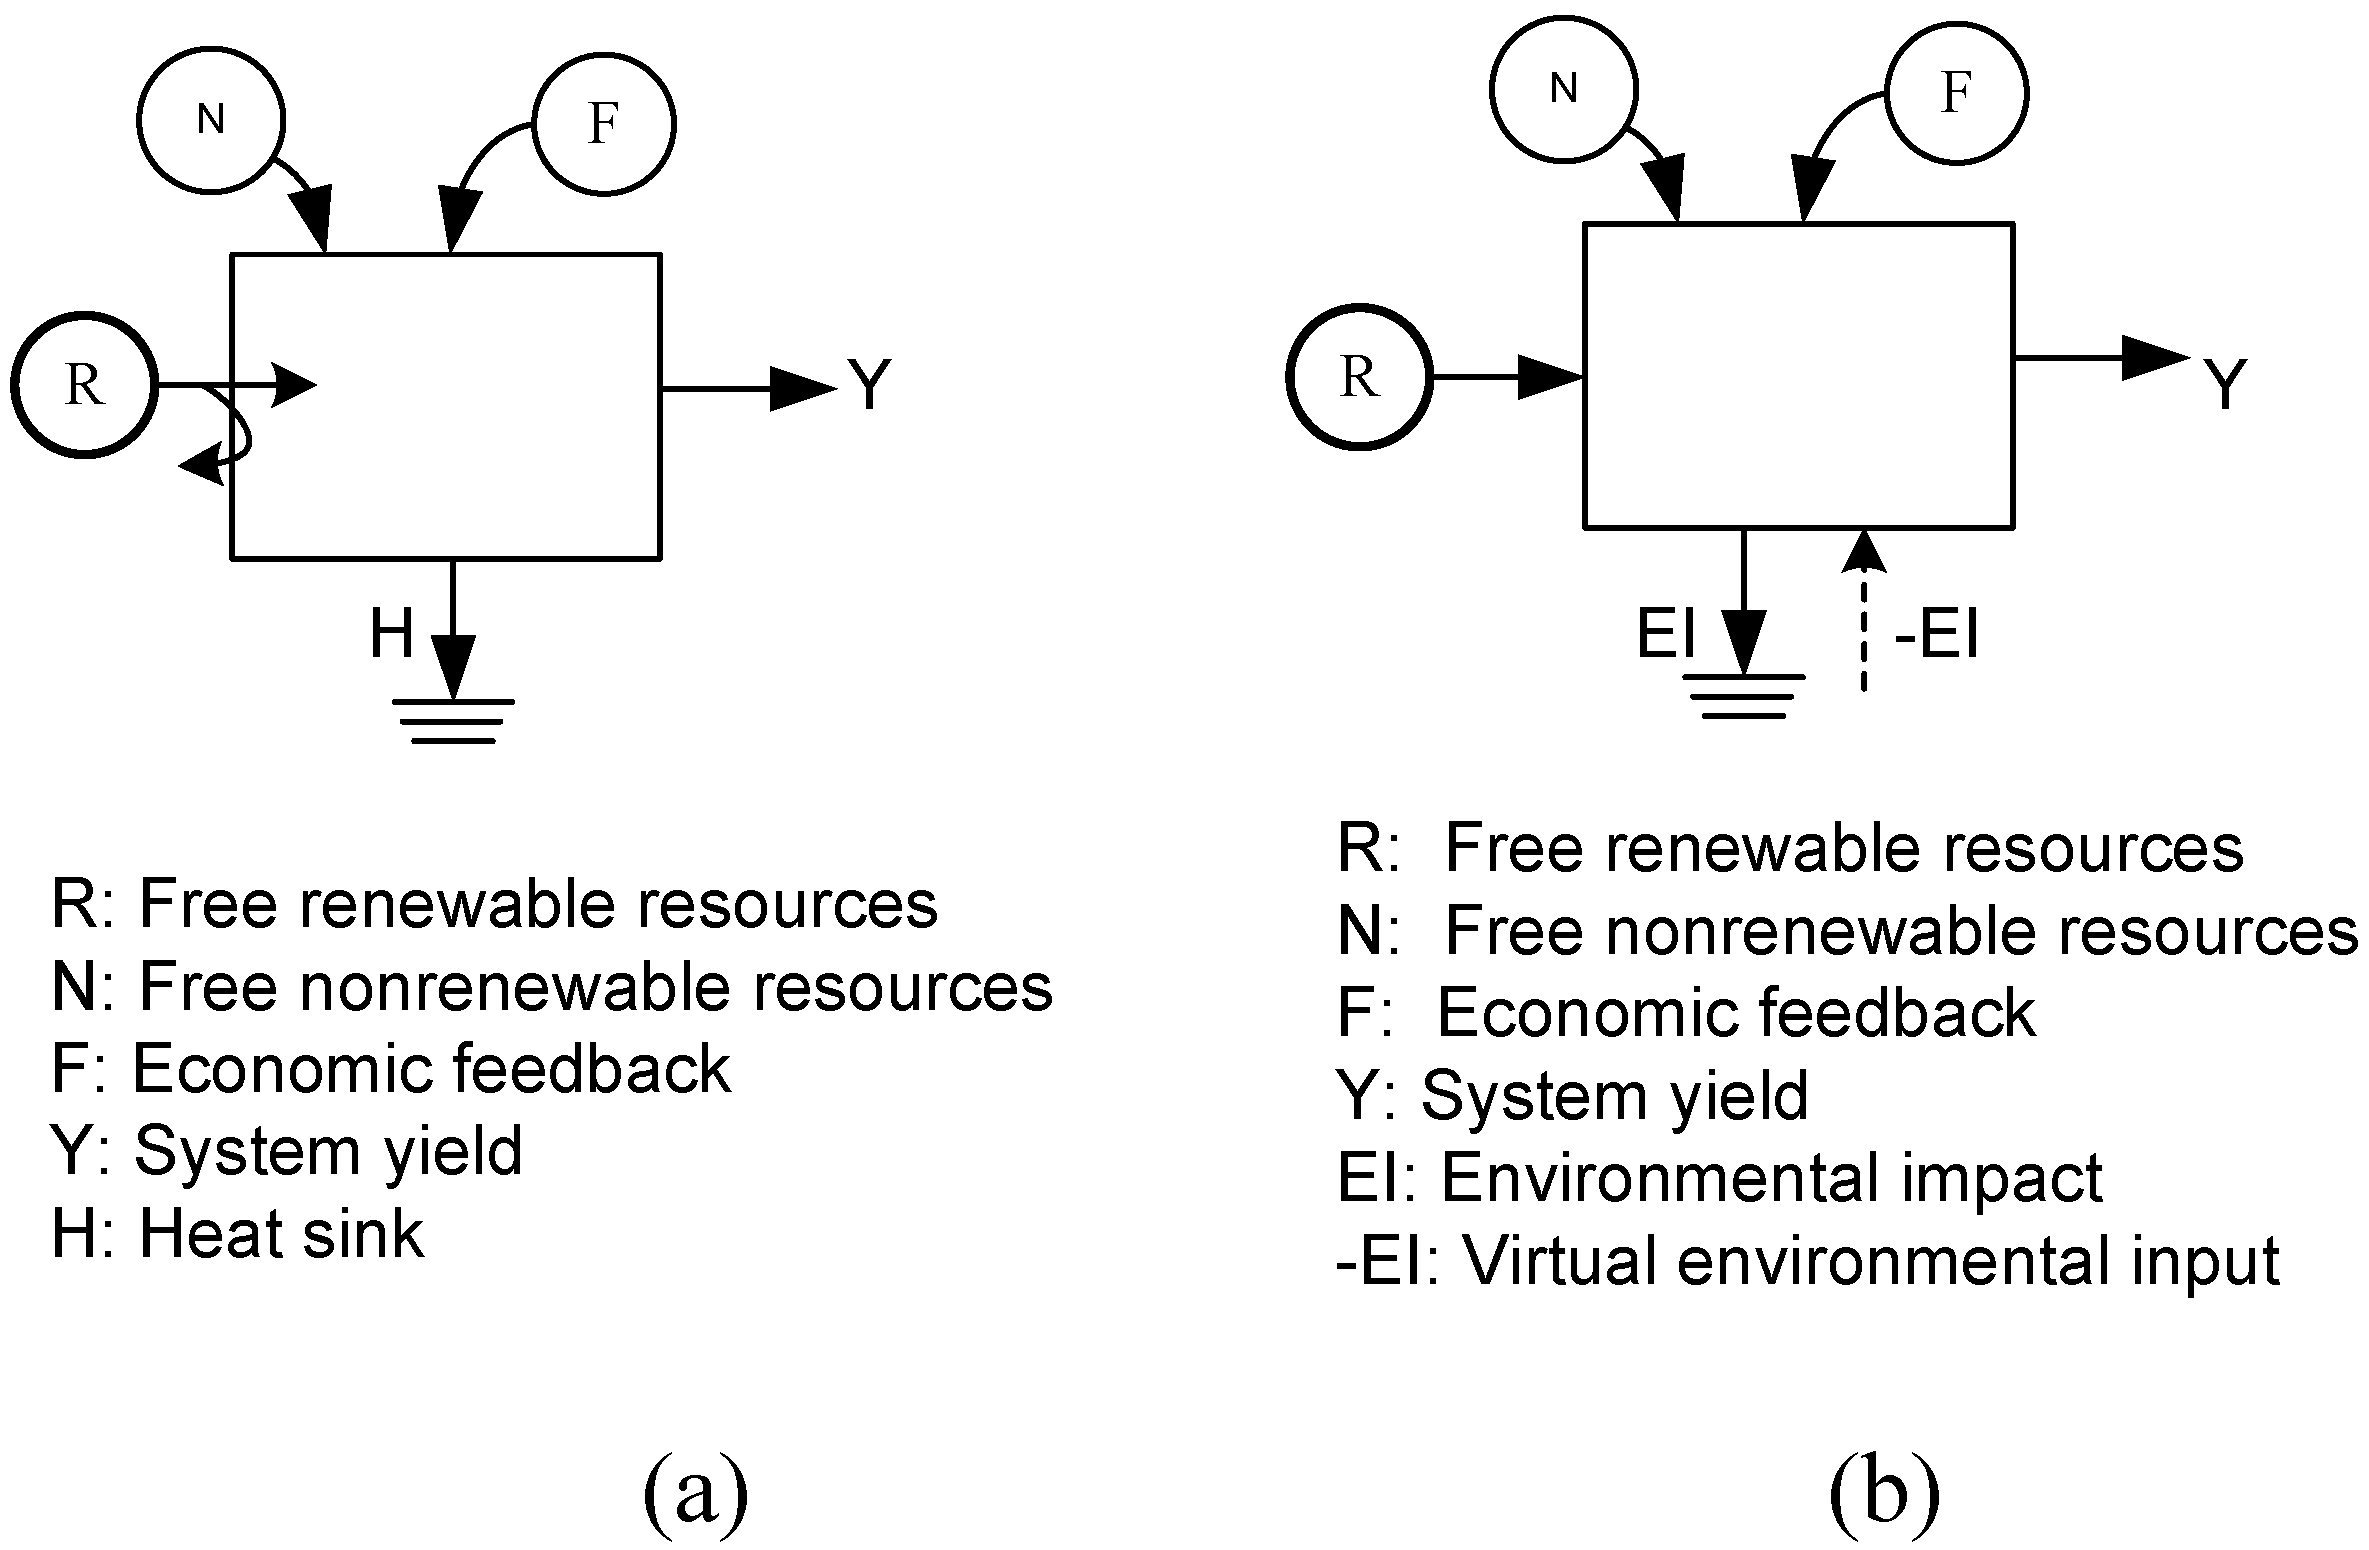
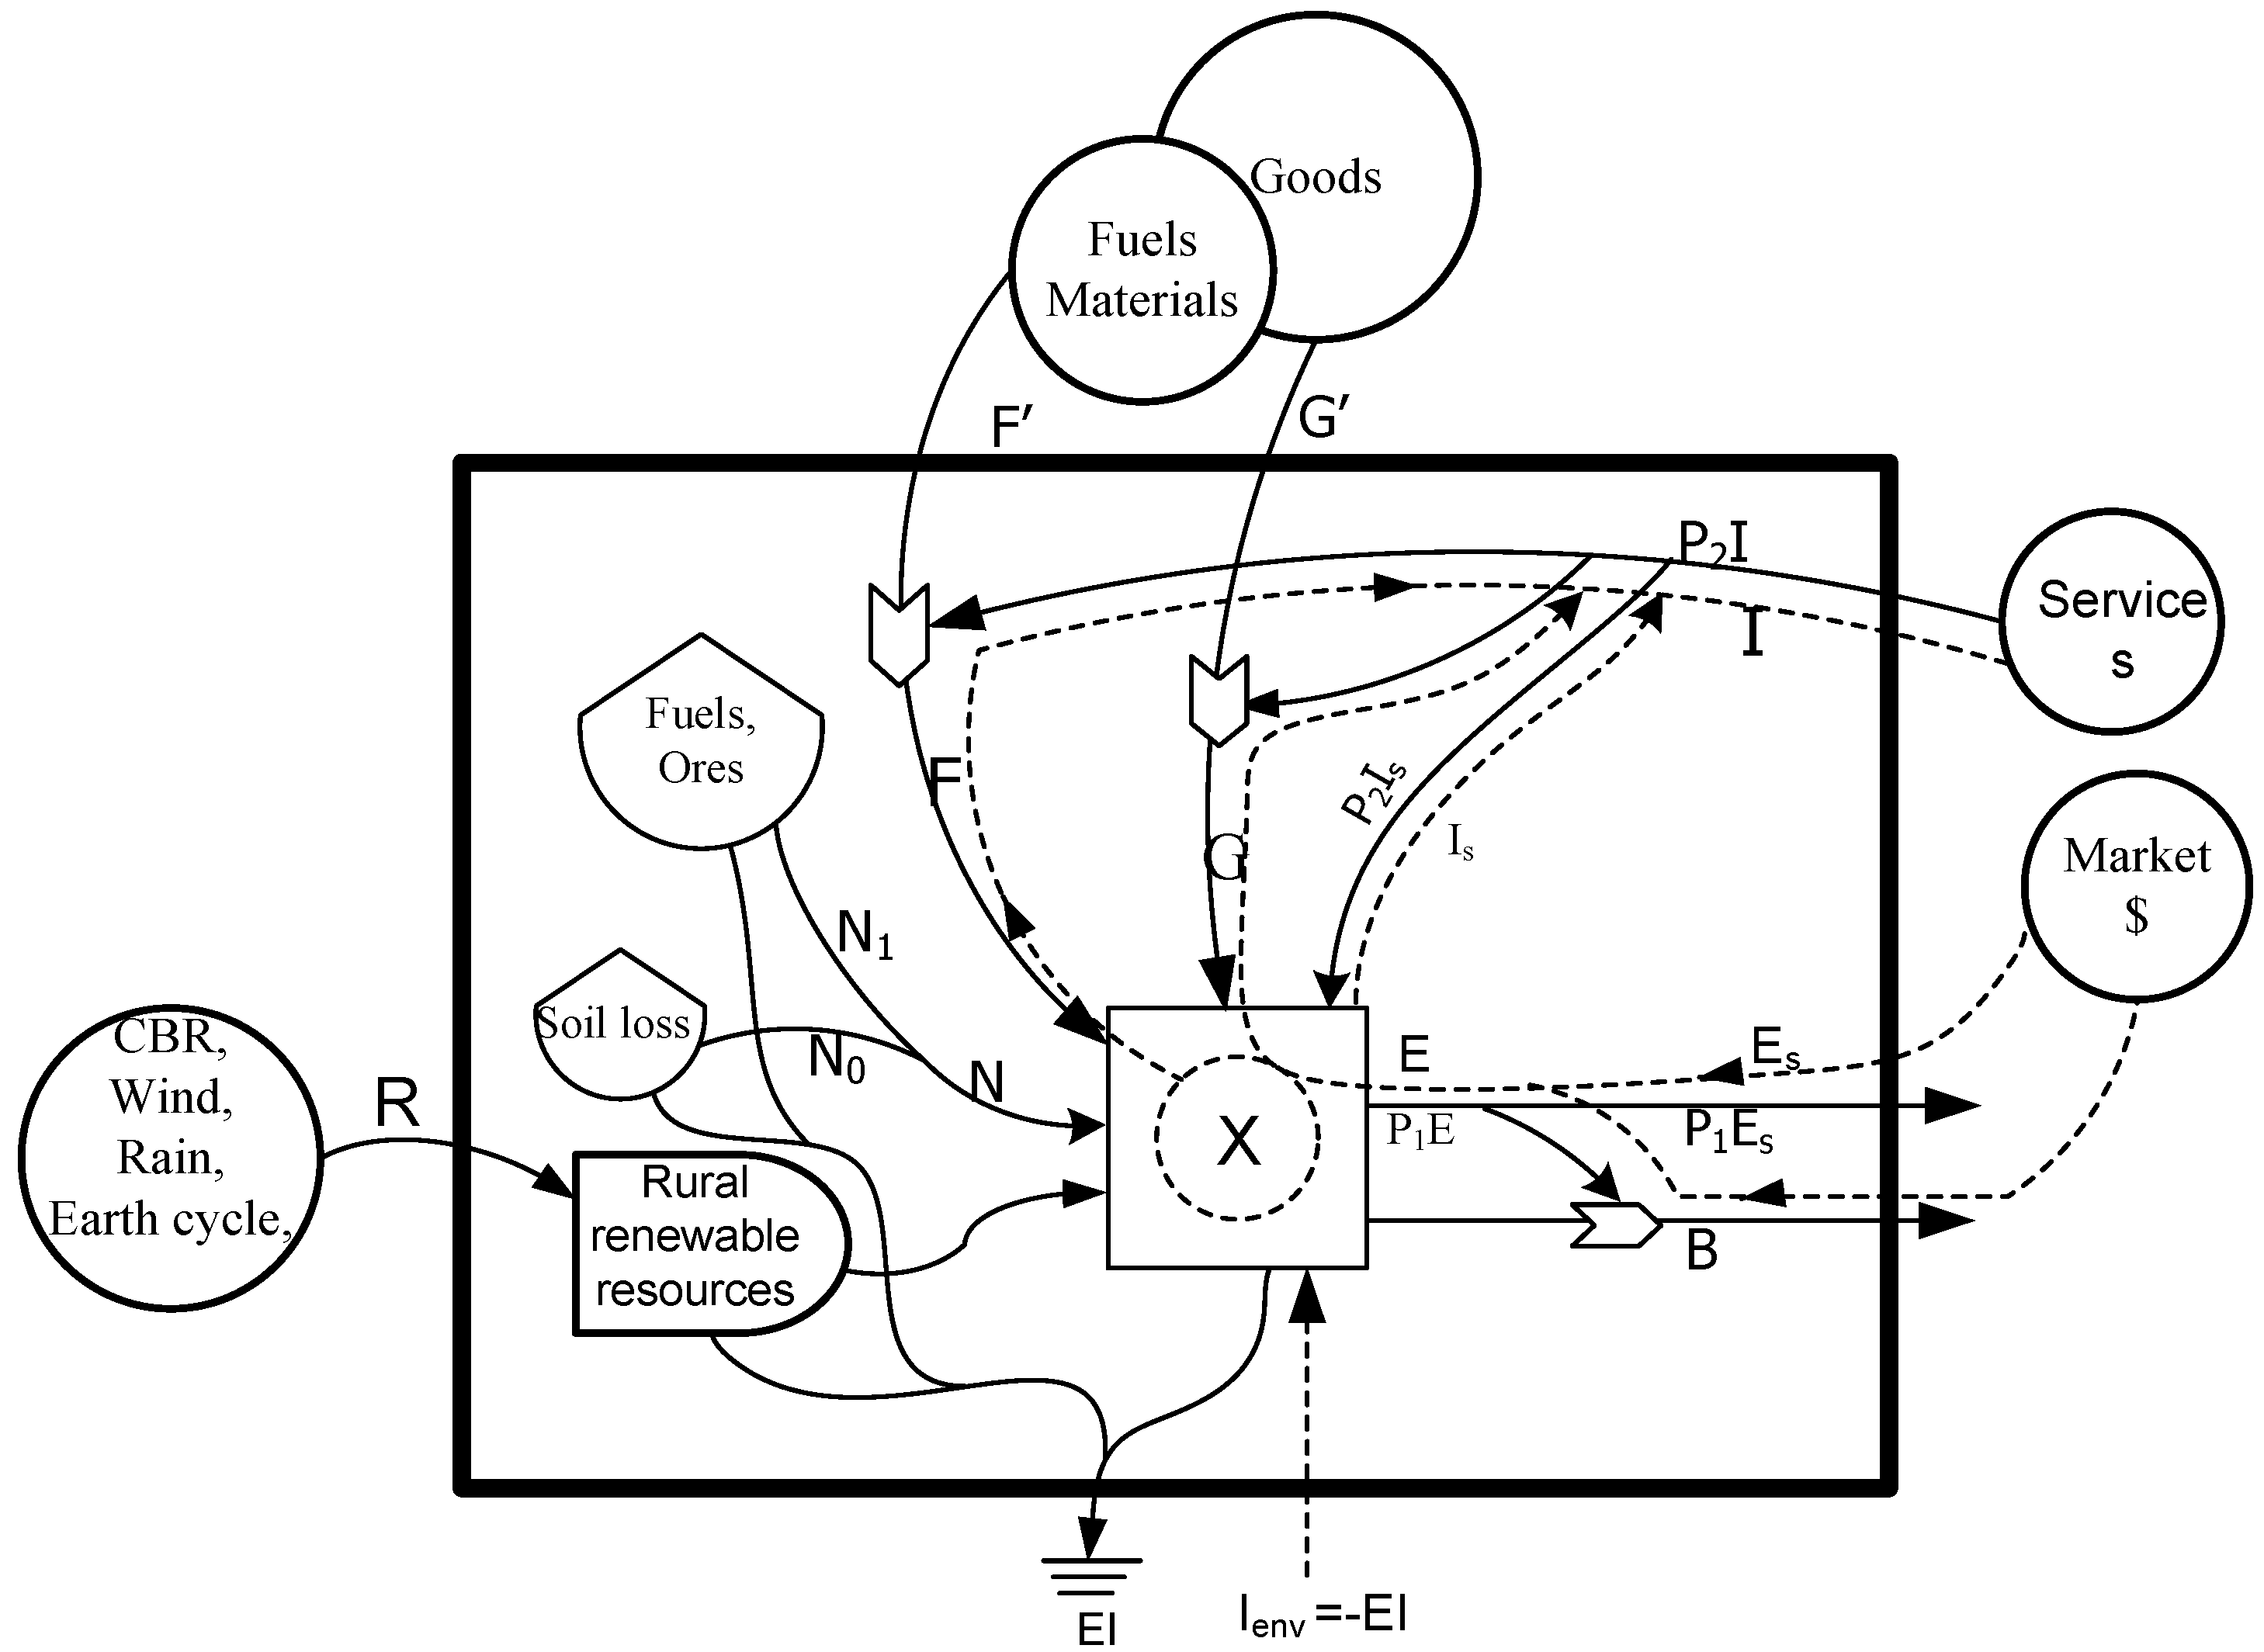
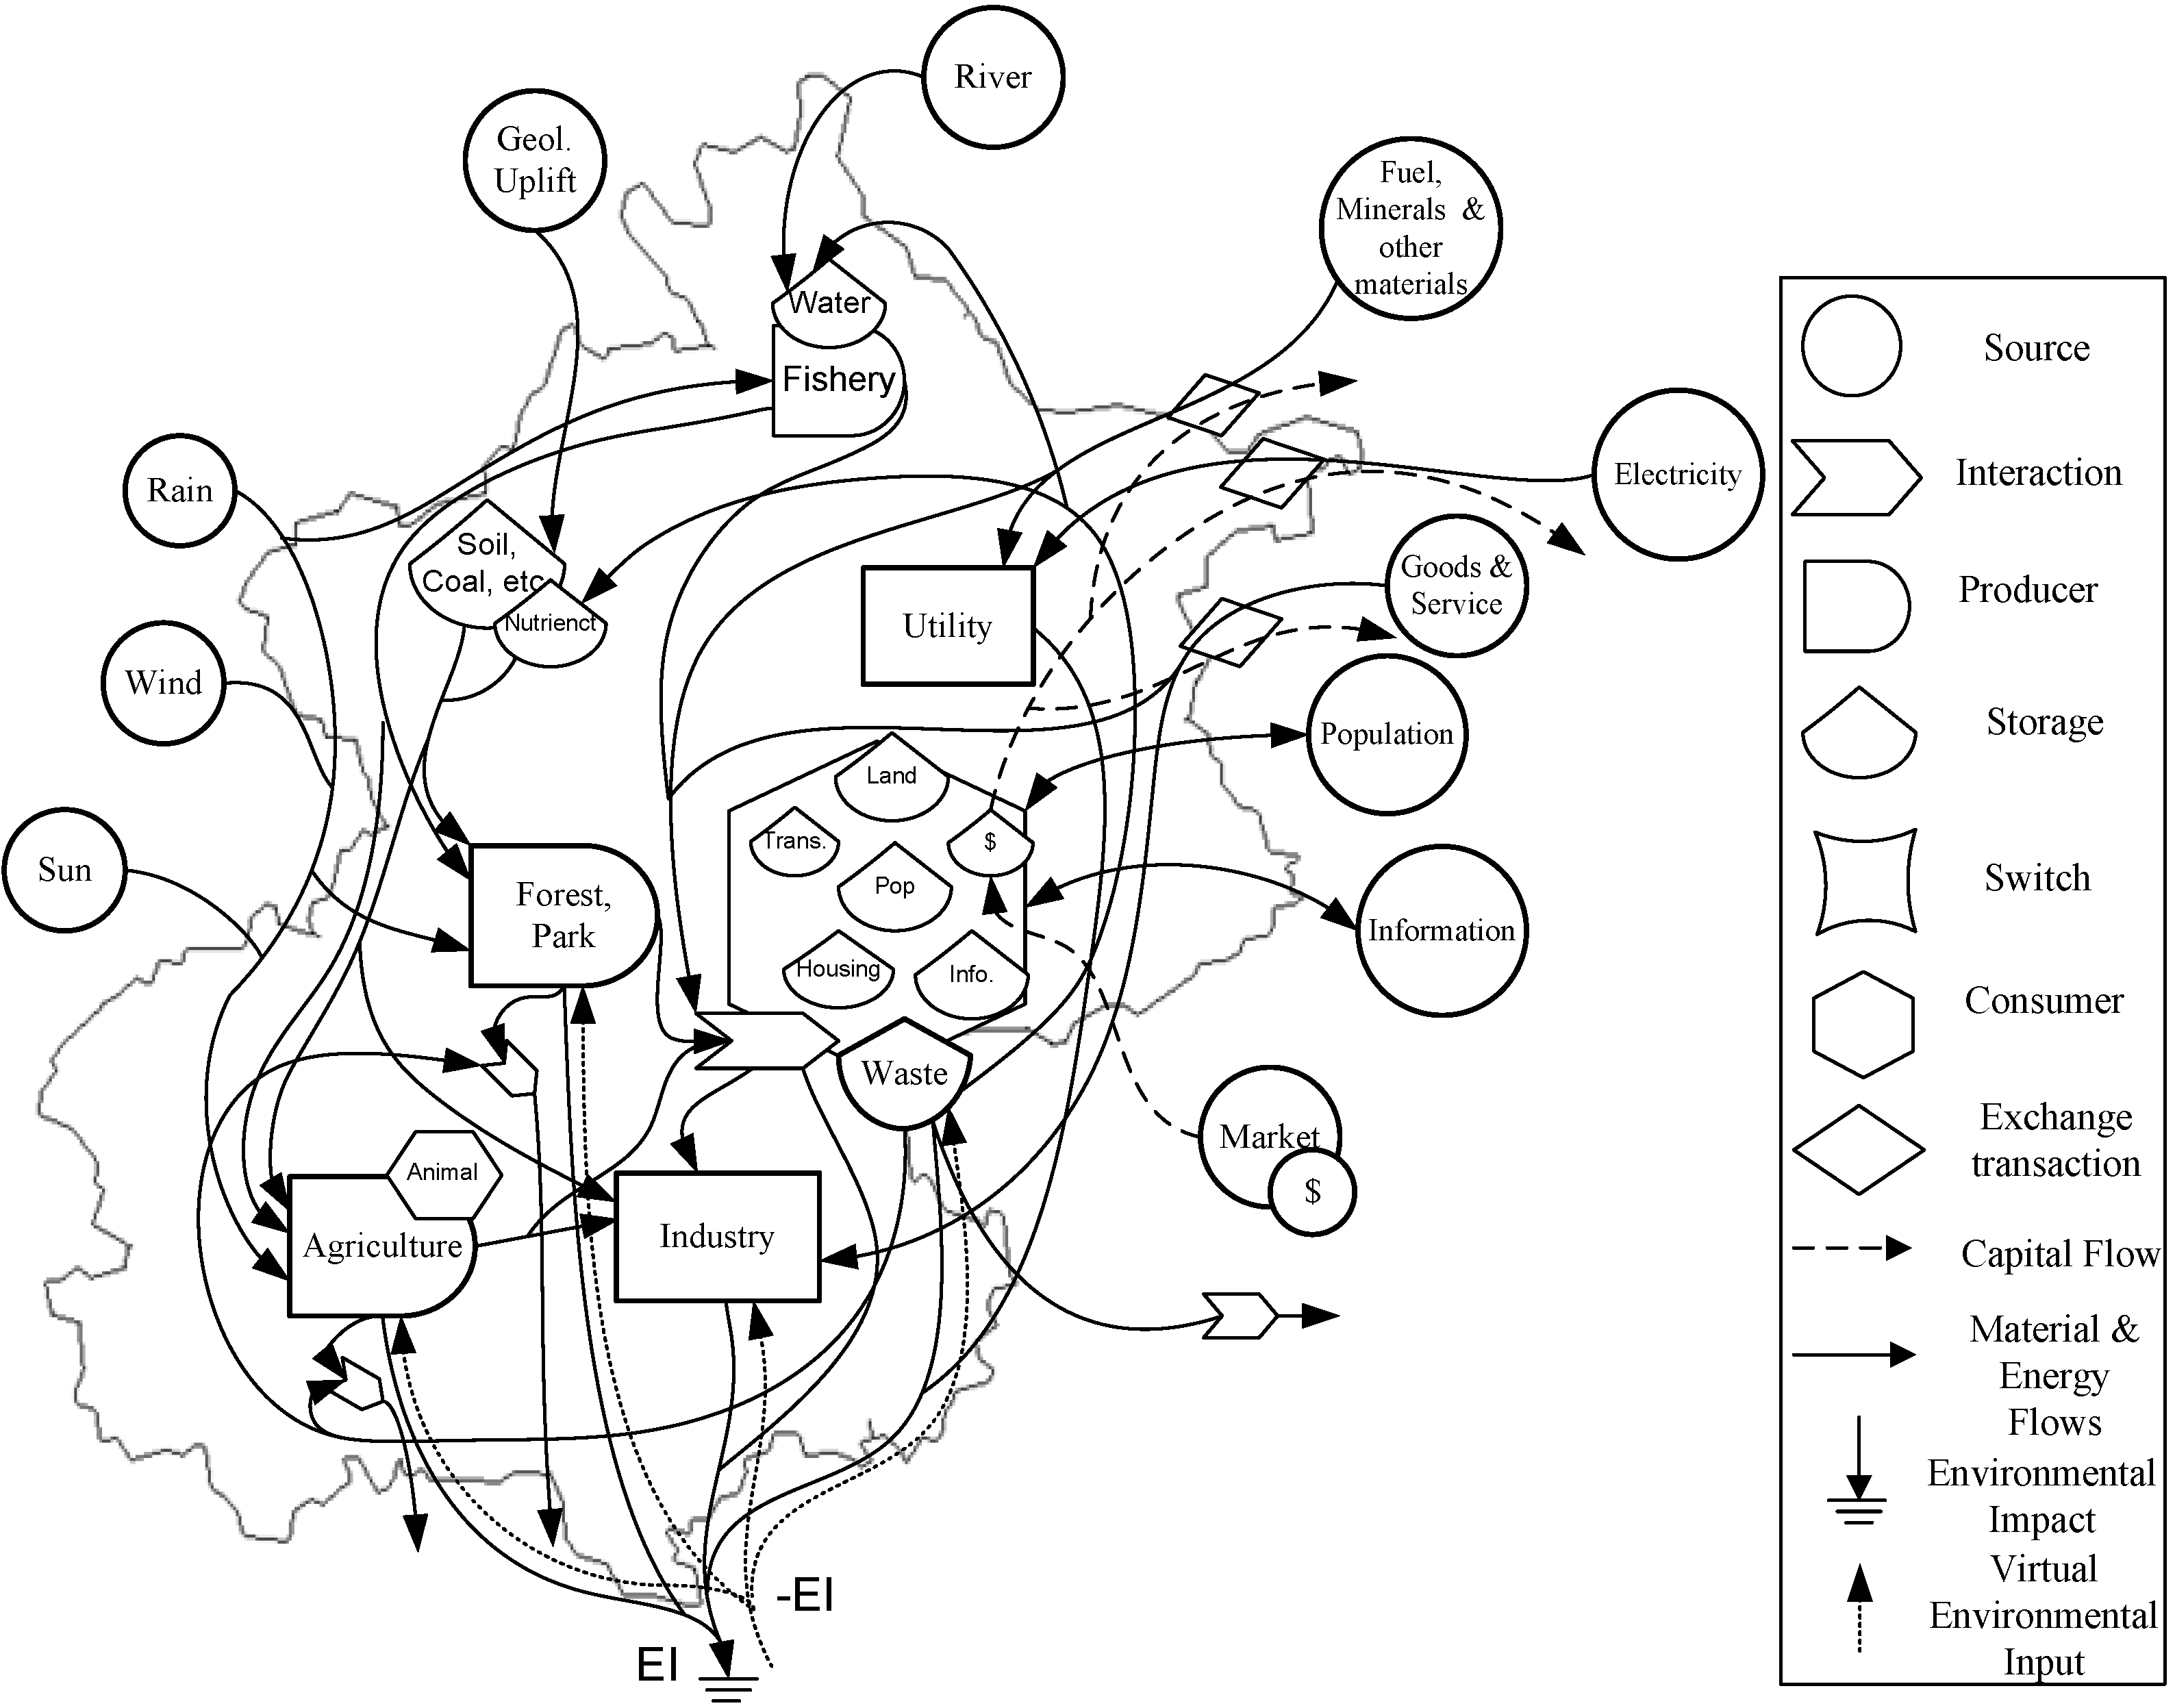
2.2. From Energy Diagram to Exergy Diagram

2.3. Transformity of Cosmic Emergy

| Note | Item | EPB (Jc/yr) | Exergy flow (J/yr) | Transformity (Jc/J) |
|---|---|---|---|---|
| Global flows | 1.38 × 10²¹ | |||
| 1 | Surface wind | 1.97 × 10²⁰ | 6.31 × 10²¹ | 0.03 |
| 2 | Rain on land, physical | 1.97 × 10²⁰ | 5.61 × 10²⁰ | 0.35 |
| 3 | Rain on land, chemical | 1.97 × 10²⁰ | 3.24 × 10²⁰ | 0.61 |
| 4 | Overland runoff, physical | 1.97 × 10²⁰ | 3.40 × 10²⁰ | 0.58 |
| 5 | Overland runoff, chemical | 1.97 × 10²⁰ | 1.95 × 10²⁰ | 1.01 |
| 6 | Wave | 1.97 × 10²⁰ | 3.09 × 10²⁰ | 0.64 |
| 7 | Earth cycle | 1.97 × 10²⁰ | 2.75 × 10²⁰ | 0.72 |
2.4. Cosimic Emergy Based Indicators
2.4.1. Emergy Structure
2.4.2. Emergy Intensity
2.4.3. Emergy Welfare
2.4.4. Environmental Impacts
2.4.5. Degree of Exploitation and Economic Efficiency
3. Cosmic Emergy Account for the Beijing Urban Ecosystem
3.1. General Review of the Case
3.2. Cosmic Emergy Account

| No. | Item | Units | 1978 | 1980 | 1985 | 1990 | 1995 | 2000 | 2004 |
| Renewable resources | |||||||||
| 1 | Photosynthesis | Jc | 6.94E + 14 | 6.94E + 14 | 6.94E + 14 | 6.94E + 14 | 6.94E + 14 | 6.94E + 14 | 6.94E + 14 |
| 2 | Wind, kinetic | Jc | 1.52E + 15 | 1.52E + 15 | 1.52E + 15 | 1.52E + 15 | 1.52E + 15 | 1.52E + 15 | 1.52E + 15 |
| 3 | Precipitation, geopotential | Jc | 2.01E + 14 | 1.94E + 14 | 3.61E + 14 | 3.49E + 14 | 2.87E + 14 | 1.86E + 14 | 2.42E + 14 |
| 4 | Precipitation, chemical | Jc | 1.58E + 16 | 1.53E + 16 | 2.84E + 16 | 2.75E + 16 | 2.26E + 16 | 1.46E + 16 | 1.90E + 16 |
| 5 | Earth cycle | Jc | 2.44E + 14 | 2.44E + 14 | 2.44E + 14 | 2.44E + 14 | 2.44E + 14 | 2.44E + 14 | 2.44E + 14 |
| Total | Jc | 1.84E + 16 | 1.79E + 16 | 3.12E + 16 | 3.03E + 16 | 2.53E + 16 | 1.73E + 16 | 2.17E + 16 | |
| Local renewable resources | |||||||||
| 6 | Hydroelectricity | Jc | 2.57E + 15 | 1.72E + 15 | 1.72E + 15 | 1.79E + 15 | 2.87E + 15 | 7.80E + 15 | 2.59E + 15 |
| 7 | Agriculture Production | Jc | 9.25E + 18 | 9.20E + 18 | 1.08E + 19 | 1.39E + 19 | 1.41E + 19 | 9.93E + 18 | 6.92E + 18 |
| 8 | Livestock Production | Jc | 1.06E + 19 | 1.48E + 19 | 2.95E + 19 | 4.95E + 19 | 5.26E + 19 | 6.57E + 19 | 1.24E + 20 |
| 9 | Fisheries Production | Jc | 2.84E + 16 | 5.74E + 16 | 2.27E + 17 | 7.33E + 17 | 1.14E + 18 | 1.07E + 18 | 9.52E + 17 |
| Total | Jc | 1.99E + 19 | 2.41E + 19 | 4.06E + 19 | 6.41E + 19 | 6.78E + 19 | 7.67E + 19 | 1.32E + 20 | |
| Local nonrenewable resources | |||||||||
| 10 | Coal | Jc | 3.66E + 18 | 3.18E + 18 | 4.36E + 18 | 4.49E + 18 | 4.44E + 18 | 2.47E + 18 | 4.06E + 18 |
| 11 | Soil losses | Jc | 7.37E + 17 | 7.23E + 17 | 6.79E + 17 | 6.52E + 17 | 6.16E + 17 | 5.80E + 17 | 6.79E + 17 |
| 12 | Top soil losses | Jc | 1.32E + 16 | 1.29E + 16 | 1.22E + 16 | 1.17E + 16 | 1.10E + 16 | 1.04E + 16 | 1.22E + 16 |
| Total | Jc | 4.41E + 18 | 3.91E + 18 | 5.05E + 18 | 5.15E + 18 | 5.07E + 18 | 3.06E + 18 | 4.75E + 18 | |
| Imports and outside sources | |||||||||
| 13 | Goods from China | Jc | 5.93E + 18 | 5.81E + 18 | 7.08E + 18 | 8.06E + 18 | 1.76E + 19 | 2.30E + 19 | 4.09E + 19 |
| 14 | Goods from abroad | Jc | 4.77E + 17 | 6.80E + 17 | 4.98E + 17 | 2.40E + 17 | 1.40E + 18 | 5.10E + 18 | 8.19E + 18 |
| 15 | Service from China | Jc | 1.89E + 17 | 5.74E + 17 | 1.09E + 19 | 2.81E + 19 | 1.81E + 19 | 1.78E + 19 | 3.36E + 19 |
| 16 | Service from abroad | Jc | 1.52E + 16 | 6.72E + 16 | 7.12E + 17 | 7.27E + 17 | 1.72E + 18 | 3.95E + 18 | 7.14E + 18 |
| 17 | Natural gas | Jc | 2.65E + 13 | 2.65E + 13 | 3.77E + 14 | 4.45E + 16 | 6.16E + 16 | 5.82E + 17 | 1.33E + 18 |
| 18 | Coal | Jc | 8.10E + 17 | 2.63E + 18 | 3.02E + 18 | 8.87E + 18 | 9.30E + 18 | 1.05E + 19 | 1.21E + 19 |
| 19 | Oil | Jc | 1.61E + 18 | 2.81E + 18 | 4.98E + 18 | 5.48E + 18 | 5.26E + 18 | 9.18E + 18 | 1.13E + 19 |
| 20 | Electricity | Jc | 4.70E + 17 | 5.47E + 17 | 7.07E + 17 | 1.04E + 18 | 1.67E + 18 | 2.37E + 18 | 3.62E + 18 |
| Total | Jc | 6.61E + 18 | 7.13E + 18 | 1.92E + 19 | 3.71E + 19 | 3.88E + 19 | 4.98E + 19 | 8.98E + 19 | |
| Exports | |||||||||
| 21 | Goods | Jc | 3.45E + 18 | 3.52E + 18 | 8.01E + 18 | 9.86E + 18 | 2.05E + 19 | 2.86E + 19 | 5.67E + 19 |
| 22 | Services | Jc | 3.52E + 18 | 3.28E + 18 | 4.96E + 18 | 1.29E + 19 | 1.14E + 19 | 2.02E + 19 | 6.25E + 19 |
| Total | Jc | 6.96E + 18 | 6.80E + 18 | 1.30E + 19 | 2.27E + 19 | 3.19E + 19 | 4.87E + 19 | 1.19E + 20 | |
| Resource consumption by urban system | |||||||||
| 23 | Natural gas | Jc | 2.65E + 13 | 2.65E + 13 | 3.77E + 14 | 4.45E + 16 | 6.16E + 16 | 5.82E + 17 | 1.33E + 18 |
| 24 | Coal | Jc | 4.47E + 18 | 5.80E + 18 | 7.39E + 18 | 1.07E + 19 | 1.19E + 19 | 1.21E + 19 | 1.25E + 19 |
| 25 | Oil | Jc | 1.61E + 18 | 2.81E + 18 | 4.98E + 18 | 5.48E + 18 | 5.26E + 18 | 5.86E + 18 | 7.40E + 18 |
| 26 | Electricity | Jc | 8.83E + 17 | 1.03E + 18 | 1.33E + 18 | 1.95E + 18 | 2.68E + 18 | 2.46E + 18 | 5.43E + 18 |
| Total | Jc | 6.96E + 18 | 9.65E + 18 | 1.37E + 19 | 1.82E + 19 | 1.99E + 19 | 2.10E + 19 | 2.67E + 19 | |
| Waste | |||||||||
| 27 | Solid waste | Jc | 1.72E + 18 | 1.86E + 18 | 3.14E + 18 | 7.81E + 18 | 1.35E + 19 | 1.44E + 19 | 1.65E + 19 |
| 28 | Water discharged | Jc | 8.30E + 17 | 9.87E + 17 | 1.23E + 18 | 1.30E + 18 | 1.17E + 18 | 1.25E + 18 | 1.43E + 18 |
| Total | Jc | 2.55E + 18 | 2.85E + 18 | 4.37E + 18 | 9.11E + 18 | 1.47E + 19 | 1.57E + 19 | 1.79E + 19 | |
| Currency | |||||||||
| 29 | GNP | US$ | 7.00E + 09 | 9.28E + 09 | 8.75E + 09 | 1.05E + 10 | 1.67E + 10 | 3E + 10 | 5.17E + 10 |
| Population | |||||||||
| 30 | Population | capita | 8.72E + 06 | 9.04E + 06 | 9.81E + 06 | 1.09E + 07 | 1.25E + 07 | 1.36E + 07 | 1.49E + 07 |
| No. | Item | Variable | 1978 | 1980 | 1985 | 1990 | 1995 | 2000 | 2004 |
|---|---|---|---|---|---|---|---|---|---|
| 1 | Renewable sources (Jc) | R | 1.84E + 16 | 1.79E + 16 | 3.12E + 16 | 3.03E + 16 | 2.53E + 16 | 1.73E + 16 | 2.17E + 16 |
| 2 | Local nonrenewable resources (Jc) | N | 4.41E + 18 | 3.91E + 18 | 5.05E + 18 | 5.15E + 18 | 5.07E + 18 | 3.06E + 18 | 4.75E + 18 |
| 3 | Dispersed rural resource (Jc) | N0 | 7.50E + 17 | 7.35E + 17 | 6.91E + 17 | 6.63E + 17 | 6.27E + 17 | 5.91E + 17 | 6.91E + 17 |
| 4 | Concentrated resource (Jc) | N1 | 3.66E + 18 | 3.18E + 18 | 4.36E + 18 | 4.49E + 18 | 4.44E + 18 | 2.47E + 18 | 4.06E + 18 |
| 5 | Imported goods (Jc) | G | 6.40E + 18 | 6.49E + 18 | 7.58E + 18 | 8.30E + 18 | 1.90E + 19 | 2.81E + 19 | 4.91E + 19 |
| 6 | Imported fuels (Jc) | F | 2.89E + 18 | 5.99E + 18 | 8.71E + 18 | 1.54E + 19 | 1.63E + 19 | 2.26E + 19 | 2.83E + 19 |
| 7 | Dollars paid for imports ($) | I | 6.96E + 07 | 3.03E + 08 | 4.46E + 09 | 1.12E + 10 | 1.10E + 10 | 1.58E + 10 | 3.36E + 10 |
| 8 | Emergy of imported goods and fuels (Jc) | P2I | 2.04E + 17 | 6.41E + 17 | 1.16E + 19 | 2.88E + 19 | 1.98E + 19 | 2.17E + 19 | 4.07E + 19 |
| 9 | Dollars received from exports ($) | E | 2.23E + 09 | 2.75E + 09 | 1.79E + 09 | 3.18E + 09 | 4.35E + 09 | 1.14E + 10 | 3.42E + 10 |
| 10 | Exported goods (Jc) | B | 3.45E + 18 | 3.52E + 18 | 8.01E + 18 | 9.86E + 18 | 2.05E + 19 | 2.86E + 19 | 5.67E + 19 |
| 11 | Exported services (Jc) | P1E | 3.52E + 18 | 3.28E + 18 | 4.96E + 18 | 1.29E + 19 | 1.14E + 19 | 2.02E + 19 | 6.25E + 19 |
| 12 | Environmental impacts (Jc) | EI | 2.55E + 18 | 2.85E + 18 | 4.37E + 18 | 9.11E + 18 | 1.47E + 19 | 1.57E + 19 | 1.79E + 19 |
| 13 | GNP of Beijing ($) | X | 7.00E + 09 | 9.28E + 09 | 8.75E + 09 | 1.05E + 10 | 1.67E + 10 | 3.00E + 10 | 5.17E + 10 |
| 14 | Total emergy use (Jc) | U | 1.10E + 19 | 1.11E + 19 | 2.42E + 19 | 4.23E + 19 | 4.39E + 19 | 5.29E + 19 | 9.46E + 19 |

4. Cosmic Emergy Based Indicator Analysis

| No. | Item | Symbol | 1978 | 1980 | 1985 | 1990 | 1995 | 2000 | 2004 |
|---|---|---|---|---|---|---|---|---|---|
| Emergy source | |||||||||
| 1 | Local renewable emergy fraction | R/U | 0.002 | 0.002 | 0.001 | 0.001 | 0.001 | 0.000 | 0.000 |
| 2 | Free emergy fraction | (R + N0)/U | 0.070 | 0.068 | 0.030 | 0.016 | 0.015 | 0.011 | 0.008 |
| 3 | Emergy self-sufficiency fraction | (R + N0 + N1)/U | 0.401 | 0.355 | 0.210 | 0.122 | 0.116 | 0.058 | 0.050 |
| 4 | Purchased emergy fraction | (G + P2I)/U | 0.599 | 0.645 | 0.790 | 0.878 | 0.884 | 0.942 | 0.950 |
| 5 | Imported service emergy fraction | P2I/U | 0.018 | 0.058 | 0.478 | 0.681 | 0.451 | 0.410 | 0.430 |
| Emergy intensity | |||||||||
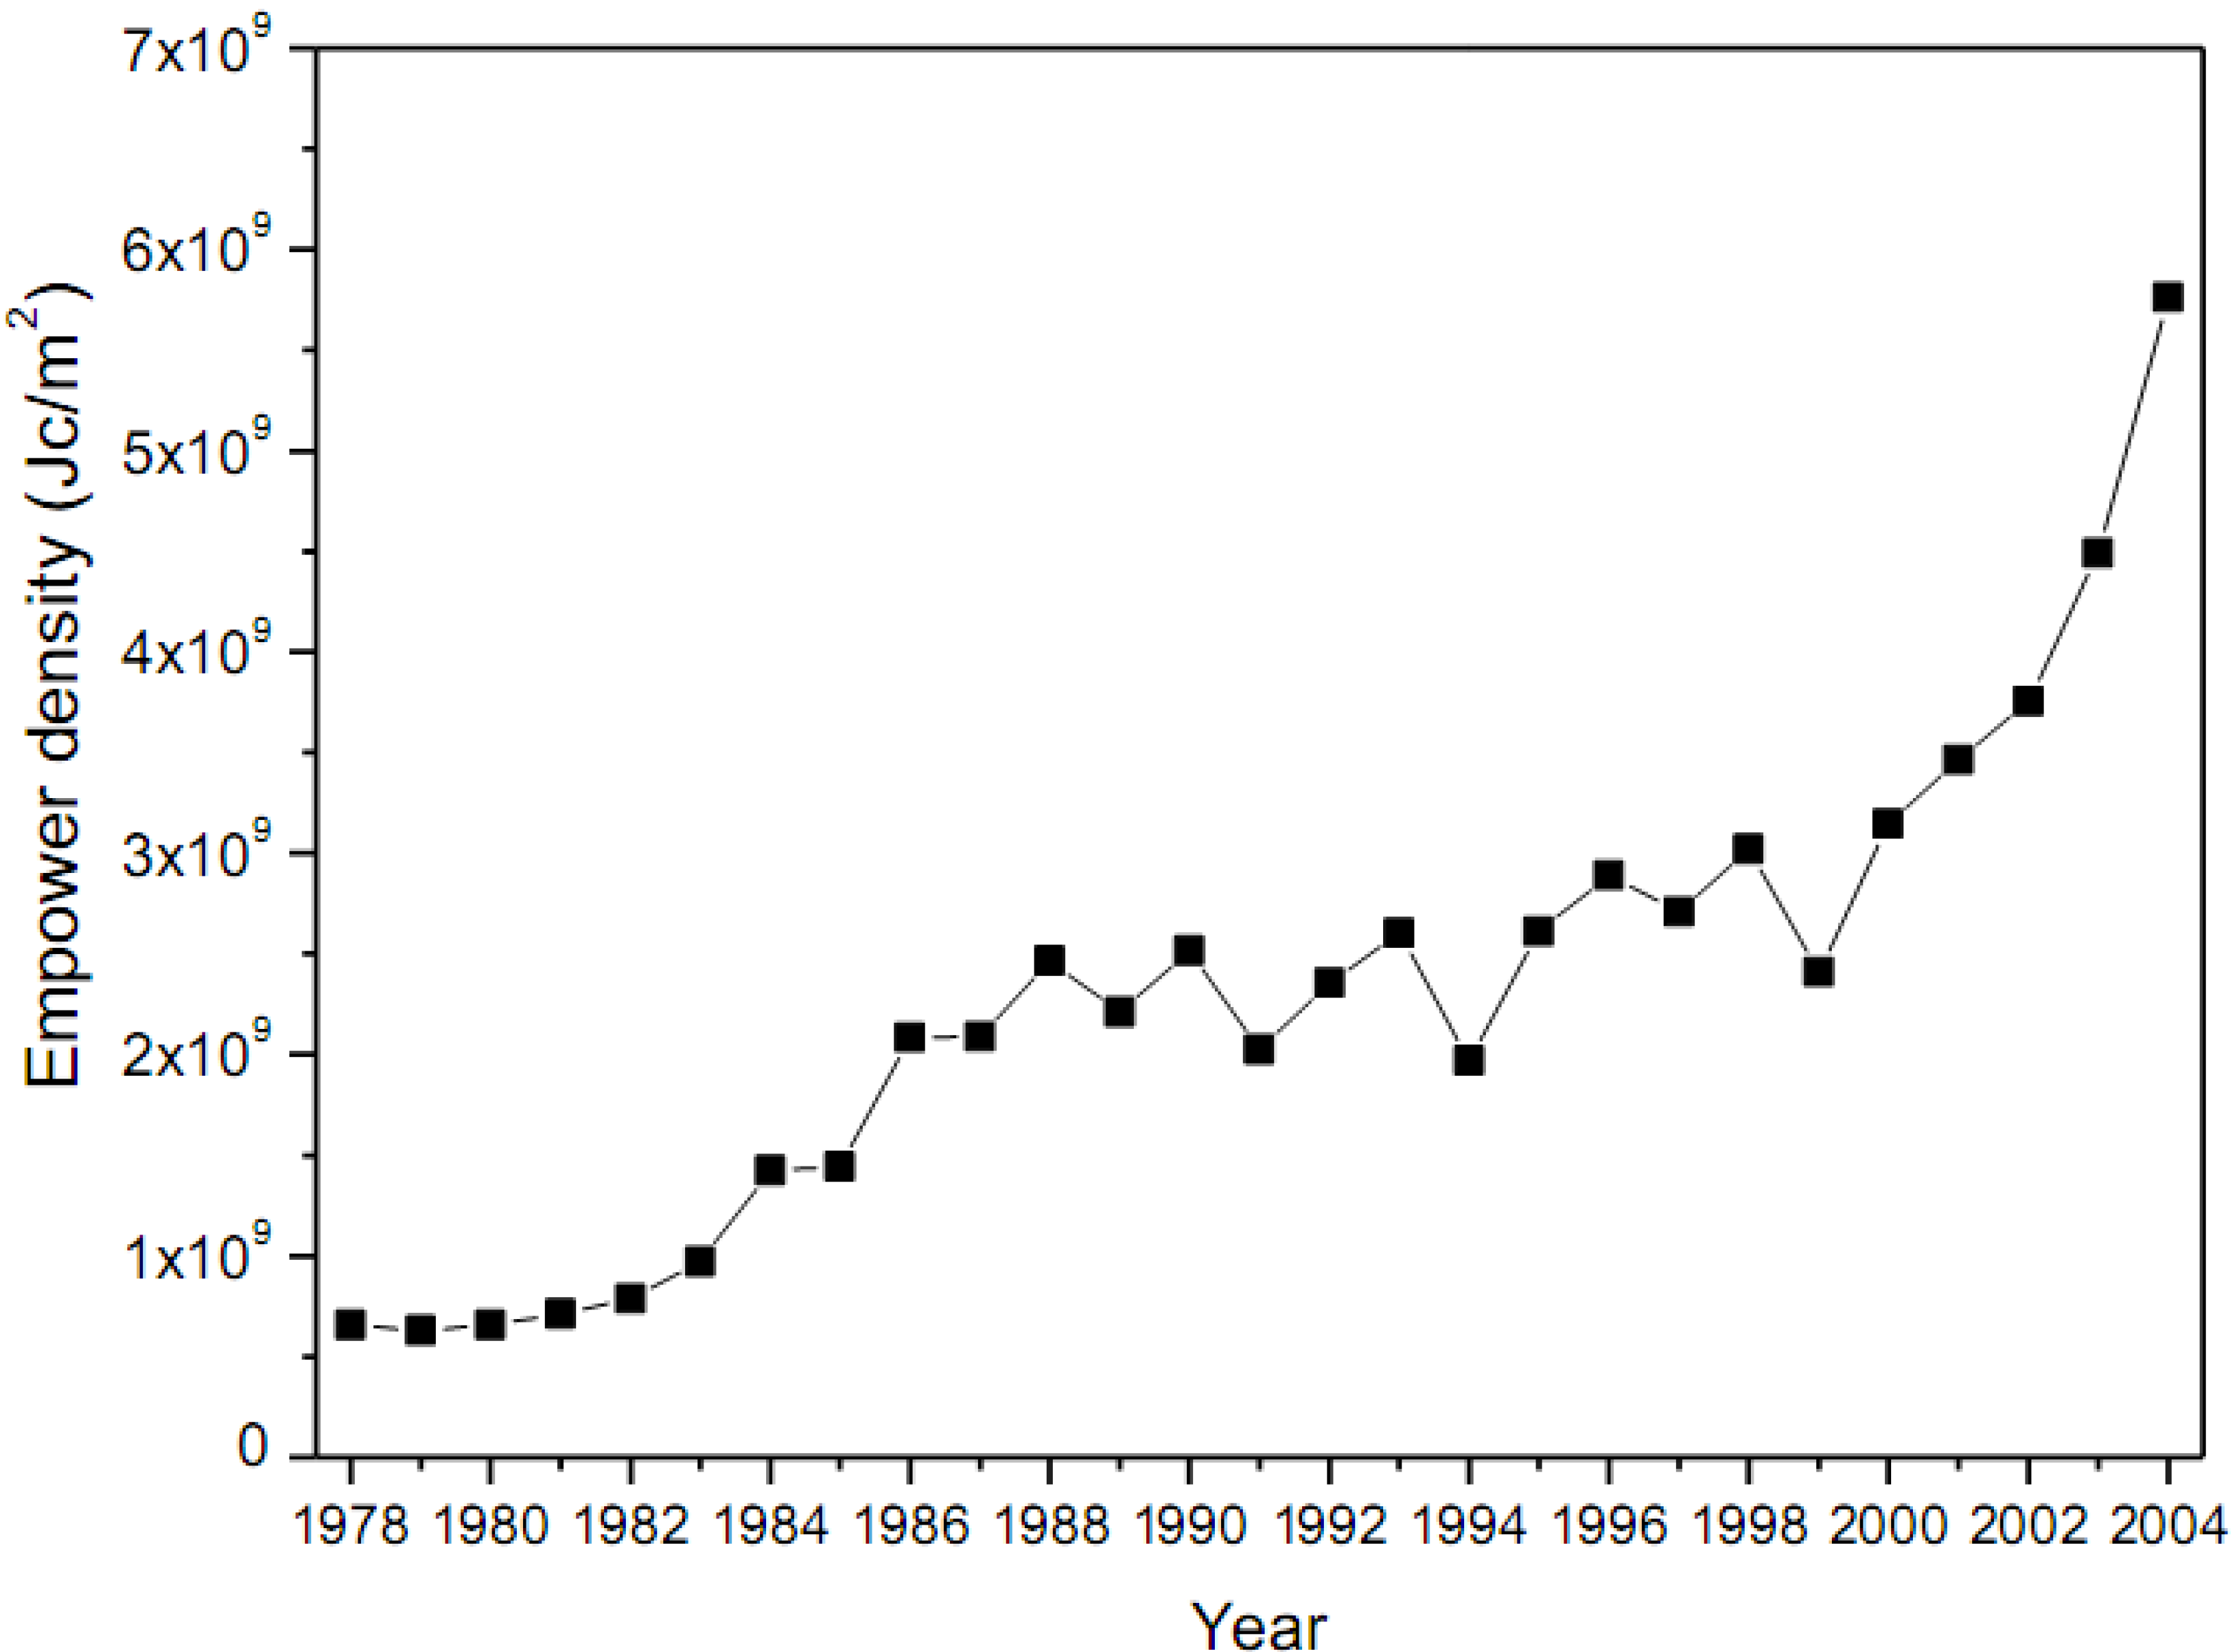
| 6 | Empower density(108 Jc/m2) | U/area | 6.6 | 6.6 | 14.4 | 25.2 | 26.1 | 31.5 | 57.6 |
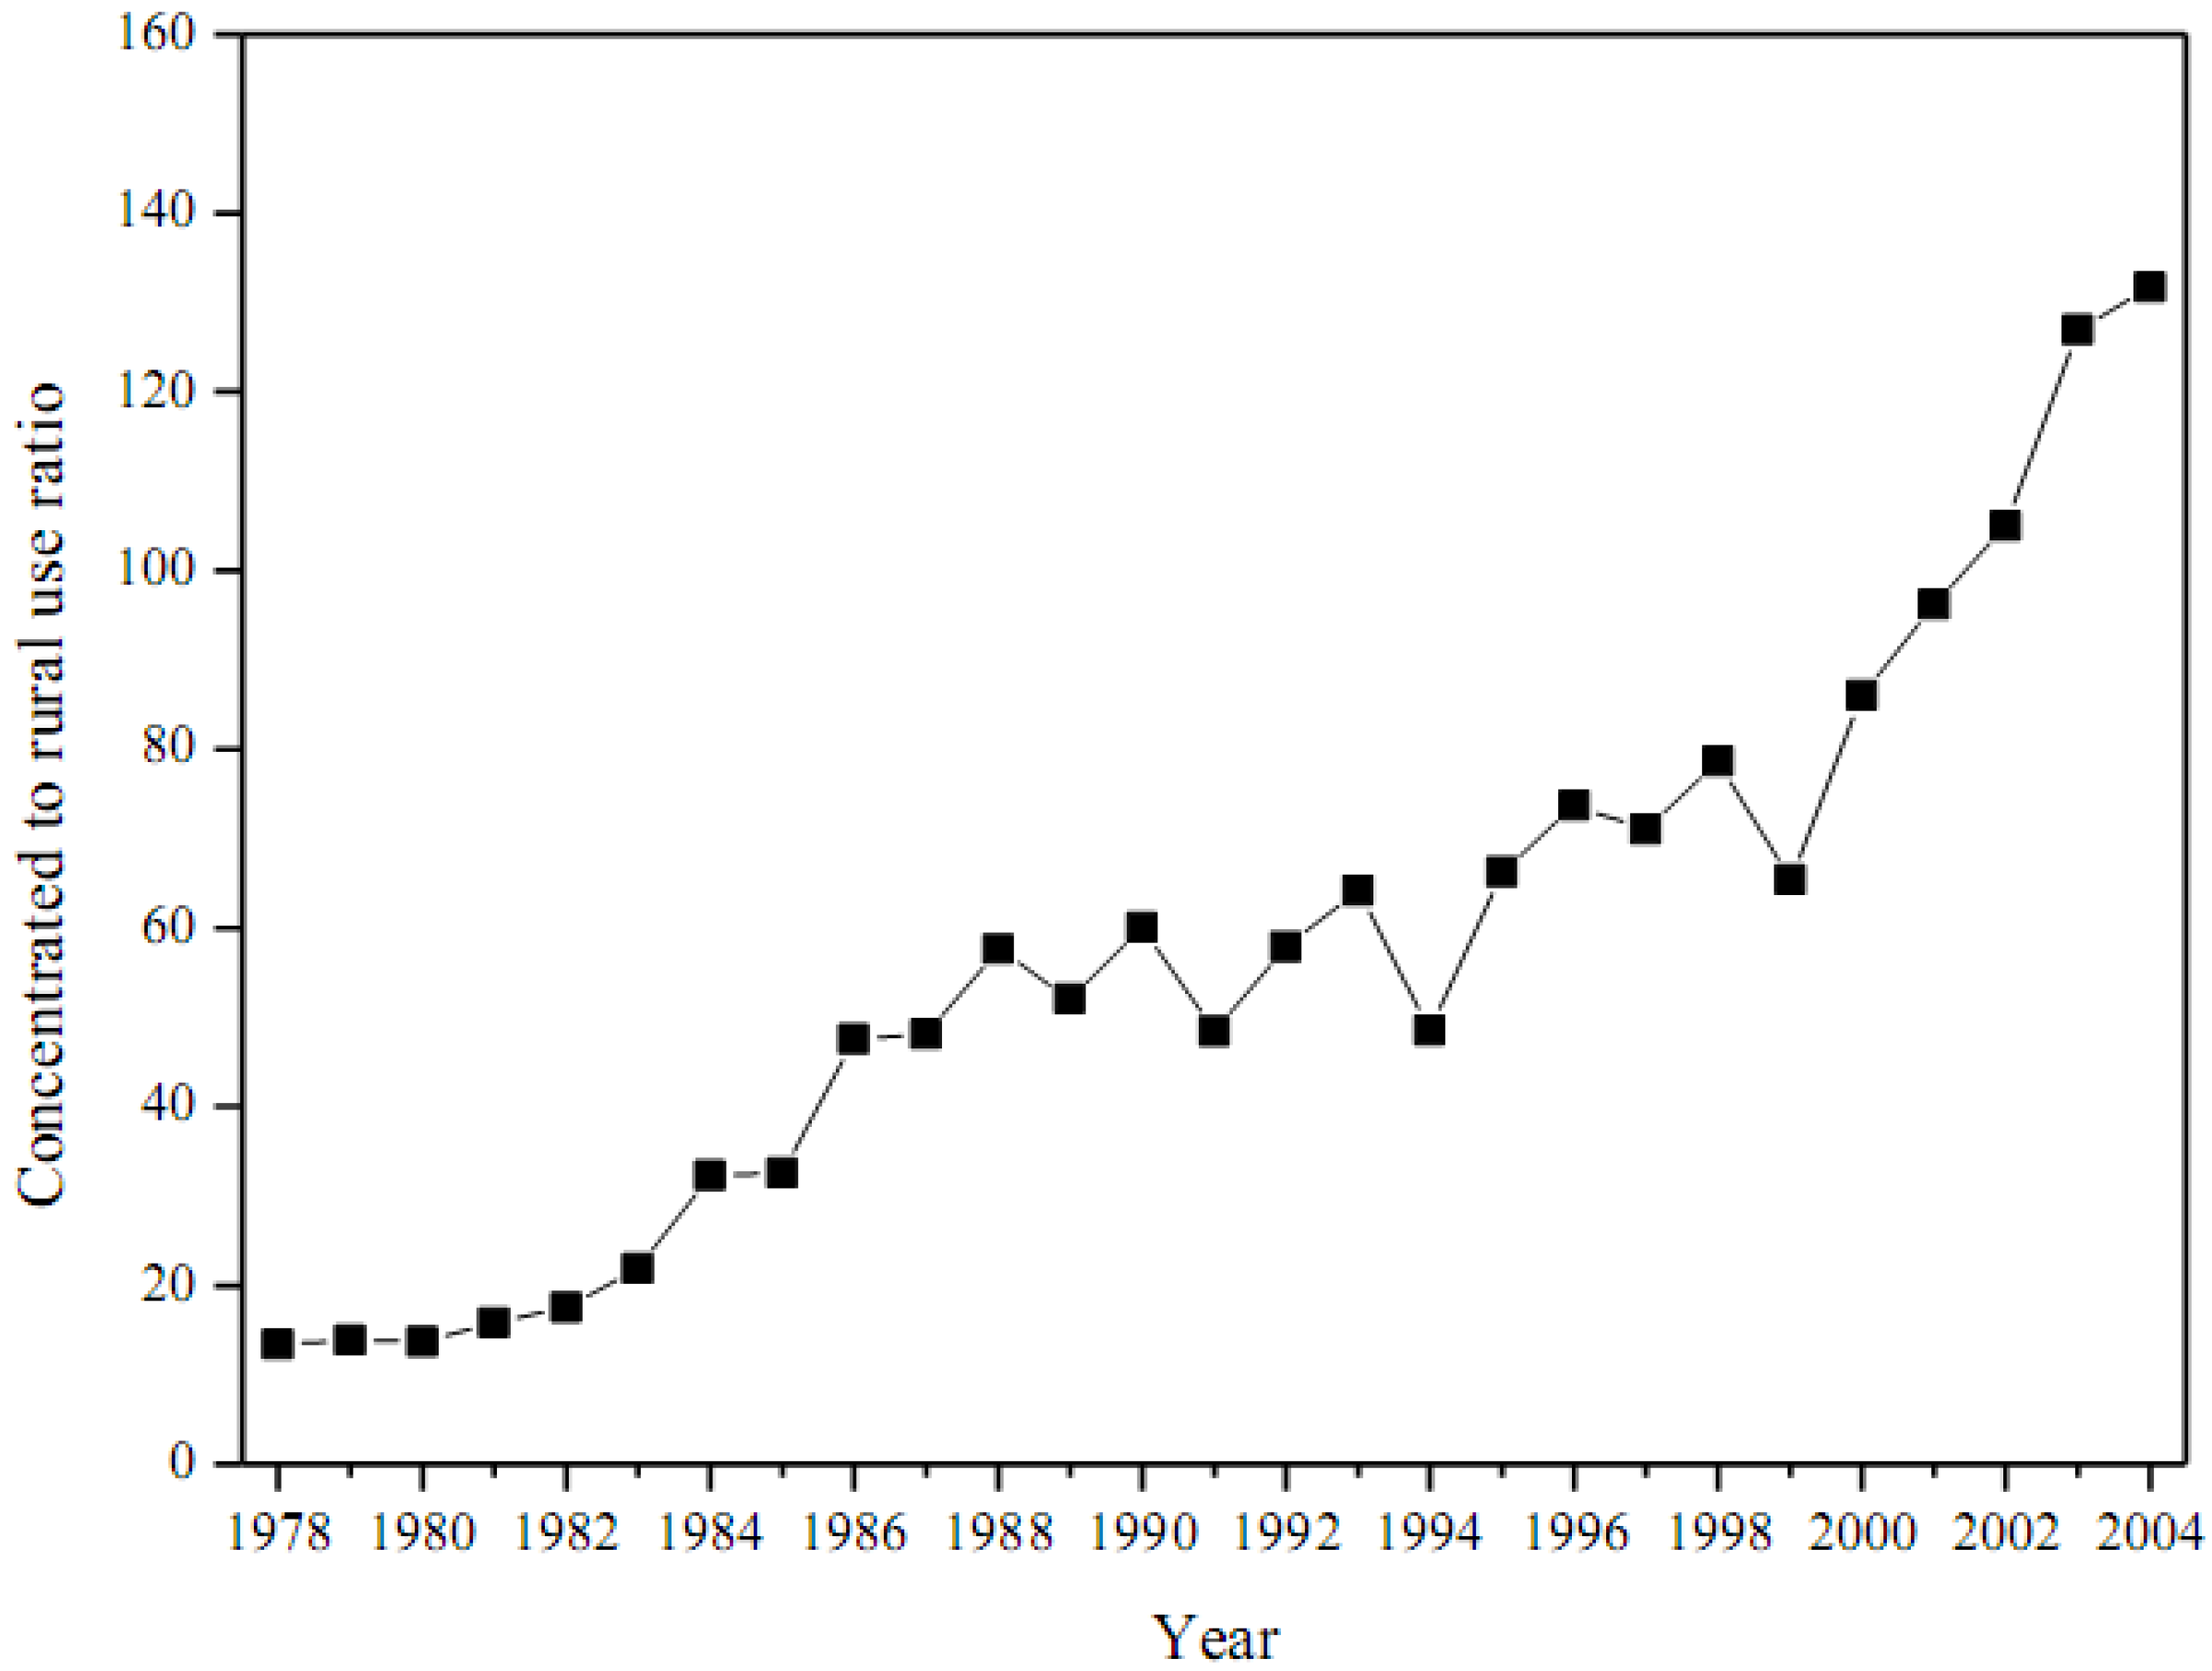
| 7 | Concentrated to rural use ratio | (G + P2I + N1)/(R + N0) | 13.4 | 13.7 | 32.6 | 60.0 | 66.3 | 86.0 | 131.7 |
| Emergy welfare | |||||||||
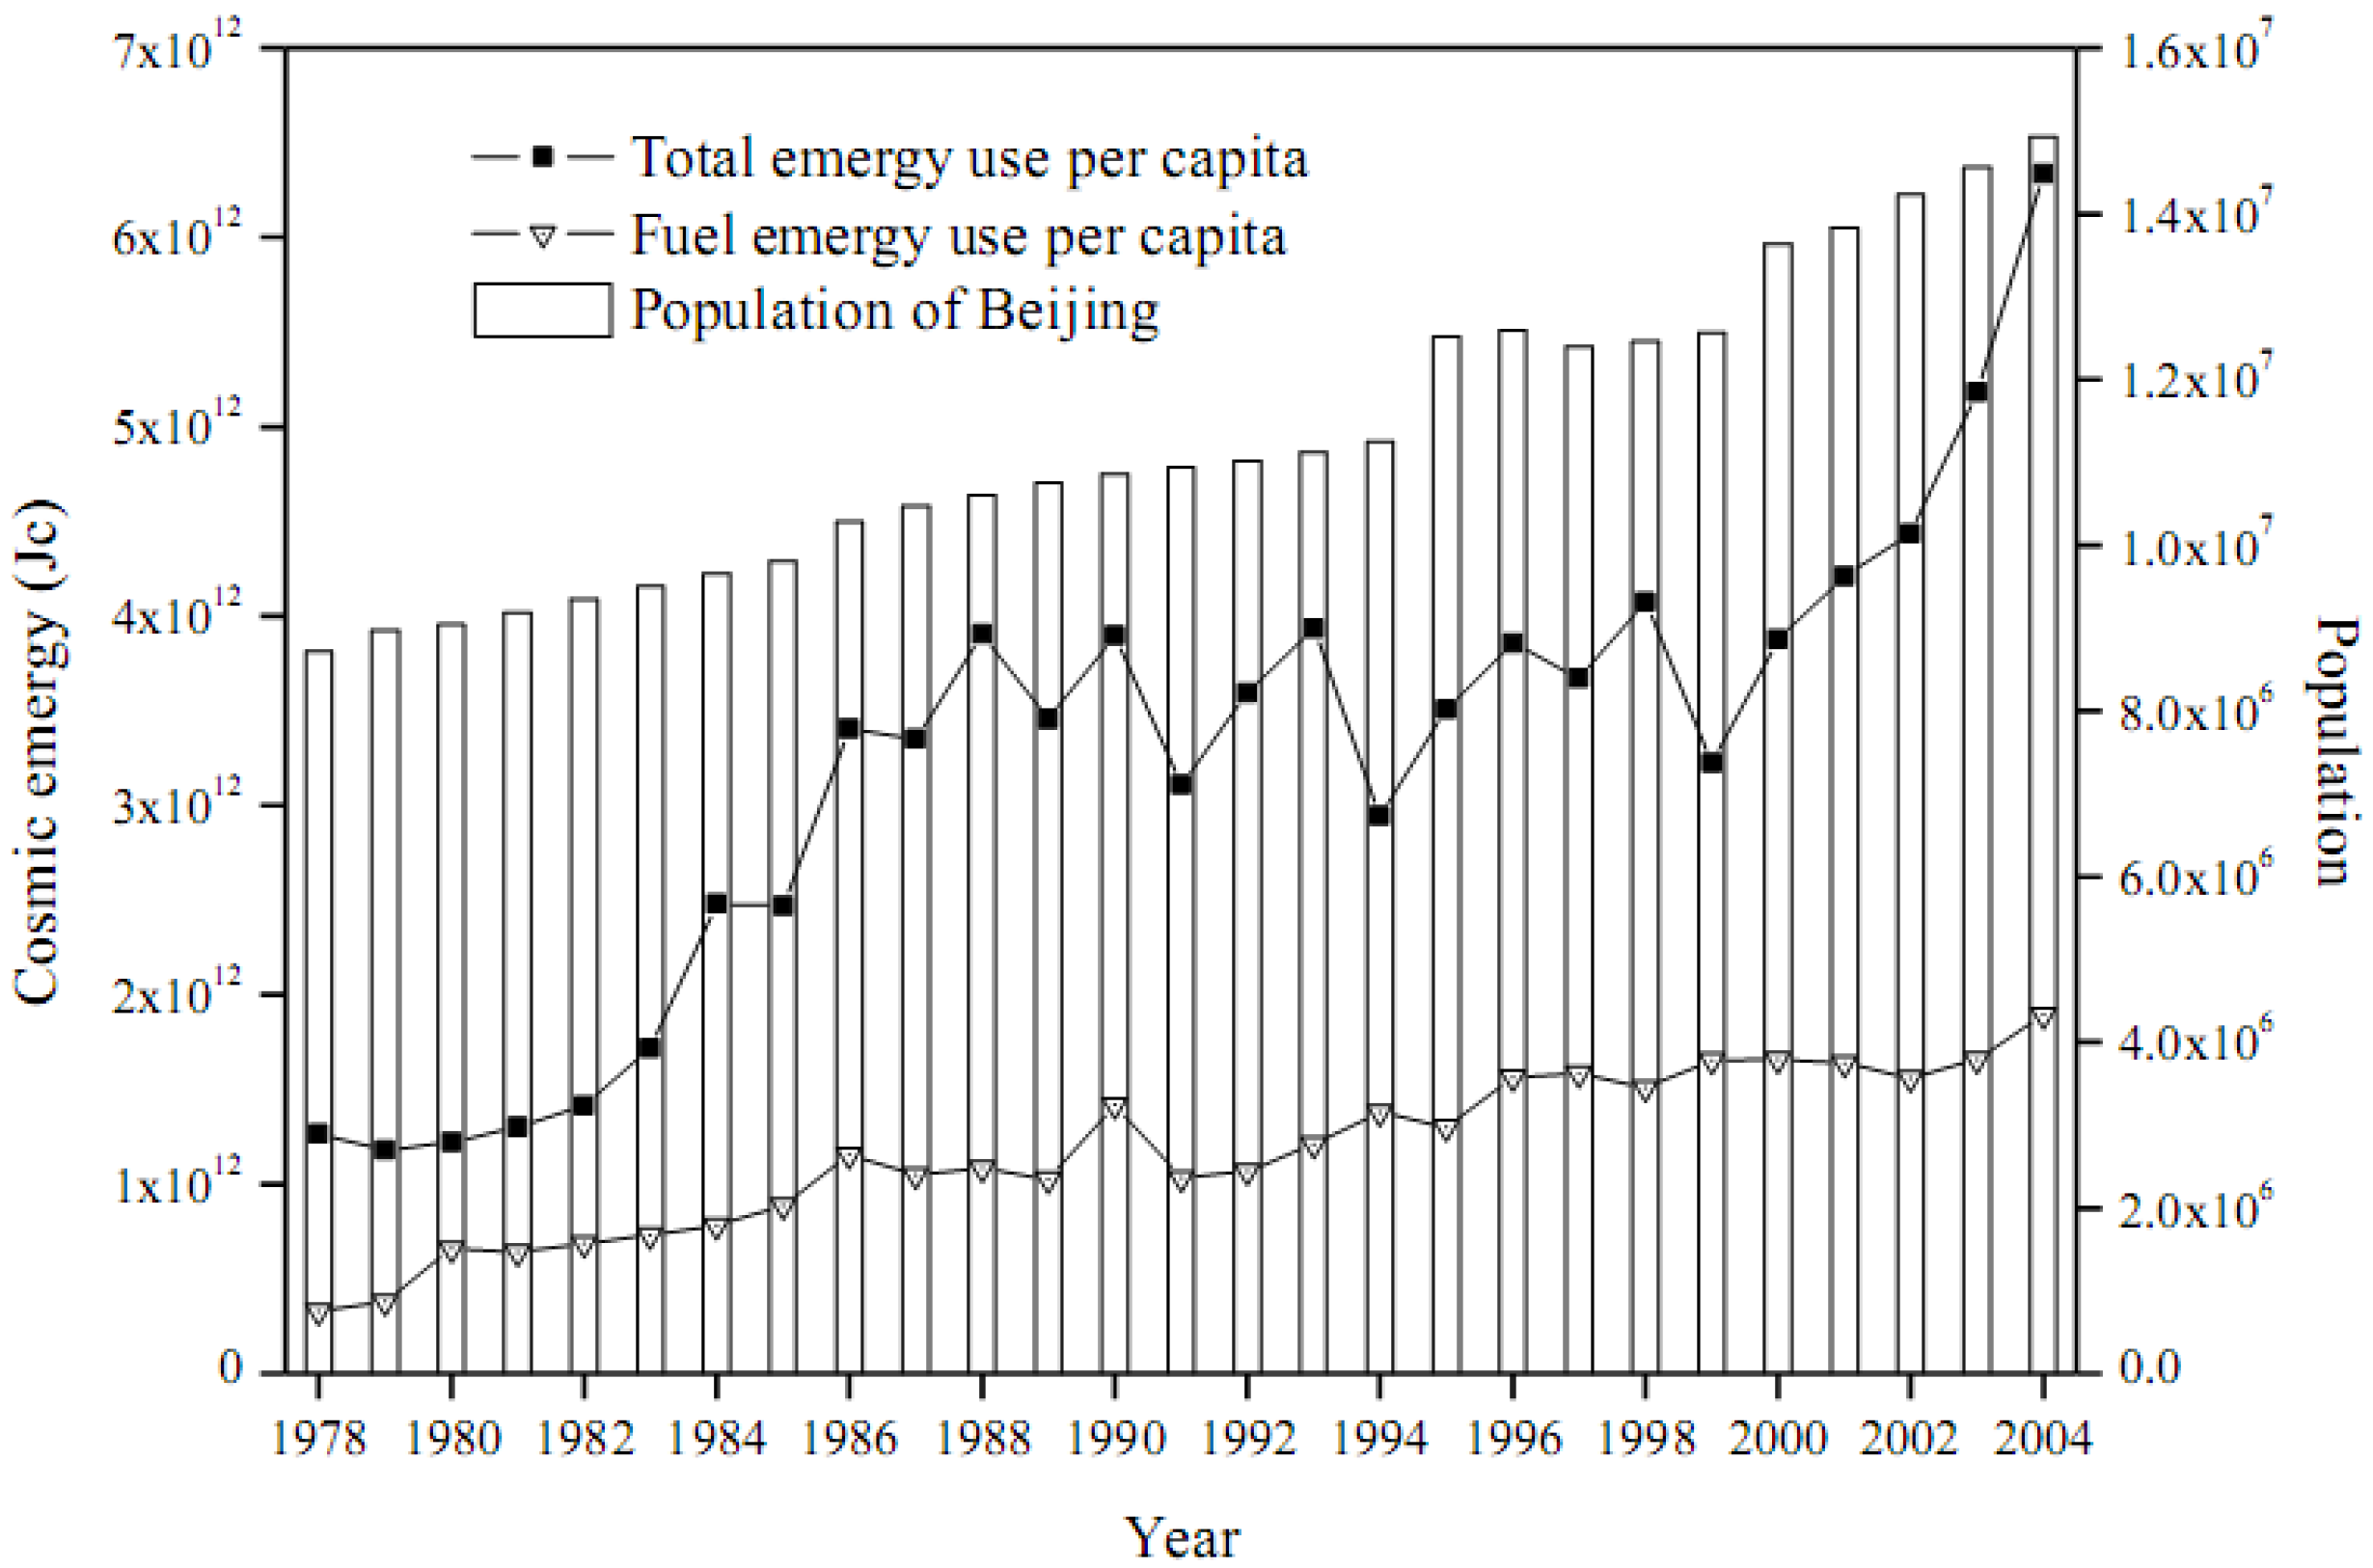
| 8 | Per capita emergy use (1012 Jc/cap.) | U/P | 1.26 | 1.22 | 2.47 | 3.90 | 3.51 | 3.88 | 6.33 |
| 9 | Per capita fuel emergy use (1011 Jc/cap.) | F/P | 3.3 | 6.6 | 8.9 | 14.2 | 13.0 | 16.6 | 19.0 |
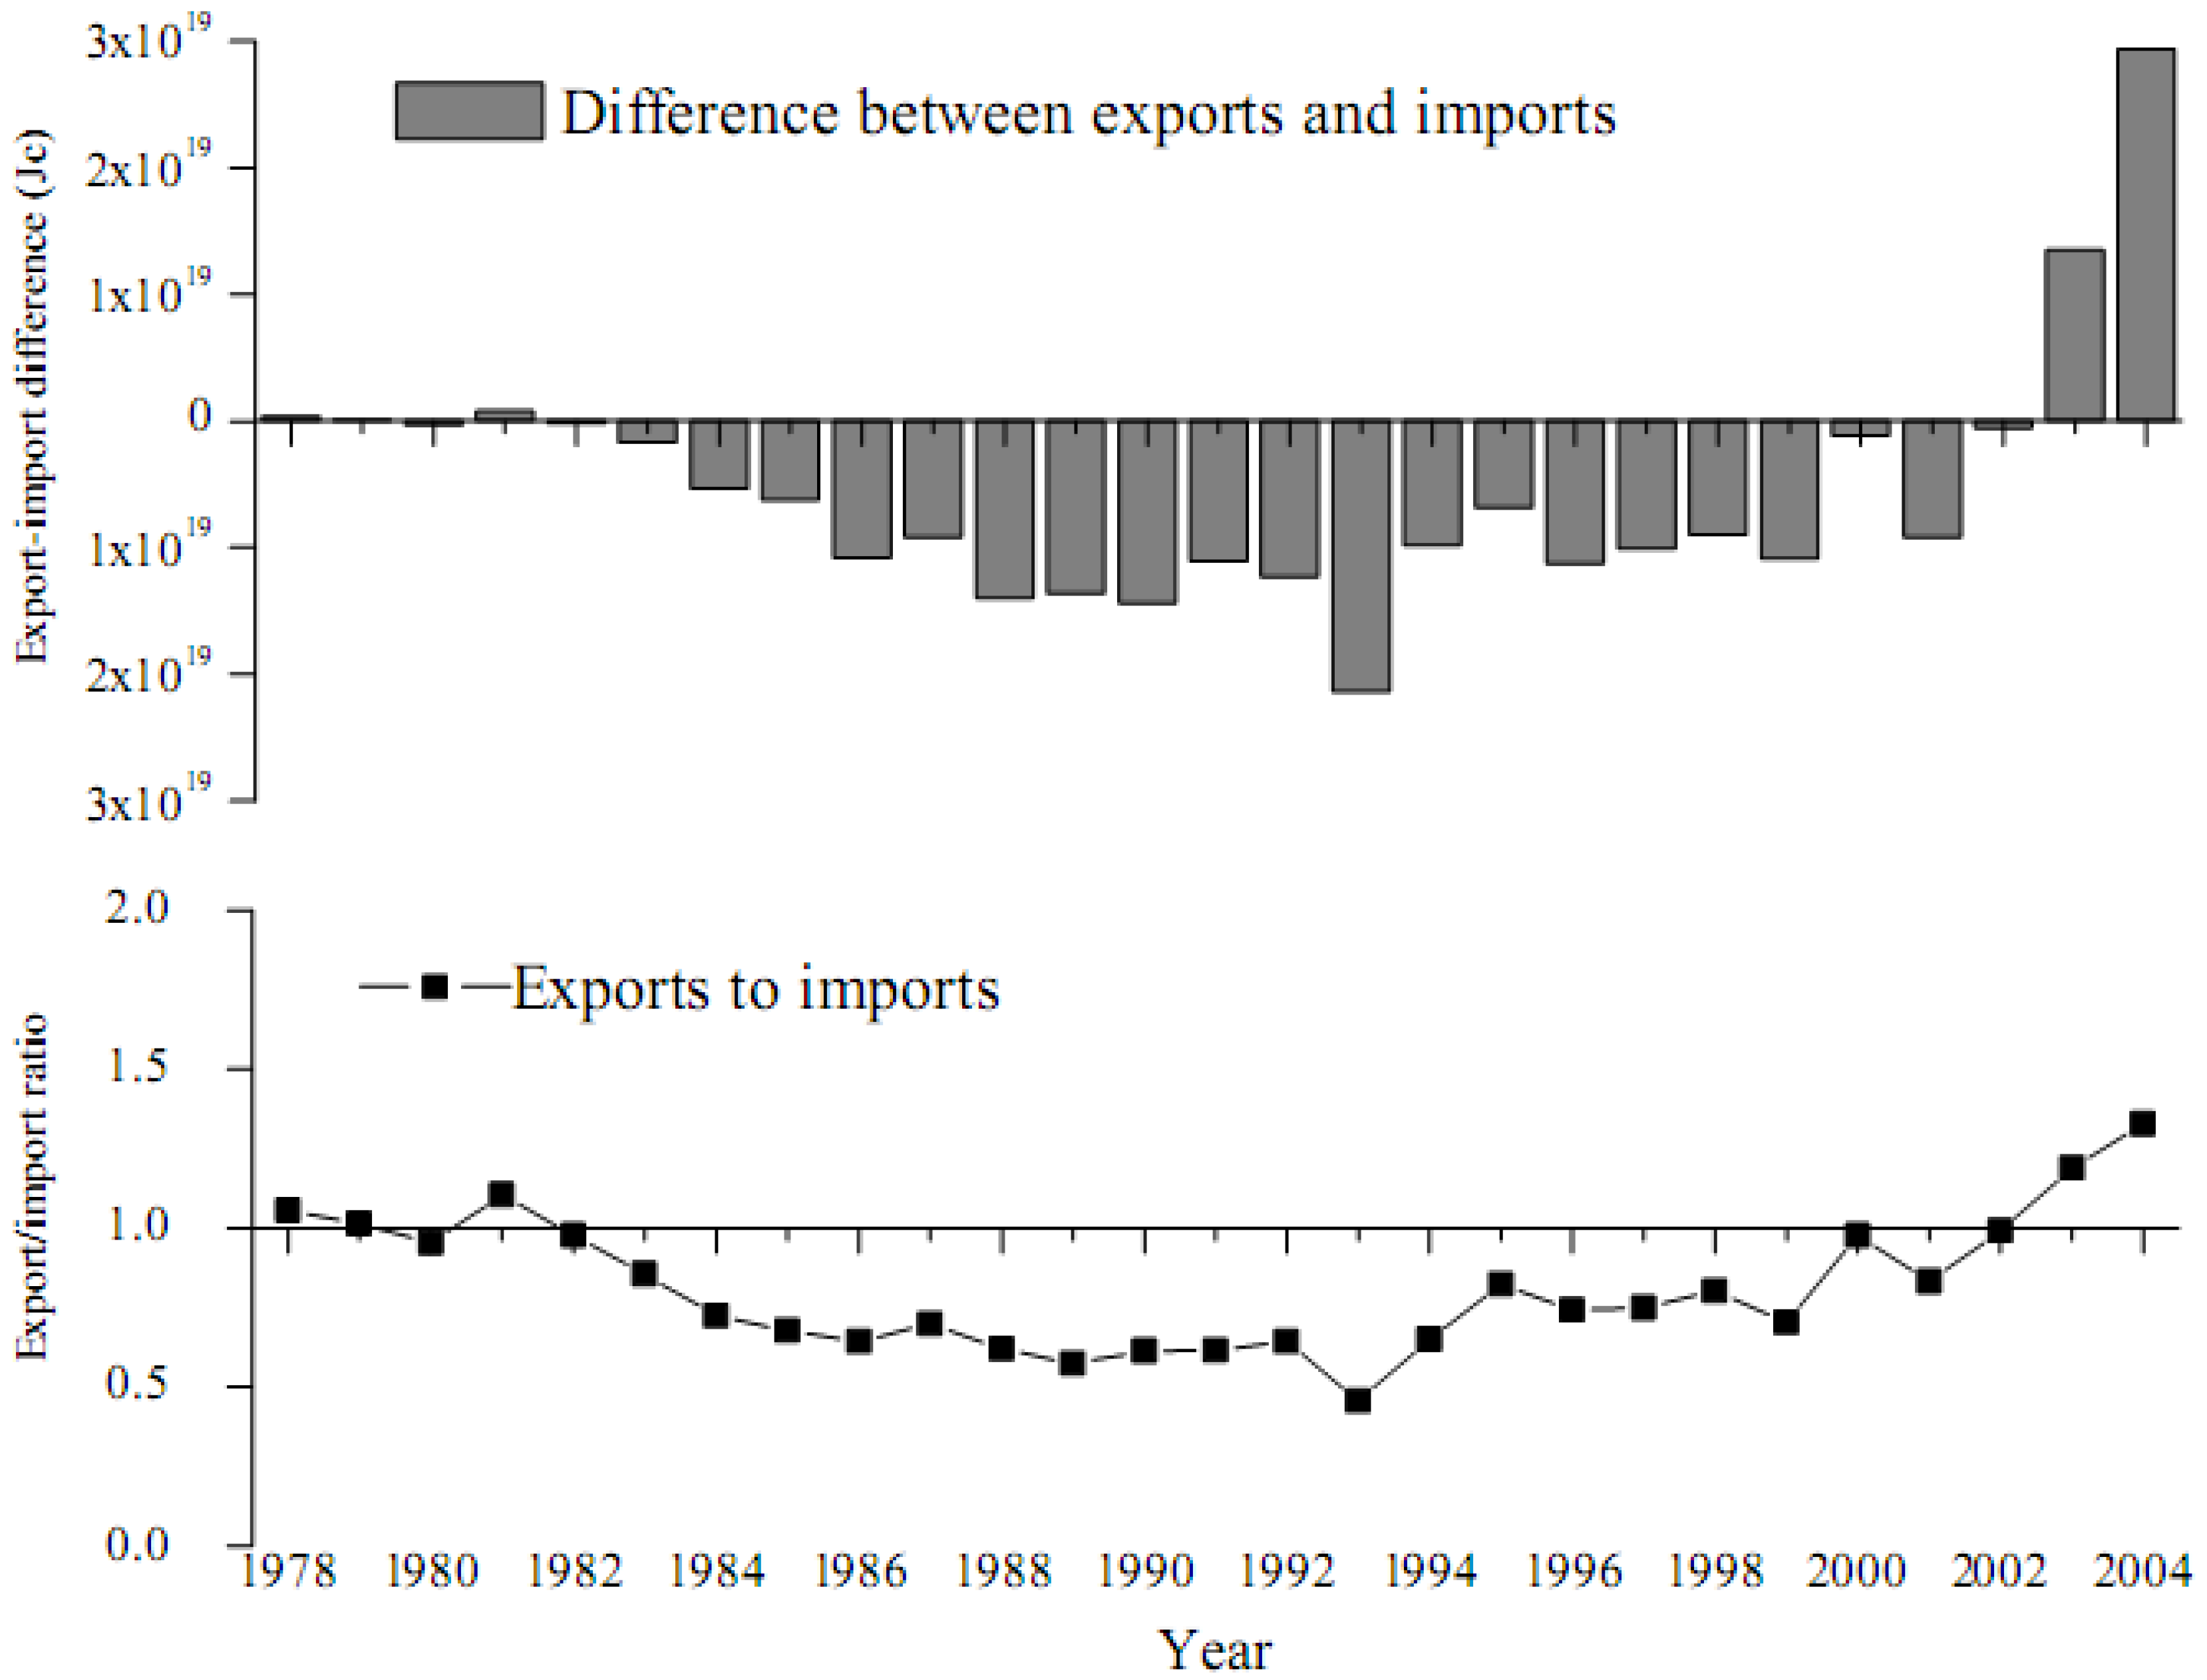
| 10 | Export-import difference | (P1E + B) -(P2I + G) | 3.50E + 17 | -3.30E + 17 | -6.20E + 1-8 | 1.44E + 1-9 | 6.90E + 1-8 | 1.10E + 18 | 2.92E + 19 |
| 11 | Export-import ratio | (P1E + B)/(P2I + G) | 1.05 | 0.95 | 0.68 | 0.61 | 0.82 | 0.98 | 1.33 |
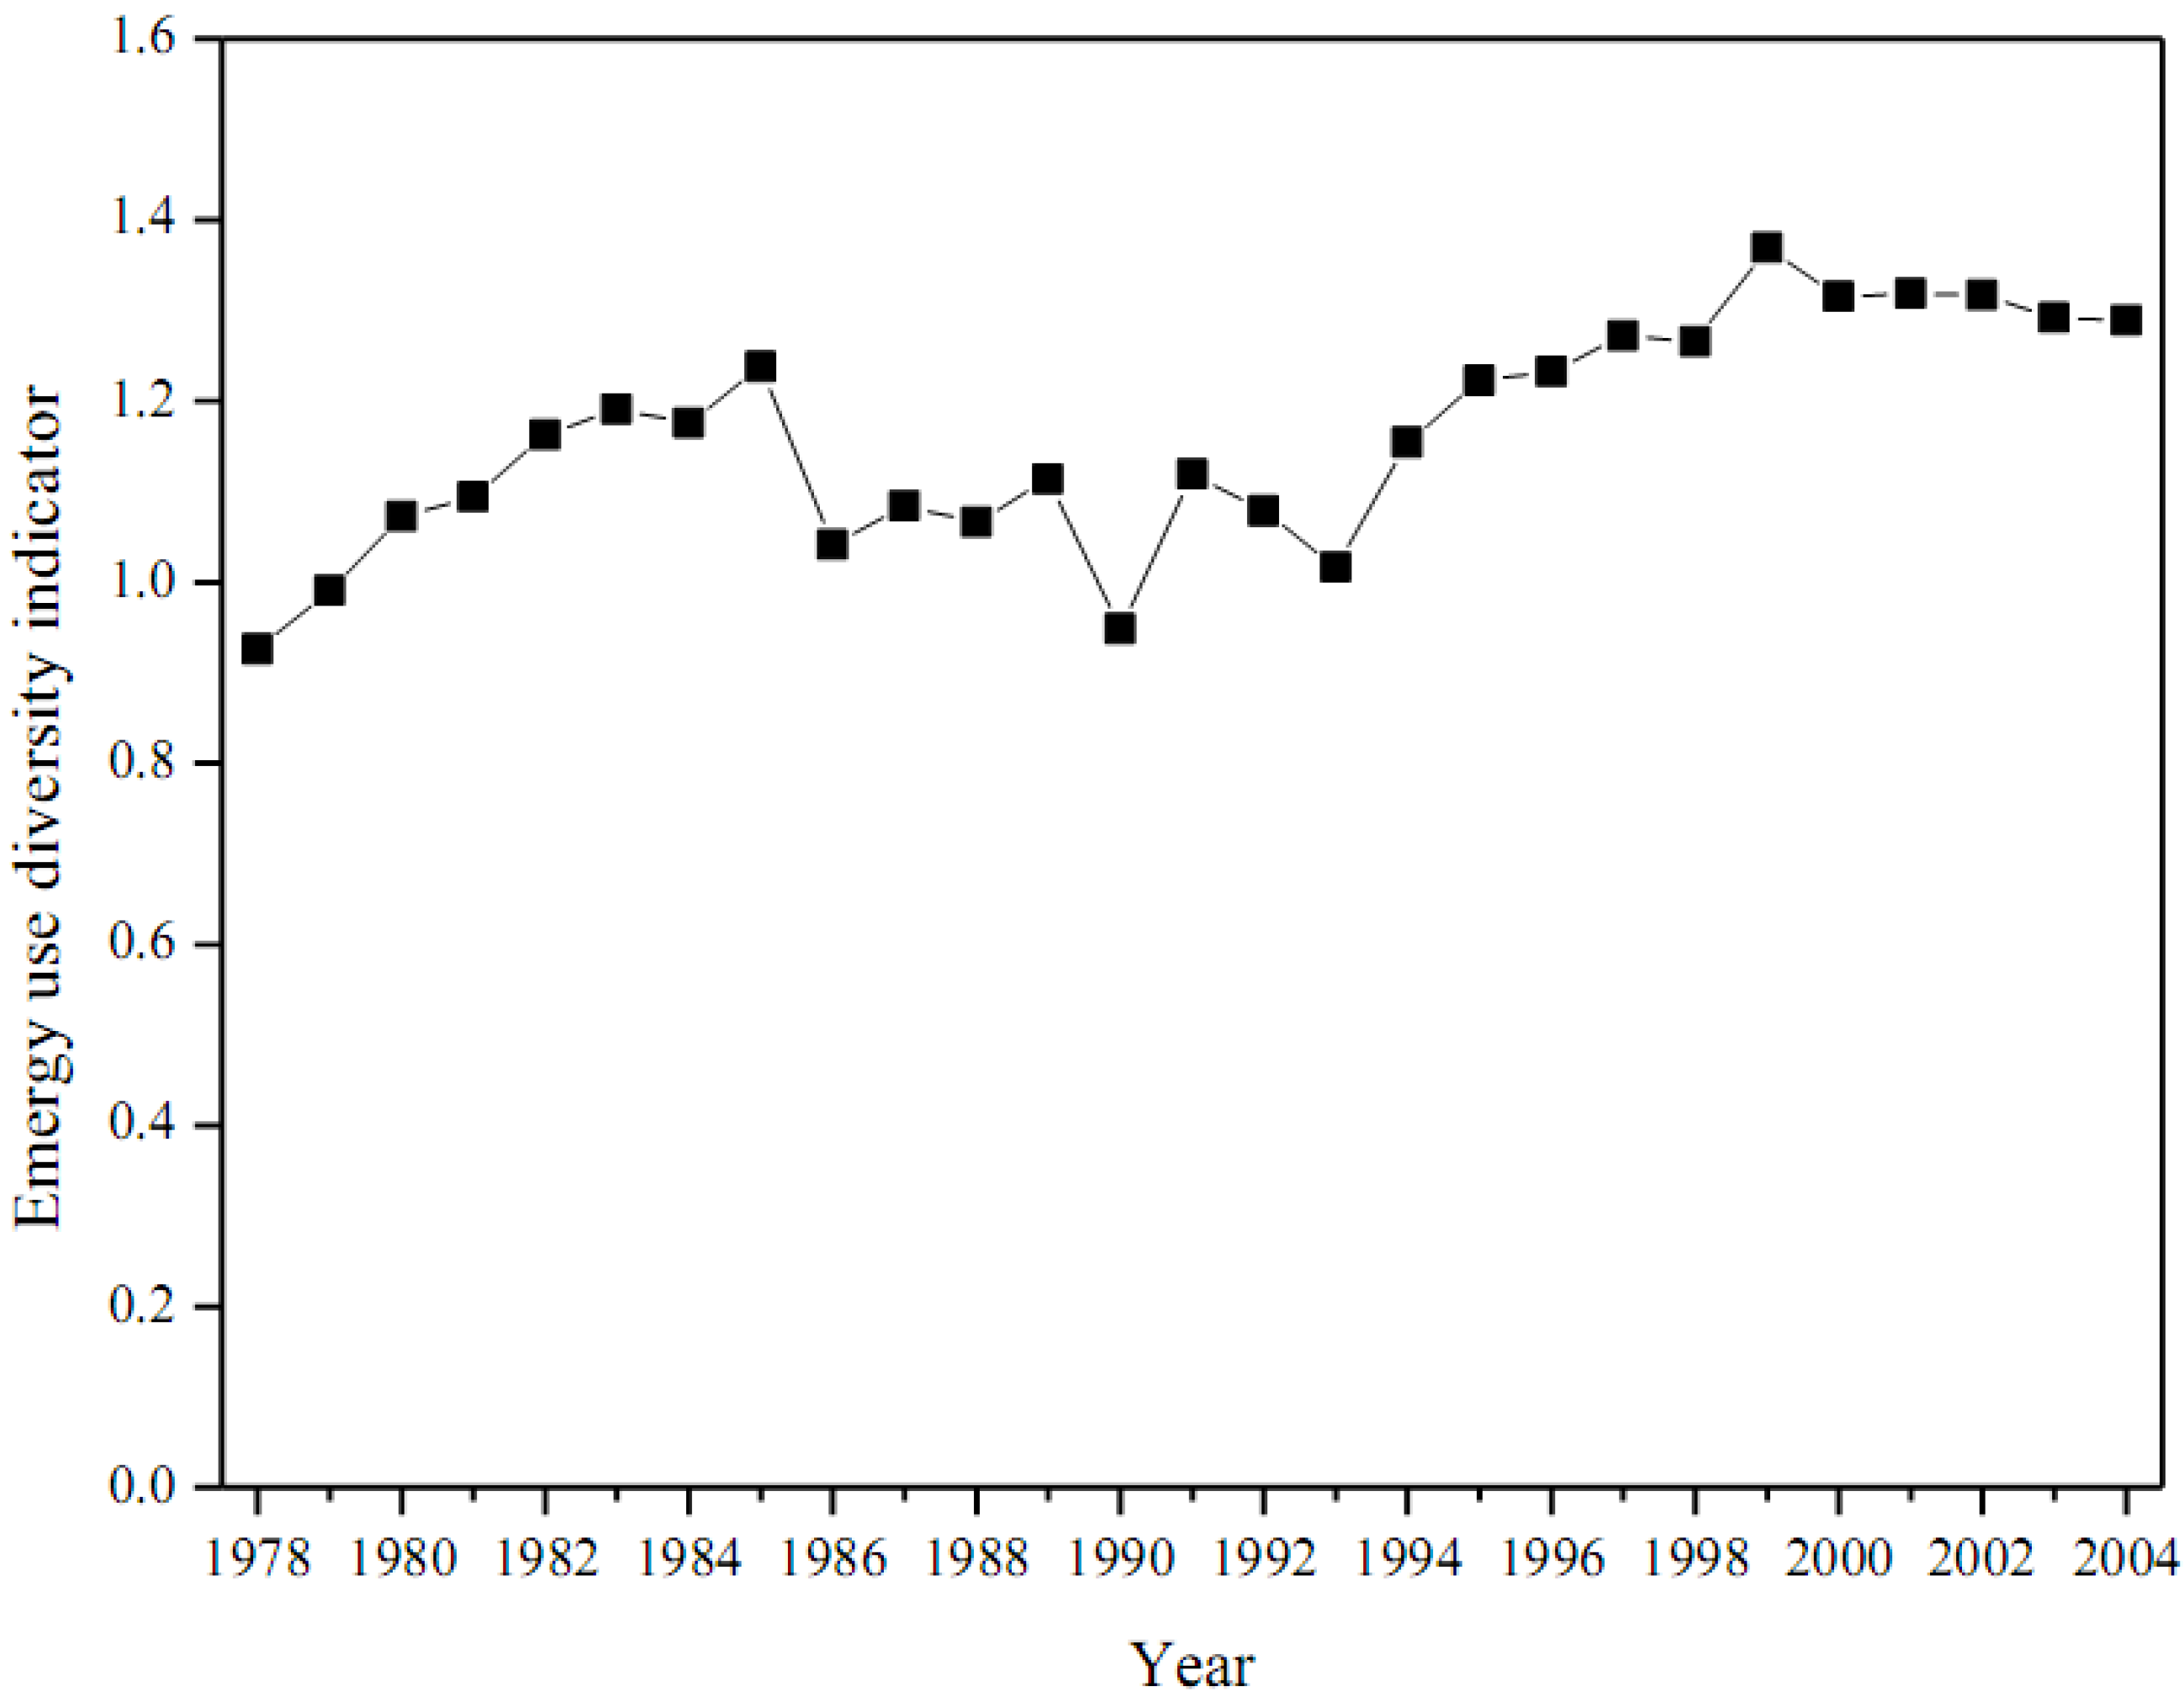
| 12 | Emergy use diversity | * | 0.93 | 1.07 | 1.24 | 0.95 | 1.22 | 1.32 | 1.29 |
| Environmental impacts | |||||||||
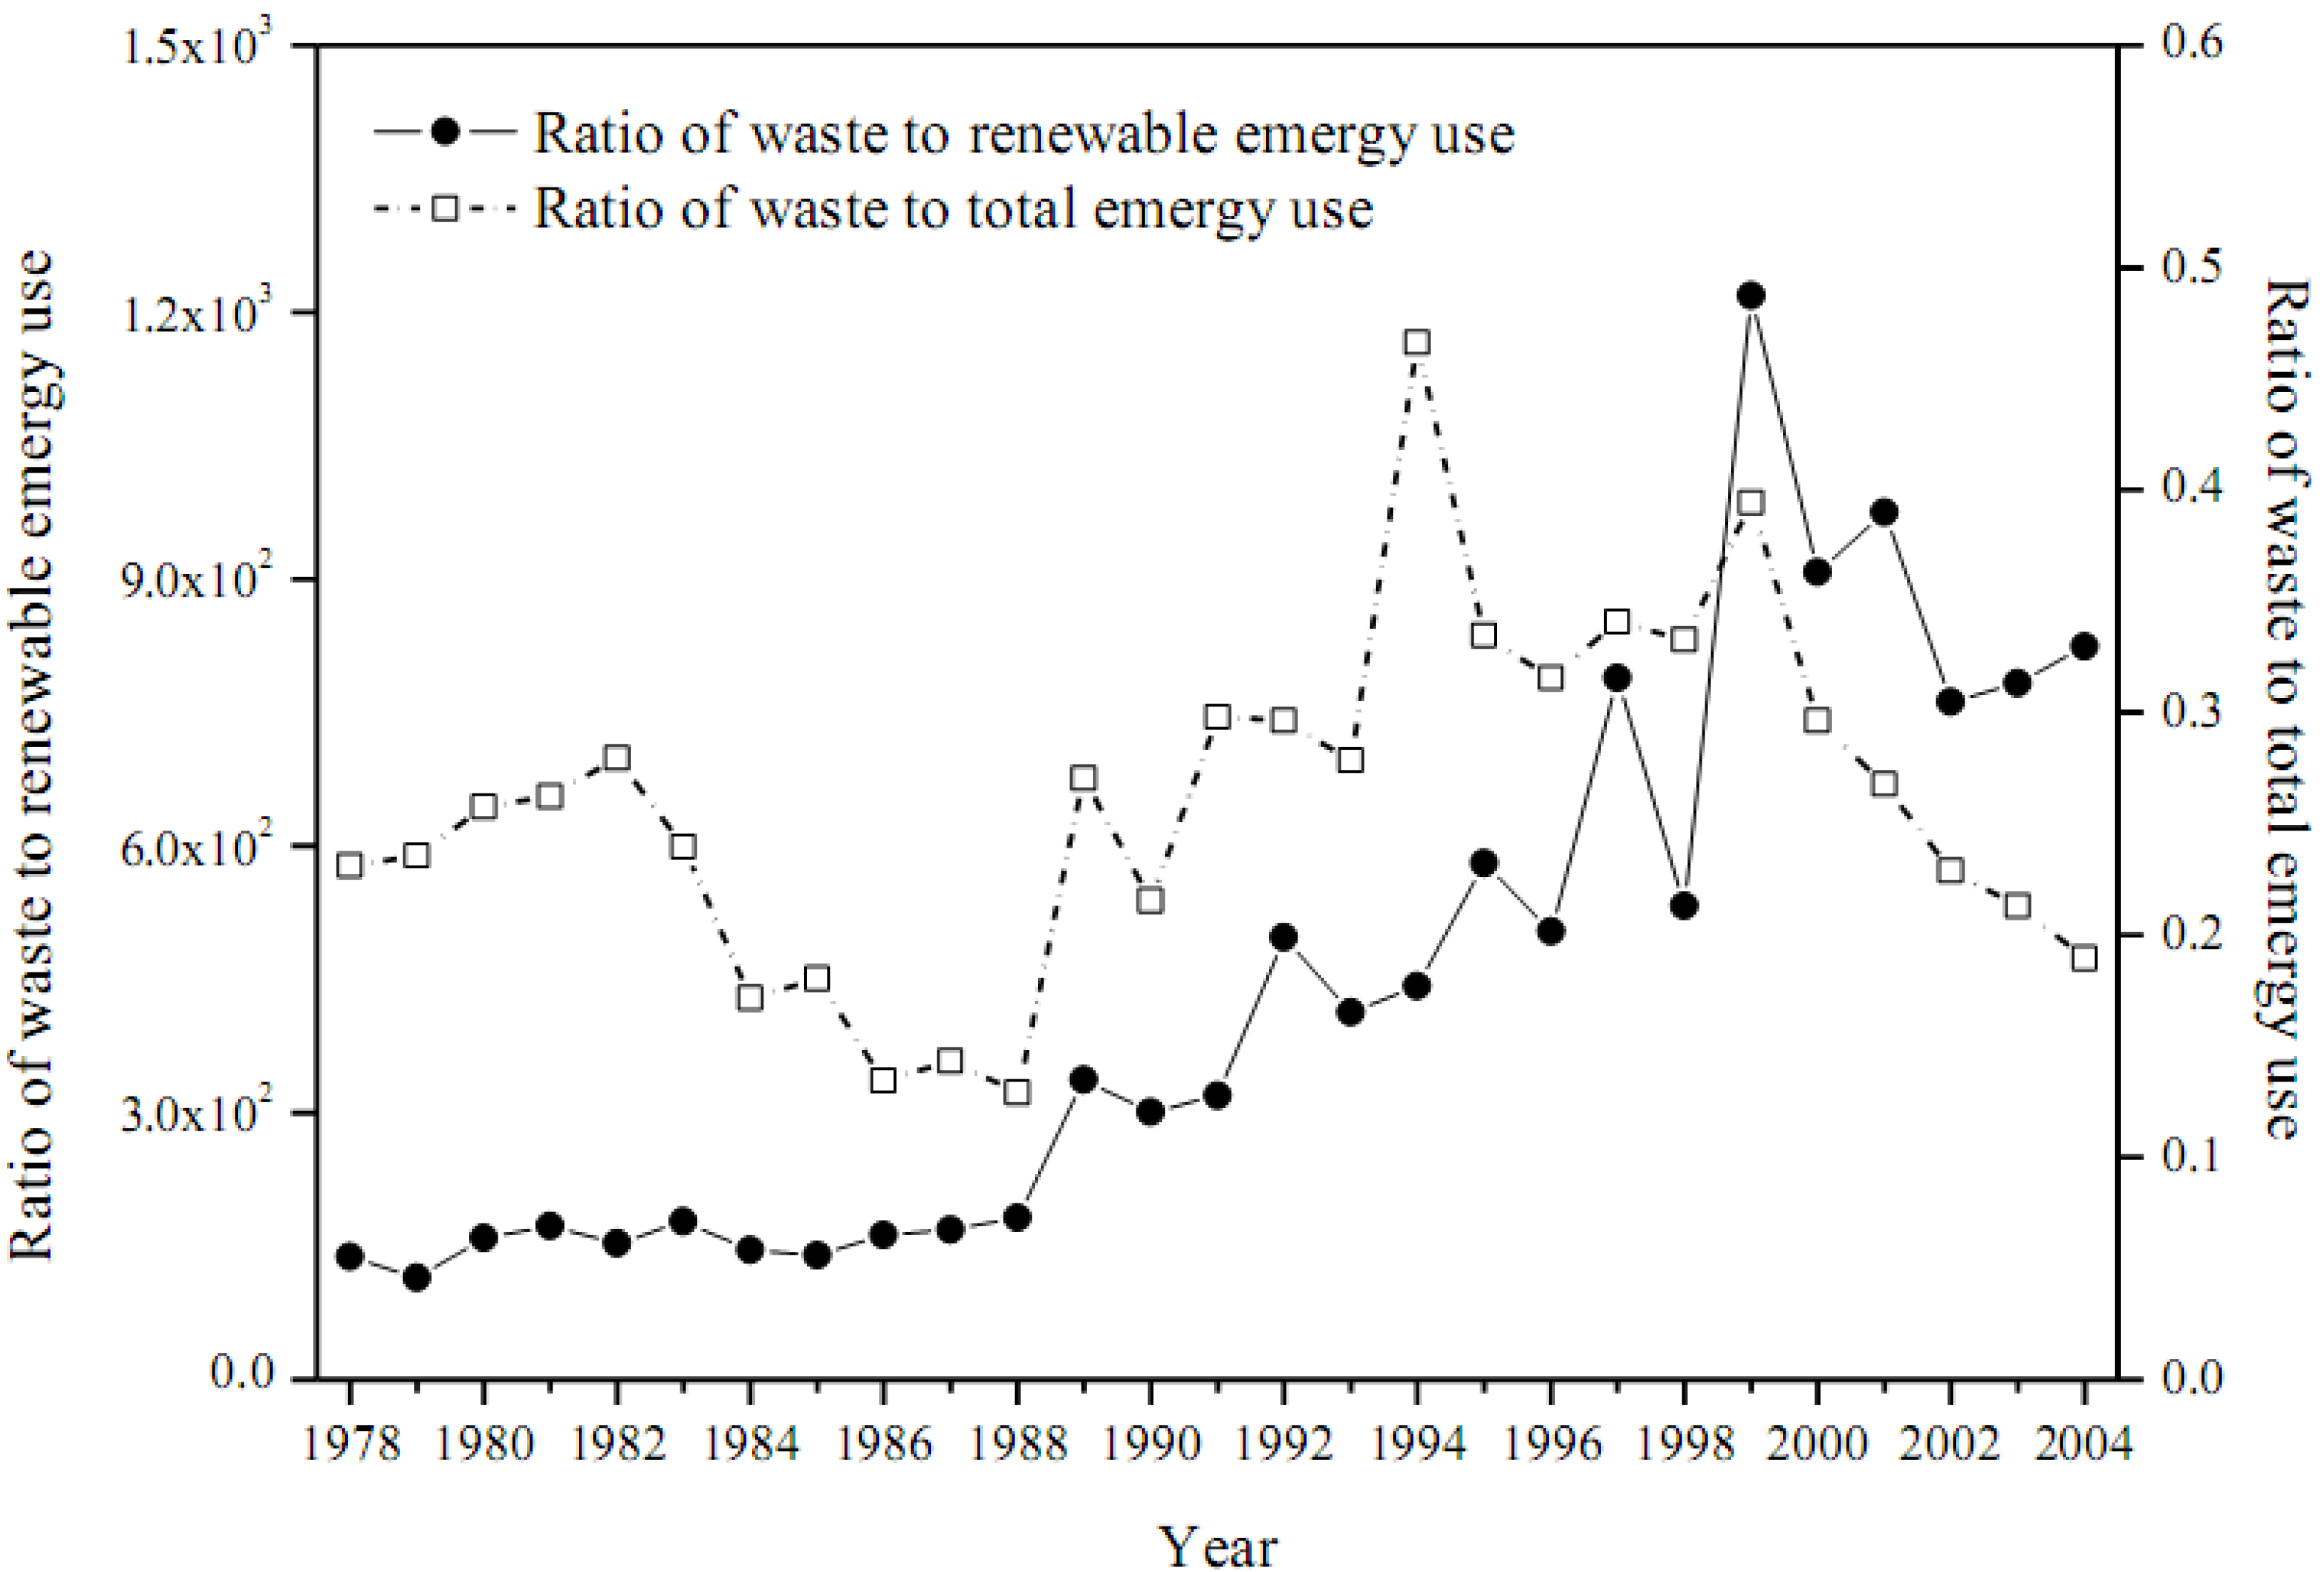
| 13 | Waste to renewable emergy use ratio | W/R | 138.5 | 159.0 | 139.9 | 300.9 | 580.3 | 907.3 | 824.2 |
| 14 | Waste to total emergy use ratio | W/U | 0.231 | 0.257 | 0.180 | 0.215 | 0.335 | 0.296 | 0.190 |
| Degree of exploitation and economic efficiency | |||||||||
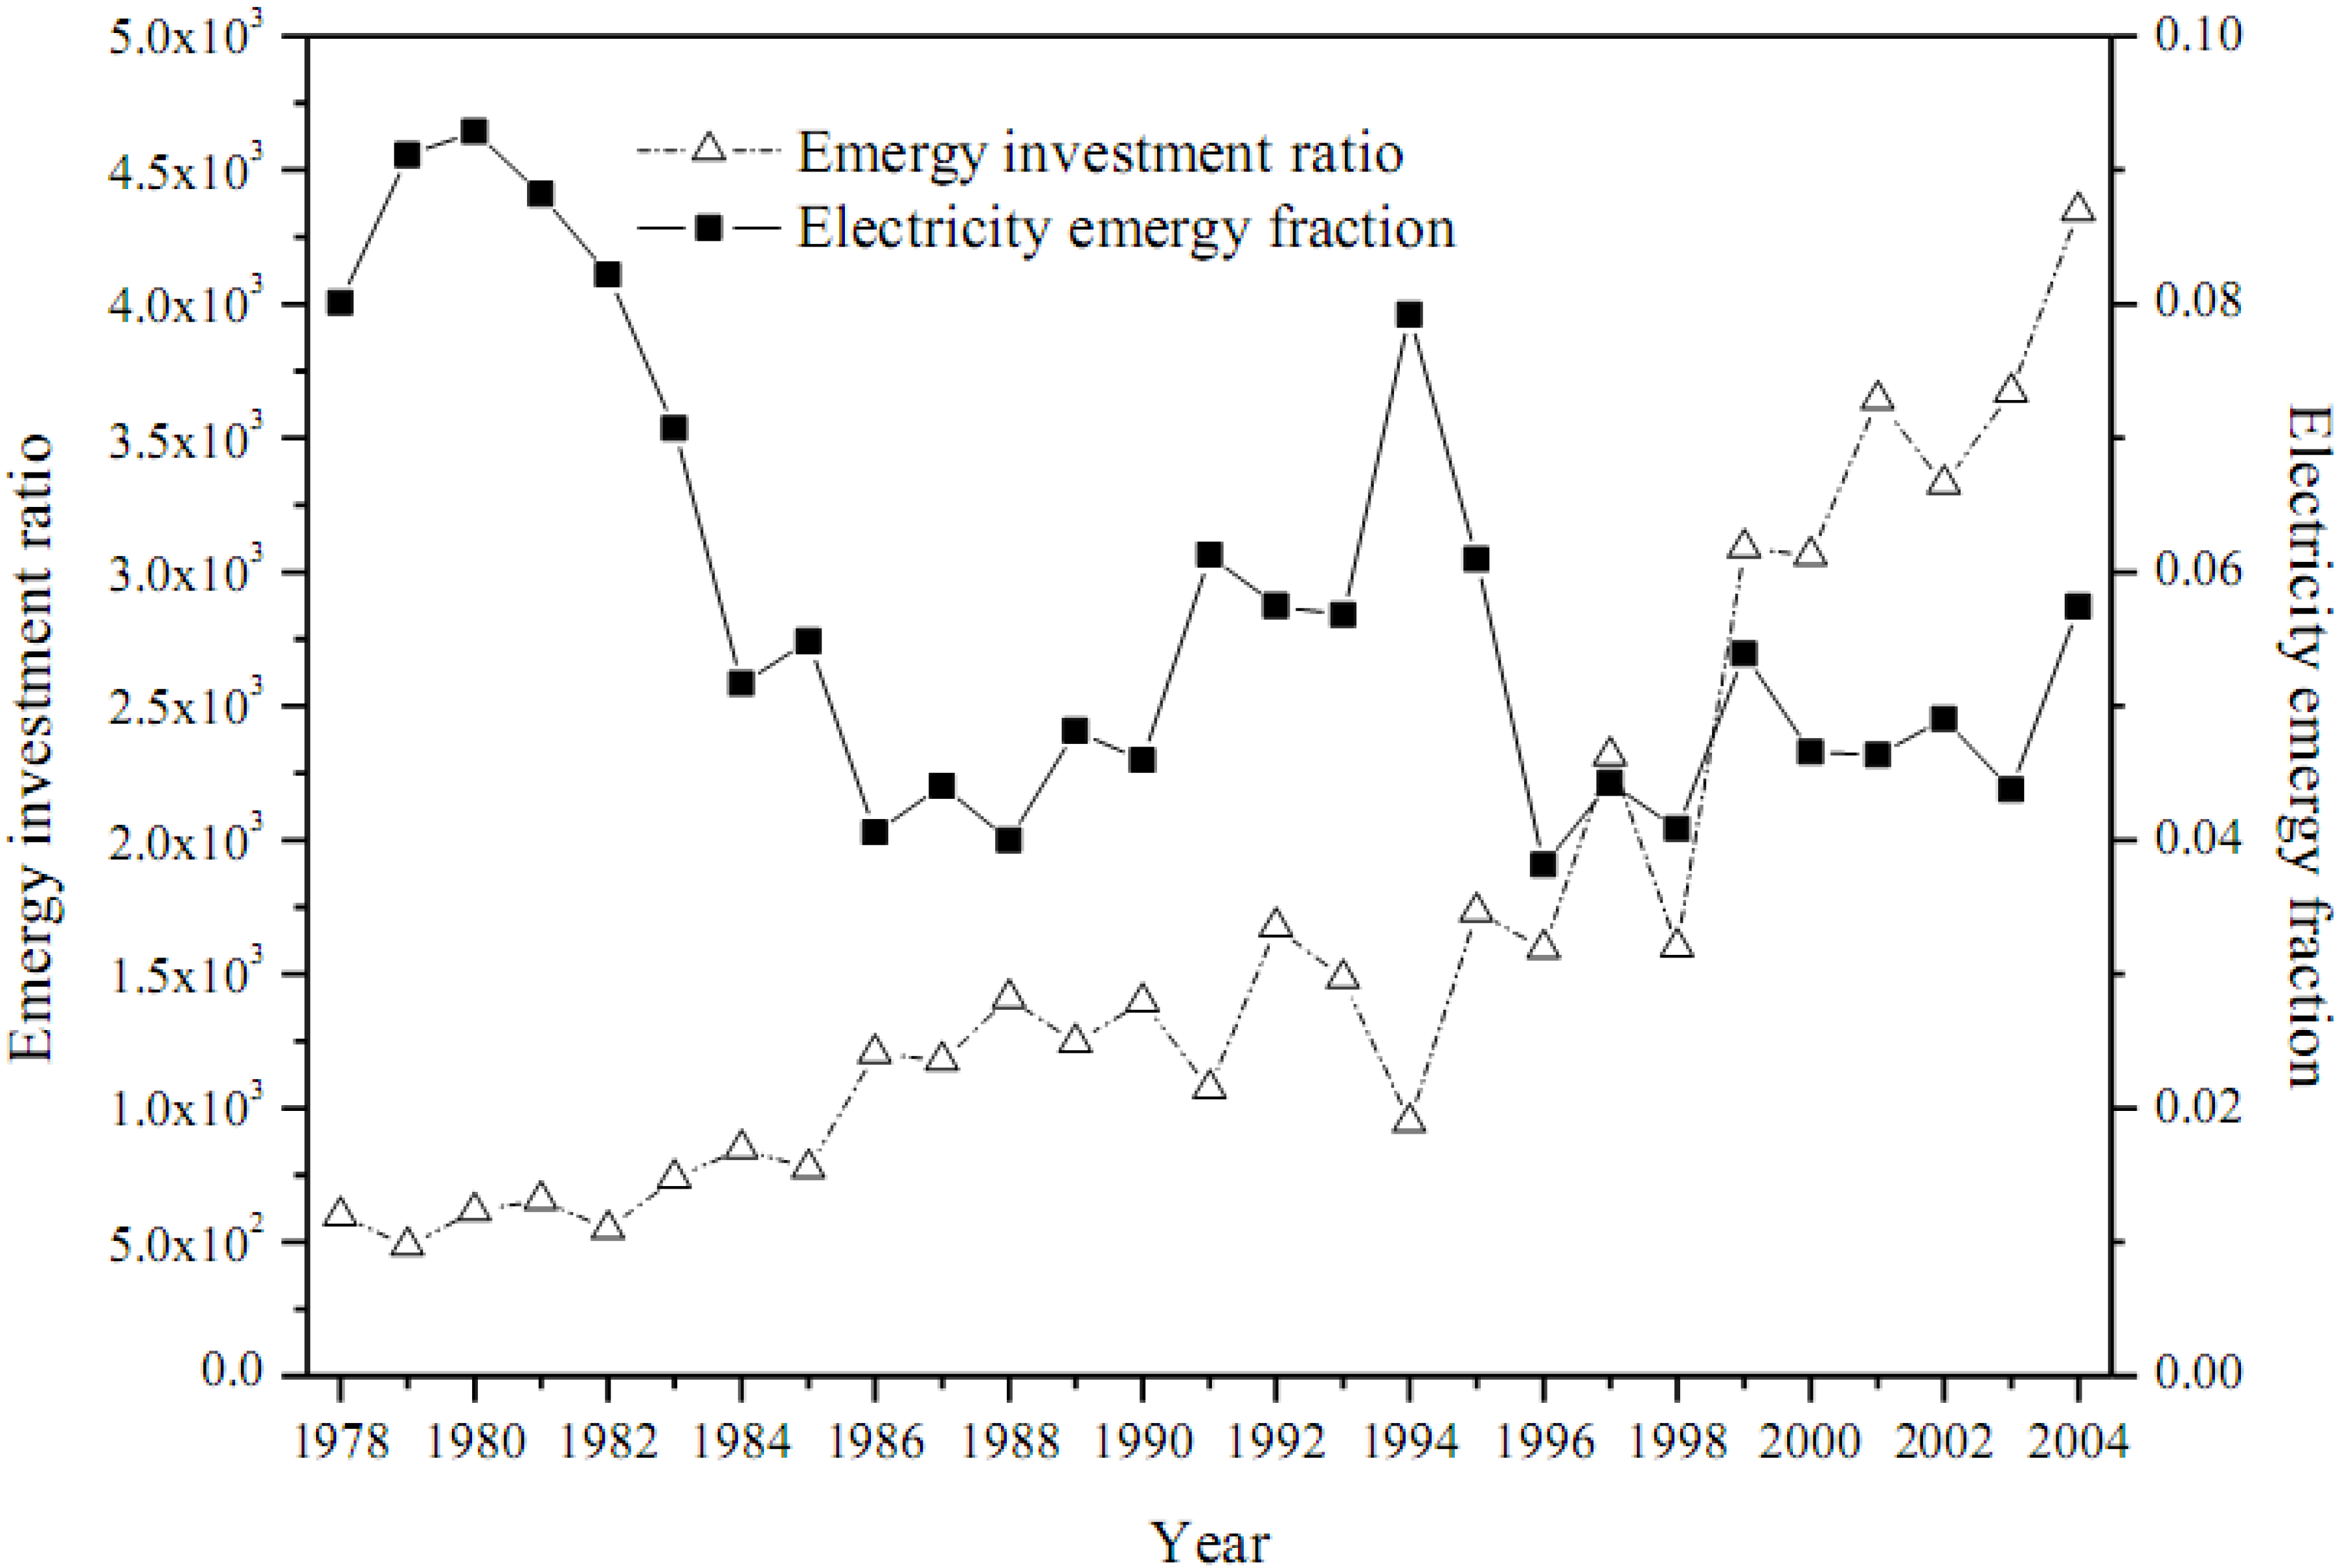
| 15 | Electricity emergy fraction (%) | (el)/U | 8.01 | 9.29 | 5.48 | 4.60 | 6.10 | 4.66 | 5.74 |
| 16 | Emergy investment ratio | (G + P2I + N0 + N1)/R | 597.5 | 616.5 | 774.9 | 1396.4 | 1732.2 | 3061.6 | 4348.4 |
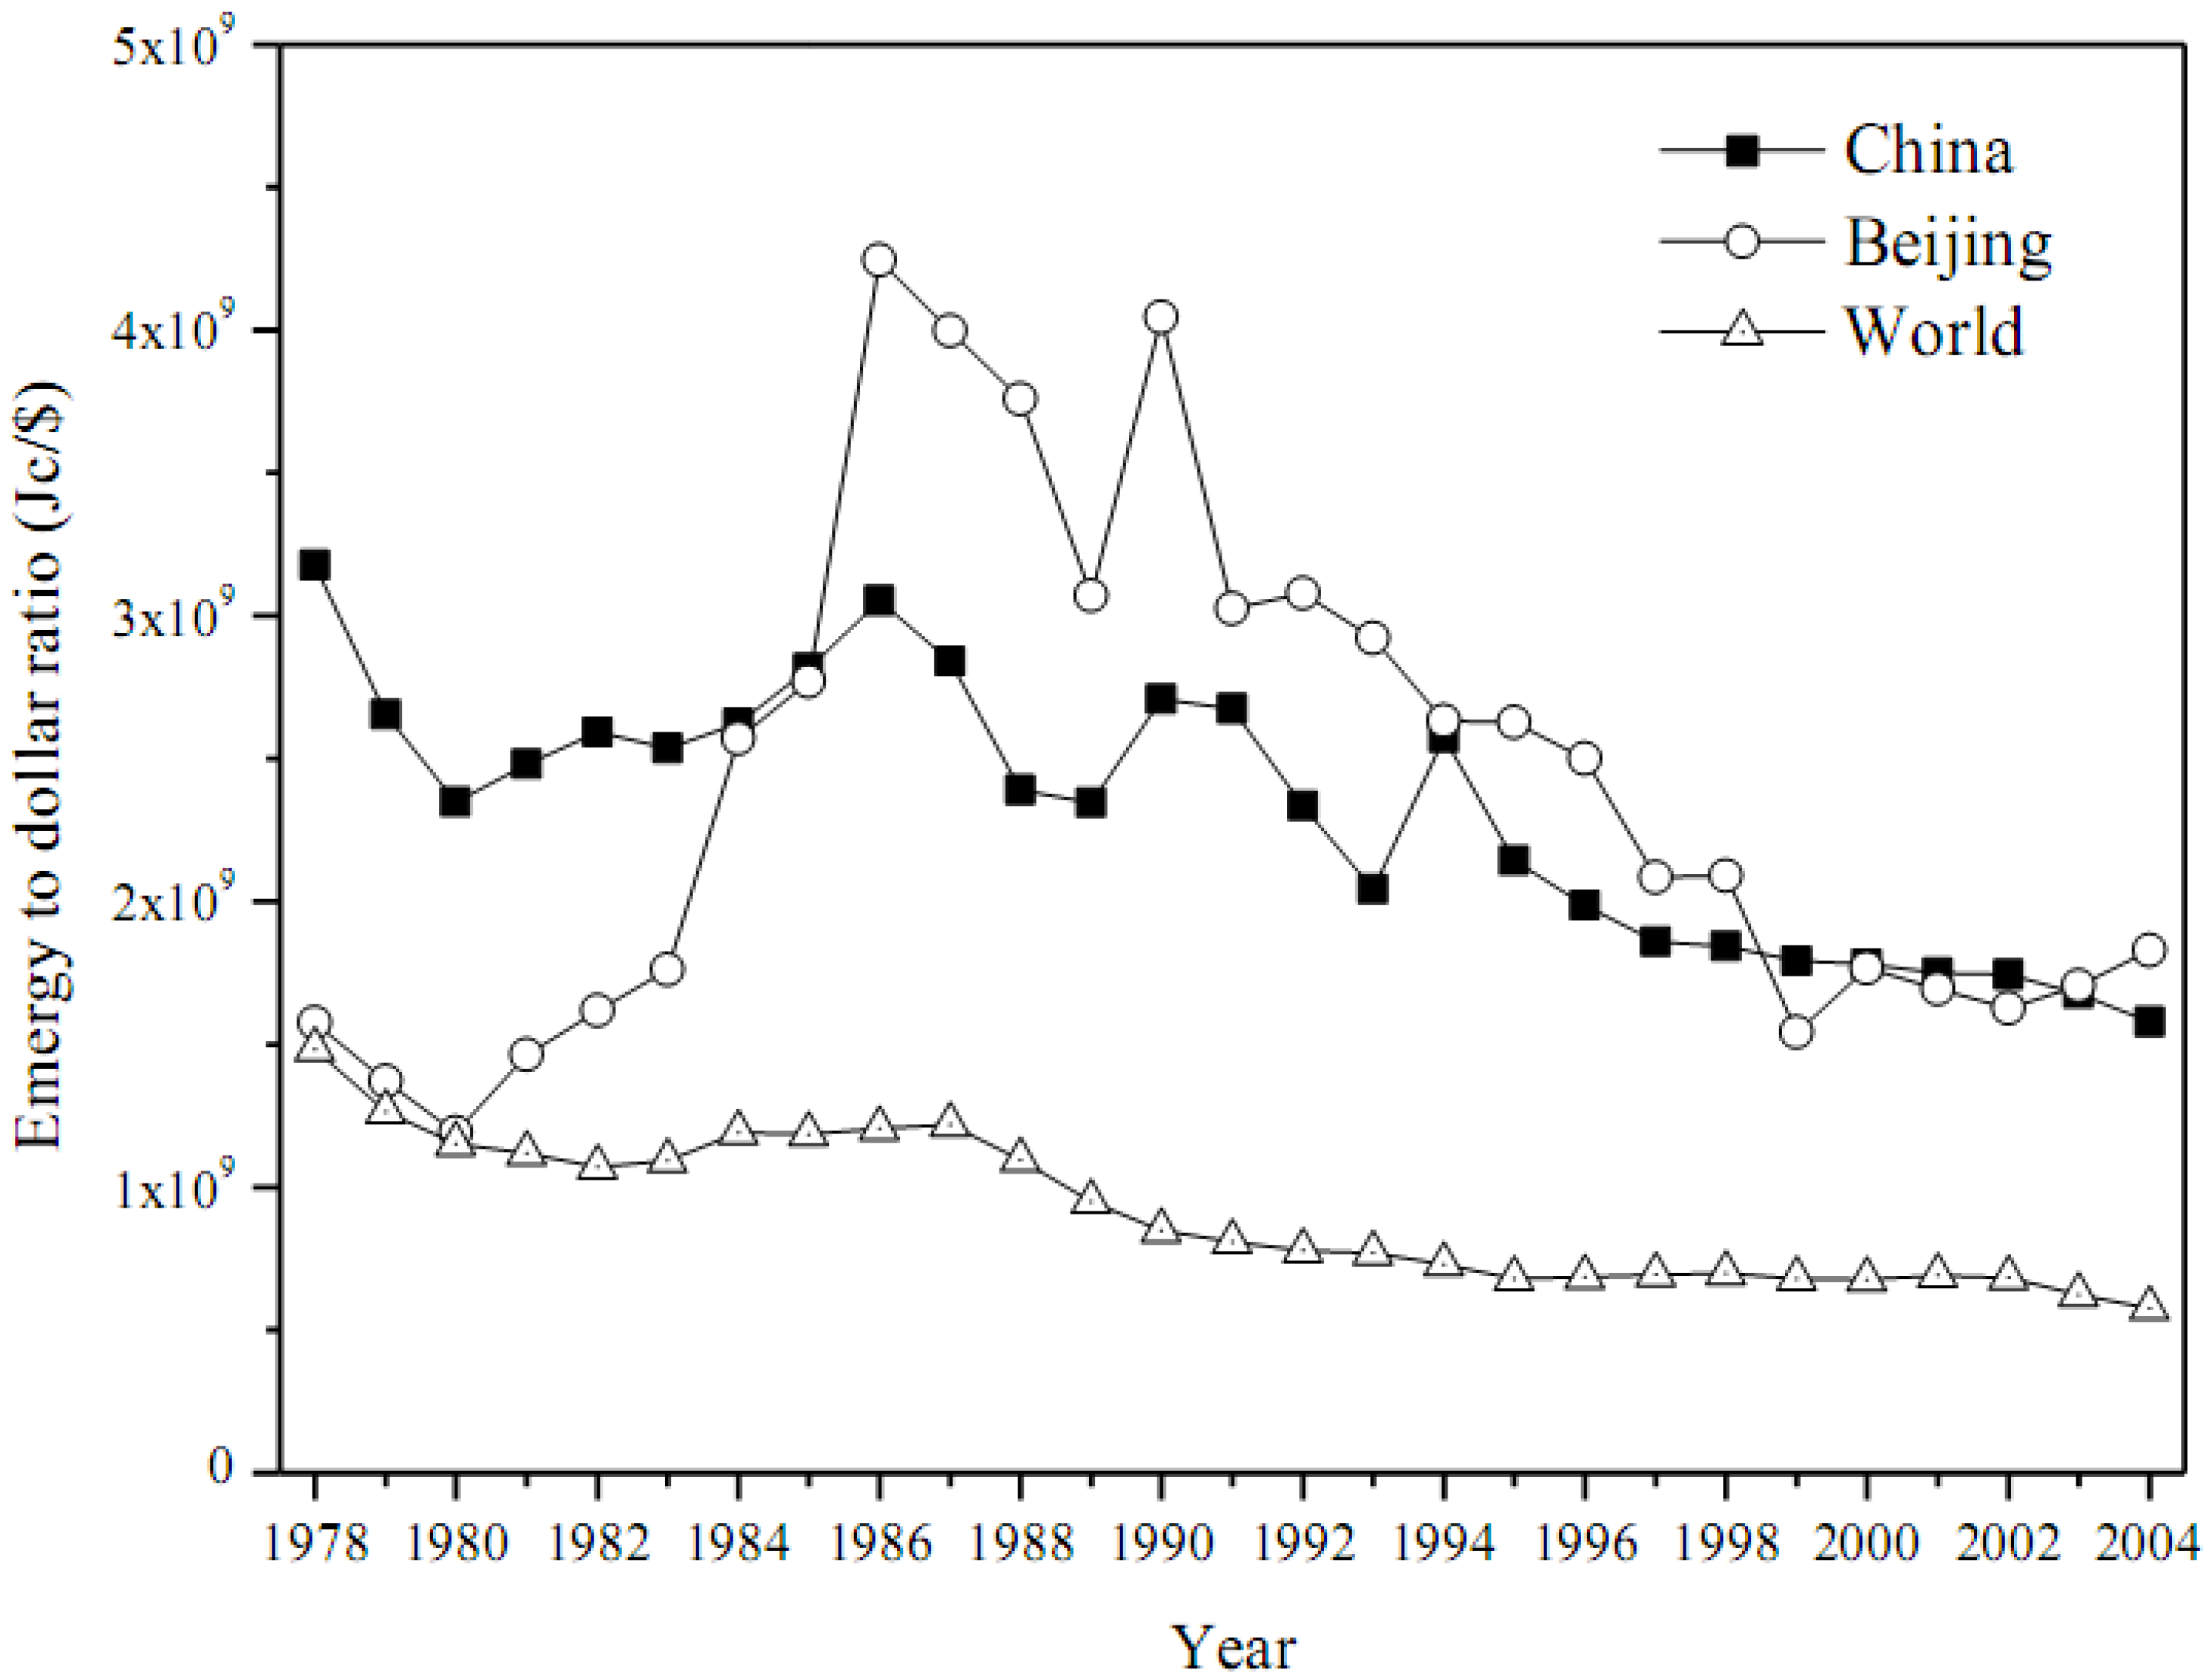
| 17 | Emdollar ratio(109 Jc/US$) | U/GNP | 1.58E + 09 | 1.19E + 09 | 2.77E + 09 | 4.04E + 09 | 2.63E + 09 | 1.77E + 09 | 1.83E + 09 |
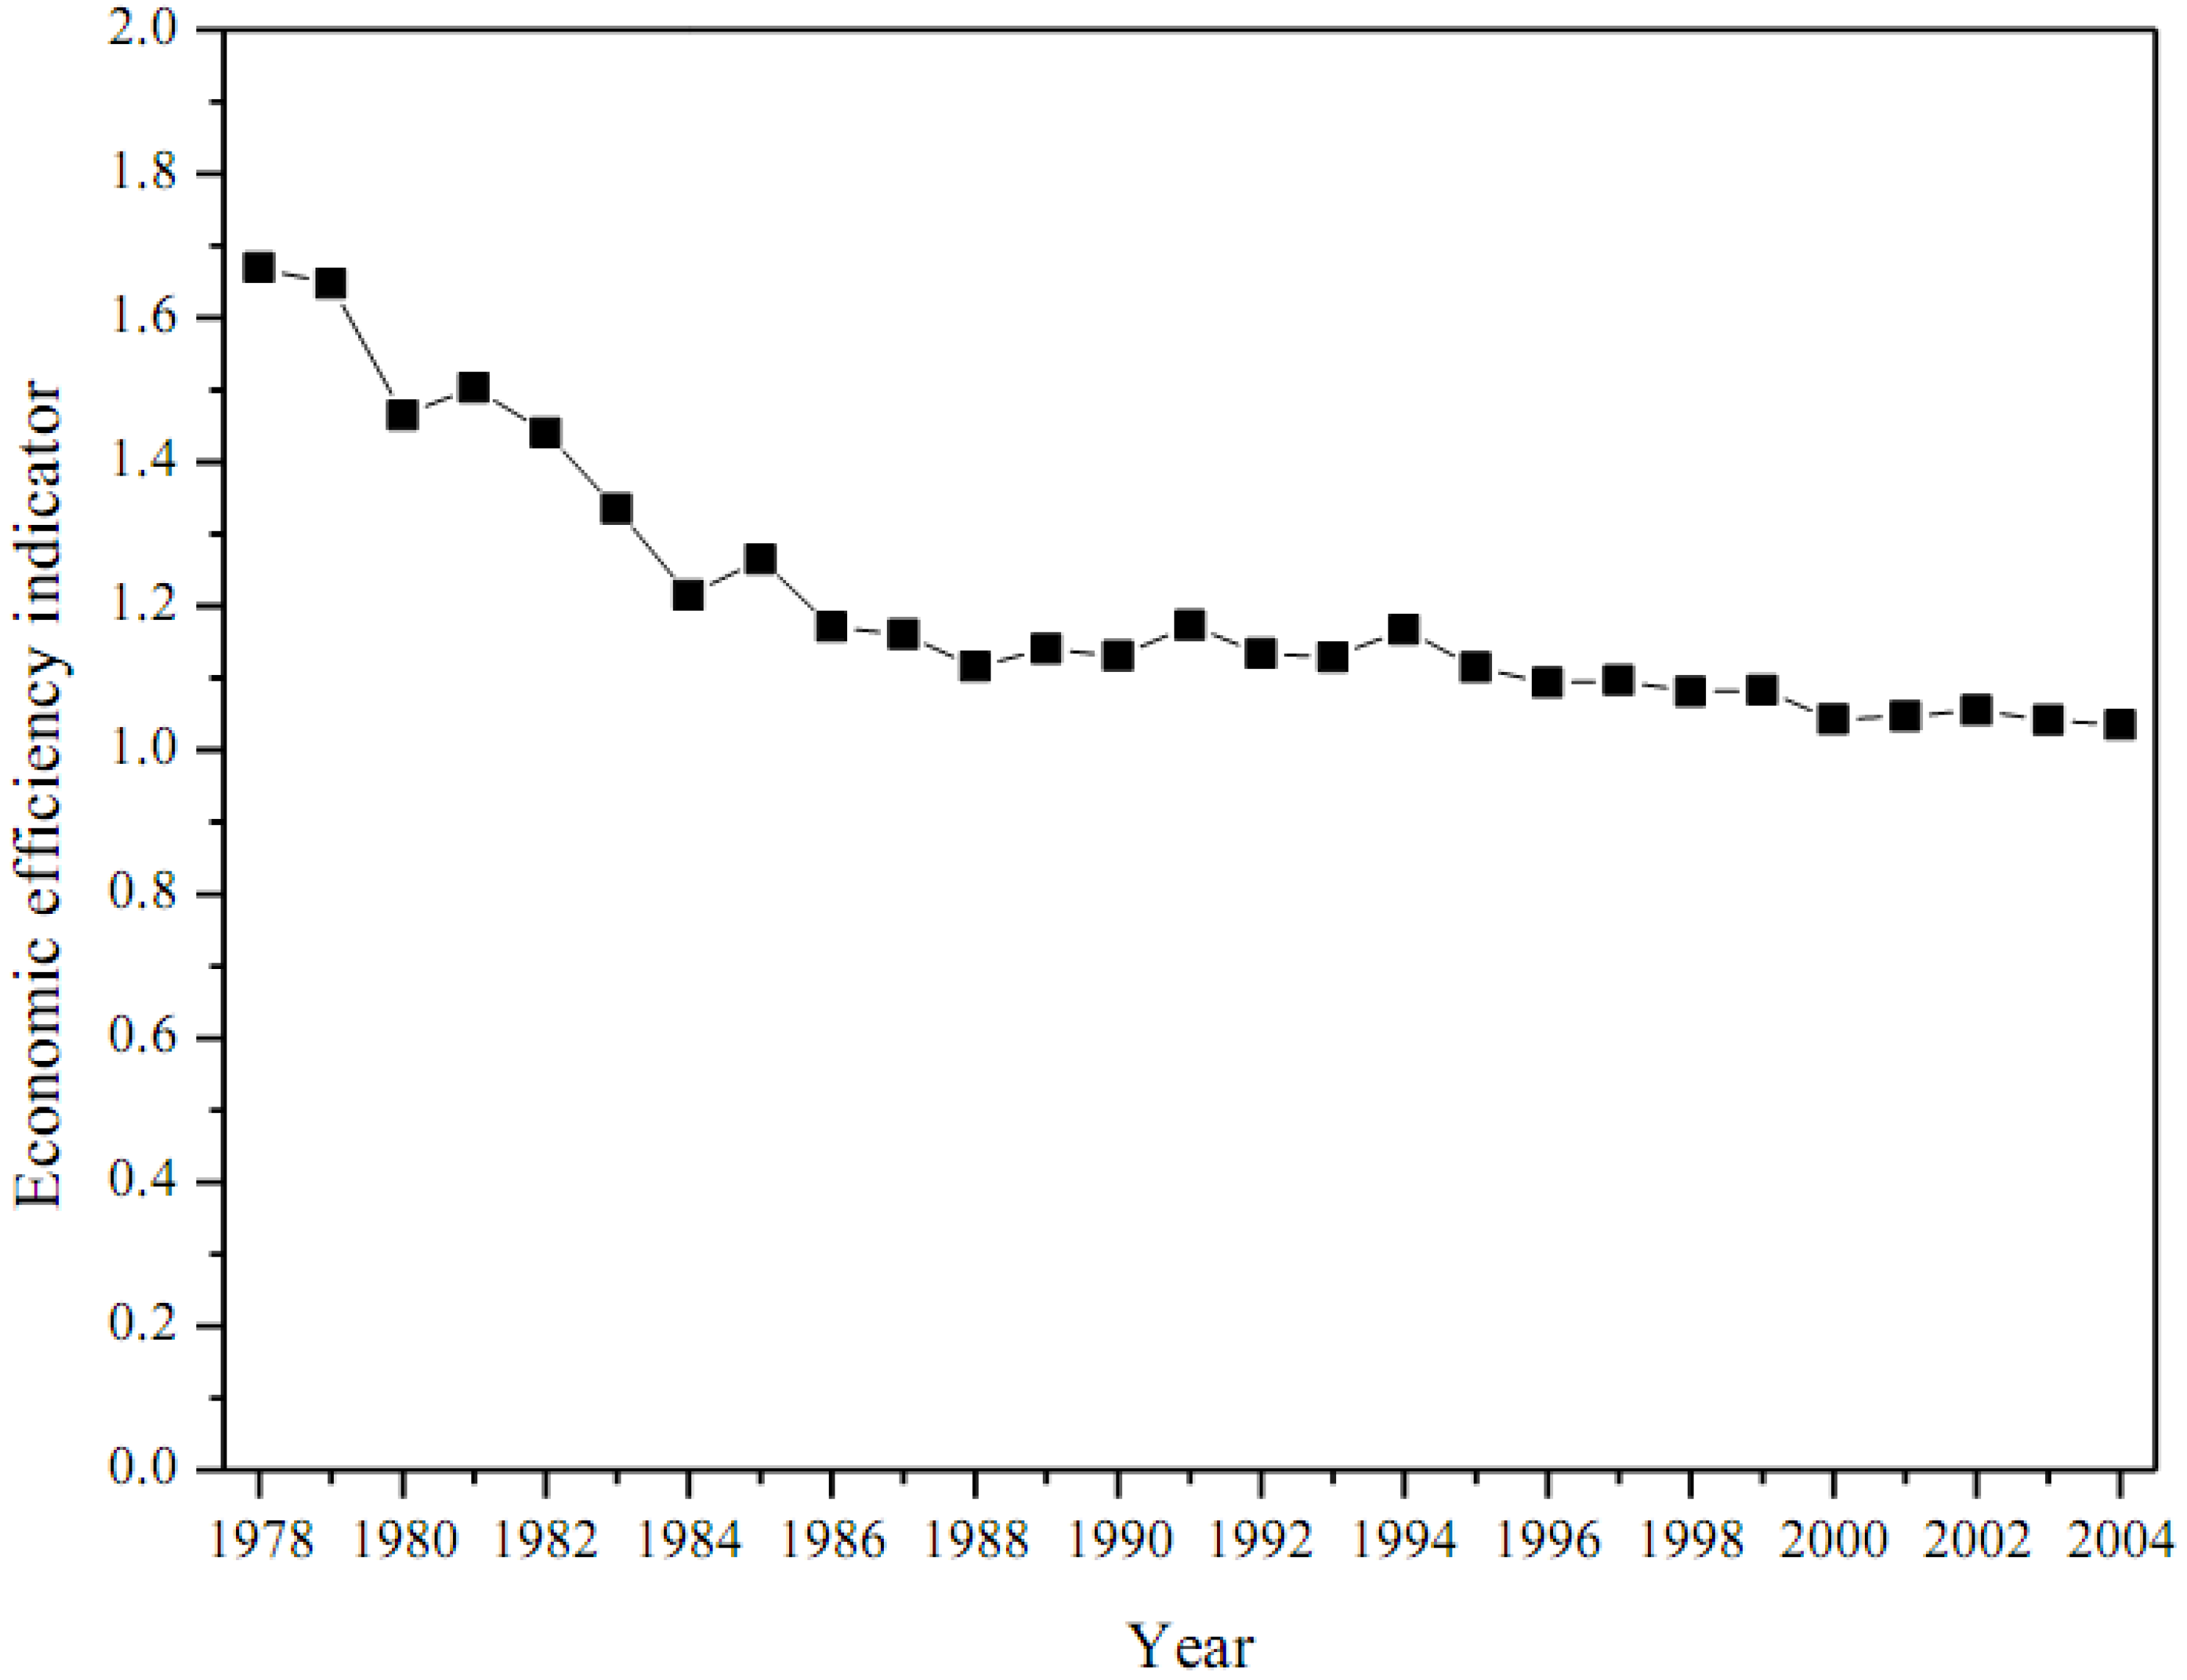
| 18 | Economic efficiency | U/(G + P2I) | 1.67 | 1.55 | 1.27 | 1.14 | 1.13 | 1.06 | 1.05 |
4.1. Emergy Source
4.1.1. Period I—Pre-Industrializing and Transforming Period
4.1.2. Period II—Industrializing and Fluctuating Period
4.1.3. Period III—Post-Industrializing and Fast Developing Period
4.2. Emergy Intensity

4.3. Emergy Use Welfare


4.4. Environment Impact

4.5. Degree of Exploitation and Economic Efficiency
5. Concluding Remarks
Acknowledgement
References
- Odum, H.T. Self organization, transformity and information. Science 1988, 242, 1132–1139. [Google Scholar] [CrossRef] [PubMed]
- Brown, M.T.; Odum, H.T.; Jørgensen, S.E. Energy hierarchy and transformity in the universe. Ecol. Model. 2004, 178, 17–28. [Google Scholar] [CrossRef]
- Odum, H.T. Energy ecology and economics. Ambio. 1973, 2, 220–227. [Google Scholar]
- Odum, H.T. Environmental Accounting—Emergy and Environmental Decision Making; John Wiley and Sons: New York, NY, USA, 1996. [Google Scholar]
- Brown, M.T.; Brandt-Williams, S.; Tilley, D.R.; Ulgiati, S. Emergy synthesis: An introduction. In Emergy Synthesis: Theory and Applications of the Emergy Methodology; Brown, M.T., Brandt-Williams, S., Tilley, D.R., Ulgiati, S., Eds.; University of Florida: Gainesville, FL, USA, 2000; pp. 1–14. [Google Scholar]
- Brown, M.T.; Ulgiati, S. Emergy and environmental accounting. In Encyclopedia of Energy; Cleveland, C., Ed.; Elsevier: Amsterdam, NL, 2004; Volume 1, pp. 329–353. [Google Scholar]
- Brown, M.T.; Herendeen, R. Embodied energy analysis and emergy analysis: A comparative view. Ecol. Econ. 1996, 20, 2210–2247. [Google Scholar] [CrossRef]
- Campbell, D.E. Emergy analysis of human carrying capacity and regional sustainability: An example using the state of Maine. Environ. Monit. Assess. 1998, 51, 531–556. [Google Scholar] [CrossRef]
- Campbell, D.E.; Brandt-Williams, S.L.; Meisch, M.E.A. Environmental Accounting Using Emergy: Evaluation of the State of West Virginia; USEPA: Narragansett, RI, USA, 2005. [Google Scholar]
- Chen, B.; Chen, G.Q. Ecological footprint accounting based on emergy—A case study of the Chinese society. Ecol. Model. 2006, 198, 101–114. [Google Scholar] [CrossRef]
- Chen, B.; Chen, G.Q. Emergy–based energy and material metabolism of the Yellow River basin. Commun. Nonlinear Sci. Numer. Simulat. 2009, 14, 923–934. [Google Scholar] [CrossRef]
- Chen, B.; Chen, Z.M; Zhou, Y.; Zhou, J.B.; Chen, G.Q. Emergy as embodied energy based assessment for local sustainability of a constructed wetland in Beijing. Commun. Nonlinear Sci. Numer. Simulat. 2009, 14, 622–635. [Google Scholar] [CrossRef]
- Chen, G.Q.; Jiang, M.M.; Chen, B.; Yang, Z.F.; Lin, C. Emergy analysis of Chinese agriculture. Ag. Ecosyst. Environ. 2006, 115, 161–173. [Google Scholar] [CrossRef]
- Zhou, S.Y.; Zhang, B.; Cai, Z.F. Emergy analysis of a farm biogas project in China: A biophysical perspective of agricultural ecological engineering. Commun. Nonlinear Sci. Numer. Simulat. 2010, 15, 1408–1418. [Google Scholar] [CrossRef]
- Herendeen, R.A. Energy analysis and EMERGY analysis—A comparison. Ecol. Model. 2004, 178, 227–237. [Google Scholar] [CrossRef]
- Higgins, J.B. Emergy analysis of the Oak Openings region. Ecol. Eng. 2003, 21, 75–109. [Google Scholar] [CrossRef]
- Huang, S.L.; Hsu, W.L. Energy hierarchy and urban landscape system. Landsc. Urban Plan. 2001, 53, 145–161. [Google Scholar] [CrossRef]
- Huang, S.L.; Odum, H.T. Ecology and economy: Emergy synthesis and public policy in Taiwan. J. Environ. Manage. 1991, 32, 313–333. [Google Scholar] [CrossRef]
- Huang, S.L.; Wong, J.H.; Chen, T.C. A Framework of Indicator system for Measuring Taipei’s Urban Sustainability. Landsc. Urban Plan. 1998, 42, 15–27. [Google Scholar] [CrossRef]
- Huang, S.L. Energy Basis for Urban Ecological Economic System; Chan’s Arch Books Co., LTD: Taipei, China, 2004. (in Chinese) [Google Scholar]
- Huang, S.L. Urban ecosystems, energetic hierarchies and ecological economics of Taipei metropolis. J. Environ. Manage. 1998, 52, 39–51. [Google Scholar] [CrossRef]
- Huang, S.L.; Chen, C.W. Theory of urban energetics and mechanisms of urban development. Ecol. Model. 2005, 189, 49–71. [Google Scholar] [CrossRef]
- Huang, S.L.; Hsu, W.L. Materials flow analysis and emergy evaluation of Taipei’s urban construction. Landsc. Urban Plan. 2003, 63, 61–74. [Google Scholar] [CrossRef]
- Huang, S.L.; Li, S.; Budd, W.W.; Chan, S.L.; Lin, Y.C. Stream order, hierarchy, and energy convergence of land use. Ecol. Model. 2007, 205, 255–264. [Google Scholar] [CrossRef]
- Huang, S.L; Lee, C.L.; Chen, C.W. Socioeconomic metabolism in Taiwan: Emergy synthesis versus material flow analysis. Resour. Conserv. Recy. 2006, 48, 166–196. [Google Scholar] [CrossRef]
- Jiang, M.M.; Chen, B.; Zhou, J.B; Tao, F.R.; Li, Z.; Yang, Z.F.; Chen, G.Q. Emergy account for biomass resource exploitation by agriculture in China. Energy Policy 2007, 35, 4704–4719. [Google Scholar] [CrossRef]
- Jiang, M.M.; Zhou, J.B.; Chen, B.; Chen, G.Q. Emergy-based ecological account for the Chinese economy in 2004. Commun. Nonlinear Sci. Numer. Simulat. 2008, 13, 2337–2356. [Google Scholar] [CrossRef]
- Jiang, M.M.; Zhou, J.B.; Chen, B.; Yang, Z.F; Ji, X.; Zhang, L.X.; Chen, G.Q. Ecological evaluation of Beijing economy based on emergy indices. Commun. Nonlinear Sci. Numer. Simulat. 2009, 14, 2482–2494. [Google Scholar] [CrossRef]
- Kang, D.; Park, S.S. Emergy evaluation perspectives of a multipurpose dam proposal in Korea. J. Environ. Manage. 2002, 66, 293–306. [Google Scholar] [CrossRef]
- Lan, S.F.; Odum, H.T. Emergy evaluation of environment and economy of Hong Kong. J. Environ. Sci. 1994, 4, 56–74. [Google Scholar]
- Odum, H.T. Emergy and evolution. In Annual Meeting of International Society for the Systems Sciences, 33rd ed.; Holberg, S.C., Samuelson, K., Eds.; International Society for the Systems Sciences: Ostersund, Sweden, 1989; Volume 1, pp. 211–218. [Google Scholar]
- Odum, H.T. Energy systems concepts and self-organization: A rebuttal. Oecologia 1995, 104, 518–522. [Google Scholar] [CrossRef]
- Introduction to Ecological Engineering with Brazilian Case Studies; Ortega, E.; Safonov, P.; Comar, V. (Eds.) UNICAMP: Campinas, Brazil, 1999.
- Patten, B.C. Toward a more holistic ecology, and science: The contribution of H.T. Odum. Oecologia 1993, 93, 597–602. [Google Scholar] [CrossRef]
- Pulselli, F.M.; Pulselli, R.M.; Picchi, M.P. Emergy evaluation of the ‘emternalities’ in non industrialized regions: The case of two mountain communities in Italy. In Proceedings of the Second Emergy Research Conference—Emergy Synthesis 2; Brown, M.T., Odum, H.T., Tilley, D., Ulgiati, S., Eds.; Center for Wetlands, University of Florida: Gainsville, FL, USA, 2001; pp. 397–408. [Google Scholar]
- Pulselli, R.M.; Pulselli, F.M.; Rustici, M. Emergy accounting of the Province of Siena: Towards a thermodynamic geography for regional studies. J. Environ. Manage. 2008, 86, 342–353. [Google Scholar] [CrossRef] [PubMed]
- Tilley, D.R.; Swank, W.T. Emergy-based environmental systems assessment of a multi-purpose temperate mixed-forest watershed of the southern Appalachian Mountains, USA. J. Environ. Manage. 2003, 69, 213–227. [Google Scholar] [CrossRef] [PubMed]
- Ulgiati, S.; Odum, H.T.; Bastianoni, S. Emergy use, environmental loading and sustainability. An emergy analysis of Italy. Ecol. Model. 1994, 73, 215–268. [Google Scholar] [CrossRef]
- Whitfield, D.F. Emergy Basis for Urban Land Use Patterns in Jacksonville; Department of Landscape Architecture, University of Florida: Gainesville, FL, USA, 1994. [Google Scholar]
- Yang, Z.F.; Jiang, M.M.; Chen, B.; Zhou, J.B.; Chen, G.Q. Solar emergy evaluation for Chinese economy. Energy Policy 2010, 38, 875–886. [Google Scholar] [CrossRef]
- Zhang, L.X.; Yang, Z.F.; Chen, G.Q. Emergy analysis of cropping-grazing system in Inner Mongolia Autonomous Region, China. Energy Policy 2007, 35, 3845–3855. [Google Scholar] [CrossRef]
- Zhang, L.X.; Chen, B.; Yang, Z.F.; Chen, G.Q.; Jiang, M.M.; Liu, G.Y. Comparison of typical mega cities in China using emergy synthesis. Commun. Nonlinear Sci. Numer. Simulat. 2009, 14, 2827–2836. [Google Scholar] [CrossRef]
- Zhang, Y.; Yang, Z.F.; Yu, X.Y. Evaluation of urban metabolism based on emergy synthesis: A case study for Beijing (China). Ecol. Model. 2009, 14, 1690–1696. [Google Scholar] [CrossRef]
- Zhou, J.B.; Jiang, M.M.; Chen, B.; Chen, G.Q. Emergy evaluations for constructed wetland and conventional wastewater treatments. Commun. Nonlinear Sci. Numer. Simulat. 2009, 14, 1781–1789. [Google Scholar] [CrossRef]
- Mansson, B.A.; McGlade, J.M. Ecology, thermodynamics and H.T. Odum's conjectures. Oecologia 1993, 93, 582–596. [Google Scholar] [CrossRef]
- Cleveland, C.J.; Kaufmann, R.K.; Stern, D.I. Aggregation and the role of energy in the economy. Ecol. Econ. 2000, 32, 301–317. [Google Scholar] [CrossRef]
- Hau, J.L.; Bakshi, B.R. Promise and problems of emergy analysis. Ecol. Model. 2004, 178, 215–225. [Google Scholar] [CrossRef]
- Bastianoni, S.; Marchettini, N. The problem of co-production in environmental accounting by emergy analysis. Ecol. Model. 2000, 129, 187–193. [Google Scholar] [CrossRef]
- Bastianoni, S.; Nielsen, S.N.; Marchettini, N.; Jørgensen, S.E. Use of thermodynamic functions for expressing some relevant aspects of sustainability. Int. J. Energy Res. 2004, 29, 53–64. [Google Scholar] [CrossRef]
- Bastianoni, S.; Facchini, A.; Susani, L.; Tiezzi, E. Emergy as a function of exergy. Energy 2007, 32, 1158–1162. [Google Scholar] [CrossRef]
- Pillet, G. Exergy, emergy, and entropy. In Environmental Economics; Pillet, G., Murota, T., Eds.; Roland Leimgruber: Geneva, Switzerland, 1987; pp. 277–302. [Google Scholar]
- Reini, M; Valero, A. Towards a unified formulation of exergy cost theory and emergy algebra for ecological and technological energy system evaluation. In Advances in Energy Studies: Reconsidering the Importance of Energy; Ulgiati, S., Brown, M.T., Giampietro, M., Herendeen, R.A., Mayumi, K., Eds.; S. G. E: Padova, Italy, 2003. [Google Scholar]
- Sciubba, E; Ulgiati, S. Emergy and exergy analyses: Complementary methods or irreducible ideological options? Energy 2005, 30, 1953–1988. [Google Scholar] [CrossRef]
- Chen, G.Q. Exergy consumption of the earth. Ecol. Model. 2005, 184, 363–380. [Google Scholar] [CrossRef]
- Jiang, M.M. Study of thermodynamic mechanisms of the urban development and its application: Beijing as a case. Ph.D. Dissertation, Peking University, Beijing, China, 2007. [Google Scholar]
- Chen, G.Q. Scarcity of exergy and ecological evaluation based on embodied exergy. Commun. Nonlinear Sci. Numer. Simulat. 2006, 11, 531–552. [Google Scholar] [CrossRef]
- Su, M.R.; Chen, B.; Yang, Z.F.; Ulgiati, S. Urban ecosystem health assessment based on emergy and set pair analysis—A comparative study of typical Chinese cities. Ecol. Model. 2009, 220, 2341–2348. [Google Scholar] [CrossRef]
- Wall, G. Exergy—A useful concept within resource accounting. Institute of Theoretical Physics; ISBN 99-1767571-X and 99-. 0342612-7. Göteborg, Report No. 77(42): 1-77(42); 1977; Available online: http://www.exergy.se/ftp/paper1.pdf (Accessed on 14 December 2009).
- Jørgensen, S.E. Exergy and buffering capacity in ecological system. In Energetics and Systems; Mitsh, W.J., Ragade, R.K., Bosserman, R.W., Dillon, J.A., Eds.; Ann Arbor Science, Ann Arbour: Michigan, MI, USA, 1982; pp. 61–72. [Google Scholar]
- Jørgensen, S.E. The thermodynamic concept: Exergy. In Thermodynamics and Ecological Modelling; Jørgensen, S.E., Ed.; Lewis Publishers: Baton Rouge, Louisiana, LA, USA, 2001; pp. 153–164. [Google Scholar]
- Szargut, J.T. Application of exergy for the determination of ecological costs. Bull Polish Acad. Sci. Ser. Technol. 1986, 34, 475–480. [Google Scholar]
- Szargut, J.T. Anthropogenic and natural exergy losses. Energy 2003, 28, 1047–1054. [Google Scholar] [CrossRef]
- Szargut, J.T.; Ziebik, A.; Stanek, W. Depletion of the non-renewable natural exergy resources as a measure of the ecological cost. Energ. Convers. Manage. 2002, 43, 1149–1163. [Google Scholar] [CrossRef]
- Chen, B.; Chen, G.Q. Modified ecological footprint accounting and analysis based on embodied exergy—A case study of the Chinese society 1981–2001. Ecol. Econ. 2007, 61, 355–376. [Google Scholar] [CrossRef]
- Ji, X. Urban ecosystem accounting, modeling and regulation in Beijing based on embodied cosmic exergy. Ph.D. Dissertation, Peking University, Beijing, China, 2008. [Google Scholar]
- Zhou, J.B. Embodied ecological elements accounting of national economy. Ph.D. Dissertation, Peking University, Beijing, China, 2008. [Google Scholar]
- Chen, Z.M.; Chen, G.Q.; Zhou, J.B.; Jiang, M.M.; Chen, B. Ecological input–output modeling for embodied resources and emissions in Chinese economy 2005. Commun. Nonlinear Sci. Numer. Simulat. 2010, 15, 1942–1965. [Google Scholar] [CrossRef]
- Chen, G.Q.; Chen, Z.M. Carbon emissions and resources use by Chinese economy 2007: A 135–sector inventory and input–output embodiment. Commun. Nonlinear Sci. Numer. Simulat. 2010, 15, 3647–3732. [Google Scholar] [CrossRef]
- Zhou, S.Y.; Chen, H.; Li, S.C. Resources use and greenhouse gas emissions in urban economy: Ecological input–output modeling for Beijing 2002. Commun. Nonlinear Sci. Numer. Simulat. 2010, 15, 3201–3231. [Google Scholar] [CrossRef]
- Chen, H.; Chen, G.Q.; Ji, X. Cosmic emergy based ecological systems modelling. Commun. Nonlinear Sci. Numer. Simulat. 2010, 15, 2672–2700. [Google Scholar] [CrossRef]
- Odum, H.T. System Ecology: An Introduction; John Wiley & Sons: New York, NY, USA, 1983. [Google Scholar]
- Odum, H.T.; Odum, E.C. Computers Minimodels and Simulations. Exercises for Science and Social Science, Center for Environmental Policy; University of Florida: FL, USA, 1994; Available online: http://emsim.sourceforge.net (Accessed on 14 May 2010).
© 2010 by the authors; licensee MDPI, Basel, Switzerland. This article is an Open Access article distributed under the terms and conditions of the Creative Commons Attribution license ( http://creativecommons.org/licenses/by/3.0/).
Share and Cite
Ming, J.M.; Zhan-Ming, C.; Bo, Z.; Cheng, L.S.; Hua, X.X.; Yi, Z.S.; Bo, Z.J. Ecological Economic Evaluation Based on Emergy as Embodied Cosmic Exergy: A Historical Study for the Beijing Urban Ecosystem 1978–2004. Entropy 2010, 12, 1696-1720. https://doi.org/10.3390/e12071696
Ming JM, Zhan-Ming C, Bo Z, Cheng LS, Hua XX, Yi ZS, Bo ZJ. Ecological Economic Evaluation Based on Emergy as Embodied Cosmic Exergy: A Historical Study for the Beijing Urban Ecosystem 1978–2004. Entropy. 2010; 12(7):1696-1720. https://doi.org/10.3390/e12071696
Chicago/Turabian StyleMing, Jiang Mei, Chen Zhan-Ming, Zhang Bo, Li Shuang Cheng, Xia Xiao Hua, Zhou Shi Yi, and Zhou Jiang Bo. 2010. "Ecological Economic Evaluation Based on Emergy as Embodied Cosmic Exergy: A Historical Study for the Beijing Urban Ecosystem 1978–2004" Entropy 12, no. 7: 1696-1720. https://doi.org/10.3390/e12071696
APA StyleMing, J. M., Zhan-Ming, C., Bo, Z., Cheng, L. S., Hua, X. X., Yi, Z. S., & Bo, Z. J. (2010). Ecological Economic Evaluation Based on Emergy as Embodied Cosmic Exergy: A Historical Study for the Beijing Urban Ecosystem 1978–2004. Entropy, 12(7), 1696-1720. https://doi.org/10.3390/e12071696