
Expiration Date of Ready-to-Eat Salads: Effects on Microbial Load and Biochemical Attributes


1
Department of Agricultural Sciences, Biotechnology and Food Science, Cyprus University of Technology, 3036 Limassol, Cyprus
2
Faculty of Food Science & Technology, Agricultural University of Athens, 54124 Athens, Greece
*
Author to whom correspondence should be addressed.
Foods 2021, 10(5), 941; https://doi.org/10.3390/foods10050941
Submission received: 25 March 2021
/
Revised: 14 April 2021
/
Accepted: 23 April 2021
/
Published: 25 April 2021
(This article belongs to the Special Issue Microbiology and Safety of Ready-to-Eat Products)
Abstract
:When minimally processed vegetables reach their expiration date, expose an increased microbial load. This includes mainly spoilage microorganisms but also foodborne pathogens, thus affecting the quality and safety of highly consumed ready-to-eat salads. A total of 144 ready-to-eat salads from the Cypriot market were analyzed in an attempt to determine the effects of the expiration date on the microbial load and plant metabolic variables of the salads. Possible correlations between them were also investigated for the first time. Furthermore, the impacts of the season (winter, summer), salad producing companies and type of salad and/or their interactions with the tested parameters were investigated. Results revealed that the microbial load (mainly spoilage microorganisms, such as Pseudomonas spp., yeasts and molds) increased towards the end of the shelf life. The microbial load was differentiated among the five salad producers and/or the salad types, highlighting the importance of a common and safe sanitation-processing chain in the preparation of ready-to-eat salads. Summer was the season in which Escherichia coli counts were found to be higher for plain lettuce, while Staphylococcus spp. was increased numbers for the lettuce+endive/radicchio, lettuce+rocket and lettuce+chives type of salads. Additionally, an increased Staphylococcus spp. was observed for plain rocket salads in winter. All samples examined were found negative for Salmonella enterica and Listeria monocytogenes. Moreover, carbon dioxide production and damage indexes (hydrogen peroxide and lipid peroxidation) increased on expiration date on both winter and summer seasons, indicating plant tissue stress at the end of shelf life. These findings indicate that the expiration date and relevant shelf life of processed vegetables are important parameters to be considered when postharvest management is applied to these products, ensuring safety and quality.
1. Introduction
The importance of a balanced diet for the promotion of human health has led to the establishment of dietary guidelines (i.e., food wheel, MyPyramid, MyPlate), which aimed to present healthy eating habits with increased serving sizes of fruits and vegetables [1,2]. National organizations encourage people to increase fruits and vegetable intake [3]. However, increased consumption of fresh produce has been linked with the increase of food poisoning outbreaks [4,5,6]. Fruits and vegetables have been implicated in various outbreaks regarding the consumption of contaminated fresh produce, especially leafy vegetables, i.e., lettuce, spinach, cabbage and parsley [7,8,9,10].
Intensive cultivation of vegetables over the years for higher fresh produce yields has led to the appearance of increased food poisoning outbreaks linked with fresh produce consumption [7]. The probability of fresh produce contamination with foodborne pathogens is present along the food chain (from farm to consumer), and preharvest hazards play an important role in the prevalence of foodborne pathogens on fresh produce. Numerous routes have been previously reported, including water (of many sources), use of manure (poorly treated or even raw), insects, livestock and/or wild animals [7,11,12]. Concerns and challenges regarding food safety arise once pathogens are established in the environment.
Postharvest practices also provide sources of human pathogens that can possibly contaminate fresh produce, increasing the likelihood of food poisoning risks. During postharvest management, fresh produce, such as leafy vegetables, undergo processes, i.e., washing, shredding, chopping, slicing, peeling, which aim to reduce the microbial load of minimally processed vegetables and prepare them as ready-to-eat food [13]. However, along with mishandling and injured (surface damage), they can serve as sources of fresh produce contamination with foodborne pathogens lurking in the processing environment [14].
The main microflora of fruits and vegetables consists of spoilage bacteria, yeasts and molds accompanied by human pathogenic bacteria due to possible contamination through production (from cultivation to consumption) [15]. The main foodborne pathogens associated with fresh produce include EHEC Escherichia coli, Salmonella spp., Listeria monocytogenes, Bacillus cereus, Campylobacter spp., Yersinia enterocolitica, Staphylococcus aureus and Clostridium botulinum [5,15,16,17]. An infection with these pathogens could result in mild clinical symptoms, such as fever, headache, diarrhea, vomiting, abdominal pain and muscle cramps and/or more complex diseases/syndromes, including hemorrhagic colitis, hemolytic uremic syndrome, dysentery, septicemia, meningitis and even miscarriage [8,18]. Non-typhoidal Salmonella and Shiga-toxigenic E. coli were implicated in recent gastroenteritis outbreaks regarding the consumption of vegetables, sprouts, fruits and nuts [6,19,20,21,22].
It is known that adverse storage conditions (i.e., increased temperature) during postharvest handling and distribution can negatively affect organoleptic characteristics of leafy vegetables, i.e., appearance and aroma [23]. Moreover, the nutritional value of minimally processed vegetables might be adversely affected during processing. For instance, oxidation of phenolic content, degradation of vitamin C (ascorbic acid), loss of dietary fibers might take place due to preparing practices (i.e., cutting, shredding, washing) [24,25]. It has been previously mentioned that when minimally processed vegetables reach their expiration date, the increased microbial load was observed, including mainly spoilage microorganisms as well as foodborne pathogens [26,27,28].
The aim of this study was to evaluate the effects of the expiration date (OR “estimated expiration date”) on the microbial load and plant-associated parameters (phenolic content, antioxidants, carbon dioxide (CO2) production, damage indexes) of ready-to-eat salads collected in two seasons (winter and summer).
2. Materials and Methods
2.1. Sampling
A total of 144 ready-to-eat salads samples were randomly obtained from retail markets from the whole county of Cyprus (four cities of Larnaca, Limassol, Nicosia, and Paphos) in two sampling periods (seasons) in a one-year period: winter (January–February) and summer (July–August). Based on the sampled salads, seven different types of salads were collected, namely lettuce, lettuce + cabbage, lettuce + endive/radicchio, lettuce + rocket, lettuce + chives, rocket and other (lettuce + 2 or more ingredients). The ready-to-salads packaging/production in Cyprus is oriented in five enterprises (salads packaging units), namely salad ‘’producer" and are coded as producers A–E. For each period, sampling was performed once a week, and the collected samples were transferred in cool boxes to the laboratory within 2 h and immediately stored at a laboratory refrigerator (7 °C) for further analysis. To study the fresh produce perishability and sensitivity during storage in both foodborne pathogens and spoilage microorganisms, but also on their preservation/nutritive value, double samples were collected in each season, and half of them were directly analyzed as mentioned below, while the other half were stored at 7 °C until the expiration date (as indicated on each package, usually of 6 days).
Analyses performed included the determination of CO2 production (due to respiration process), polyphenol content, antioxidant activity, damage index (H2O2 production and lipid peroxidation), along with the examination of the microbial quality of samples (including spoilage and foodborne pathogens as described in Section 2.2).
An appropriate amount of fresh plant tissue (a representative portion from different parts of the salad) from each sample was collected and stored at −20 °C for microbiological analysis and the extraction of polyphenols. Modified atmosphere packaging (MAP) with single-layer oriented polypropylene (OPP) or double-layer polyethylene (PE) material was used by most salad producers/packagers. Fresh produce was sanitized with chlorine-based products in the washing process (approximately 2–3 ppm of free chlorine in the washing water), but sanitation before processing was not a common practice.
2.2. Microbiological Analyses
For the determination of the microbial quality of samples, the following parameters were assessed: total viable count (TVC), Enterobacteriaceae, coliforms, E. coli, Staphylococcus spp., B. cereus, LAB, Pseudomonas spp. and yeast and molds. Briefly, 1 g of plant tissue (the sampling weight was based on preliminary tests of 1–5–10 g of fresh tissue that showed no differences on microbiological quality and previous reports of Xylia et al. [29,30]) was homogenized in a ratio 1:10 (w/v) with maximum recovery diluent (MRD) (Merck, Darmstadt, Germany) in stomacher for 1 min and appropriate volume from decimal dilutions were inoculated to appropriate culture media: to determine TVC in plate count agar (Merck, Darmstadt, Germany) at 30 °C for 48 h; Enterobacteriaceae in violet red bile dextrose agar (VRBDA) (Merck, Darmstadt, Germany) at 37 °C for 24 h; coliforms and E. coli in coliform agar (Biolab, Hungary) at 37 °C for 24 h; Staphylococcus spp. in Baird-Parker agar (Merck, Darmstadt, Germany) supplemented with egg yolk tellurite emulsion (Merck, Darmstadt, Germany) at 37 °C for 24 h; B. cereus in Cereus Selective agar acc. to MOSSEL (MYP agar) (Merck, Darmstadt, Germany) supplemented with egg yolk (Merck, Darmstadt, Germany) and selective supplement (Merck, Darmstadt, Germany) at 30 °C for 48 h; Pseudomonas spp. in cetrimide–nalidixic acid (CN) agar for Pseudomonas (Biokar diagnostics, Allonne, France) at 37 °C for 48 h; lactic acid bacteria (LAB) in De Man, Rogosa and Sharpe agar (MRS agar) (Liofilchem S.r.l., Teramo, Italy) at 30 °C for 48 h and yeast and melds on Rose Bengal CAF agar (Liofilchem S.r.l., Teramo, Italy) at 25 °C for 5 days.
For the examination of antibiotic resistance (ability to produce β-lactamase) of typical isolated E. coli (blue) colonies from Coliforms agar (Biolab, Budapest, Hungary), a first subculture was performed on tryptone bile glucuronic agar (TBX agar) (HiMedia, Mumbai, India) with incubation at 37 °C for 24 h. Afterward, blue colonies from TBX were streaked on chromatic extended-spectrum β-lactamase (ESBL) agar (Liofilchem S.r.l., Teramo, Italy) and incubated at 37 °C for 24 h. ESBL producing E. coli isolates were identified by pink or purple colonies on ESBL agar.
2.2.1. Isolation and Identification of Salmonella spp. and Listeria spp.
The isolation of Salmonella spp. was performed with the standard cultivation method as proposed by ISO [31] with some modifications based on preliminary trials, the available salad weight (~125–150 g/package) and previous records [30]. Briefly, 5 g of sample (as described above) were homogenized in 1:10 ratio with buffered peptone water (BPW) (Merck, Darmstadt, Germany) and incubated at 37 °C for 24 h. Afterward, 0.1 mL was added into 10 mL of Rappaport–Vassiliadis broth (RVS) (Merck, Darmstadt, Germany), which was incubated at 41.5 °C for 24 h. Finally, a loopful of RVS was streaked on xylose lysine deoxycholate agar (XLD agar) (Scharlau, Sentmenat, Spain) and incubated at 37 °C for 24 h. Typical red colonies with a black center were isolated, subcultured and incubated on brain heart infusion agar (BHI agar) (Biolab, Budapest, Hungary) at 37 °C for 24 h.
The isolation of Listeria spp. was carried out with the standard cultivation method as recommended by ISO [32], with modifications based on preliminary trials, the available salad weight (~125–150 g/package) and previous records [30]. Briefly, 5 g of sample (as described above) were homogenized in a 1:10 ratio with half-Fraser broth (Merck, Darmstadt, Germany) and incubated at 30 °C for 24 h. then 0.1 mL was added to 10 mL of full-Fraser broth (Merck, Darmstadt, Germany), which was incubated at 37 °C for 48 h. Finally, a loopful of full-Fraser broth was streaked on Augusti Ottaviani Listeria Selective agar (ALOA agar) (Merck, Darmstadt, Germany), which was incubated at 37 °C for 24 h. Typical blue-green colonies surrounded by an opaque halo (typical Listeria-like colonies) were isolated, subcultured and incubated on BHI agar (Biolab, Budapest, Hungary) at 37 °C for 24 h.
2.2.2. Molecular Confirmation of Salmonella enterica and Listeria monocytogenes
DNA extraction was performed with heat lysis of previously isolated colonies. Briefly, one colony was diluted with 100 μL of sterile distilled water and heated for 20 min at 100 °C. Samples were centrifuged at 13,000× g, and the supernatant was stored at −20 °C until further use. Listeria spp. isolates were identified using real-time PCR for the amplification of a 274 bp fragment of the prfA gene with forward primer prfA LIP1 (5′-GATACAGAAACATCGGTTGGC-3′) and reverse primer prfA LIP2 (5′-GTGTAATCTTGATGCCATCAGG-3′) [33]. In both protocols, the template for real-time PCR assays was genomic DNA from heat-lysed cells (2 μL) and KAPA SYBR FAST qPCR master mix (KAPA Biosystems, Wilmington, MA, USA).
2.3. Carbon Dioxide Production
The estimation of CO2 produced due to the respiration of plant tissue was carried out using a dual gas analyzer (International Control Analyser Ltd., Kent, UK), as described previously [9]. In brief, prior to opening, the air of each package was sucked out for 60 s and results were expressed as a percentage (%) of CO2 production (value included the CO2 produced by respiration and the initially flushed CO2 in bags).
2.4. Polyphenol Content and Antioxidant Activity of Ready-to-Eat Salads
From each bag, pooled plant tissue (1 g) was collected and homogenized with 50% (v/v) methanol for 60 s. The process was further assisted with an ultrasound water bath (35 kHz frequency and 325 W power output) for 30 min. Homogenates were then centrifuged at 4600× g at 4 °C for 15 min, and the supernatants were stored at −20 °C until use.
Polyphenol content was estimated using the Folin–Ciocâlteu method at 755 nm, according to Tzortzakis et al. [34]. A calibration curve with gallic acid (Scharlau, Sentmenat, Spain) was used, and results were expressed as equivalents of gallic acid per g of fresh weight (mg of GAE/g Fw).
Three different methods were performed for the evaluation of the antioxidant activity of samples: 2,2-diphenyl-1-picrylhydrazyl (DPPH) assay, ferric reducing antioxidant power (FRAP) assay and 2.2′-azinobis-(ethylbenzothiazoline-6-sulfonic acid) (ABTS) assay. Methanolic extracts scavenging activity of the DPPH (Sigma-Aldrich, Steinheim, Germany) radical was examined with the procedure described by Chrysargyris et al. [35] at 517 nm, and results were expressed as mg of Trolox ((±)-6-hydroxy-2,5,7,8-tetramethylchroman-2carboxylic acid) per g of fresh weight (mg of Trolox/g Fw). The reducing ability of samples against Fe3+ at 593 nm was determined according to Chrysargyris et al. [35], and results were expressed as mg of Trolox per g of fresh weight (mg of Trolox/g Fw). Scavenging activity of sample’s methanolic extracts against ABTS+ (Sigma-Aldrich, Steinheim, Germany) radical at 734 nm was assessed as previously mentioned by Wojdylo et al. [36], and results were expressed as mg of Trolox per g of fresh tissue (mg of Trolox/g Fw).
2.5. Damage Index
Damage index was evaluated by the hydrogen peroxide (H2O2) production and lipid peroxidation on the examined plant tissue. The estimation of H2O2 production was carried out at 390 nm, as described by Loreto and Velikova [37]. A calibration curve with H2O2 was used, and results were expressed as μmol of H2O2 per g of fresh weight (μmol H2O2/g Fw). The 2-thiobarbituric acid reactive substances (TBARS) method was performed at 532 nm and 600 nm for the determination of samples lipid peroxidation according to de Azevedo Neto et al. [38], and results were expressed as nmol of malondialdehyde (MDA) per g of fresh weight (nmol MDA/g Fw).
2.6. Statistical Analysis
Statistical analysis was performed using IBM SPSS Statistics version 25, where the effect of season, salad producer and type of salad on the phenolic content, antioxidant activity, % CO2 production and damage index of samples was assessed. Data means were compared with one-way analysis of variance (ANOVA), and Tukey’s multiple range tests were calculated for the significant data p < 0.05. All measurements were done in duplicates. Differences between seasons were analyzed by the independent-samples t-test, while paired-samples t-test was performed for the determination of differences among purchase and expiration dates.
3. Results
3.1. Effects of Season
3.1.1. Microbiological Analysis
Salad Producer
Significant differences of E. coli were reported from salad producers A and C, where both producers showed higher values in summer (0.32 and 0.68 log cfu/g, respectively) compared to winter (0.00 log cfu/g, both) (Figure 1D and Table 1). Higher B. cereus values were observed in summer compared to winter for salad producer C (0.39 and 0.00 log cfu/g, respectively) (Figure 1 F), while salad producer B showed higher Pseudomonas spp. counts in winter compared to summer (8.00 and 5.47 log cfu/g, respectively) (Figure 1H). Salad producers A, C and E presented significantly lower LAB values in summer (4.13, 4.84 and 2.67 log cfu/g, respectively) compared to winter (5.66, 6.27 and 5.20 log cfu/g, respectively) (Figure 1G). Yeasts and molds were found to be significantly higher (p = 0.002) in winter for salad producer A compared to summer (Figure 1I). Similarly, producer B showed higher yeasts and molds counts in winter (5.99 and 4.20 log cfu/g, respectively). No significant differences for TVC, Enterobacteriaceae, coliforms and Staphylococcus spp. were observed among samples collected in winter and summer for all salad producers (Figure 1A–C,E and Table 1).
Type of Salad
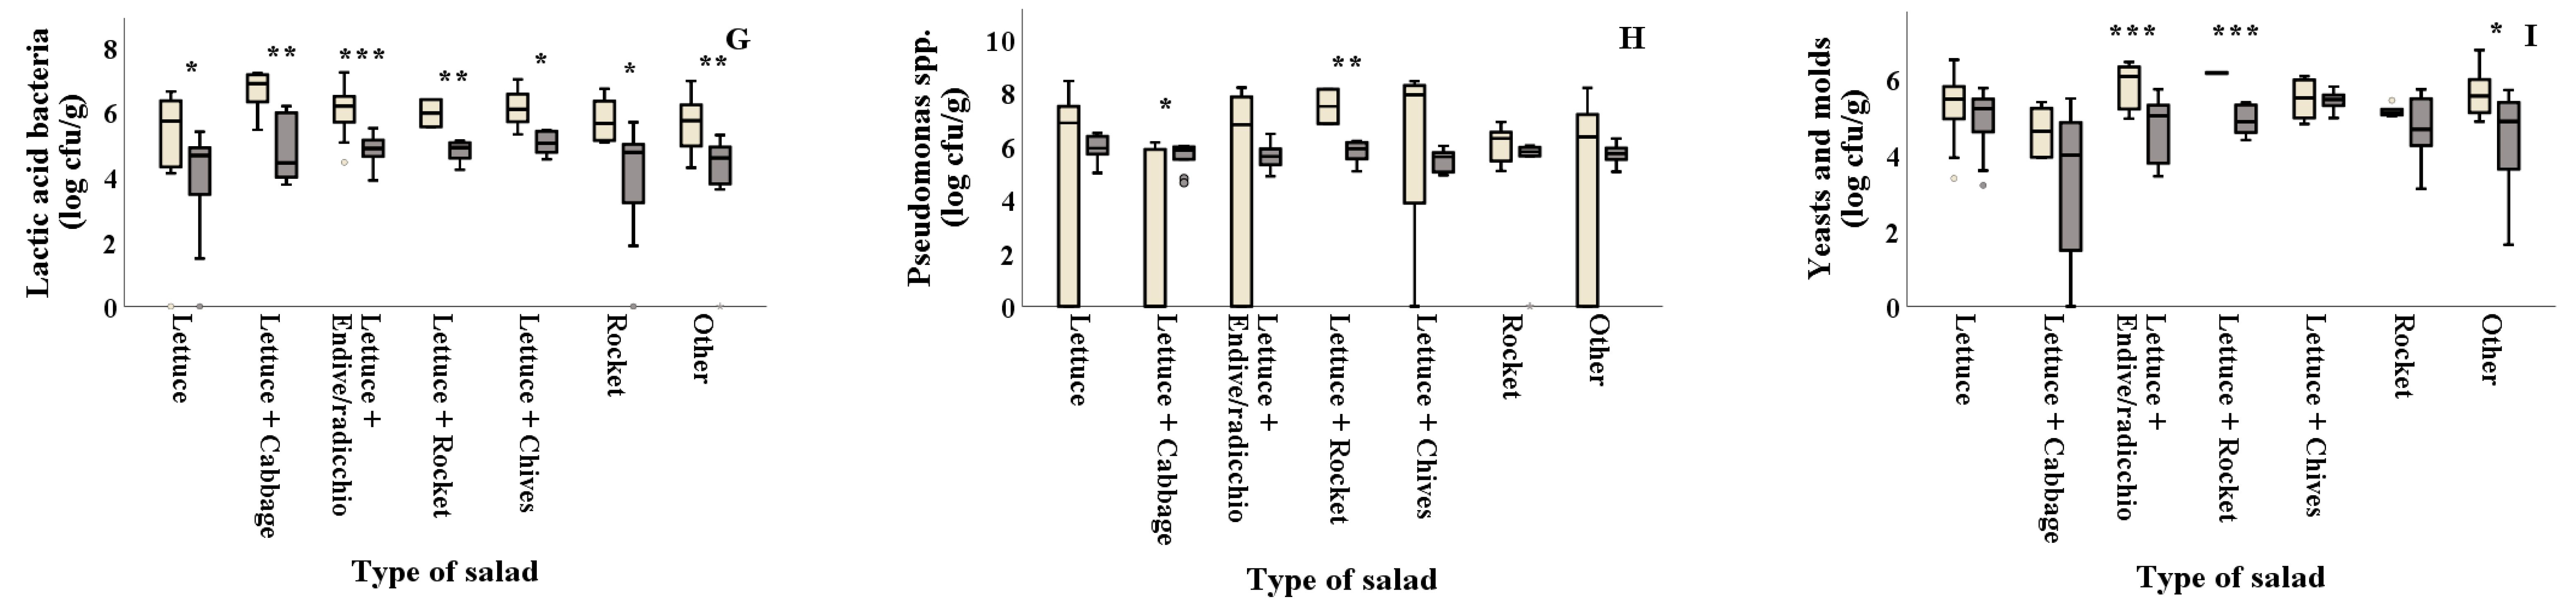
As shown in Figure 2D and Table 2, E. coli counts were reported significantly (p = 0.044) higher in summer for salads containing plain lettuce. The combinations of lettuce with other types of leafy vegetables (lettuce + endive/radicchio, lettuce + rocket and lettuce+chives) showed significantly higher Staphylococcus spp. counts in summer (2.10, 2.55 and 2.67 log cfu/g, respectively) compared to winter (0.32, 0.00 and 0.00 log cfu/g, respectively), while rocket presented higher values (p = 0.032) in winter compared to summer (Figure 2E). LAB on all types of salads was found in decreased numbers in summer (ranging from 3.98 to 5.02 log cfu/g) compared to winter (ranging from 5.21 to 6.63 log cfu/g) (Figure 2G). Samples of lettuce + cabbage collected in summer showed significantly higher Pseudomonas spp. values compared to those collected in winter (5.61 and 2.00 log cfu/g, respectively), while the opposite was evidenced for the lettuce + rocket samples that showed higher values in winter compared to summer (7.47 and 5.78 log cfu/g) (Figure 2H). Moreover, yeasts and molds were found in significantly decreased numbers in samples of lettuce + endive/radicchio, lettuce+rocket and other (lettuce + two or more ingredients), collected in winter (4.74, 4.91 and 4.39 log cfu/g, respectively) compared to the ones collected in summer (5.84, 6.16 and 5.58 log cfu/g, respectively) (Figure 2I). TVC, Enterobacteriaceae, coliforms and B. cereus counts were not significantly different (p > 0.05) among samples collected in winter and summer for all types of salad, as shown in Figure 2A–C,F and Table 2.
3.1.2. Total Phenols Content, Antioxidants, CO2, H2O2 and Lipid Peroxidation
Salad Producer
Total phenols content was found higher for producer C in summer compared to winter (0.86 and 0.69 mg GAE/g Fw) (Figure 3A and Table 1). Samples from all salad producers collected in winter showed significantly higher DPPH antioxidant values (DPPH: ranging from 1.22 to 1.60 mg Trolox/g Fw, respectively) compared to the ones collected in summer (DPPH: ranging from 0.23 to 0.51 mg Trolox/g Fw, respectively) (Figure 3Β and Table 1). Producer E samples showed significantly lower FRAP activity (p = 0.015) in summer compared to winter (Figure 3C). Similarly, samples from producer A presented lower FRAP activity in summer compared to the ones collected in winter. Samples from producer C presented higher ABTS activity in summer compared to winter (ABTS: 0.49 and 0.41 mg Trolox/g Fw, respectively) (Figure 3D). Higher lipid peroxidation was observed in winter for producer A samples compared to summer (10.56 and 6.21 nmol MDA/g Fw, respectively) (Figure 3G). The H2O2 production and% CO2 did not differ among the examined producers for both seasons (Figure 3E,F and Table 1).
Type of Salad
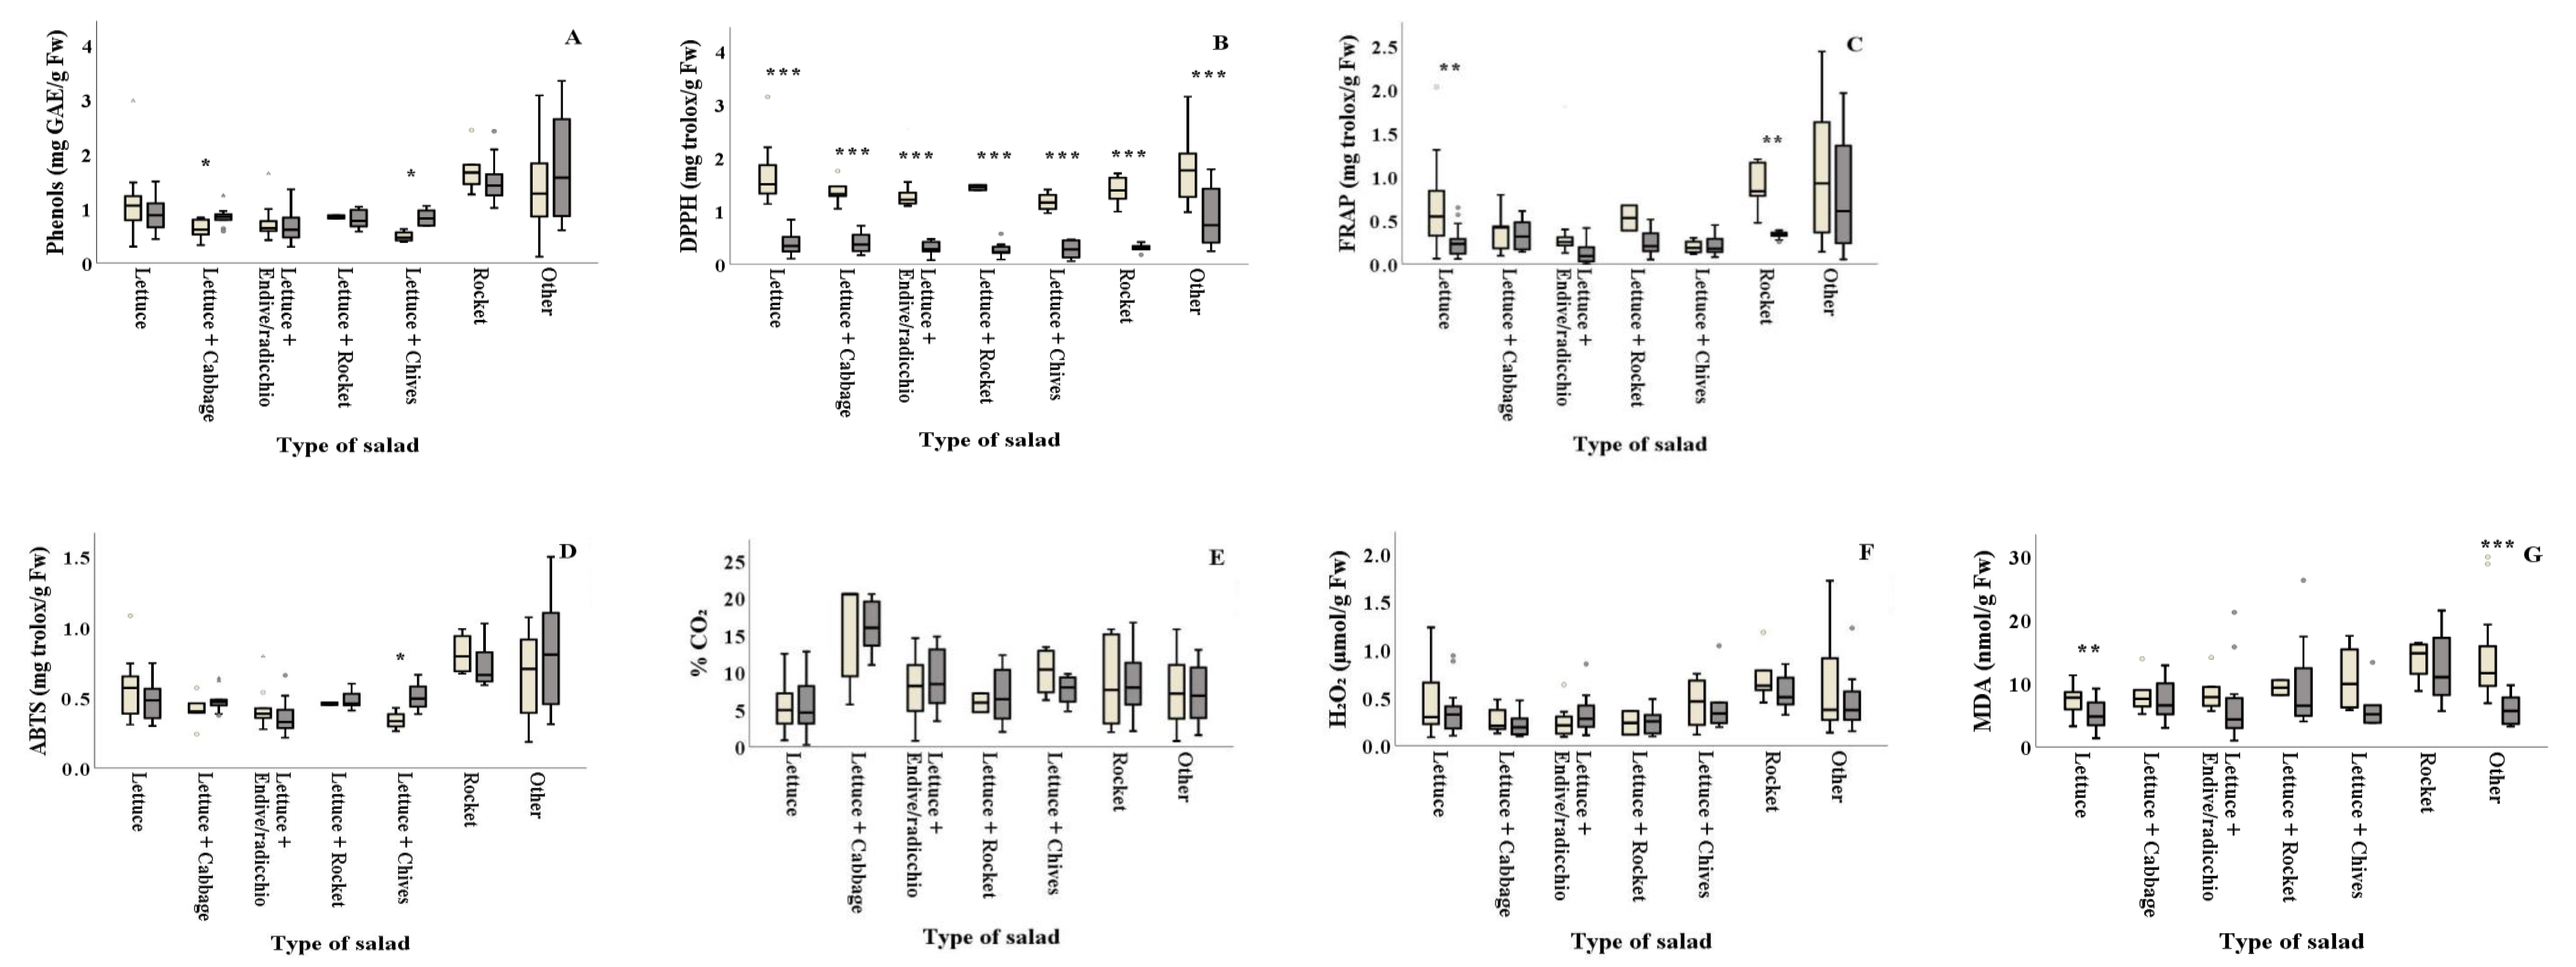
Salad types of lettuce+cabbage and lettuce+chives revealed higher phenolic content in summer (0.85 and 0.84 mg GAE/g Fw, respectively) compared to winter (0.62 and 0.49 mg GAE/g Fw, respectively) (Figure 4A and Table 2). The DPPH assay revealed that antioxidant content of all types of salad significantly differed between the two seasons, with summer (ranging from 0.27 to 0.89 mg Trolox/g Fw, respectively) showing lower values than winter (ranging from 1.17 to 1.77 mg Trolox/g Fw, respectively) (Figure 4B and Table 2). Plain lettuce and plain rocket presented higher antioxidant activity in winter (FRAP: 0.64 and 0.88 mg Trolox/g Fw, respectively) compared to summer (FRAP: 0.25 and 0.33 mg Trolox/g Fw, respectively) (Figure 4C). On the other hand, lettuce+chives significantly decreased the ABTS antioxidant activity in winter compared to summer (ABTS: 0.34 and 0.51 mg Trolox/g Fw, respectively) (Figure 4D). Lipid peroxidation was found to be significantly higher in winter for plain lettuce (p = 0.002) and lettuce+two or more ingredients (other) (p = 0.003) (7.49 and 13.50 nmol MDA/g Fw, respectively) compared to summer (5.01 and 5.85 nmol MDA/g Fw, respectively) (Figure 4G). No significant differences (p > 0.05) were reported for% CO2 and H2O2 production among samples collected in winter and summer for all types of salad, as illustrated in Figure 4E,F and Table 2.
3.2. Effects of Shelf Life
3.2.1. Microbiological Analysis
Salad Producer
Purchase (actual) vs. Expiration date in winter and summer: The effect of the storage period of purchase and expiration date on microbial load on different salad producers are presented in Figure S1 and Table 3. Salads from producer A exhibited significantly higher TVC numbers at the end of their shelf life in winter than the expiration date in summer (Figure S1). During summer, the polynomial curve with concave upward was described by y = 0.0556x2 − 0.2409x + 7.3881; R2 = 0.92, while the relevant curve in winter was y = 0.0065x2 + 0.077x + 7.5665; R2 = 0.49. Moreover, in winter, salads from producer A on their expiration date exhibited higher Enterobacteriaceae with polynomial curve (concave downward) described by y = −0.1334x2 + 1.1601x + 4.78; R2 = 0.92 (Figure S1), and increased LAB counts with polynomial curve and concave downward described by y = −0.0995x2 + 0.8922x + 4.387; R2 = 0.80 (Figure S1). Summer was the season in which increased Staphylococcus spp. with a polynomial curve (concave upward) described by y = 0.092x2 − 0.3665x + 0.7854; R2 = 0.48 for salads from producer A on an expiration date (Figure S1). Additionally, during the summer period, salads from producer B on an expiration date revealed decreased yeasts and mold numbers with polynomial curve and concave downward being described by y = −0.3454x2 + 2.8219x − 0.4864; R2 = 1.00 (Figure S1). Samples from all salad producers collected throughout shelf life did not present significant differences among seasons for coliforms, E. coli, B. cereus, and Pseudomonas spp. (Figure S1). Due to the pre-enrichment and enrichment of samples, the presence/absence of L. monocytogenes in all samples was examined. Presumptive colonies from three samples (3 salads) were isolated, but when PCR tested, none of them was identified as L. monocytogenes.
Type of Salad
Purchase (actual) vs. Expiration date in winter and summer: The effect of the storage period of purchase and expiration date on microbial load on different types of salads are presented in Figure S2 and Table 4. Expiration date TVC numbers were found higher in both seasons for lettuce+endive/radicchio (8.13 and 8.01 log cfu/g for winter and summer, respectively) compared to purchase day (7.61 and 7.27 log cfu/g for winter and summer, respectively) (Table 4) During winter, in case of lettuce+endive/radicchio the polynomial curve with concave upward is described by y = 0.0694x2 − 0.4229x + 8.156; R2 = 0.68, while the relevant curve (concave downward) in summer is described by y = −0.0287x2 + 0.5487x + 5.8757; R2 = 0.86 (Figure S2). During summer, increased TVC numbers were observed for lettuce+rocket on the product expiration date (p = 0.012; 8.45 log cfu/g), whereas rocket and lettuce+two or more ingredients (other) presented higher expiration TVC counts in winter (7.87 and 8.22 log cfu/g, respectively) (Table 4). The polynomial curve with concave upward for lettuce+rocket is described by y = 0.1238x + 7.5249; R2 = 1.00, while the relevant curves for rocket and other are described by y = 0.0384x2 − 0.1831x + 7.5846; R2 = 1.00 and y = 0.0091x2 + 0.1099x + 7.2934; R2 = 0.85, respectively (Figure S2). Expiration Enterobacteriaceae numbers were found increased on lettuce+endive/radicchio on both seasons (7.26 and 7.09 log cfu/g for winter and summer, respectively) compared to purchase day (6.51 and 6.39 log cfu/g for winter and summer, respectively) and the polynomial curve with concave upward for winter is described by y = 0.032x2 − 0.0589x + 6.4607; R2 = 0.99, while the relevant curve (concave downward) for summer is described by y = −0.1721x2 + 1.7325x + 2.9305; R2 = 0.95 (Figure S2). Winter was the season in which plain lettuce and lettuce+endive/radicchio exhibited significantly higher coliform counts on expiration date compared to purchase day (Table 4), and the relevant polynomial curves are described in Figure S12A,C. Pseudomonas spp. and yeasts and molds counts were found to be significantly higher on an expiration date for lettuce+rocket in summer (5.85 and 5.24 log cfu/g, respectively) compared to purchase day (5.71 and 5.24 log cfu/g, respectively), while on the same season increased LAB numbers were observed for lettuce+rocket on purchase day compared to the expiration date (4.90 and 4.68 log cfu/g, respectively) (Figure S2 and Table 4). During summer for lettuce+rocket, the polynomial curves for Pseudomonas spp. and yeasts and molds with concave upward are described by y = 0.0403x2 + 5.6089x; R2 = 1.00 and y = 0.1393x2 − 0.9671x + 6.028; R2 = 1.00, respectively, while the relevant curve for LAB is described by y = 0.1141x2 − 1.0079x + 6.6222; R2 = 1.00 (Figure S2). No significant differences were observed between the day of purchase and the expiration date of salads among seasons for E. coli, Staphylococcus spp. and B. cereus (Figure S2). L. monocytogenes in all samples were negative-tested, as described above.
3.2.2. Total Phenolic Content, Antioxidants, CO2, H2O2 and Lipid Peroxidation
Salad Producer
Purchase (actual) vs. Expiration date in winter and summer: The effect of the storage period of purchase and expiration date on plant-related parameters on different salad producers is presented in Figure S3 and Table 3. Increased expiration CO2 production was reported for producer A on both seasons (10.52 and 8.95% CO2 for winter and summer, respectively). During winter, the polynomial curve with concave upward is described by y = 0.3216x2 − 1.1189x + 4.4455; R2 = 0.44, while the relevant curve (concave downward) in summer is described by y = −0.2193x2 + 2.5629x + 1.5943; R2 = 0.94 (Figure S3). For producer C, increased CO2 production was also observed on the expiration date for both seasons (14.25 and 12.09% CO2 for winter and summer, respectively), and the relevant polynomial curves (concave upward and downward) are described in Figure S3. Moreover, salads from producer E presented higher CO2 production on their expiration date on both seasons (7.73 and 10.31% CO2 for winter and summer, respectively) compared to purchase day (3.24 and 3.44% CO2 for winter and summer, respectively). The polynomial curve with concave upward for winter is described by y = 0.8554x2 − 4.9645x + 6.765; R2 = 0.96, while the relevant curve for summer is described by y = 1.56x2 − 11.472x + 23.244; R2 = 0.97 (Figure S3). Higher expiration H2O2 levels were reported for samples from producers A and C in both seasons (A: 10.04 and 5.86 μmol H2O2/g Fw; C: 6.97 and 7.20 μmol H2O2/g Fw for winter and summer, respectively), and the relevant polynomial curves are described in Figure S3. Furthermore, in winter, samples from producers D and E presented higher expiration H2O2 levels compared to purchase day. During winter, the polynomial curve with concave upward for producer D is described by y = 0.0519x2 − 0.3925x + 0.8563; R2 = 0.99, while the relevant curve for producer E is described by y = 0.0207x2 − 0.0554x + 0.4204; R2 = 0.52 (Figure S3). Increased MDA levels were reported on the expiration dates for samples from producers A and C in both seasons (Figure S3). Samples collected in winter from producers D and E presented higher MDA levels on their expiration date (12.47 and 7.20 nmol MDA/g Fw, respectively) compared to purchase day (0.37 and 0.85 nmol MDA/g Fw, respectively), and the relevant polynomial curves are described in Figure S3. No significant differences (p > 0.05) were observed between the day of purchase and the expiration date of salads among producers in both seasons for their phenolic content and antioxidant capacity (with DPPH, FRAP and ABTS assays) (Figure S3).
Type of Salad
Purchase (actual) vs. Expiration date in winter and summer: The effect of the storage period of purchase and expiration date on plant-related parameters on different types of salads are presented in Figure S4 and Table 4. Increased phenolic content was observed on the expiration date in summer (p = 0.010) for lettuce+chives compared to purchase day (0.97 and 0.70 mg GAE/g Fw, respectively) and the polynomial curve with concave upward is described by y = 0.0398x2 − 0.2518x + 1.0533; R2 = 1.00 (Figure S4 and Table 4). During winter, increased FRAP antioxidant activity was reported on the expiration date for lettuce+cabbage compared to purchase day, while plain rocket showed higher FRAP on the expiration date in summer compared to purchase day (Figure S4). The relevant polynomial curve with concave upward for lettuce+cabbage is described by y = 0.0047x2 + 0.0384x + 0.1125; R2 = 0.63, while the respective curve for rocket is described by y = 0.0112x2 − 0.0713x + 0.3847; R2 = 0.73 (Figure S4).
Increased CO2 production was observed for plain lettuce and lettuce+radicchio for both seasons on expiration date compared to purchase day, and the relevant polynomial curves are described in Figure S4. Summer was the season in which lettuce+rocket and lettuce+chives presented higher CO2 production on the expiration date (9.25 and 9.26% CO2, respectively) compared to purchase day (4.58 and 6.01% CO2, respectively). During summer, the polynomial curve for lettuce+rocket with concave downward is described by y = −0.5253x2 + 5.6869x − 5.9625; R2 = 1.00, whereas the relevant curve for lettuce+chives is described by y = −0.0406x2 + 0.6438x + 3.965; R2 = 1.00 (Figure S4). Higher expiration CO2 production was reported significantly higher on the expiration date for plain rocket and lettuce+two or more ingredients (other) (p = 0.004 and 0.001, respectively) (14.25 and 10.31% CO2, respectively) compared to purchase day (2.84 and 4.53% CO2, respectively) in winter (Figure S4 and Table 4). During winter, the polynomial curve for rocket with concave upward is described by y = 0.2208x2 + 0.6242x + 2.555; R2 = 1.00, whereas the relevant curve for lettuce+two or more ingredients (other) is described by y = 0.343x2 − 1.313x + 5.0301; R2 = 0.65 (Figure S4).
Plain lettuce’s, lettuce+cabbage and lettuce+endive/radicchio expiration H2O2 levels were found significantly higher on both seasons compared to purchase day, and their relevant polynomial curves are described in Figure S4 and Table 4). H2O2 levels for lettuce+chives were increased in summer on the expiration date than the purchase day (4.67 and 0.30 μmol H2O2/g Fw, respectively), and the polynomial curve with concave upward is described by y = 0.0532x2 − 0.3693x + 0.861; R2 = 1.00 (Figure S4). Plain rocket’s and lettuce+two or more ingredients (other) expiration H2O2 levels were found significantly increased on both seasons compared to purchase day, and their relevant polynomial curves are described in Figure S4 and Table 4.
Plain lettuce’s, lettuce+cabbage and lettuce+endive lipid peroxidation levels were found significantly increased on both seasons on the expiration date (lettuce: 8.08 and 4.91 nmol MDA/g Fw; lettuce+cabbage: 10.39 and 7.14 nmol MDA/g Fw; lettuce+endive/radicchio: 8.54 and 5.95 nmol MDA/g Fw for winter and summer, respectively) compared to purchase day (lettuce: 0.49 and 0.27 nmol MDA/g Fw; lettuce+cabbage: 0.24 and 0.19 nmol MDA/g Fw; lettuce+endive/radicchio: 0.21 and 0.36 nmol MDA/g Fw for winter and summer, respectively) and their relevant polynomial curves are described in Figure S4 and Table 4). Plain rocket’s expiration MDA levels were found significantly increased on both seasons (15.27 and 15.19 nmol MDA/g Fw for winter and summer, respectively), and the polynomial curve for winter with concave upward is described by y = 0.9881x2 − 7.2301x + 19.413; R2 = 1.00, whereas the relevant curve for summer is described by y = 0.1919x2 − 0.6568x + 4.8891; R2 = 1.00 (Figure S4 and Table 4). Similarly, lipid peroxidation levels for lettuce+two or more ingredients (other) were increased on expiration date for both seasons (14.54 and 5.80 nmol MDA/g Fw winter and summer, respectively) and the polynomial curve for winter with concave downward is described by y = −0.3059x2 + 2.4755x + 9.6229; R2 = 0.29, whereas the relevant curve for summer is described by y = −0.0791x2 + 0.4891x + 5.7124; R2 = 1.00 (Figure S4).
No significant differences (p > 0.05) were observed between the day of purchase and the expiration date of salads among seasons for their antioxidant activity (with DPPH and ABTS assays) (Figure S4).
4. Discussion
Higher E. coli populations were observed for samples from salad producers A and C in summer compared to winter samples, while samples from producer C showed increased B. cereus counts in summer. It has been previously mentioned that Bacillus spp. and Pseudomonas spp. (including Bacillus mojavensis, Bacillus megaterium and P. fluorescens) have been isolated from ready-to-eat salads [39]. The presence of these bacteria may accelerate the degradation of vegetables, or they can antagonize foodborne pathogens, such as Listeria monocytogenes and Salmonella enterica in that environment [39]. During winter, higher levels of spoilage microorganisms, such as yeasts and molds, were reported for producers A and B. Furthermore, Pseudomonas spp. counts were increased for producer B in winter, while LAB was found higher for producers A, C and E in the same season. The presence of LAB was evident since the beginning of the processing of ready-to-eat vegetables, and increased numbers were reported after seven days of storage at 4 °C for sliced cabbage (air packaging), iceberg lettuce chopped (MAP), mixed endive, radicchio and “lollo rosso” lettuce (MAP) [40]. This may suggest that LAB is part of the endogenous and epiphytic microflora of raw fresh produce. In a study conducted in Italy, no significant difference in yeasts and mold populations of ready-to-eat salads (rocket, baby leaf lettuce and lamb’s lettuce) was reported among spring and summer [41]. No significant differences were observed for TVC, Enterobacteriaceae, coliforms and Staphylococcus spp. among seasons for all producers. On the other hand, aerobic psychotropic microorganisms were found in high numbers (up to 8.5 log cfu/g) in ready-to-eat salads collected in summer in Portugal [39]. The differences in the microbial load between seasons might be attributed to the different climatic conditions in each geographic area of cultivation. For instance, in Italy and Cyprus, as in many other Mediterranean countries, autumn and winter are characterized by rainfall (high moisture levels) and relatively low temperatures [26,30]. These observations might partially explain the high levels of psychrotrophic microorganisms (i.e., Pseudomonas spp., LAB, yeasts and molds) reported in winter (compared to summer) in the present study.
Total phenolic content was increased in summer for samples from producer C, while antioxidants were increased for all salad producers in winter. Caponigro et al. [26] reported higher average visual quality in winter and spring compared to summer and autumn. These findings might suggest less phenolic oxidation levels and other degradative processes that can compromise the nutritional value (phenols, antioxidants) of these products. Lipid peroxidation increased for samples collected from producer A in summer compared to winter. Kang and Saltveit [42] have previously mentioned that wounding of plant tissue (i.e., from cutting) can induce increased antioxidant activity in romaine and iceberg lettuce. No differences were observed for CO2 production and H2O2 levels among samples for all producers among seasons.
Summer was the season in which E. coli counts were found to be higher for plain lettuce. Staphylococcus spp. was found in increased numbers in summer for the lettuce + endive/radicchio, lettuce + rocket and lettuce + chives type of salads, while for plain rocket increased Staphylococcus spp. was reported in winter. Bell et al. [23] reported significantly increased microbial load (total aerobic counts) of rocket salad during shelf life. Decreased LAB populations were observed in summer for all types of salad, while Pseudomonas spp. was found in higher numbers for lettuce + cabbage in summer, while higher counts were also reported in winter for lettuce+rocket. High yeasts and mold counts were observed in winter for lettuce + endive/radicchio, lettuce + rocket and lettuce + two or more ingredients (other). De Corato [41] reported that lettuce salad presented lower yeasts and mold counts compared to rocket and lamb’s lettuce. No significant differences were observed for TVC, Enterobacteriaceae, coliforms and B. cereus for all producers among seasons. Santos et al. [39] reported increased aerobic psychrotrophic microorganisms for ready-to-eat salads (romaine lettuce and mixed vegetable salads) collected in summer compared to spinach samples in the same season. As previously mentioned, the combination of lettuce with other leafy vegetables presented increased E. coli counts as well as antioxidants (DPPH, FRAP), while at the same time, TVC, Enterobacteriaceae and coliforms were found in lower levels [30]. These variations might be attributed to the different microbial load of each vegetable used in the salad mix as well as the processing applied each time.
Increased phenolic content of the lettuce+cabbage and lettuce+chives was observed in summer, while the high antioxidant capacity of samples was observed in winter. Moreover, plain lettuce and rocket showed higher antioxidant activity in winter (as shown by the FRAP assay). Higher lipid peroxidation was reported in winter for plain lettuce and lettuce+two or more ingredients (other). Ferrante et al. [43] reported higher lipid peroxidation values on fresh-cut lamb’s lettuce leaves compared to intact ones when stored at 4 °C up to eight days (up to 51 nmol MDA/g Fw), suggesting that processing, such as cutting along with storage duration and conditions induce plant stress. No differences were observed for CO2 production and H2O2 levels among samples for all producers among seasons. On the other hand, in another study, high CO2 production was reported for rocket salads stored at 5 and 10 °C, and this could be attributed to the high respiration rate of rocket as well as to the abusive storage temperatures (optimum storage conditions for rocket: 0 °C with 95–100% RH) [44].
The expiration date of ready-to-eat salads is a matter of high importance since minimally processed vegetables reaching the maximum of their shelf life start to present defects, such as wilting, browning (loss of green color), development of off-odors and off-flavors that reduce the product’s acceptance from consumers [28]. Furthermore, increased spoilage (mostly) and pathogenic microorganisms have been reported when these products reach their expiration date [26,27,28]. Higher TVC numbers were reported on the expiration date on both seasons for producer A, and high Enterobacteriaceae numbers were also reported for the same producer on the expiration date in winter. A study by Fröder et al. [45] revealed high Enterobacteriaceae and fecal coliforms populations (>2 log cfu/g) in different types of one leafy vegetable salads (iceberg lettuce, watercress, spinach, rocket, chicories) and mixed salads collected in spring and summer. High total mesophilic counts were also reported at the end of self-life of ready-to-eat rocket salads (lower than 7 log cfu/g) [46]. Summer was the season in which samples from producer A showed increased Staphylococcus spp. on their expiration date compared to the purchase date. On the other hand, samples from producer C presented low expiration Staphylococcus spp. numbers in summer. In our study, LAB counts were higher in winter for producer A on the product’s expiration date. Expiration date in summer presented higher yeasts and molds populations for producer B compared to winter. It is worth mentioning that according to De Corato [41], no significant variations of yeasts and molds counts were observed during the shelf life of the samples (rocket, baby leaf lettuce and lamb’s lettuce), while a significant variation on these populations and high numbers of fungi were evident only at the first day of shelf life. No significant differences were observed for coliforms, E. coli and Pseudomonas spp. in our study. The variation in the microbial load of ready-to-eat salads might be attributed to the possible different processing procedures applied by the producers/packagers [30].
Higher CO2 production and H2O2 levels were found in both seasons on the expiration date of samples from producers A and C. This might be attributed to tissue wounding (due to processing, mishandling) in combination with storage and display conditions (i.e., temperature, shelf life duration) that can accelerate the respiration rate of lettuce [47]. Lipid peroxidation and H2O2 levels were increased in winter on the last day of shelf life. Moreover, higher CO2 production was observed for producer E in winter and summer. Increased respiration rate for wild rocket salad was reported in spring to compare to summer (55.2 and 25.2 mL CO2/kg/h, respectively) when samples were stored at 5 °C and at the same time, rocket’s green color was preserved better in spring compared to summer [48]. However, it has been previously mentioned that lipid peroxidation resulting from plant stress (including increased respiration) can negatively affect the green color vegetables due to pigment bleaching (chlorophylls, carotenoids) and the production of brown pigments [49]. In our study, no differences were reported for phenols and antioxidants among seasons and days of analysis for all producers.
Expiration date in summer showed high TVC numbers for the combinations of lettuce with radicchio/endive, and rocket, while in winter, increased counts were found for the plain rocket, the combinations of lettuce with radicchio/endive and two/more ingredients (other). In a study by Sant’Ana et al. [50] in which the microbial load of nine different ready-to-eat vegetables (escarole, collard green, spinach, watercress, arugula, grated carrot, green salad, and mix for yakisoba) was assessed, it has been shown that total aerobic counts increased at the end of shelf life of the products (ranging from 2 to 8 log cfu/g) and this resulted from different storage temperatures (the higher the temperature, the higher the populations) as well as the type of vegetable among other factors [26]. Higher Enterobacteriaceae and coliform populations were found on the expiration date for the combination of lettuce and radicchio/endive on both seasons. Arvanitoyannis et al. [51] reported that a decrease in Enterobacteriaceae populations was evident (up to 0.5 log cfu/g) on the tenth day of storage with or without MAP. Interestingly in the same study, psychrotrophic counts were not influenced by the combination of lettuce with a rocket [51]. However, in our study, increased numbers of spoilage and psychrotrophic microorganisms (i.e., LAB, Pseudomonas spp., yeasts and molds) were observed on expiration date in summer for the combination of lettuce with rocket, as our ready-to-eat salads were stored in chilled conditions (7 °C). These observations might be due to improper handling and/or storage/transfer of ready-to-eat salads at inappropriate temperatures (up to 15 °C or even higher) in a commercial refrigerator. It is noteworthy that it has been previously mentioned that LAB have been isolated most from ready-to-eat vegetables under MAP [26,52]. Sant’Ana et al. [50] reported increased LAB populations on most ready-to-eat vegetables studied at the end of their shelf life when stored at abusive temperatures (15 °C). De Corato [41] reported that yeasts and mold counts were higher on the second day of shelf life for rocket salad on both seasons assessed (spring and summer) compared to lettuce and lamb’s lettuce salads. In our study, no significant differences were reported for E. coli, Staphylococcus spp. and B. cereus between purchase and expiration date among seasons for all types of salads.
Increased total phenolic content was reported on the expiration date of the combination of lettuce and chives in summer. On the other hand, decreased phenolics were reported for baby lettuce, curly endive and iceberg lettuce after 4 days of storage at 4 °C, while no significant differences among phenolic content were reported for radicchio, rocket and lamb’s lettuce [53]. This may be attributed to the packaging conditions in bagged samples due to the modified atmosphere packaging of these vegetables. Higher antioxidants (by FRAP assay) on product expiration date were observed in winter for the combination of lettuce with cabbage and in summer for the plain rocket. Preti and Vinci [53] reported increased antioxidants compounds (by DPPH assay) on the expiration date of baby lettuce, curly endive, lamb’s lettuce, rocket and radicchio salads. The majority of the combinations of lettuce with other ingredients showed higher H2O2 and MDA levels on the expiration date in both seasons. It is noteworthy to mention that Cavaiuolo et al. [27] reported a relation between lipid peroxidation and storage temperature of rocket, suggesting that storage of minimally processed vegetables, such as rocket at adverse (increased) temperatures increases respiration rate and negatively affects product quality due to plant stress and senescence. This is following our results since plain rocket showed higher CO2 production and MDA levels on the expiration date for both seasons. Arvanitoyannis et al. [51] reported increased CO2 levels of rocket with or without its combination with lettuce through storage at 5 °C for 10 days. Moreover, Nousiainen et al. [28] suggested that the increased CO2 production reported might have been attributed to the different types of vegetables as well as the microbial load of these products. These come following the findings of our study, where lettuce+endive in winter showed increased microbial load (TVC, Enterobacteriaceae and coliforms) and CO2 production on the expiration date. No significant differences were reported for antioxidant activity (by DPPH and ABTS assays) between purchase and expiration date among seasons for all types of salads.
5. Conclusions
The microbial load was varied, depending not only on the packager-salad producer but also on the mixtures of the different salad types. Therefore, common and safe sanitation management is important in the preparation of ready-to-eat salads. Summer was the season in which Escherichia coli counts were found to be higher for plain lettuce, but Staphylococcus spp. was increased in winter in plain rocket salads. Additionally. Staphylococcus spp. was increased in different salad-type mixtures, such as lettuce + endive/radicchio, lettuce + rocket and lettuce + chives in the summer period. Listeria monocytogenes were absent in any of the samples tested. Regarding expiration date (OR “estimated expiration date”), it was evident that microbial load (mainly spoilage microorganisms, such as Pseudomonas spp., yeasts and molds) increased during shelf life. Various salad types are respiring differently through the metabolic respiration process. The increased respiration rates through the increased CO2 production and damage indexes (H2O2 and MDA) observed on expiration date on both seasons indicating plant stress at the end of shelf life. These results suggest that the investigation of shelf life (from start to end) is essential for the understanding and development of novel technics monitoring the safety and quality of these products.
Supplementary Materials
The following are available online at https://www.mdpi.com/article/10.3390/foods10050941/s1, Figure S1: Effects of shelf life (days) on microbiological quality per salad producer in winter and summer. Figure S2: Effects of shelf life (days) on microbiological quality per type of salad in winter and summer. Figure S3: Effects of shelf life (days) on total phenolic content, antioxidants, % CO2 and damage index (H2O2 and lipid peroxidation) per salad producer in winter and summer. Figure S4: Effects of shelf life (days) on total phenolic content, antioxidants, % CO2 and damage index (H2O2 and lipid peroxidation) per type of salad in winter and summer.
Author Contributions
Conceptualization, P.X., G.B. and N.T.; methodology, P.X., G.B., P.S. and N.T.; software, P.X.; validation, P.X., G.B. and N.T.; formal analysis, P.X. and G.B.; investigation, P.X.; resources, G.B. and N.T.; data curation, P.X., G.B. and N.T.; writing—original draft preparation, P.X.; writing—review and editing, P.X., G.B., P.S. and N.T.; visualization, P.X. and N.T.; supervision, G.B. and N.T.; project administration, N.T.; funding acquisition, N.T. All authors have read and agreed to the published version of the manuscript.
Funding
This research has been co-financed by Cyprus University of Technology Open Access Author Fund.
Institutional Review Board Statement
Not applicable.
Informed Consent Statement
Not applicable.
Data Availability Statement
The data presented in this study are available on request from the corresponding author.
Conflicts of Interest
The authors declare no conflict of interest.
References
- Cömert, E.D.; Mogol, B.A.; Gökmen, V. Relationship between color and antioxidant capacity of fruits and vegetables. Curr. Res. Food Sci. 2020, 2, 1–10. [Google Scholar] [CrossRef]
- United States Department of Agriculture (USDA). A Brief History of USDA Food Guides. Available online: https://www.choosemyplate.gov/eathealthy/brief-history-usda-food-guides (accessed on 28 June 2020).
- EFSA. Scientific Opinion on establishing Food-Based Dietary Guidelines. EFSA J. 2010, 8, 1–42. [Google Scholar]
- Balali, G.I.; Yar, D.; Dela, V.G.A.; Adjei-Kusi, P. Microbial Contamination, an Increasing Threat to the Consumption of Fresh Fruits and Vegetables in Today’s World. Int. J. Microbiol. 2020, 2020, 1–13. [Google Scholar] [CrossRef] [PubMed]
- Carstens, C.K.; Salazar, J.K.; Darkoh, C. Multistate Outbreaks of Foodborne Illness in the United States Associated with Fresh Produce From 2010 to 2017. Front. Microbiol. 2019, 10, 2667. [Google Scholar] [CrossRef] [PubMed] [Green Version]
- Henriquez, T.; Lenzi, A.; Baldi, A.; Marvasi, M. Frontiers in Plant Breeding: Perspectives for the Selection of Vegetables Less Susceptible to Enteric Pathogens. Front. Microbiol. 2020, 11, 1087. [Google Scholar] [CrossRef] [PubMed]
- Alegbeleye, O.O.; Singleton, I.; Sant’Ana, A.S. Sources and contamination routes of microbial pathogens to fresh produce during field cultivation: A review. Food Microbiol. 2018, 73, 177–208. [Google Scholar] [CrossRef]
- Iwu, C.D.; Okoh, A.I. Preharvest Transmission Routes of Fresh Produce Associated Bacterial Pathogens with Outbreak Potentials: A Review. Int. J. Environ. Res. Public Health 2019, 16, 4407. [Google Scholar] [CrossRef] [PubMed] [Green Version]
- Xylia, P.; Clark, A.; Chrysargyris, A.; Romanazzi, G.; Tzortzakis, N. Quality and safety attributes on shredded carrots by using Origanum majorana and ascorbic acid. Postharvest Biol. Technol. 2019, 155, 120–129. [Google Scholar] [CrossRef]
- EFSA. Scientific Opinion on the risk posed by pathogens in food of non-animal origin. Part 1 (outbreak data analysis and risk ranking of food/pathogen combinations). EFSA J. 2013, 11, 1–138. [Google Scholar]
- Soon, J.M.; Manning, L.; Davies, W.P.; Baines, R. Fresh produce-associated outbreaks: A call for HACCP on farms? Br. Food J. 2012, 114, 553–597. [Google Scholar] [CrossRef]
- Uyttendaele, M.; Jaykus, L.-A.; Amoah, P.; Chiodini, A.; Cunliffe, D.; Jacxsens, L.; Holvoet, K.; Korsten, L.; Lau, M.; McClure, P.; et al. Microbial Hazards in Irrigation Water: Standards, Norms, and Testing to Manage Use of Water in Fresh Produce Primary Production. Compr. Rev. Food Sci. Food Saf. 2015, 14, 336–356. [Google Scholar] [CrossRef]
- Gorny, J.R.; Giclas, H.; Gombas, D.; Means, K. Commodity Specific Food Safety Guidelines for the Lettuce and Leafy Greens Supply Chain; US Food and Drug Administration: Rockwell, MD, USA, 2006; p. 45.
- Martínez-Vaz, B.M.; Fink, R.C.; Diez-Gonzalez, F.; Sadowsky, M.J. Enteric Pathogen-Plant Interactions: Molecular Connections Leading to Colonization and Growth and Implications for Food Safety. Microbes Environ. 2014, 29, 123–135. [Google Scholar] [CrossRef] [PubMed] [Green Version]
- Al-Kharousi, Z.S.; Guizani, N.; Al-Sadi, A.M.; Al-Bulushi, I.M.; Shaharoona, B. Hiding in Fresh Fruits and Vegetables: Opportunistic Pathogens May Cross Geographical Barriers. Int. J. Microbiol. 2016, 2016, 1–14. [Google Scholar] [CrossRef] [PubMed] [Green Version]
- FAO/WHO. Microbiological Hazards in Fresh Leafy Vegetables and Herbs; Meeting report; Microbiological Risk Assessment Series No. 14; Nutrition and Consumer Protection Division Food and Agriculture Organization of the United Nations: Rome, Italy, 2008. [Google Scholar]
- Dankwa, A.; Machado, R.; Perry, J. Sources of food contamination in a closed hydroponic system. Lett. Appl. Microbiol. 2020, 70, 55–62. [Google Scholar] [CrossRef] [PubMed]
- Yeni, F.; Yavaş, S.; Alpas, H.; Soyer, Y. Most Common Foodborne Pathogens and Mycotoxins on Fresh Produce: A Review of Recent Outbreaks. Crit. Rev. Food Sci. Nutr. 2016, 56, 1532–1544. [Google Scholar] [CrossRef] [PubMed]
- Brandl, M.T.; Cox, C.E.; Teplitski, M. Salmonella Interactions with Plants and Their Associated Microbiota. Phytopathology 2013, 103, 316–325. [Google Scholar] [CrossRef] [Green Version]
- Cox, C.E.; Brandl, M.T.; de Moraes, M.H.; Gunasekera, S.; Teplitski, M. Production of the plant hormone auxin by Salmonella and its role in the interactions with plants and animals. Front. Microbiol. 2018, 8, 1–10. [Google Scholar] [CrossRef] [Green Version]
- CDC Foodborne Outbreaks. Available online: https://www.cdc.gov/foodsafety/outbreaks/index.html (accessed on 11 November 2020).
- Hernández-Reyes, C.; Schikora, A. Salmonella, a cross-kingdom pathogen infecting humans and plants. FEMS Microbiol. Lett. 2013, 343, 1–7. [Google Scholar] [CrossRef] [Green Version]
- Bell, L.; Yahya, H.N.; Oloyede, O.O.; Methven, L.; Wagstaff, C. Changes in rocket salad phytochemicals within the commercial supply chain: Glucosinolates, isothiocyanates, amino acids and bacterial load increase significantly after processing. Food Chem. 2017, 221, 521–534. [Google Scholar] [CrossRef]
- Vallejo, F.; Tomás-Barberán, F.; García-Viguera, C. Health-Promoting Compounds in Broccoli as Influenced by Refrigerated Transport and Retail Sale Period. J. Agric. Food Chem. 2003, 51, 3029–3034. [Google Scholar] [CrossRef]
- McDowell, D.; Maloney, M.; Swan, L.; Erwin, P. A Review of the Fruit and Vegetable Food Chain; Safefood: Cork, Ireland, 2007; pp. 1–102. [Google Scholar]
- Caponigro, V.; Ventura, M.; Chiancone, I.; Amato, L.; Parente, E.; Piro, F. Variation of microbial load and visual quality of ready-to-eat salads by vegetable type, season, processor and retailer. Food Microbiol. 2010, 27, 1071–1077. [Google Scholar] [CrossRef]
- Cavaiuolo, M.; Cocetta, G.; Bulgari, R.; Spinardi, A.; Ferrante, A. Identification of innovative potential quality markers in rocket and melon fresh-cut produce. Food Chem. 2015, 188, 225–233. [Google Scholar] [CrossRef]
- Nousiainen, L.-L.; Joutsen, S.; Lunden, J.; Hänninen, M.-L.; Fredriksson-Ahomaa, M. Bacterial quality and safety of packaged fresh leafy vegetables at the retail level in Finland. Int. J. Food Microbiol. 2016, 232, 73–79. [Google Scholar] [CrossRef]
- Xylia, P.; Chrysargyris, A.; Botsaris, G.; Tzortzakis, N.; Tzortzakis, N. Potential application of spearmint and lavender essential oils for assuring endive quality and safety. Crop. Prot. 2017, 102, 94–103. [Google Scholar] [CrossRef]
- Xylia, P.; Botsaris, G.; Chrysargyris, A.; Skandamis, P.; Tzortzakis, N. Variation of microbial load and biochemical activity of ready-to-eat salads in Cyprus as affected by vegetable type, season, and producer. Food Microbiol. 2019, 83, 200–210. [Google Scholar] [CrossRef]
- ISO 6579. Microbiology of Food and Animal Feeding Stuffs—Horizontal Method for the Detection of Salmonella spp; International Organization for Standardization: Geneva, Switzerland, 2002. [Google Scholar]
- ISO 11290-1. Modification of the Isolation Media and the Haemolysis Test, and Inclusion of Precision Data ISO 11290-1: 1996/Amd 1: 2004; International Organization for Standardization: Geneva, Switzerland, 2004. [Google Scholar]
- Rossmanith, P.; Krassnig, M.; Wagner, M.; Hein, I. Detection of Listeria monocytogenes in food using a combined enrichment/real-time PCR method targeting the prfA gene. Res. Microbiol. 2006, 157, 763–771. [Google Scholar] [CrossRef] [PubMed]
- Tzortzakis, N.G.; Tzanakaki, K.; Economakis, C.D. Effect of Origanum Oil and Vinegar on the Maintenance of Postharvest Quality of Tomato. Food Nutr. Sci. 2011, 2, 974–982. [Google Scholar] [CrossRef] [Green Version]
- Chrysargyris, A.; Panayiotou, C.; Tzortzakis, N. Nitrogen and phosphorus levels affected plant growth, essential oil composition and antioxidant status of lavender plant (Lavandula angustifolia Mill.). Ind. Crop. Prod. 2016, 83, 577–586. [Google Scholar] [CrossRef]
- Wojdylo, A.; Oszmianski, J.; Czemerys, R. Antioxidant activity and phenolic compounds in 32 selected herbs. Food Chem. 2007, 105, 940–949. [Google Scholar] [CrossRef]
- Loreto, F.; Velikova, V. Isoprene Produced by Leaves Protects the Photosynthetic Apparatus against Ozone Damage, Quenches Ozone Products, and Reduces Lipid Peroxidation of Cellular Membranes. Plant Physiol. 2001, 127, 1781–1787. [Google Scholar] [CrossRef]
- Neto, A.D.D.A.; Prisco, J.T.; Enéas-Filho, J.; De Abreu, C.E.B.; Gomes-Filho, E. Effect of salt stress on antioxidative enzymes and lipid peroxidation in leaves and roots of salt-tolerant and salt-sensitive maize genotypes. Environ. Exp. Bot. 2006, 56, 87–94. [Google Scholar] [CrossRef]
- Santos, M.; Cavaco, A.; Gouveia, J.; Novais, M.; Nogueira, P.; Pedroso, L.; Ferreira, M. Evaluation of minimally processed salads commercialized in Portugal. Food Control. 2012, 23, 275–281. [Google Scholar] [CrossRef]
- Pothakos, V.; Snauwaert, C.; De Vos, P.; Huys, G.; Devlieghere, F. Monitoring psychrotrophic lactic acid bacteria contamination in a ready-to-eat vegetable salad production environment. Int. J. Food Microbiol. 2014, 185, 7–16. [Google Scholar] [CrossRef] [PubMed]
- De Corato, U. Fungal Population Dynamics in Ready-to-eat Salads during a Shelf-life in Italy. J. Agric. Sci. Technol. 2012, 2, 569–576. [Google Scholar]
- Kang, H.-M.; Saltveit, M.E. Antioxidant Capacity of Lettuce Leaf Tissue Increases after Wounding. J. Agric. Food Chem. 2002, 50, 7536–7541. [Google Scholar] [CrossRef] [PubMed]
- Ferrante, A.; Martinetti, L.; Maggiore, T. Biochemical changes in cut vs. intact lamb’s lettuce (Valerianella olitoria) leaves during storage. Int. J. Food Sci. Technol. 2009, 44, 1050–1056. [Google Scholar] [CrossRef]
- Amodio, M.; DeRossi, A.; Mastrandrea, L.; Colelli, G. A study of the estimated shelf life of fresh rocket using a non-linear model. J. Food Eng. 2015, 150, 19–28. [Google Scholar] [CrossRef]
- Fröder, H.; Martins, C.G.; De Souza, K.L.O.; Landgraf, M.; Franco, B.D.G.M.; Destro, M.T. Minimally Processed Vegetable Salads: Microbial Quality Evaluation. J. Food Prot. 2007, 70, 1277–1280. [Google Scholar] [CrossRef]
- De Giusti, M.; Solimini, A.G.; Cottarelli, A.; De Vito, C.; Aurigemma, C.; Tufi, D.; Piccinato, L.; Boccia, A.; Marinelli, L. Temporal pattern of microbial indicators of ready-to-eat rocket salads during shelf life. Ann. dell’Istituto Super. Sanità 2014, 50, 90–95. [Google Scholar]
- Deza-Durand, K.M.; Petersen, M.A. The effect of cutting direction on aroma compounds and respiration rate of fresh-cut iceberg lettuce (Lactuca sativa L.). Postharvest Biol. Technol. 2011, 61, 83–90. [Google Scholar] [CrossRef]
- Edelenbos, M.; Løkke, M.M.; Seefeldt, H.F. Seasonal variation in color and texture of packaged wild rocket (Diplotaxis tenuifolia L.). Food Packag. Shelf Life 2017, 14, 46–51. [Google Scholar] [CrossRef]
- Hunter, P.J.; Atkinson, L.D.; Vickers, L.; Lignou, S.; Oruna-Concha, M.J.; Pink, D.; Hand, P.; Barker, G.; Wagstaff, C.; Monaghan, J.M. Oxidative discolouration in whole-head and cut lettuce: Biochemical and environmental influences on a complex phenotype and potential breeding strategies to improve shelf-life. Euphytica 2017, 213, 180. [Google Scholar] [CrossRef] [Green Version]
- Sant’Ana, A.S.; Barbosa, M.S.; Destro, M.T.; Landgraf, M.; Franco, B.D.G.M. Growth potential of Salmonella spp. and Listeria monocytogenes in nine types of ready-to-eat vegetables stored at variable temperature conditions during shelf-life. Int. J. Food Microbiol. 2012, 157, 52–58. [Google Scholar] [CrossRef] [PubMed]
- Arvanitoyannis, I.S.; Bouletis, A.D.; Papa, E.A.; Gkagtzis, D.C.; Hadjichristodoulou, C.; Papaloucas, C. Microbial and sensory quality of “Lollo verde” lettuce and rocket salad stored under active atmosphere packaging. Anaerobe 2011, 17, 307–309. [Google Scholar] [CrossRef] [PubMed]
- Abadias, M.; Usall, J.; Anguera, M.; Solsona, C.; Viñas, I. Microbiological quality of fresh, minimally-processed fruit and vegetables, and sprouts from retail establishments. Int. J. Food Microbiol. 2008, 123, 121–129. [Google Scholar] [CrossRef]
- Preti, R.; Vinci, G. Nutritional and sensory evaluation of ready-to-eat salads during shelf life. Agro Food Ind. Hi. Tech. 2016, 27, 26–31. [Google Scholar]
Figure 1.
Effect of season on the microbiological quality (A–I) of ready-to-eat salads collected in winter ( ![Foods 10 00941 i001]() ) and summer (
) and summer ( ![Foods 10 00941 i002]() ) among salad producers/packagers (A–E). Results include all samples for each microorganism tested and are the mean value ± standard deviation. Each box contains 50 percent of cases, and whiskers represent the rest. The line across the inside of the box represents the median value. *, ** and *** indicate significant differences at p ≤ 5%, 1% and 0.1%.
) among salad producers/packagers (A–E). Results include all samples for each microorganism tested and are the mean value ± standard deviation. Each box contains 50 percent of cases, and whiskers represent the rest. The line across the inside of the box represents the median value. *, ** and *** indicate significant differences at p ≤ 5%, 1% and 0.1%.
 ) and summer (
  ) among salad producers/packagers (A–E). Results include all samples for each microorganism tested and are the mean value ± standard deviation. Each box contains 50 percent of cases, and whiskers represent the rest. The line across the inside of the box represents the median value. *, ** and *** indicate significant differences at p ≤ 5%, 1% and 0.1%.
Figure 1.
Effect of season on the microbiological quality (A–I) of ready-to-eat salads collected in winter ( ![Foods 10 00941 i001]() ) and summer (
) and summer ( ![Foods 10 00941 i002]() ) among salad producers/packagers (A–E). Results include all samples for each microorganism tested and are the mean value ± standard deviation. Each box contains 50 percent of cases, and whiskers represent the rest. The line across the inside of the box represents the median value. *, ** and *** indicate significant differences at p ≤ 5%, 1% and 0.1%.
) among salad producers/packagers (A–E). Results include all samples for each microorganism tested and are the mean value ± standard deviation. Each box contains 50 percent of cases, and whiskers represent the rest. The line across the inside of the box represents the median value. *, ** and *** indicate significant differences at p ≤ 5%, 1% and 0.1%.
) and summer ( ) among salad producers/packagers (A–E). Results include all samples for each microorganism tested and are the mean value ± standard deviation. Each box contains 50 percent of cases, and whiskers represent the rest. The line across the inside of the box represents the median value. *, ** and *** indicate significant differences at p ≤ 5%, 1% and 0.1%.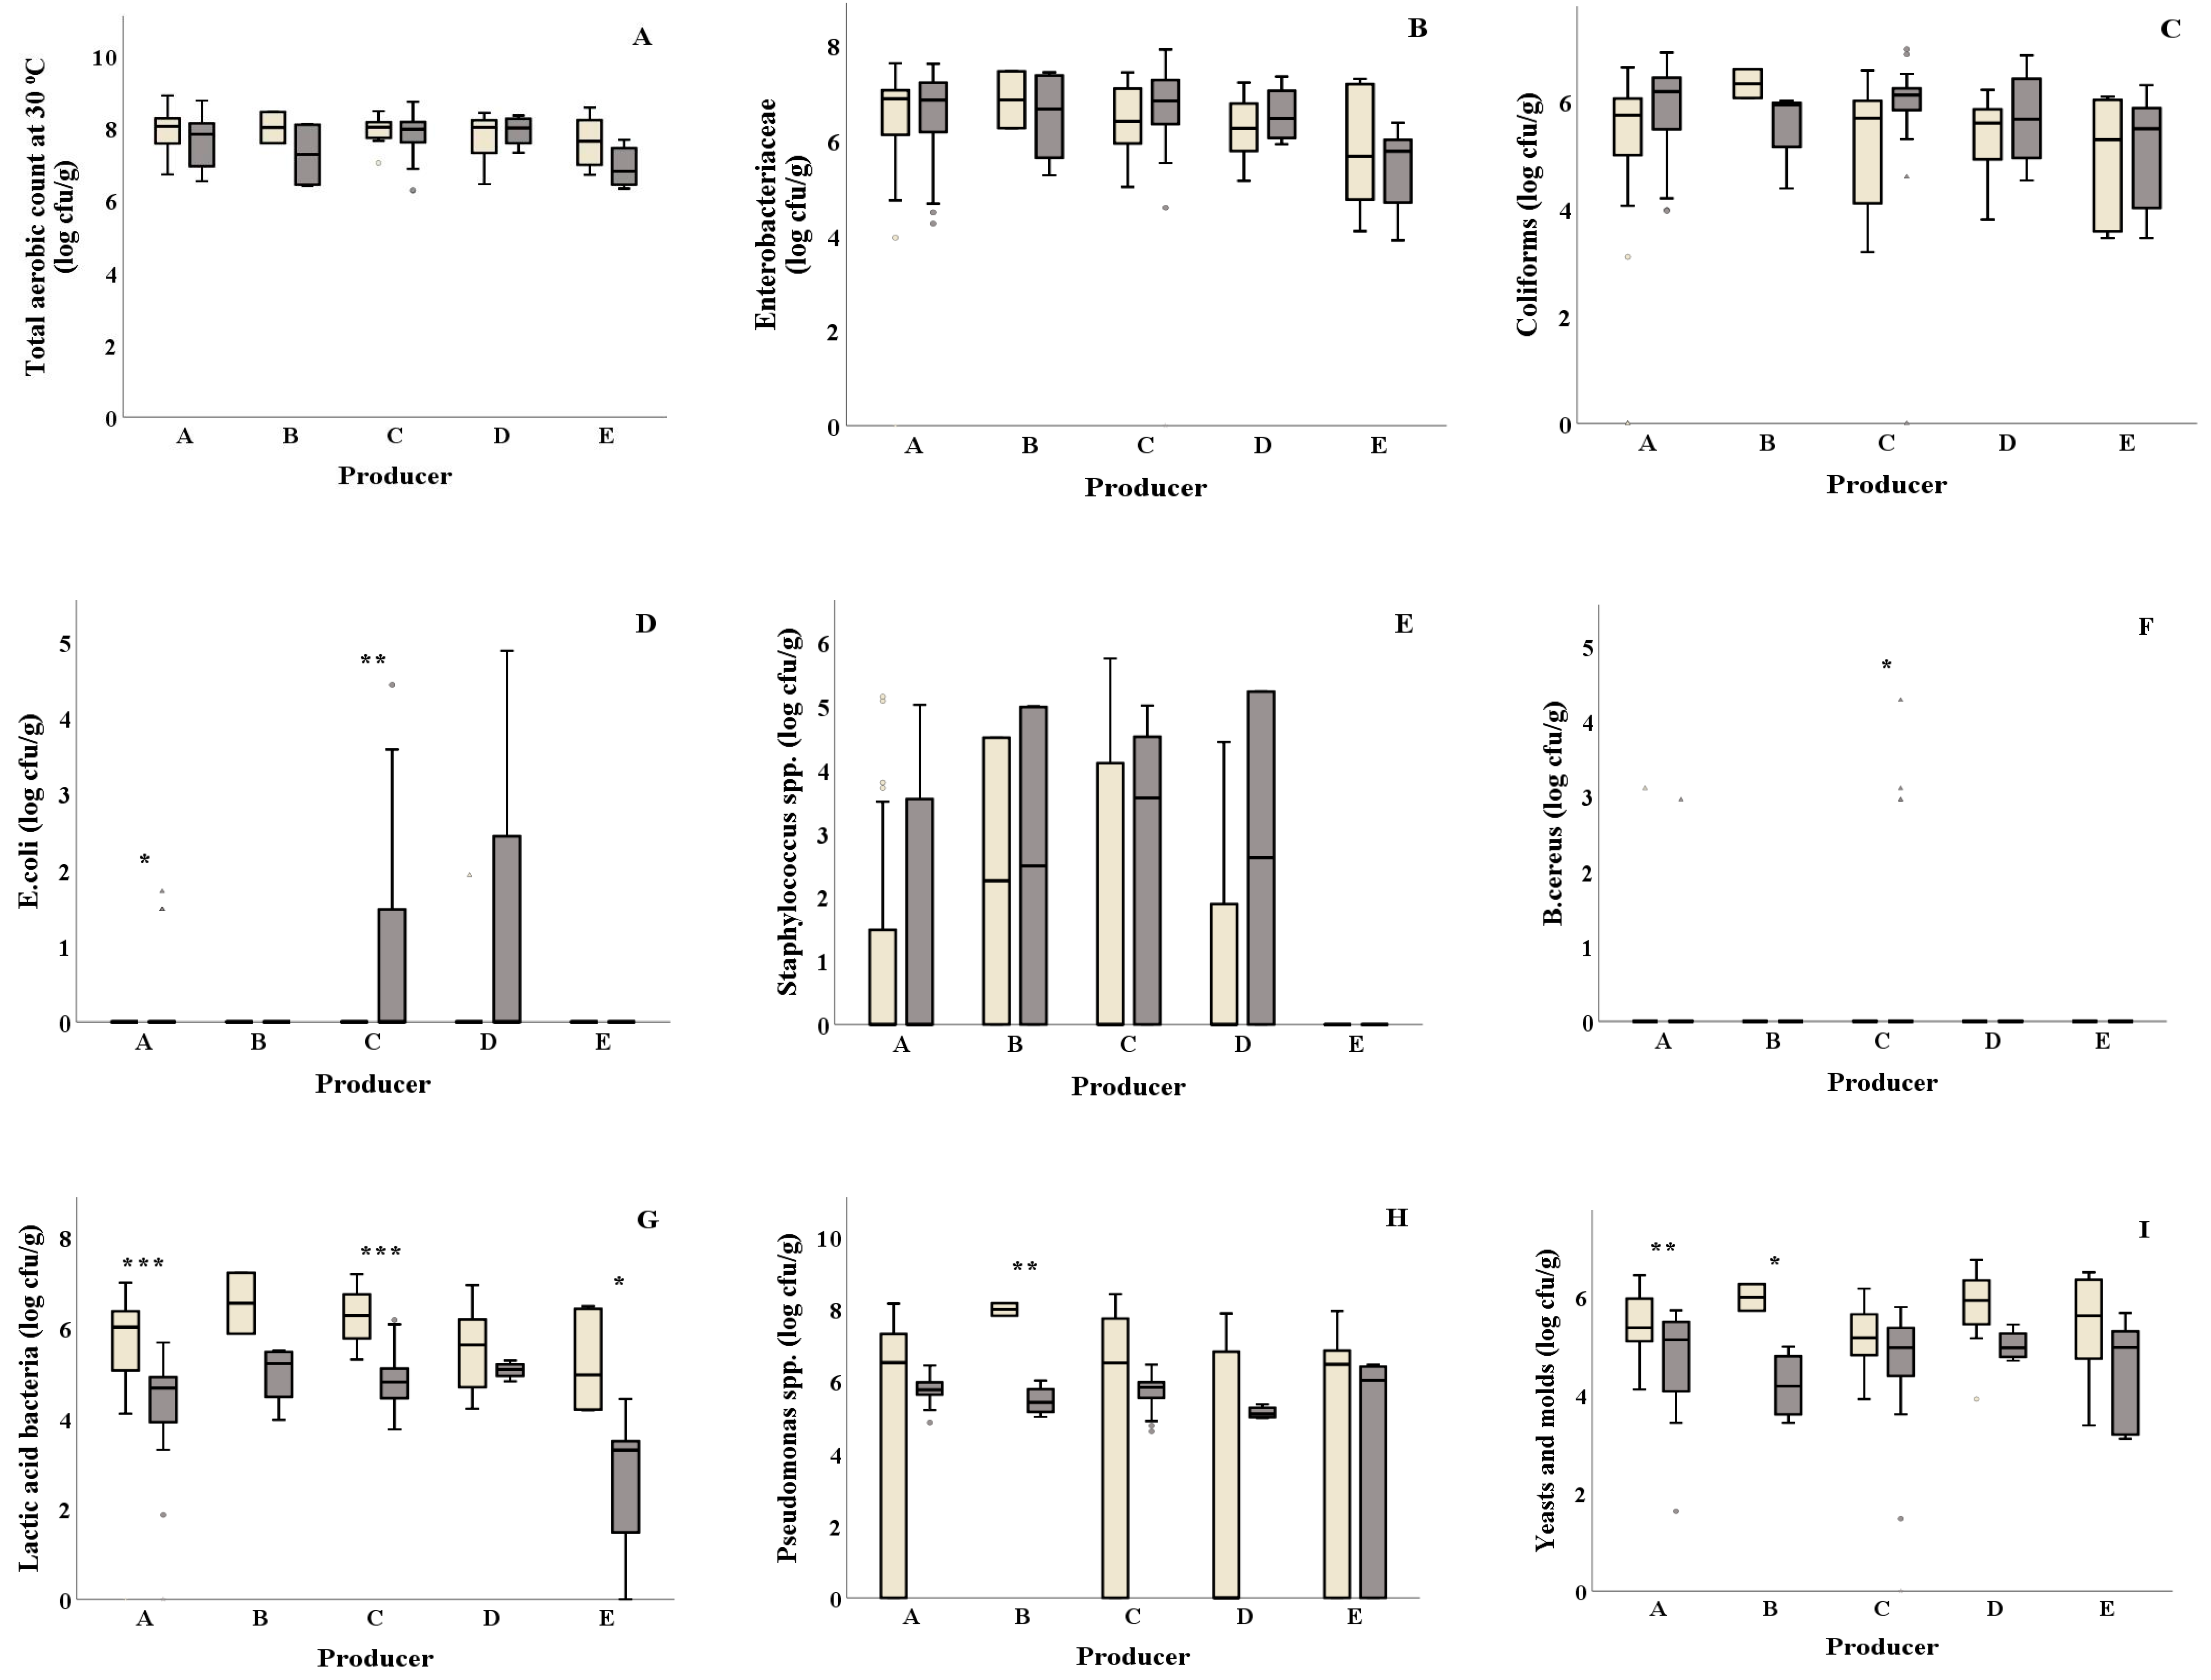
Figure 2.
Microbiological quality (A–I) of different types of ready-to-eat salads collected in winter ( ![Foods 10 00941 i001]() ) and summer (
) and summer ( ![Foods 10 00941 i002]() ). Results include only positive samples for each microorganism tested and are the mean value ± standard deviation. Other = lettuce + 2 or more ingredients. Each box contains 50 percent of cases, and whiskers represent the rest. The line across the inside of the box represents the median value. *, ** and *** indicate significant differences at p ≤ 5%, 1% and 0.1%.
). Results include only positive samples for each microorganism tested and are the mean value ± standard deviation. Other = lettuce + 2 or more ingredients. Each box contains 50 percent of cases, and whiskers represent the rest. The line across the inside of the box represents the median value. *, ** and *** indicate significant differences at p ≤ 5%, 1% and 0.1%.
) and summer ( ). Results include only positive samples for each microorganism tested and are the mean value ± standard deviation. Other = lettuce + 2 or more ingredients. Each box contains 50 percent of cases, and whiskers represent the rest. The line across the inside of the box represents the median value. *, ** and *** indicate significant differences at p ≤ 5%, 1% and 0.1%.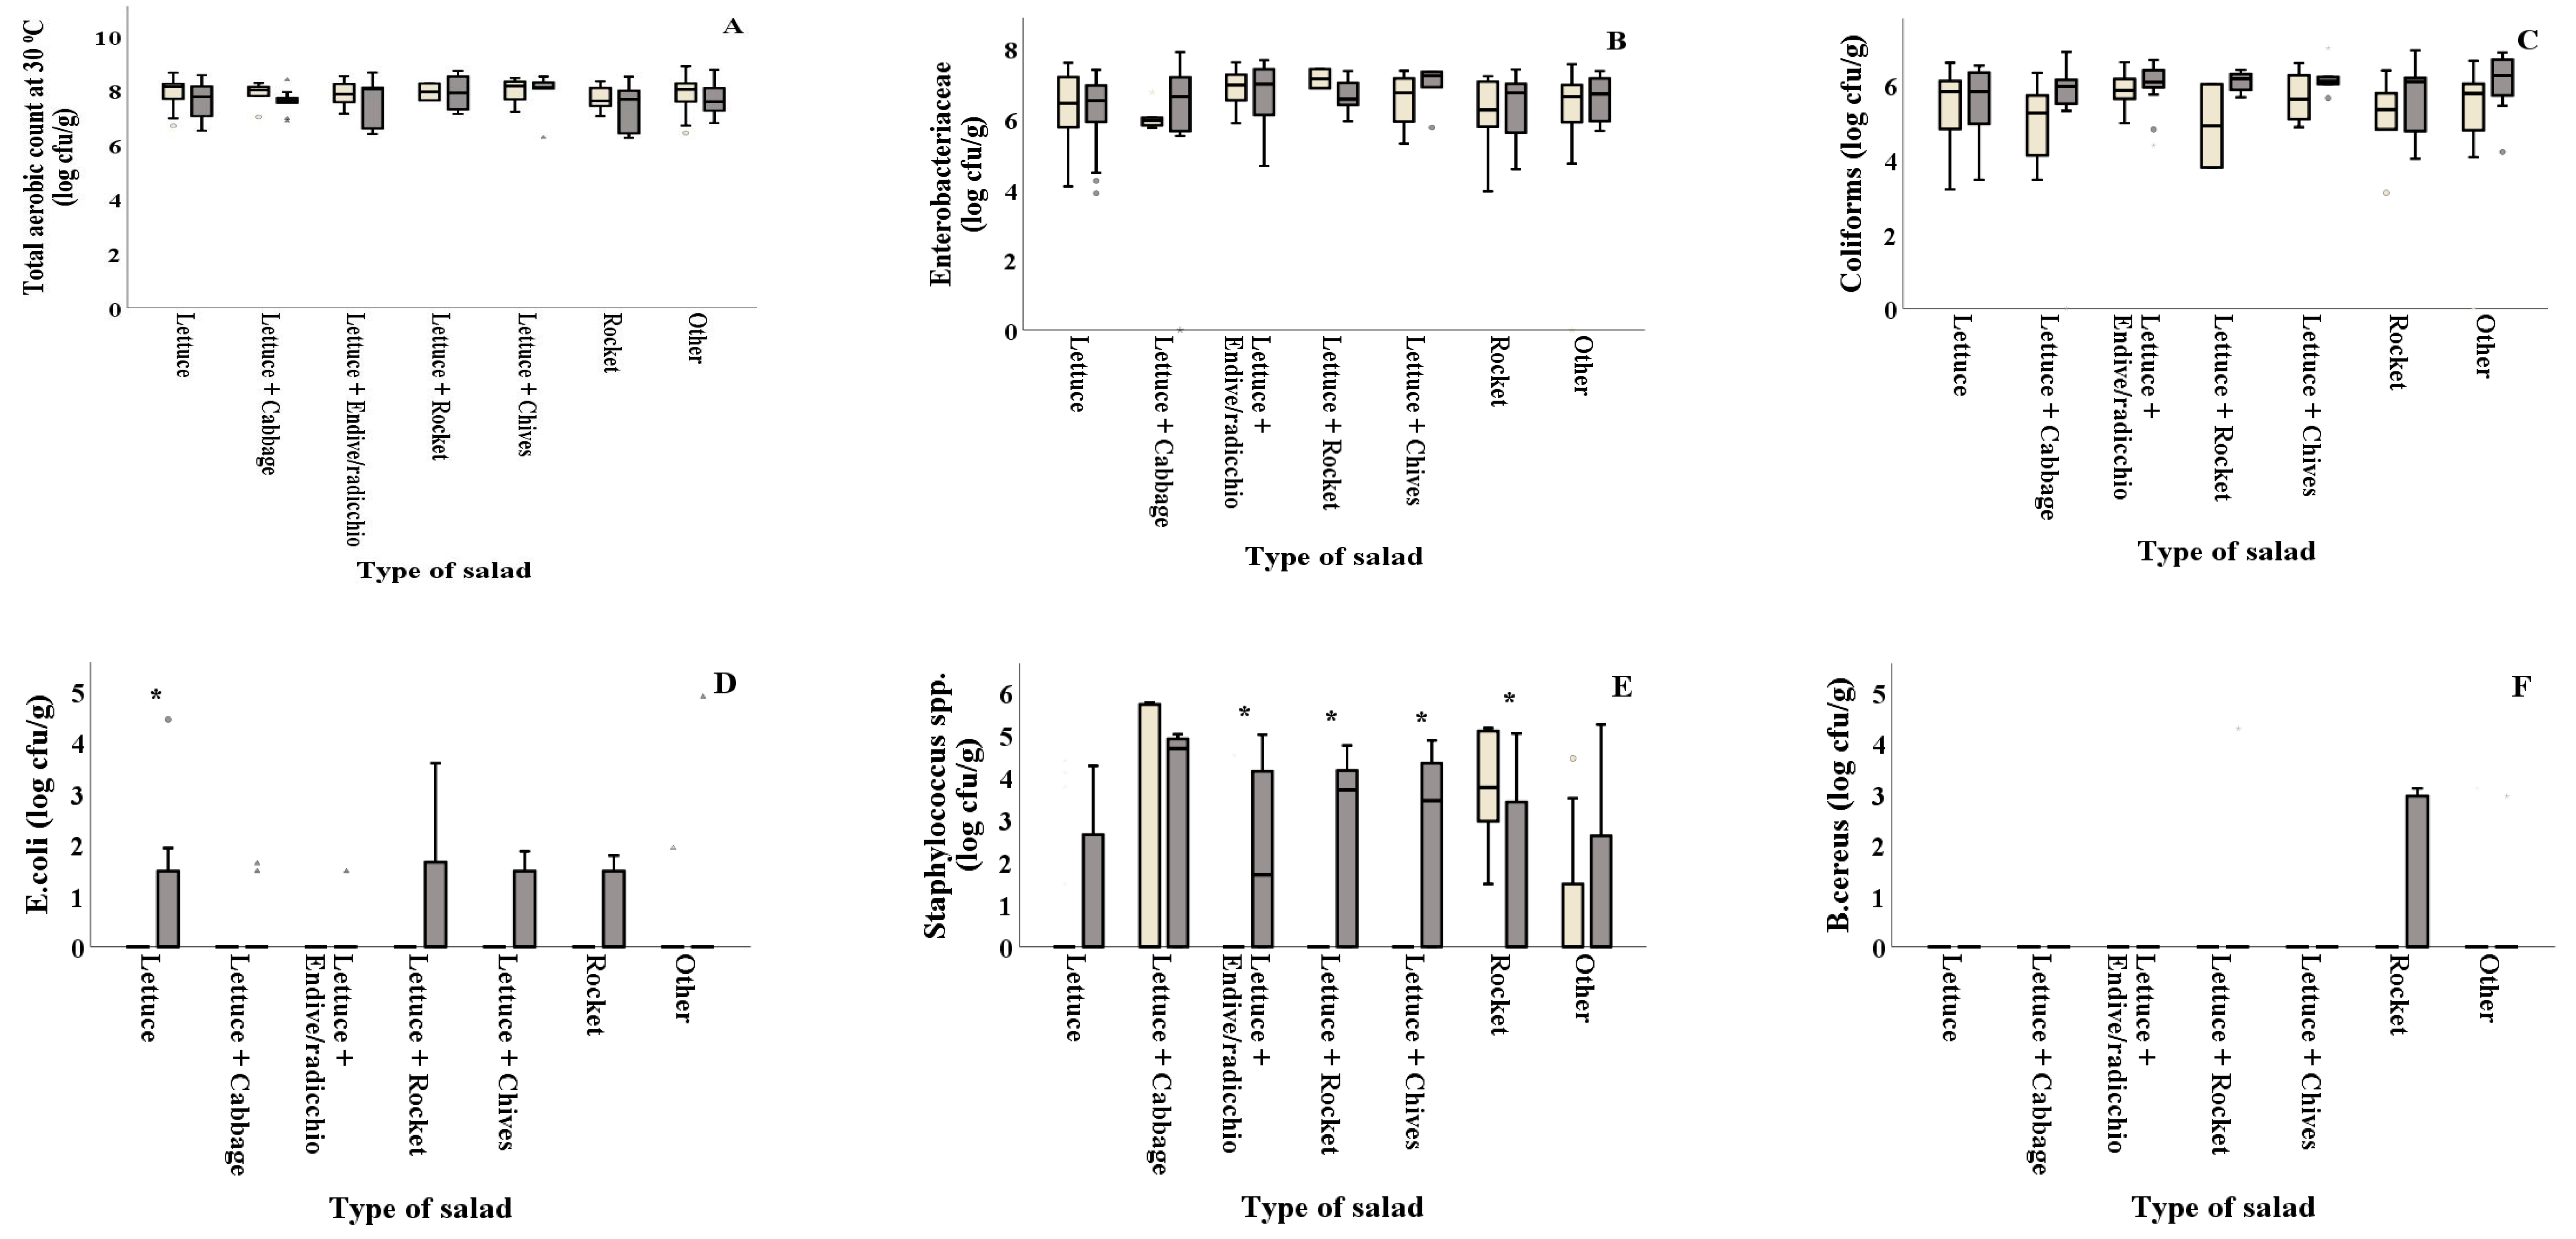

Figure 3.
Effect of season on the total phenolic content, antioxidants, % CO2 and damage index (H2O2 and lipid peroxidation) (A–G) of ready-to-eat salads collected in winter ( ![Foods 10 00941 i001]() ) and summer (
) and summer ( ![Foods 10 00941 i002]() ) among salad producers/packagers (A, B, C, D, and E). Results include all samples for each microorganism tested and are the mean value ± standard deviation. Each box contains 50 percent of cases, and whiskers represent the rest. The line across the inside of the box represents the median value. * and *** indicate significant differences at p ≤ 5% and 0.1%.
) among salad producers/packagers (A, B, C, D, and E). Results include all samples for each microorganism tested and are the mean value ± standard deviation. Each box contains 50 percent of cases, and whiskers represent the rest. The line across the inside of the box represents the median value. * and *** indicate significant differences at p ≤ 5% and 0.1%.
) and summer ( ) among salad producers/packagers (A, B, C, D, and E). Results include all samples for each microorganism tested and are the mean value ± standard deviation. Each box contains 50 percent of cases, and whiskers represent the rest. The line across the inside of the box represents the median value. * and *** indicate significant differences at p ≤ 5% and 0.1%.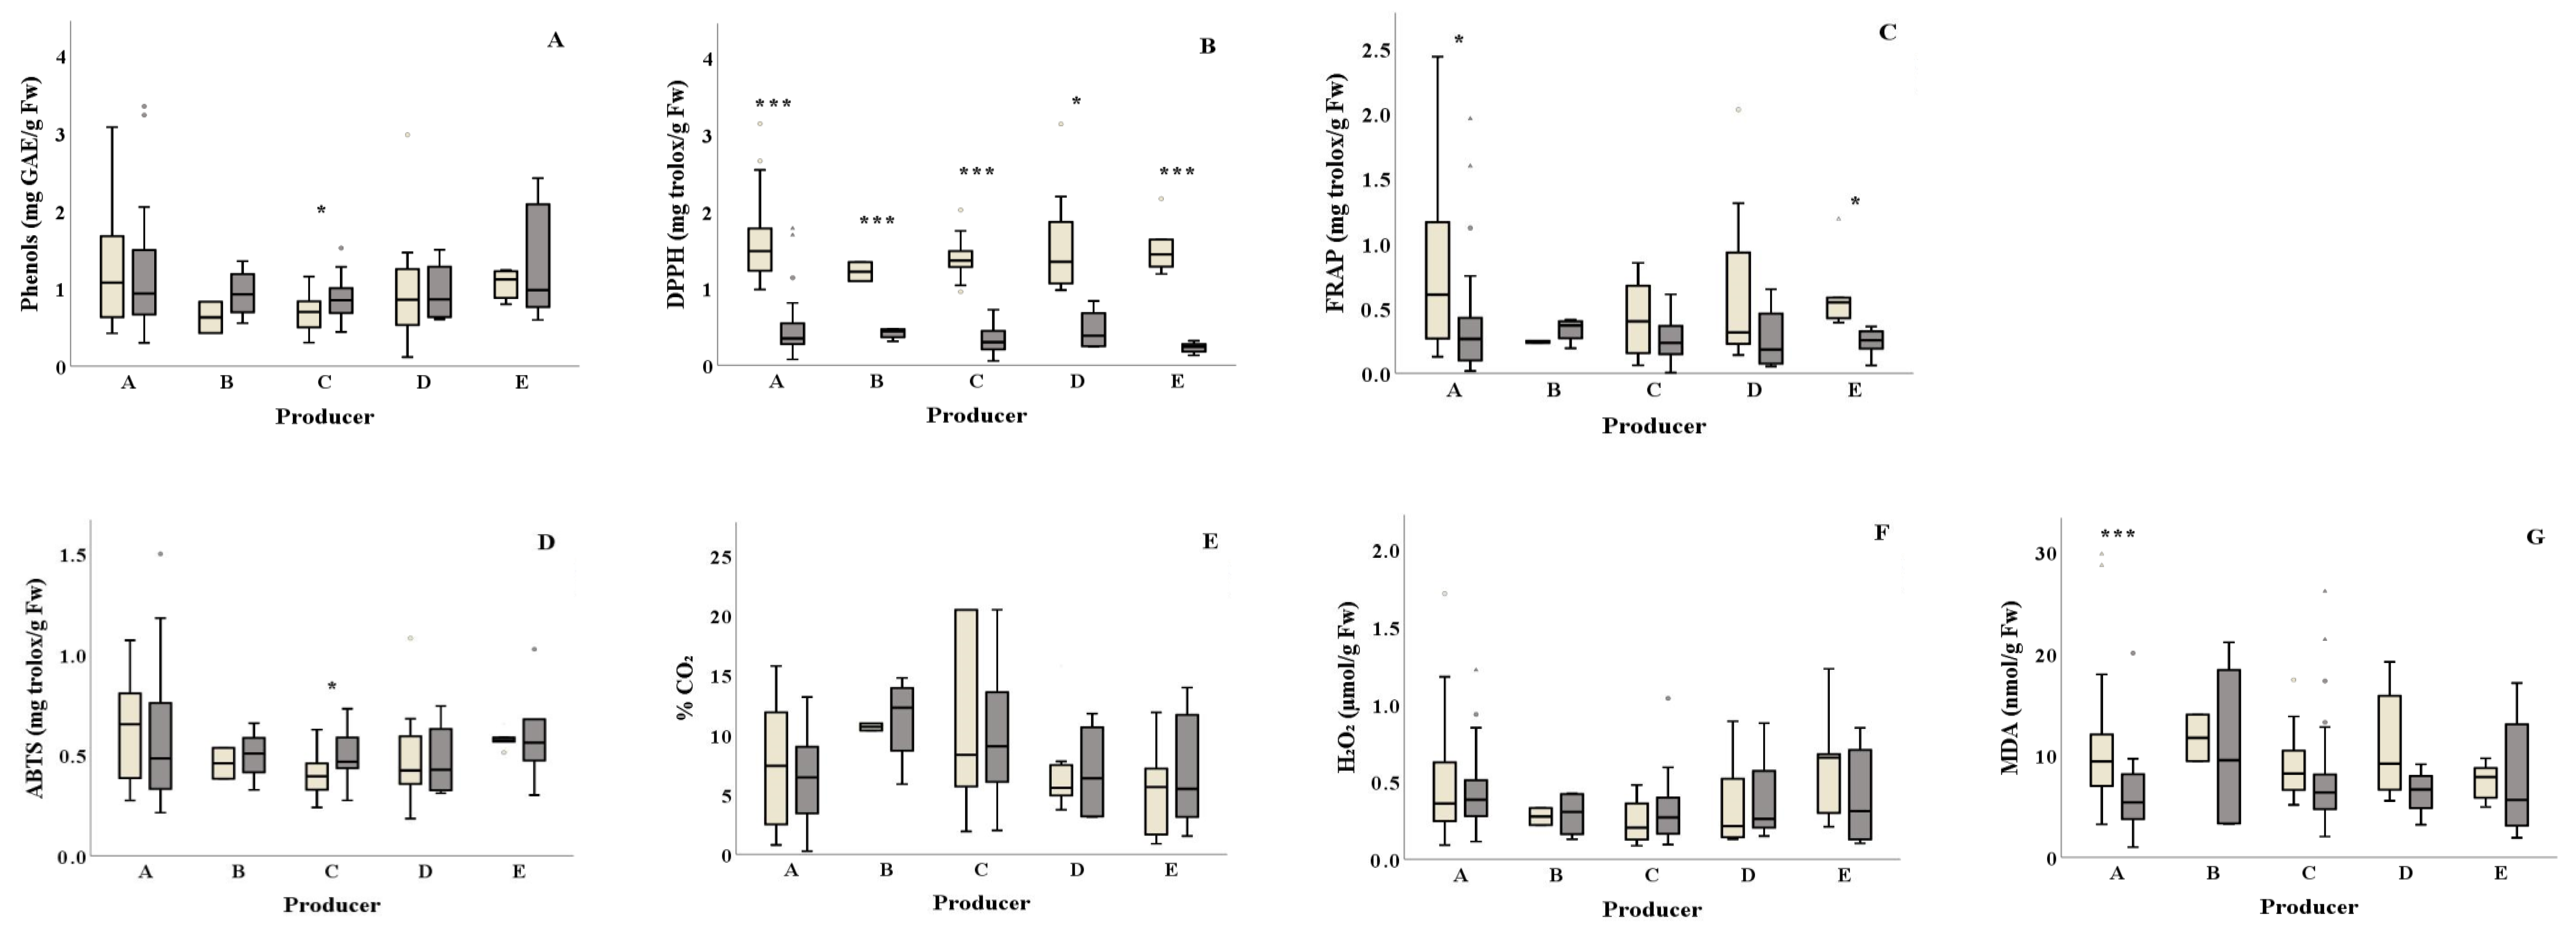
Figure 4.
Effect of season on the total phenolic content, antioxidants, % CO2 and damage index (H2O2 and lipid peroxidation) (A–G) of ready-to-eat salads collected in winter ( ![Foods 10 00941 i001]() ) and summer (
) and summer ( ![Foods 10 00941 i002]() ) among types of salads. Results include all samples for each microorganism tested and are the mean value ± standard deviation. Other = lettuce + 2 or more ingredients. Each box contains 50 percent of cases, and whiskers represent the rest. The line across the inside of the box represents the median value. *, ** and *** indicate significant differences at p ≤ 5%, 1% and 0.1%.
) among types of salads. Results include all samples for each microorganism tested and are the mean value ± standard deviation. Other = lettuce + 2 or more ingredients. Each box contains 50 percent of cases, and whiskers represent the rest. The line across the inside of the box represents the median value. *, ** and *** indicate significant differences at p ≤ 5%, 1% and 0.1%.
) and summer ( ) among types of salads. Results include all samples for each microorganism tested and are the mean value ± standard deviation. Other = lettuce + 2 or more ingredients. Each box contains 50 percent of cases, and whiskers represent the rest. The line across the inside of the box represents the median value. *, ** and *** indicate significant differences at p ≤ 5%, 1% and 0.1%.

Table 1.
Effect of the sampling period (winter–summer) on microbiological load (log cfu/g), total phenolic content (mg GAE/g Fw), antioxidants (mg Trolox/g Fw), % CO2 and stress markers—H2O2 (μmol/g Fw) and MDA (nmol/g Fw) of ready-to-eat salads according to producer/packager (A, B, C, D and E).
Table 1.
Effect of the sampling period (winter–summer) on microbiological load (log cfu/g), total phenolic content (mg GAE/g Fw), antioxidants (mg Trolox/g Fw), % CO2 and stress markers—H2O2 (μmol/g Fw) and MDA (nmol/g Fw) of ready-to-eat salads according to producer/packager (A, B, C, D and E).
| Producer/Packager | |||||
|---|---|---|---|---|---|
| A | B | C | D | E | |
| TVC | 0.081 | 0.322 | 0.470 | 0.662 | 0.080 |
| Enterobacteriaceae | 0.750 | 0.706 | 0.858 | 0.492 | 0.608 |
| Coliforms | 0.105 | 0.280 | 0.080 | 0.527 | 0.829 |
| E. coli | 0.022 | ni | 0.001 | 0.485 | ni |
| Staphylococcus spp. | 0.399 | 0.937 | 0.114 | 0.285 | ni |
| B. cereus | 0.717 | ni | 0.047 | ni | ni |
| Lactic acid bacteria | 0.000 | 0.079 | 0.000 | 0.225 | 0.010 |
| Pseudomonas spp. | 0.100 | 0.002 | 0.568 | 0.107 | 0.817 |
| Yeasts and molds | 0.002 | 0.033 | 0.171 | 0.147 | 0.236 |
| Phenols | 0.786 | 0.327 | 0.040 | 0.853 | 0.479 |
| DPPH | 0.000 | 0.001 | 0.000 | 0.017 | 0.000 |
| FRAP | 0.010 | 0.277 | 0.093 | 0.324 | 0.015 |
| ABTS | 0.662 | 0.734 | 0.020 | 0.880 | 0.837 |
| CO2 | 0.365 | 0.837 | 0.690 | 0.992 | 0.605 |
| H2O2 | 0.708 | 0.877 | 0.297 | 0.838 | 0.284 |
| MDA | 0.001 | 0.871 | 0.436 | 0.139 | 0.930 |
Results shown are the p values following independent samples t-test, and bold values suggest significant differences (p < 5%). ni = the correlation and t-test could not be computed because the standard error of the difference was 0. A–E are salat producers. No additional info is necessary, as there are info at the M&M.
Table 2.
Effect of the sampling period (winter–summer) on microbiological load (log cfu/g), total phenolic content (mg GAE/g Fw), antioxidants (mg Trolox/g Fw),% CO2 and stress markers—H2O2 (μmol/g Fw) and MDA (nmol/g Fw) of ready-to-eat salads according to the type of salad.
Table 2.
Effect of the sampling period (winter–summer) on microbiological load (log cfu/g), total phenolic content (mg GAE/g Fw), antioxidants (mg Trolox/g Fw),% CO2 and stress markers—H2O2 (μmol/g Fw) and MDA (nmol/g Fw) of ready-to-eat salads according to the type of salad.
| Type of Salad | |||||||
|---|---|---|---|---|---|---|---|
| Lettuce | Lettuce + Cabbage | Lettuce + Endive/Radicchio | Lettuce + Rocket | Lettuce + Chives | Rocket | Other | |
| TVC | 0.131 | 0.244 | 0.373 | 0.949 | 0.827 | 0.343 | 0.511 |
| Enterobacteriaceae | 0.605 | 0.941 | 0.599 | 0.221 | 0.391 | 0.692 | 0.480 |
| Coliforms | 0.705 | 0.681 | 0.430 | 0.480 | 0.210 | 0.344 | 0.147 |
| E. coli | 0.044 | 0.168 | 0.336 | 0.408 | 0.178 | 0.082 | 0.432 |
| Staphylococcus spp. | 0.465 | 0.483 | 0.016 | 0.012 | 0.028 | 0.032 | 0.589 |
| B. cereus | ni | ni | ni | 0.645 | ni | 0.081 | 0.530 |
| Lactic acid bacteria | 0.029 | 0.001 | 0.000 | 0.004 | 0.011 | 0.037 | 0.001 |
| Pseudomonas spp. | 0.291 | 0.035 | 0.656 | 0.003 | 0.793 | 0.201 | 0.078 |
| Yeasts and molds | 0.254 | 0.092 | 0.000 | 0.000 | 0.887 | 0.089 | 0.046 |
| Phenols | 0.279 | 0.026 | 0.662 | 0.760 | 0.005 | 0.389 | 0.376 |
| DPPH | 0.000 | 0.000 | 0.000 | 0.000 | 0.000 | 0.000 | 0.001 |
| FRAP | 0.002 | 0.510 | 0.085 | 0.060 | 0.777 | 0.004 | 0.396 |
| ABTS | 0.230 | 0.177 | 0.353 | 0.589 | 0.021 | 0.184 | 0.320 |
| CO2 | 0.771 | 0.989 | 0.464 | 0.745 | 0.179 | 0.955 | 0.897 |
| H2O2 | 0.531 | 0.470 | 0.228 | 0.933 | 0.939 | 0.171 | 0.647 |
| MDA | 0.002 | 0.531 | 0.315 | 0.948 | 0.155 | 0.607 | 0.003 |
Results shown are the p values following independent samples t-test, and bold values suggest significant differences (p < 5%). Other = lettuce + 2 or more ingredients. ni = the correlation and t-test could not be computed because the standard error of the difference was 0.
Table 3.
Effect of shelf life, salad producer/packager and type on microbiological load (log cfu/g), total phenolic content (mg GAE/g Fw), antioxidants (mg Trolox/g Fw) and% CO2 and stress markers—H2O2 (μmol/g Fw) and MDA (nmol/g Fw) of ready-to-eat salads according to salad producer in winter and summer.
| Producer/Packager | ||||||||||
|---|---|---|---|---|---|---|---|---|---|---|
| A | B | C | D | E | ||||||
| Winter | Summer | Winter | Summer | Winter | Summer | Winter | Summer | Winter | Summer | |
| TVC | 0.003 | 0.036 | ni | 0.119 | 0.691 | 0.303 | 0.058 | 0.837 | 0.953 | 0.777 |
| Enterobacteriaceae | 0.025 | 0.194 | ni | 0.391 | 0.418 | 0.702 | 0.397 | 0.892 | 0.522 | 0.153 |
| Coliforms | 0.061 | 0.432 | ni | 0.464 | 0.203 | 0.519 | 0.182 | 0.984 | 0.219 | 0.127 |
| E. coli | ni | 0.667 | ni | ni | ni | 0.506 | 0.391 | 0.500 | ni | ni |
| Staphylococcus spp. | 0.167 | 0.014 | ni | 0.500 | 0.443 | 0.732 | 0.927 | 0.500 | ni | ni |
| B. cereus | 0.329 | 0.339 | ni | ni | ni | 0.162 | ni | ni | ni | ni |
| Lactic acid bacteria | 0.007 | 0.574 | ni | 0.313 | 0.999 | 0.359 | 0.394 | 0.086 | 0.813 | 0.956 |
| Pseudomonas spp. | 0.692 | 0.237 | ni | 0.833 | 0.077 | 0.204 | 0.576 | 0.181 | 0.121 | 0.632 |
| Yeasts and molds | 0.682 | 0.093 | ni | 0.045 | 0.451 | 0.490 | 0.068 | 0.864 | 0.496 | 0.300 |
| Phenols | 0.062 | 0.665 | ni | 0.055 | 0.868 | 0.752 | 0.687 | 0.585 | 0.123 | 0.759 |
| DPPH | 0.446 | 0.444 | ni | 0.310 | 0.459 | 0.619 | 0.462 | 0.486 | 0.105 | 0.798 |
| FRAP | 0.203 | 0.312 | ni | 0.607 | 0.654 | 0.750 | 0.283 | 0.571 | 0.358 | 0.516 |
| ABTS | 0.091 | 0.952 | ni | 0.059 | 0.904 | 0.975 | 0.726 | 0.420 | 0.328 | 0.691 |
| CO2 | 0.000 | 0.000 | ni | 0.226 | 0.016 | 0.000 | 0.117 | 0.525 | 0.018 | 0.048 |
| H2O2 | 0.000 | 0.000 | ni | 0.407 | 0.000 | 0.000 | 0.011 | 0.09 | 0.044 | 0.155 |
| MDA | 0.000 | 0.001 | ni | 0.366 | 0.000 | 0.000 | 0.047 | 0.224 | 0.009 | 0.204 |
Results shown are the p values following independent samples t-test, and bold values suggest significant differences (p < 5%). Other = lettuce + 2 or more ingredients. ni = the correlation and t-test could not be computed because the standard error of the difference was 0.
Table 4.
Effect of shelf life on microbiological load (log cfu/g), total phenolic content (mg GAE/g Fw), antioxidants (mg Trolox/g Fw), % CO2 and stress markers—H2O2 (μmol/g Fw) and MDA (nmol/g Fw) of ready-to-eat salads according to the type of salad in winter and summer.
Table 4.
Effect of shelf life on microbiological load (log cfu/g), total phenolic content (mg GAE/g Fw), antioxidants (mg Trolox/g Fw), % CO2 and stress markers—H2O2 (μmol/g Fw) and MDA (nmol/g Fw) of ready-to-eat salads according to the type of salad in winter and summer.
| Type of Salad | ||||||||||||||
|---|---|---|---|---|---|---|---|---|---|---|---|---|---|---|
| Lettuce | Lettuce + Cabbage | Lettuce + Endive/Radicchio | Lettuce + Rocket | Lettuce + Chives | Rocket | Other | ||||||||
| Winter | Summer | Winter | Summer | Winter | Summer | Winter | Summer | Winter | Summer | Winter | Summer | Winter | Summer | |
| TVC | 0.386 | 0.898 | 0.361 | 0.263 | 0.029 | 0.027 | ni | 0.012 | 0.294 | 0.384 | 0.036 | 0.810 | 0.019 | 0.943 |
| Enterobacteriaceae | 0.244 | 0.313 | 0.516 | 0.366 | 0.011 | 0.024 | ni | 0.206 | 0.286 | 0.389 | 0.482 | 0.999 | 0.121 | 0.871 |
| Coliforms | 0.039 | 0.145 | 0.686 | 0.364 | 0.001 | 0.276 | ni | 0.261 | 0.130 | 0.453 | 0.500 | 0.602 | 0.146 | 0.189 |
| E. coli | ni | 0.181 | ni | 0.178 | ni | 0.356 | ni | 0.437 | ni | 0.423 | ni | 0.648 | 0.343 | 0.391 |
| Staphylococcus spp. | 0.647 | 0.213 | 0.423 | 0.698 | 0.356 | 0.065 | ni | 0.667 | ni | 0.186 | 0.363 | 0.632 | 0.686 | 0.391 |
| B. cereus | ni | ni | ni | ni | ni | ni | ni | 0.391 | ni | ni | ni | 0.348 | 0.343 | 0.391 |
| Lactic acid bacteria | 0.197 | 0.784 | 0.307 | 0.551 | 0.105 | 0.206 | ni | 0.025 | 0.051 | 0.469 | 0.223 | 0.985 | 0.060 | 0.391 |
| Pseudomonas spp. | 0.880 | 0.397 | 0.423 | 0.778 | 0.298 | 0.135 | ni | 0.040 | 0.551 | 0.089 | 0.856 | 0.220 | 0.633 | 0.547 |
| Yeasts and molds | 0.188 | 0.159 | 0.406 | 0.180 | 0.329 | 0.309 | ni | 0.001 | 0.855 | 0.705 | 0.306 | 0.167 | 0.685 | 0.952 |
| Phenols | 0.982 | 0.496 | 0.487 | 0.884 | 0.168 | 0.988 | ni | 0.796 | 0.164 | 0.010 | 0.768 | 0.342 | 0.174 | 0.207 |
| DPPH | 0.797 | 0.419 | 0.161 | 0.512 | 0.234 | 0.583 | ni | 0.466 | 0.071 | 0.241 | 0.978 | 0.925 | 0.759 | 0.243 |
| FRAP | 0.821 | 0.355 | 0.013 | 0.843 | 0.384 | 0.696 | ni | 0.256 | 0.227 | 0.149 | 0.497 | 0.044 | 0.271 | 0.223 |
| ABTS | 0.883 | 0.725 | 0.059 | 0.563 | 0.293 | 0.660 | ni | 0.387 | 0.092 | 0.101 | 0.085 | 0.534 | 0.059 | 0.371 |
| CO2 | 0.000 | 0.014 | 0.192 | 0.098 | 0.017 | 0.016 | ni | 0.016 | 0.173 | 0.035 | 0.004 | 0.085 | 0.001 | 0.050 |
| H2O2 | 0.000 | 0.002 | 0.005 | 0.016 | 0.000 | 0.040 | ni | 0.128 | 0.193 | 0.014 | 0.035 | 0.003 | 0.000 | 0.020 |
| MDA | 0.000 | 0.000 | 0.029 | 0.001 | 0.000 | 0.023 | ni | 0.069 | 0.314 | 0.105 | 0.004 | 0.006 | 0.000 | 0.034 |
Results shown are the p values following paired samples t-test, and bold values suggest significant differences (p < 5%). Other = lettuce + 2 or more ingredients. ni = the correlation and t-test could not be computed because the standard error of the difference was 0.
Publisher’s Note: MDPI stays neutral with regard to jurisdictional claims in published maps and institutional affiliations. |
© 2021 by the authors. Licensee MDPI, Basel, Switzerland. This article is an open access article distributed under the terms and conditions of the Creative Commons Attribution (CC BY) license (https://creativecommons.org/licenses/by/4.0/).
Share and Cite
MDPI and ACS Style
Xylia, P.; Botsaris, G.; Skandamis, P.; Tzortzakis, N. Expiration Date of Ready-to-Eat Salads: Effects on Microbial Load and Biochemical Attributes. Foods 2021, 10, 941. https://doi.org/10.3390/foods10050941
AMA Style
Xylia P, Botsaris G, Skandamis P, Tzortzakis N. Expiration Date of Ready-to-Eat Salads: Effects on Microbial Load and Biochemical Attributes. Foods. 2021; 10(5):941. https://doi.org/10.3390/foods10050941
Chicago/Turabian StyleXylia, Panayiota, George Botsaris, Panagiotis Skandamis, and Nikolaos Tzortzakis. 2021. "Expiration Date of Ready-to-Eat Salads: Effects on Microbial Load and Biochemical Attributes" Foods 10, no. 5: 941. https://doi.org/10.3390/foods10050941
Note that from the first issue of 2016, this journal uses article numbers instead of page numbers. See further details here.