Article

Evaluation of Fourteen Bread Wheat (Triticum aestivum L.) Genotypes by Observing Gas Exchange Parameters, Relative Water and Chlorophyll Content, and Yield Attributes under Drought Stress

1
College of Agriculture, Bahadur Sub-Campus Layyah-31200, Bahauddin Zakariya University, Multan, Punjab 60000, Pakistan
2
Department of Agronomy, Bahauddin Zakariya University, Multan, Punjab 60000, Pakistan
3
Department of agronomy, MNS University of Agriculture, Multan, Punjab 60000, Pakistan
4
Department of Biology, College of Science, Taif University, P.O. Box 11099, Taif 21944, Saudi Arabia
5
Key Lab of Biology and Genetic Improvement of Oil Crops, Oil Crops Research Institute, Chinese Academy of Agricultural Sciences (CAAS), Wuhan 430062, China
6
Department of Agronomy, Faculty of Agriculture and Environment, The Islamia University of Bahawalpur, Bahawalpur 63100, Pakistan
7
Department, Bangladesh Wheat and Maize Research Institute, Dinajpur 5200, Bangladesh
8
Department of Agronomy, Faculty of Agriculture, University of Kafrelsheikh, Kafrelsheikh 33516, Egypt
*
Authors to whom correspondence should be addressed.
Sustainability 2021, 13(9), 4799; https://doi.org/10.3390/su13094799
Submission received: 9 March 2021 / Revised: 17 April 2021 / Accepted: 21 April 2021 / Published: 25 April 2021

Abstract

:
Water scarceness is a major threat to wheat productivity under changing climate scenarios, especially in arid and semi-arid regions. However, growing drought-tolerant wheat genotypes could be a sustainable option to enhance wheat productivity under drought stress conditions. The aim of this study was to evaluate the effect of mild to severe drought stress on gas exchange parameters, relative water content, SPAD-chlorophyll value, and yield-related parameters of 14 wheat genotypes being cultivated in arid to semi-arid areas on large scale. The genotypes were grown in earthen pots under three drought levels, namely (1) control-well watered, (2) mild water stress, i.e., 60% water holding capacity, and (3) severe water stress, i.e., 40% water holding capacity. The drought was imposed from the jointing stage to physiological maturity. Drought significantly decreased net photosynthesis, stomatal conductance, relative water contents, 100-grain weight, and grain yield in all genotypes. However, the reduction percentage was different in different genotypes under drought stress compared with well-watered conditions. The highest relative water content (65.2%) was maintained by the genotype Galaxy-2013, followed by AAS-2011 (64.6%) and Johar-2016 (62.3%) under severe drought conditions. Likewise, Galaxy-2013 showed the highest net photosynthesis and stomatal conductance under severe drought conditions. The highest grain yield per plant (6.2 g) and 100-grain weight (3.3 g) was also recorded in Galaxy-2013 under severe drought conditions, while the highest grain yield under well-watered conditions was recorded in Johar-2016, followed by Galaxy-2013. These results suggest that wheat variety Galaxy-2013 could be cultivated extensively to obtain good wheat yield under limited water conditions.

1. Introduction

Drought stress is a major limiting factor for crop production systems worldwide, especially under arid and semi-arid areas [1]. Arid and semi-arid regions in Asia have faced acute water shortages for the last few decades, becoming a challenging task for agriculture and water management experts [2]. Now, drought is considered the most important factor affecting crop yield. More devastatingly, the predicted climate change may enhance the frequency of drought, which may increase crop production losses [3].
Our food source mainly depends on cereals. Their production is significantly affected by drought stress [4]. In changing climate scenarios, wheat production decreases because of acute water deficiency in wheat-producing areas [5]. Drought affects the wheat yield throughout the growing season to some extent, but more yield losses occur during reproductive and grain-filling phases [6]. The yield losses of wheat during the reproductive phase due to drought might be due to its deleterious effects on morphological and physiological traits. Drought stress adversely affects root depth [7], may accelerate leaf senescence [8], oxidative damage to photosynthetic machinery [9], and decrease carbon dioxide fixation [10]. It may also affect the assimilate translocation rate [10], resulting in a reduced grain set [11]. Reduced chlorophyll causes chlorosis, leads to a reduction in photosynthesis [12]. Drought adversely affects carbon fixation due to leaf stomata’s closure, reducing the production of photo-assimilates [13]. Decreased stomatal conductance is the main cause of the reduction in photosynthesis during drought conditions [14]. However, at later stages, drought leads to tissue dehydration which may cause metabolic injury [8]. It also reduces leaf relative water content (RWC) and stomatal conductance, which ultimately leads to reducing growth and biomass production [15,16].
In addition to physiological and morphological traits, drought also affects traits that confer drought resistance in the specific environment may be very distinct. Drought causes grain loss because of pollen sterility and abscisic acid accumulation in spikes of drought susceptible wheat genotypes [17]. Last but not least, drought stress could significantly affect wheat kernels milling [18], flour quality [19], dough kneading [20,21], and the entire breadmaking process [6]. Being a major cereal crop in Pakistan, the wheat yield must be improved to fulfill the growing population’s increasing food demands [22]. For this reason, the selection and use of drought-stress resistant cultivars able to guarantee suitable yields and flour quality, is essential [23]. The response of plants to drought stress depends on different factors, such as growth stages, length and severity of stress, and a cultivar’s genetic makeup [24].
Drought stress can occur at any growth stage depending upon the local environmental conditions [3]. Thal region in Punjab Pakistan is an important region regarding wheat cultivation, and this region is also facing drought problems. This region experienced severe drought during 2000–2002 during the rabi season and affected 28% of the area [25]. Thal region comes under arid as well as irrigated area which receives about 234 mm annual rainfall [26]. To tackle drought in this region, adopting drought-tolerant genotypes is one of the most sustainable ways to reduce the impacts of different intensities of dry spells on wheat production [23]. A lot of work has been done to maximize wheat production by adopting different drought mitigating practices. However, no information is available regarding suitable varieties grown in drought-prone arid areas of Punjab province to obtain better genetic potential. To facilitate farmers of arid regions (Thal zone), the present study was conducted to evaluate the effect of drought stress on the tested wheat genotypes to find high-yielding wheat genotypes under limited water conditions in the Thal region of Punjab, Pakistan.

2. Materials and Methods

2.1. Experimental Site and Soil Characteristics

This study was conducted in a green-house at the College of Agriculture, Bahauddin Zakariya University, Layyah, Pakistan. For the experiment, a mixture of soil and farmyard manure (FYM) (3:1 (w/w)) was used. The soil was sandy loam having pH 8.1, electrical conductivity (EC) 2.28 dSm−1, organic matter content 0.49%, available P 7 ppm, and available K 92 ppm.

2.2. Experimental Design and Treatments

Seeds of 14 wheat genotypes, consisted of new and old locally cultivated varieties, was obtained from Ayub Agricultural Research Institute (AARI) Faisalabad, and Arid Zone Research Institute (AZRI) Bhakkar, Punjab, Pakistan. The tested wheat genotypes were: Ujala-2016, Gold-2016, Johar-2016, Galaxy-2013, Ehsan-2016, Fath-e-Jang, Saher-2006, Gandum-1, Panjab-2011, AAS-2011, AS-2002, Faisalabad-2008, Lasani-2008, and Shafaq-2006. Moreover, three drought treatments of Galaxy-2013, i.e., (1) well-watered (control), (2) mild drought stress (60% water holding capacity (WHC)), and (3) severe drought stress (40% WHC), were tested. Pots were arranged in a factorial, completely randomized design (CRD) with three replications. The complete set of genotypes is presented in Table 1.

2.3. Plants Growing

The earthen pots (12 cm in diameter and 60 cm in height) were filled with 10 kg of sieved soil and FYM at a ratio of 3:1, respectively. Ten seeds per pot were sown uniformly at a depth of 2 cm. After germination of seeds, five seedlings per pot were maintained till maturity. Fertilizer application was done following the recommended dose, i.e., nitrogen (N) at 0.25 g as urea, phosphorus (P) at 0.4 g as di-ammonium phosphate, and potassium (K) at 0.35 g pot−1 as potassium sulphate was applied as basal dose, while the remaining half dose of N as urea at 0.25 g pot−1 was applied at jointing stage. Drought was imposed from the jointing stage and maintained till crop maturity.

2.4. Maintenance of Water Holding Capacity

For measuring soil WHC/field capacity (FC), the gravimetric method was followed as described by [27]. Before sowing the seed, three soil samples were collected from each pot and measured for their fresh weight. After that, the samples were oven-dried at 105 °C till constant weight. After drying, three representative samples were taken and saturated with distilled water to make a saturated paste. FC was determined by the following formula, as proposed by [27]:
F C = s a t u r a t i o n   %   a g e   o f   s o i l   s a m p l e s   t a k e n 2
Through this formula, 100%, 60%, and 40% WHC were calculated, which was maintained throughout the experiment by weighing the pots. The difference in weight was corrected by applying the required amount of water according to the calculation.

2.5. Measurement of Relative Water Content (RWC) and SPAD-Chlorophyll Value

To measure RWC, fully expanded younger leaves from each treatment were collected. The leaf surface was gently dried using tissue paper, then wrapped in polythene bags and brought to the laboratory. Leaf samples were weighed to obtain leaf fresh weight (FW). The samples were then soaked in plastic tubes containing distilled water and left overnight in the dark. The next morning, these leaves were carefully bloated with tissue paper and weighed to determine the turgid weight (TW). Leaves were then dried at 70 °C till constant weight using a hot air oven. Dried leaves were then weighed to record dry weight (DW). RWC was calculated by following the formula as described by [28].
RWC (%) = (FWDW)/(TWDW) × 100
The SPAD-Chlorophyll value was estimated by using a portable SPAD-502 Chlorophyll Meter (Minolta Co., Ltd., Osaka, Japan). For this purpose, randomly selected 10 plants from each treatment were used to measure the chlorophyll content. The reading was taken from the flag leaf at the anthesis stage from three different points (bottom, middle, and tip of the leaf) and then averaged to get the final SPAD-Chlorophyll value.

2.6. Gas Exchange Characteristics

Gas exchange characteristics, including stomatal conductance (g), net photosynthesis (Pn), and transpiration rate (E), were recorded from fully expanded flag leaf for each treatment at the anthesis stage by using an infra-red gas analyzer (IRGA) Leaf Chamber Analyzer (Type LCA-4, USA). The measurements were made from 10:00 a.m. to 11:59 a.m. on a sunny day under a CO2 concentration of 400 μmol mol−1 [29].

2.7. Yield and Related Traits

Five representative plants were randomly selected from each pot, and fertile tillers were counted manually, then averaged to find tillers per plant. At maturity, the plant height from five plants was measured from stem base to the ear’s tip using a meter scale and then averaged. Similarly, five spikes were randomly selected from each pot, and their length was measured with the help of a ruler and worked out their average. The same spikes were used to calculate the number of spikelets in each spike, and their mean was worked out. These five plants were harvested manually from each pot, sun-dried for six days. After drying, the weight of whole plants was measured on electrical balance and averaged to get biological yield per plant. After measuring biological yield, five spikes from each pot were threshed manually, and grains were cleaned, weighed, and averaged to obtain the grain yield per plant. Similarly, from the same threshed grains, 100 grains were counted manually from each pot and weighed to measure 100-grain weight.

2.8. Statistical Analysis

Data collected on all parameters were analyzed using Statistix software (Version 8.1. USA). Tukey’s HSD test at 5% probability level for 2-way ANOVA was applied to compare the treatment means [30]. Further data were processed in Microsoft Excel-2010 to get values of standard error (±S.E.) as well as bar graphs for a graphical representation of data.

3. Results

3.1. Growth Parameters

3.1.1. Relative Water Content and SPAD-Chlorophyll Value

Data indicated that the RWC was higher under well-watered conditions in all genotypes while reduced under both mild and severe drought conditions in all genotypes (Table 2). It was observed that the genotype Johar-2016 maintained the highest RWC under well-watered and mild drought conditions, while the genotype Galaxy-2013 maintained the highest RWC under severe drought conditions (Table 2). In contrast, the genotype Lasani-2008 was observed with the lower RWC under severe drought stress conditions (Table 2). Similarly, various drought levels significantly affected the SPAD-chlorophyll value of wheat genotypes. Higher SPAD-chlorophyll value was observed under well-watered conditions while it was significantly reduced under drought conditions. Various wheat varieties also exhibited differences in chlorophyll content, and the maximum SPAD-Chlorophyll content was recorded in Galaxy-2013, while the minimum chlorophyll content was recorded in Saher-2006. However, the interaction effect of wheat genotypes with different drought levels was found to be non-significant (Table 2).

3.1.2. Gas Exchange Parameters

The gas exchange parameters such as net photosynthesis (Pn), stomatal conductance (gs), and transpiration rate (E) were reduced under both drought stress conditions compared with control (well-watered). Decreases of 30% and 70% for Pn, of 45% and 81% for gs, and of 45% and 80% for E were observed under mild drought and severe drought conditions, respectively (Figure 1, Figure 2 and Figure 3). The highest Pn, gs, and E were observed in the genotype Galaxy-2013 followed by Johar-2016 under severe drought conditions (Figure 1, Figure 2 and Figure 3). These parameters decreased in all cultivars, but in drought-resistant one, they decreased to a lesser extent.

3.2. Yield and Yield-Related Traits

Various drought treatments, wheat varieties, and their interaction significantly affected the yield and yield-related traits such as plant height, spike weight, grains per spike, 100-grain weight, and grain yield (Table 3, Table 4, Table 5 and Table 6). The highest plant height values, spike weight, grains per spike, 100-grain weight, grain yield, and biological yield were obtained under well-watered conditions. At the same time, all these parameters were significantly reduced under mild and severe drought conditions. The maximum plant height was recorded in Johar-2016 and Galaxy-2013, followed by Shafaq-2006 under well-watered conditions. The minimum plant height was recorded in AS-2002, followed by Saher-2006 under severe drought conditions (Table 3). Furthermore, drought levels and genotypes significantly affected the number of fertile tillers per plant. Plants produced more fertile tillers under well-watered conditions and fewer fertile tillers under both drought regimes. Under severe drought conditions, Galaxy-2013 produced the maximum fertile tillers while AS-2002 produced the minimum fertile tillers per plant (Table 3).
Drought and genotypes had a significant effect on the spike length of wheat, while their interaction was found non-significant. It was observed that the length of spikes was increased under well-watered conditions, while it was reduced under drought conditions. Among genotypes, Johar-2016 produced the longest spikes, while Fath-e-Jang produced the smallest spikes (Table 4). Similarly, the maximum number of spikelets per spike was recorded in Johar-2016, followed by Shafaq-2006 under well-watered conditions. In contrast, the minimum number of spikelets per spike was recorded in Ujala-2016 under severe drought conditions (Table 4). Likewise, the spike weight and grains per spike were increased under well-watered conditions while reduced under drought conditions. The genotype Galaxy-2013 produced the heavier spike (1.38 g) with more number grains (27.7), while AAS-2011 produced the lightest spike (1.22 g) with fewer grains (23.3) under severe drought conditions (Table 5).
Furthermore, 100-grain weight of wheat was also affected significantly by various drought levels, genotypes, and their interaction. It was significantly increased under well-watered conditions than in under drought conditions. An approximately 54% reduction in 100-grain weight was recorded under severe drought conditions compared with well-watered conditions (Table 6). Among the genotypes, Johar-2016 and Galaxy-2013 were found to have the maximum 100-grain weight, while Saher-2006 with minimum 100-grain weight. The genotype Galaxy-2013 produced 21% higher 100-grain weight, while AS-2002 produced less 100-grain weight under severe drought conditions (Table 6). Grain yield was also significantly affected by drought, genotypes, and their interaction. As compared to well-watered conditions, it was reduced by 30% under mild drought and 54% under severe drought conditions. The genotype Galaxy-2013 produced the maximum grain yield per plant, while AS-2002 produced the minimum grain yield per plant. It was noted that Galaxy-2013 produced 30% more yield than the least yielded variety AS-2002 under severe drought conditions. A reduction of 41% in grain yield per plant was noted in AS-2002 under severe drought conditions (Table 6). Similarly, various drought levels and genotypes significantly affected the biological yield per plant. The maximum biological yield was recorded in Galaxy-2013, followed by Johar-2016, and the minimum biological yield was recorded in AAS-2011 (Table 7). Galaxy-2013 produced 21% more biological yield than AS-2002. However, AS-2002 was the most susceptible genotype to drought and produced 27% less biomass under severe drought conditions (Table 7).

3.3. Relationship between the Physiological, Gas Exchange, and Yield Parameters

Under well-watered conditions, significant and positive correlations (Table 8) were found between physiological traits (RWC and Chl), and these traits were also significantly correlated with gas exchange (Pn, gs, and E) and yield-related parameters (GW, GY, and BY). Similarly, Pn, gs, and E were significantly correlated each other and also with BY and GY. Table 9 shows the correlations under mild water-stressed conditions, revealing that the RWC had significantly positive correlations with Pn, Gs, and E, and yield-related parameters like GW and GY. It was noted that Chl did not have significant correlations with yield-related parameters under mild stress, although it was significantly correlated with SK, Pn, and Gs (Table 9). On the other hand, under severe water stress conditions, very strong and positive correlations were observed between the RWC and Chl. Interestingly, both parameters were equally correlated with Pn, Gs, and E. The same was observed with SW, GY, and BY. All the gas exchange parameters also significantly correlated with GY and BY (Table 10).

4. Discussion

The current study revealed that the RWC under well-watered conditions showed the highest values, which remarkably reduced under mild and severe drought conditions (Table 2). Out of 14 tested genotypes, Galaxy-2013 maintained the highest RWC under severe drought conditions, followed by AAS-2011, which showed their tolerance to severe drought stress and might be due to genetic differences, making them superior to other studied genotypes. The association between higher RWC and drought tolerance for various wheat varieties has already been reported [31,32], which elaborates that drought-tolerant varieties maintained more water contents under limited water availability [33]. Water retention under drought stress conditions could be a desired trait. However, when the plants keep closing their stomata, it may decrease the transpiration rate, affecting the uptake and transport of nutrients [34]. It was observed that plants exhibited the maximum SPAD-chlorophyll values under well-watered conditions. In contrast, the values were reduced when the crop experienced drought stress, and the minimum values were recorded under severe drought conditions (Table 2). A reduction in chlorophyll content under drought conditions was observed in different crop plants, including wheat, by another research [35]. However, the genotype Galaxy-2013 produced the highest SPAD-chlorophyll value under severe drought conditions (Table 2), which illustrates that Galaxy-2013 is a drought-tolerant variety staying green longer period which is the main character of drought-tolerant varieties. In contrast, reduced chlorophyll contents were observed in drought-sensitive wheat cultivars (Table 2). It has already been documented that some wheat varieties have undergone a reduction in chlorophyll contents under drought stress [36]. Reduction in photosynthetic pigments, including chlorophyll in wheat with the increasing water stress, was observed previously [37,38]. However, drought-tolerant genotypes retained many photosynthetic pigments under drought stress [38,39,40]. Drought stress can destroy or reduce chlorophyll content and inhibit its synthesis [41].
Photosynthesis plays a major role in the growth and yield of crop plants. Variation in photosynthetic pigments is the key indicator of the rate of photosynthesis in plants grown under water deficit [3]. It is well known that plant exposure to drought stress decreases the photosynthetic crop rate, including cereals [
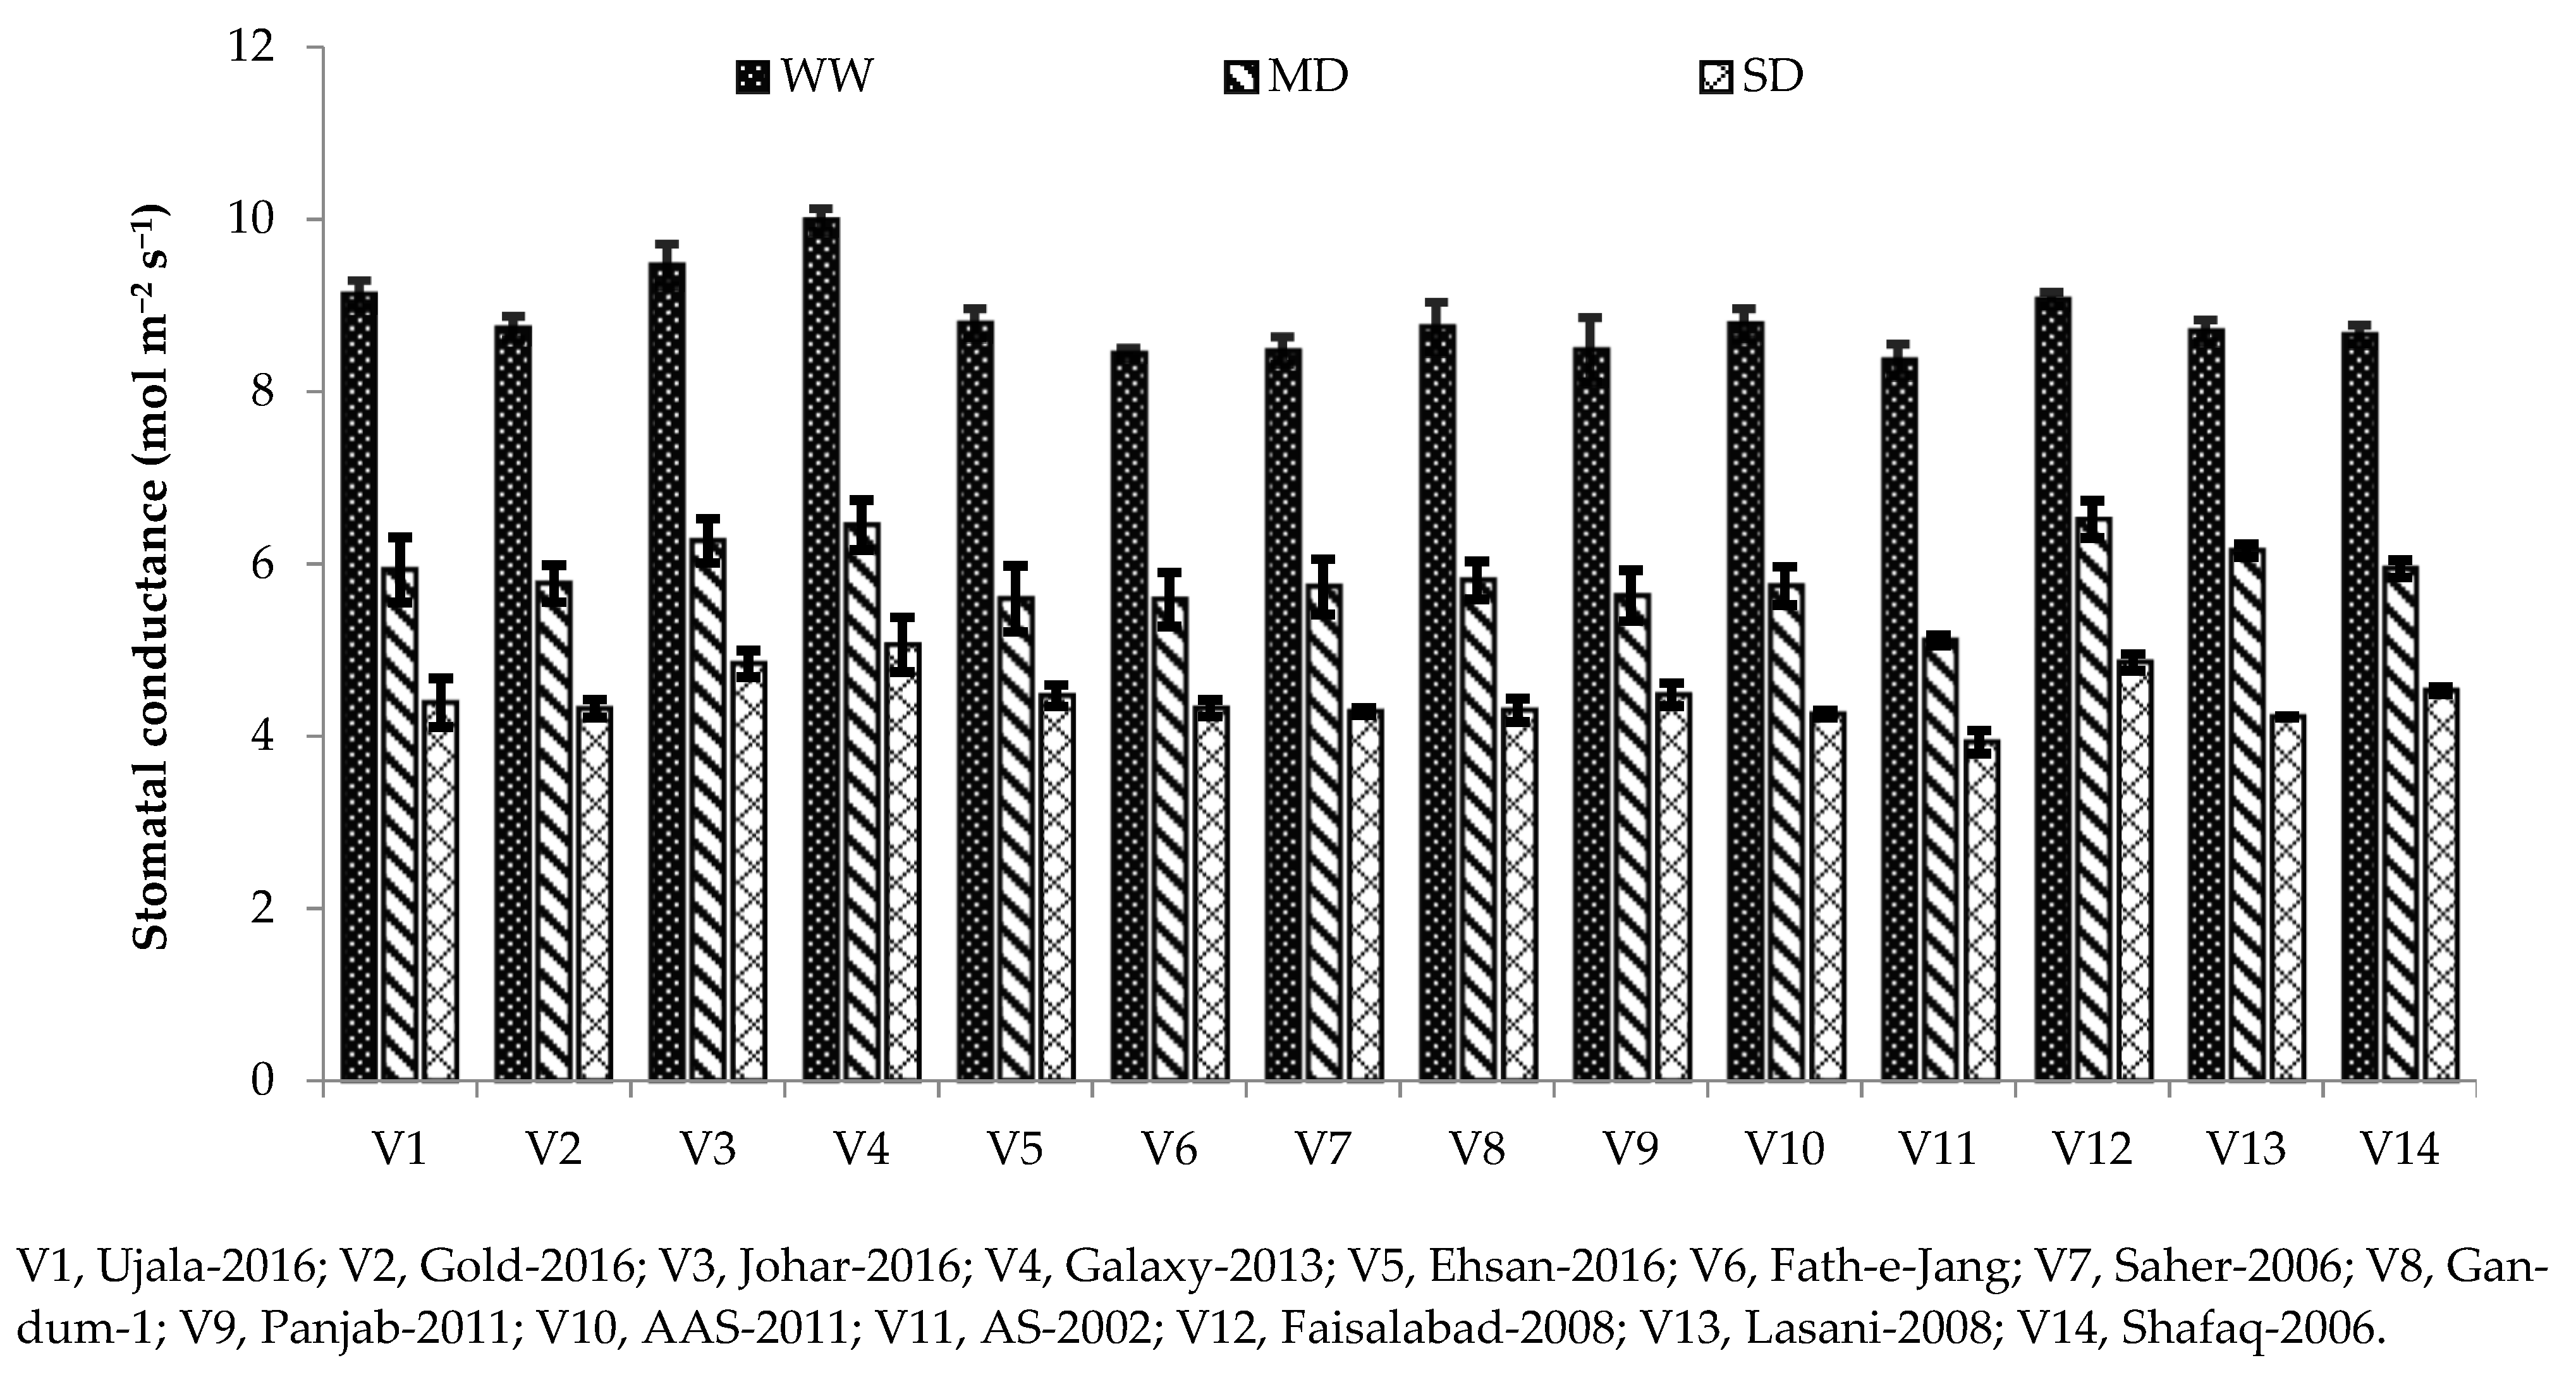
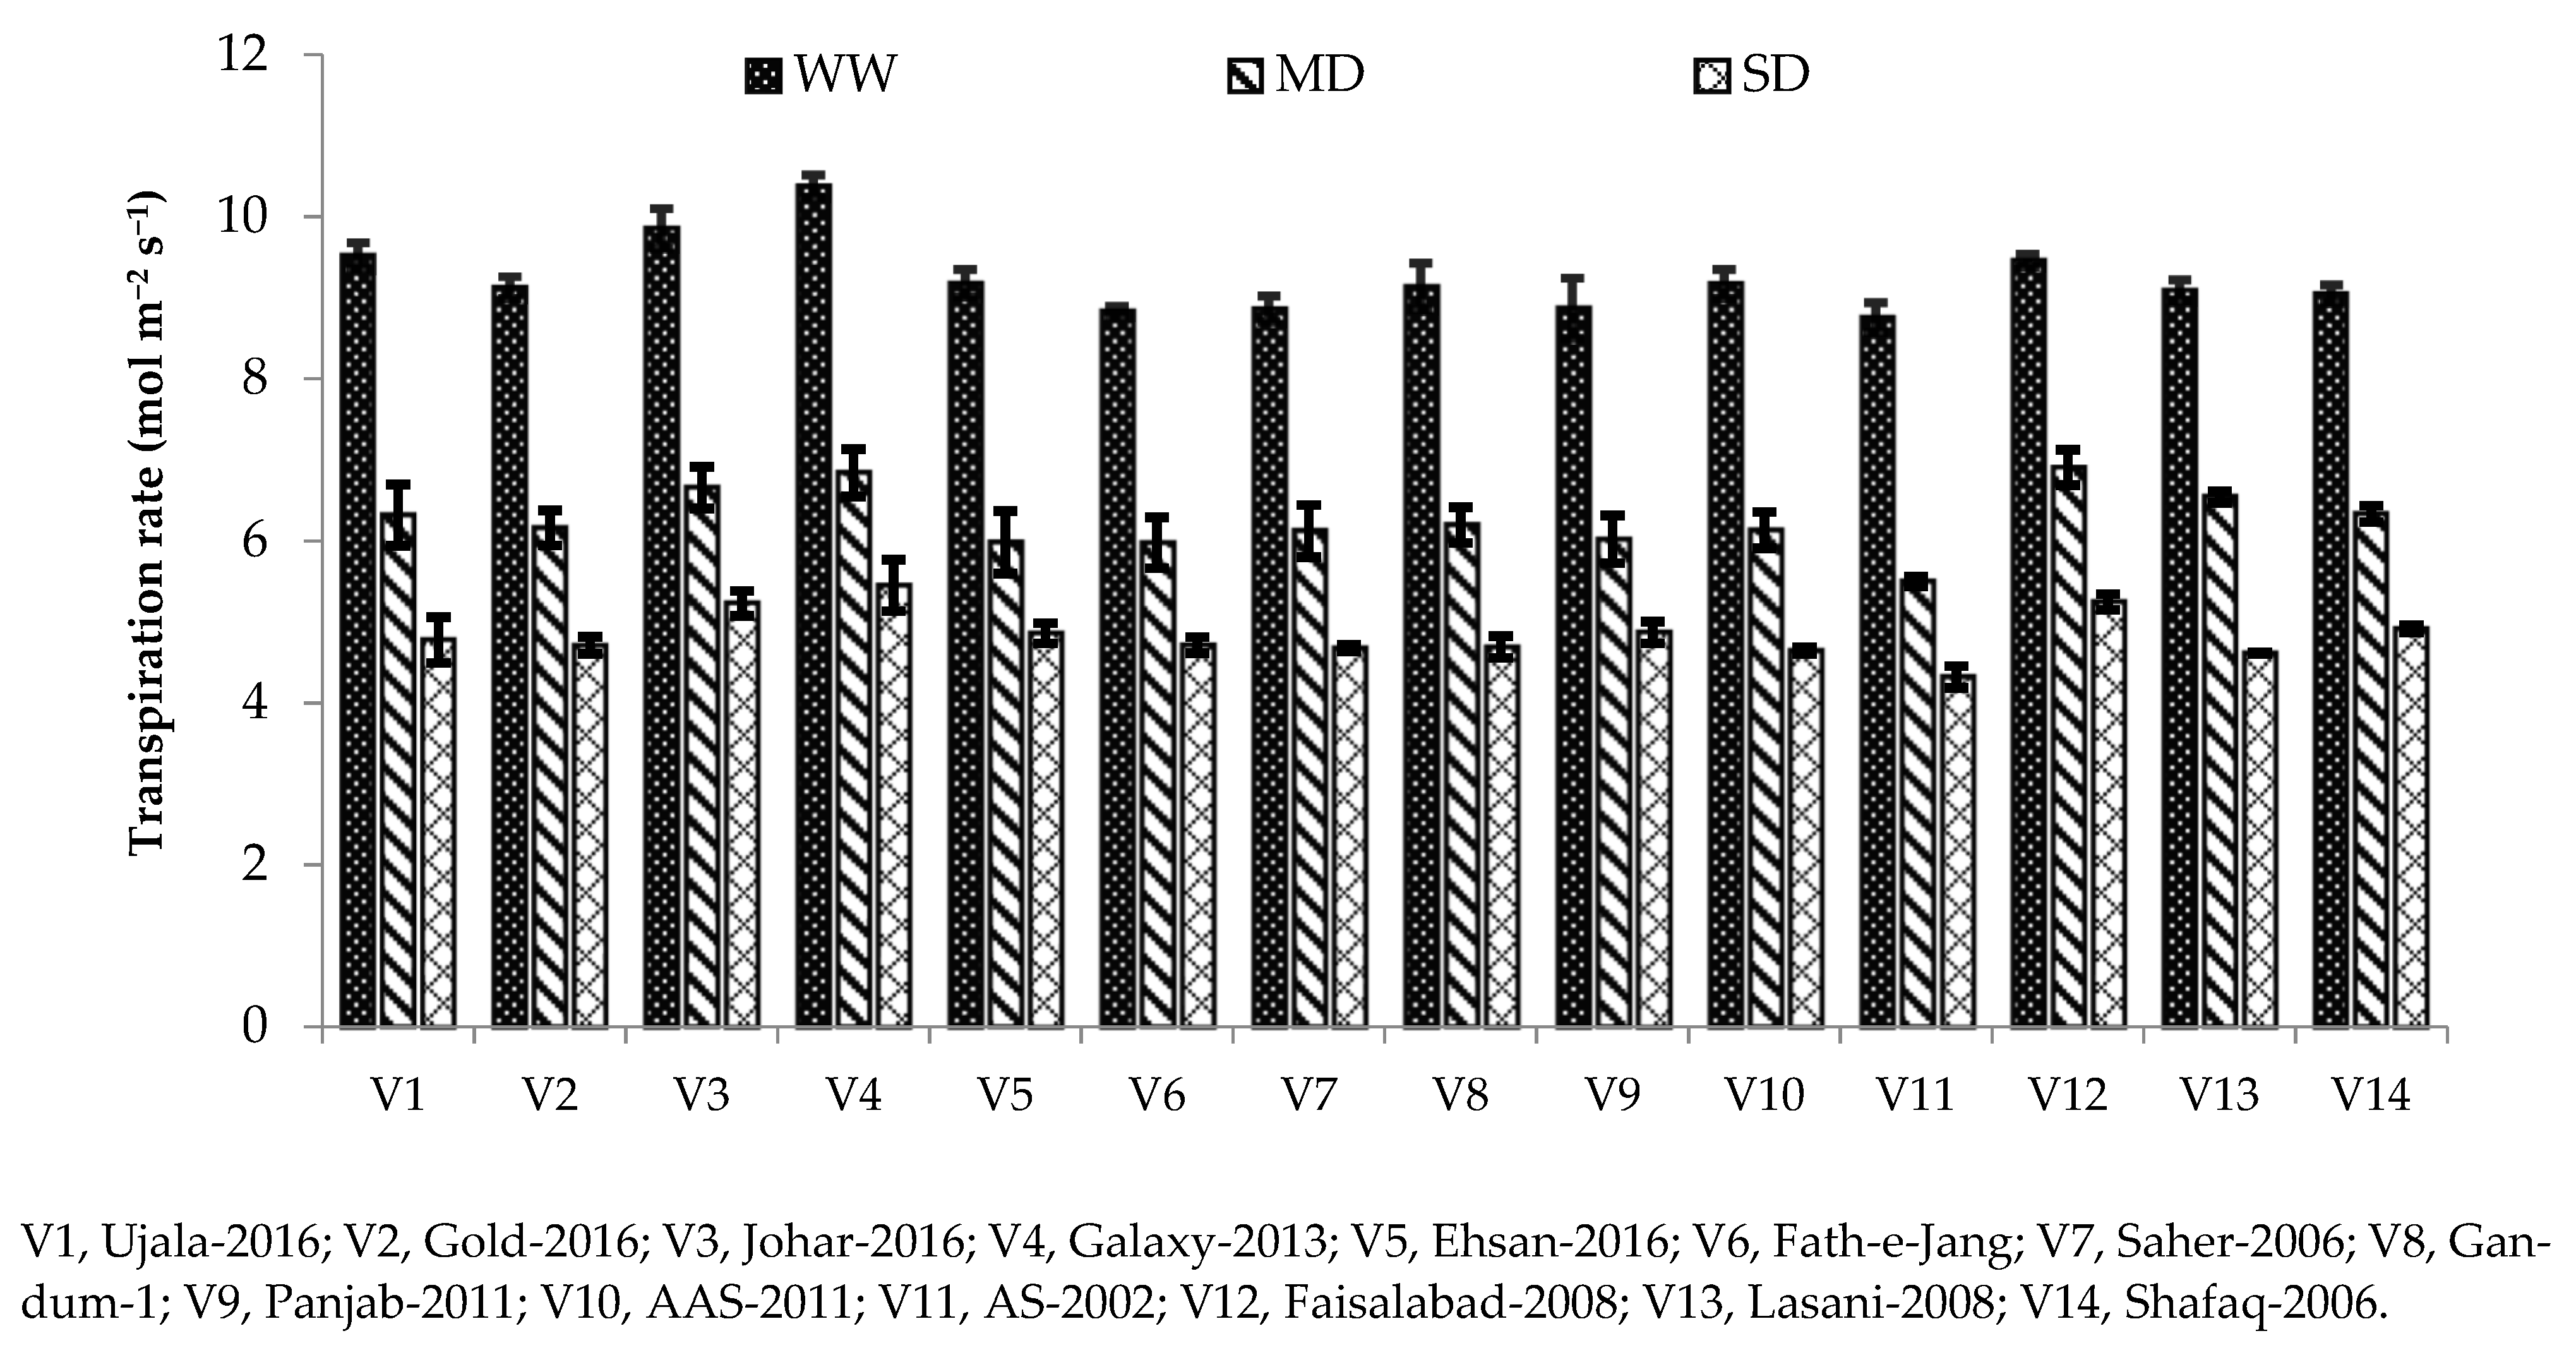
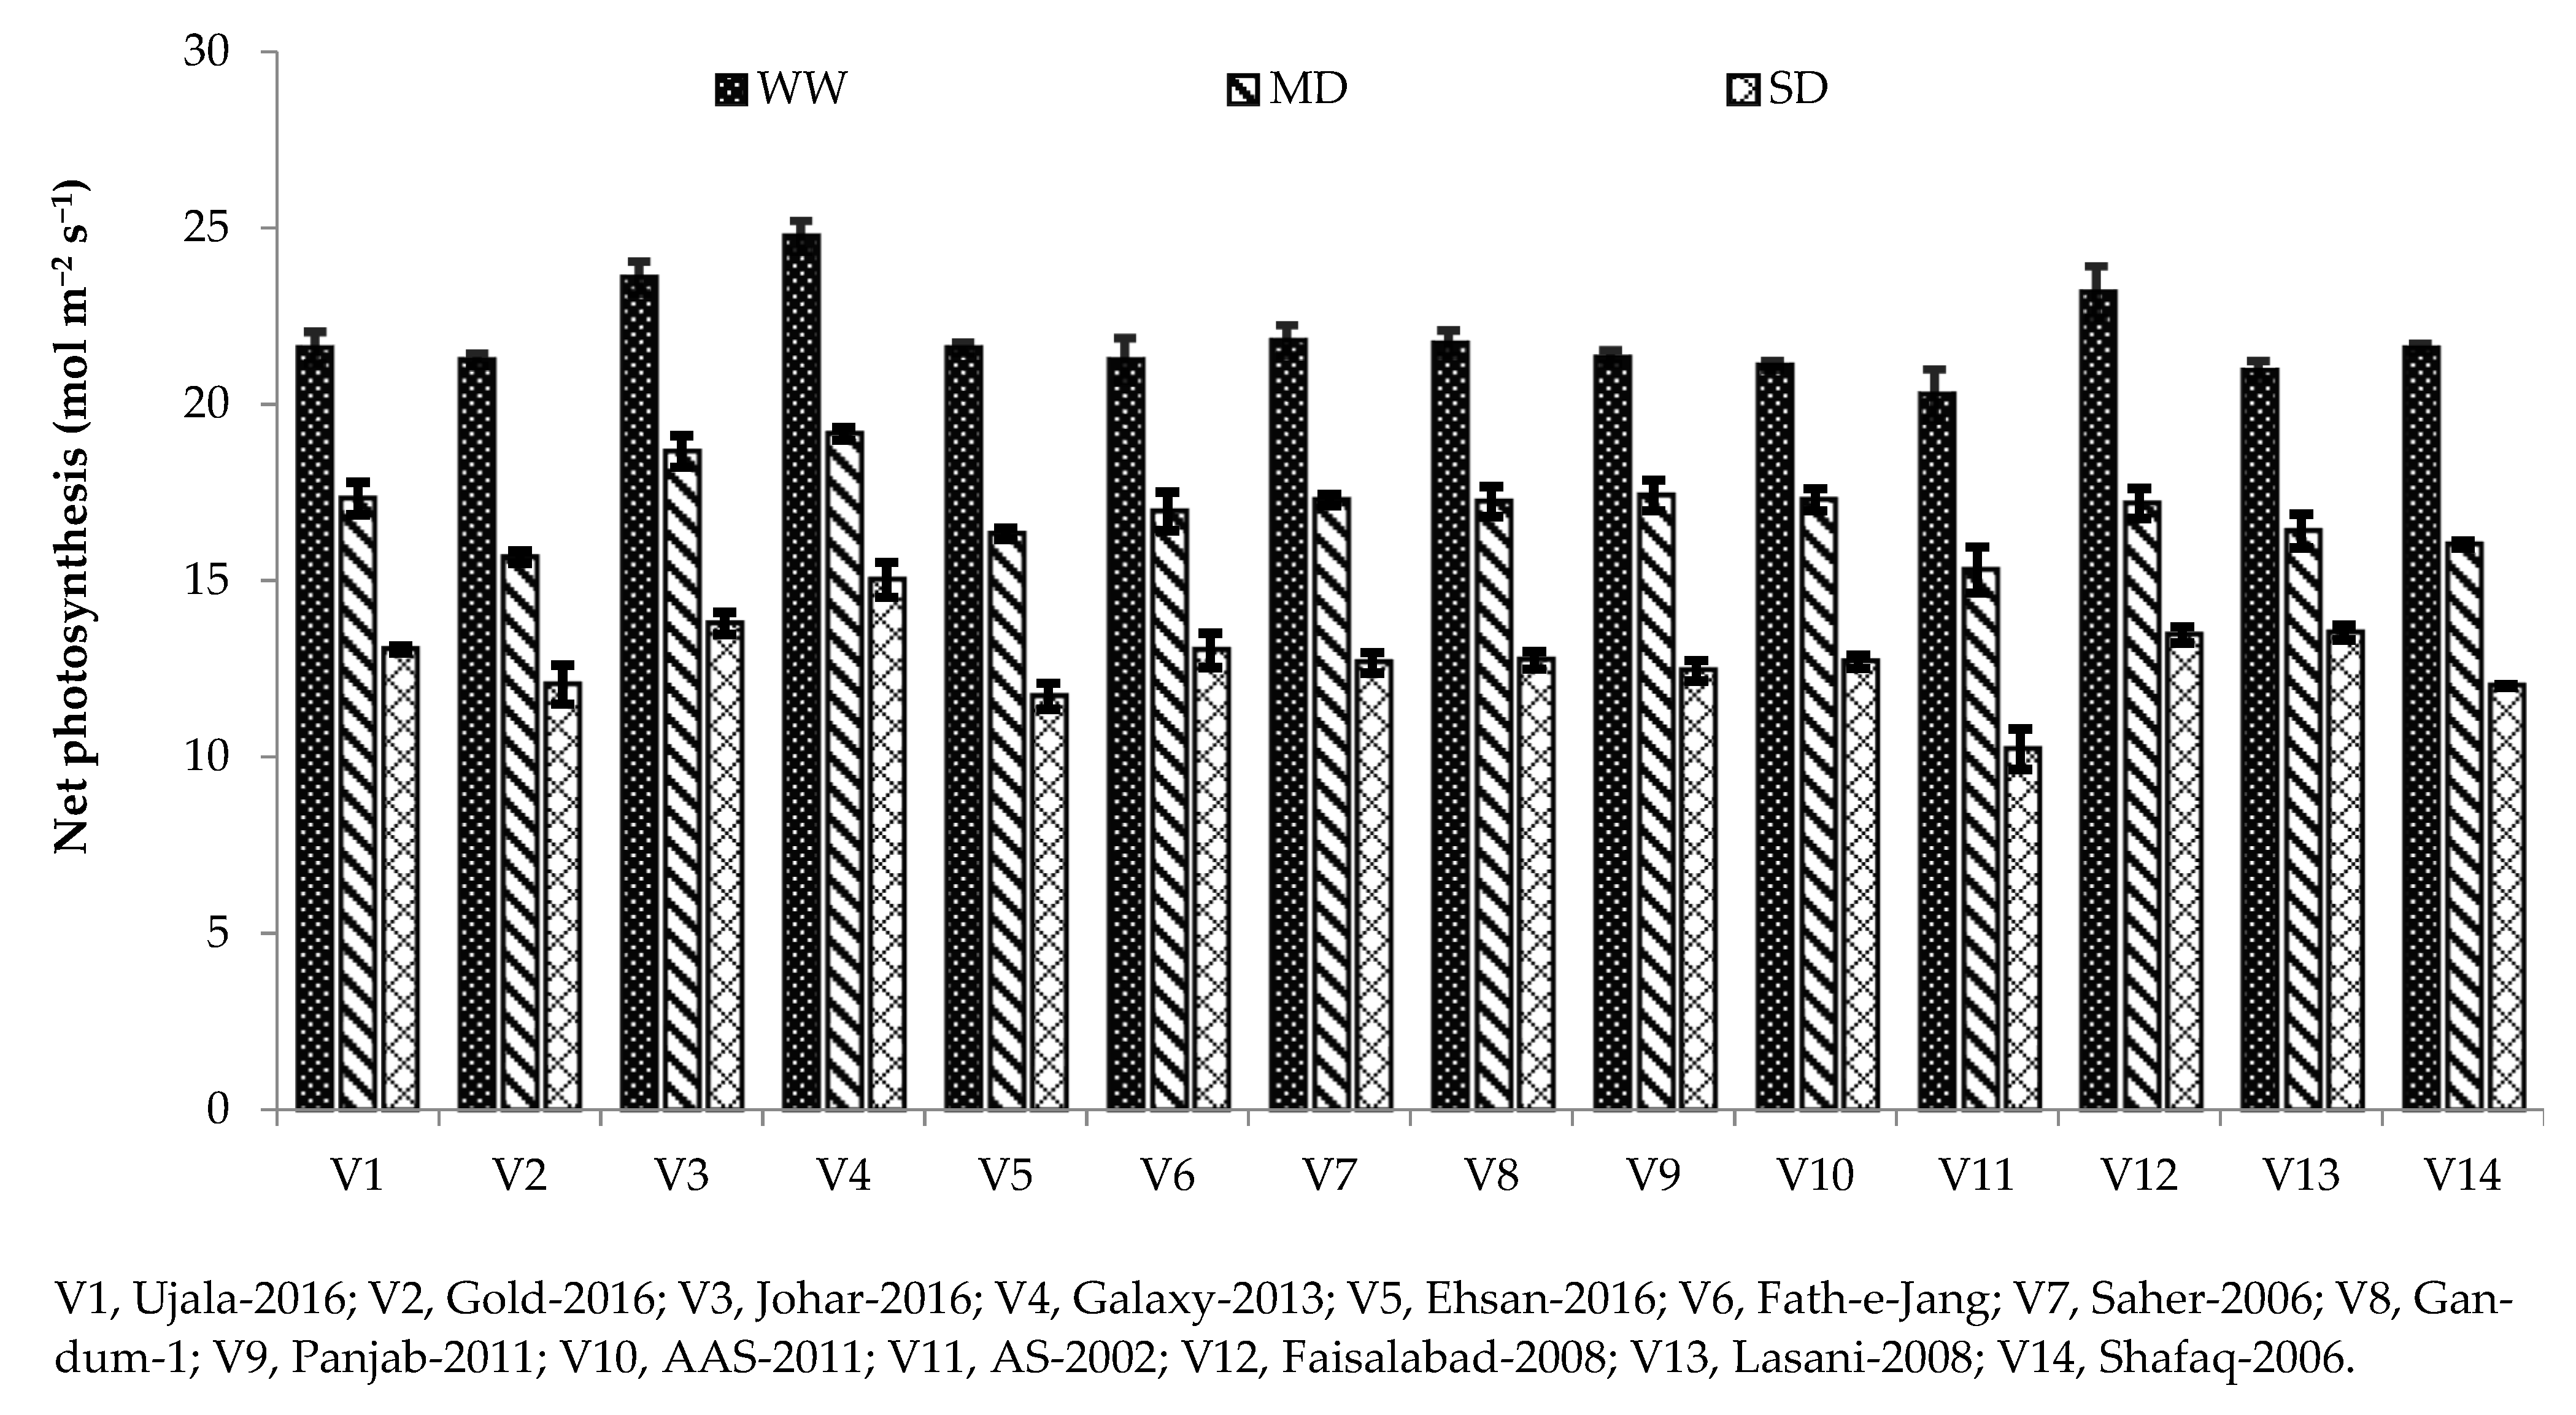
42]. In our study, different photosynthetic and gas exchange parameters, including Pn, gs, and transpiration rate, were reduced under drought stress conditions compared with the well-watered condition (Table 3). Chlorophyll is the main contributing factor towards photosynthesis rate; hence, decreases in net photosynthesis might be due to reduced chlorophyll contents under severe drought conditions (Table 1 and Table 2). In addition to chlorophyll, another contributing factor for reduced Pn is limited CO2 diffusion due to early stomatal closure under drought stress [43]. Stomatal conductance was also reduced in our study under drought stress, which might be due to the closure of stomata to combat drought [44]. Stomatal closure limits water loss through transpiration and helps plants to conserve water during water stress [44]. Drought affects photosynthesis pigments differently depending on the variety. Genotypes with higher chlorophyll content have a more photosynthetic rate due to their genetic make-up under drought stress [45]. The same was observed in the current study, as Galaxy-2013 being a drought-tolerant variety, has higher net photosynthesis and stomatal conductance under severe drought (Figure 1 and Figure 2). A high photosynthetic rate and stomatal conductance in drought-tolerant cultivars were also reported in [33].
Yield and yield-related traits were reduced when the drought was imposed, and its effect was more significant under severe drought conditions compared with non-stressed or controlled treatments (Table 3, Table 4, Table 5 and Table 6). Amongst all wheat cultivars, the maximum fertile tillers, spikelets per spike, grains per spike, 100-grain weight, grain yield, and biological yield were recorded in Galaxy-2013, followed by Johar-2016 under severe drought conditions (Table 3, Table 4, Table 5 and Table 6). Enhanced yield and yield-related traits in Galaxy-2013 might be due to improved chlorophyll contents and photosynthetic and gas exchange parameters under severe drought conditions (Table 2; Figure 1, Figure 2 and Figure 3). Decreased yield in drought-sensitive genotypes might be due to a reduction in chlorophyll as well photosynthetic parameters. It has been studied that under low water stress conditions, plants maintain their internal moisture through stomatal closure, resulting in a reduction of gas exchange parameters [46]. On the contrary, low transpiration in drought-sensitive genotypes due to stomata closure may reduce uptake of water from the soil solution, reducing nutrient uptake and ultimately reduced grain yield [34]. Meanwhile, in the case of drought-tolerant genotypes, a higher grain yield was due to sustained photosynthesis [47]. A reduction in the growth and metabolic activities leads to a reduction in agronomic and yield attributes under water deficit conditions [48]. Such a reduction in grain yield under severe drought compared with well-watered conditions might also be due to less retention of RWC, reflecting fewer metabolic activities (Table 2) [49]. The genotypes with reduced leaf water loss are believed to be more drought tolerant and are less affected by water losses through evapotranspiration, thus able to conserve more water content and improve its yield [50]. Reduced CO2 assimilation and transpiration rate, stomatal closure, RWC, and increased malondialdehyde content were observed in all cultivars under severe drought. However, drought-tolerant cultivars retained higher RWC and Pn, which ultimately improved grain yield [33].
The magnitude of correlations was stronger under severe water stress conditions than under mild and normal stress conditions. In a water-stress environment, sensitive physiological processes like turgor pressure, cell enlargement, division, and differentiation affect plant growth [51]. Under such conditions, the stomatal conductance is also decreased due to the reduction of leaf RWC, which reduces the net photosynthesis. The same was observed in our studies, where RWC was strongly correlated with gas exchange parameters under both extreme conditions (well water, Table 8; severe water stress, Table 10), and the same was responded in stronger correlations with the GY and BY. The significant and positive correlations between Pn, gs, and E under all treatments (Table 8 and Table 9) explain that the higher gs under normal water conditions than under severe stress condition might improve the access of CO2 into the chloroplast and resulted in more Pn and E. Regardless of the dynamics of stomatal conductance, all three parameters are strongly correlated with each other, and this can be observed in our findings (Table 8 and Table 9). These results are also consistent with the findings in wheat [52], rice [53], and peanut [54].

5. Conclusions

The current study suggested that wheat variety Johar-2016 performed well under well-watered conditions by maintaining higher RWC, stomatal conductance, and net photosynthesis. In comparison, Galaxy-2013 performed well under both mild and severe drought conditions by maintaining higher RWC, stomatal conductance, and net photosynthesis, which resulted in a higher grain yield than other genotypes under severe drought conditions. Therefore, under arid to semi-arid conditions, the farmers may grow wheat variety Galaxy-2013 to receive a better economic yield.

Author Contributions

Conceptualization and methodology: A.W. and T.A.Y.; software and validation: A.W. and S.M.; investigation and resources: S.M. and T.A.Y., data curation and software: K.M., N.S., and A.R. (Abdul Rehman), resources and formal analysis: N.S., A.R. (Abdul Rehman) and A.E.S.; writing—original draft preparation: K.M., A.W., T.A.Y., and S.M.; reviewing and editing, A.H., A.R. (Ali Raza), I.A.I., A.R. (Abdul Rehman), and A.E.S.; funding acquisition, A.W., I.A.I., and A.E.S. All authors have read and agreed to the published version of the manuscript.

Funding

The current work was funded by Higher Education Commission (HEC) Pakistan under NRPU grant # 7008 for year 2018. To publish current work funds were provided by Taif University Researchers Supporting Project number (TURSP-2020/120), Taif University, Taif, Saudi Arabia.

Institutional Review Board Statement

Not applicable.

Informed Consent Statement

Not applicable.

Data Availability Statement

Not applicable.

Acknowledgments

The authors are grateful to the Higher Education Commission (HEC) Pakistan for providing funds to complete this study under NRPU grant # 7008 for year 2018. The authors extend their appreciation to Taif University for providing funds to publish current work by Taif University Researchers Supporting Project number (TURSP-2020/120), Taif University, Taif, Saudi Arabia.

Conflicts of Interest

The authors declare no conflict of interest.

References

  1. Miyan, M.A. Droughts in Asian least developed countries: Vulnerability and sustainability. Weather Clim. Extrem. 2015, 7, 8–23. [Google Scholar] [CrossRef] [Green Version]
  2. Farooq, M.; Hussain, M.; Wahid, A.; Siddique, K.H.M. Drought stress in plants: An overview. In Plant Responses to Drought Stress: From Morphological to Molecular Features; Aroca, R., Ed.; Springer: Berlin/Heidelberg, Germany, 2012; pp. 1–36. [Google Scholar]
  3. Sallam, A.; Alqudah, A.M.; Dawood, M.F.; Baenziger, P.S.; Börner, A. Drought Stress Tolerance in Wheat and Barley: Advances in Physiology, Breeding and Genetics Research. Int. J. Mol. Sci. 2019, 20, 3137. [Google Scholar] [CrossRef] [Green Version]
  4. Kadam, N.N.; Xiao, G.; Melgar, R.J.; Bahuguna, R.N.; Quinonesand, C.; Tamilselvan, A. Agronomic and physiological response to high temperature, drought and delevate CO2 interactions in cereals. Adv. Agron. 2014, 127, 111–156. [Google Scholar]
  5. Knox, J.; Hess, T.; Daccache, A.; Wheeler, T. Climate change impacts on crop productivity in Africa and South Asia. Environ. Res. Lett. 2012, 7, 1–8. [Google Scholar] [CrossRef]
  6. Cappelli, A.; Cini, E. Challenges and Opportunities in Wheat Flour, Pasta, Bread, and Bakery Product Production Chains: A Systematic Review of Innovations and Improvement Strategies to Increase Sustainability, Productivity, and Product Quality. Sustainability 2021, 13, 2608. [Google Scholar] [CrossRef]
  7. Wasaya, A.; Zhang, X.; Fang, Q.; Zongzheng, Y. Root Phenotyping for Drought Tolerance: A Review. Agronomy 2018, 8, 241. [Google Scholar] [CrossRef] [Green Version]
  8. Yang, J.C.; Zhang, J.H.; Wang, Z.Q.; Zhu, Q.S.; Liu, L.J. Involvement of abscisic acid and cytokinins in the senescence and remobilization of carbon reserves in wheat subjected to water stress during grain filling. Plant Cell Environ. 2003, 26, 1621–1631. [Google Scholar] [CrossRef]
  9. Farooq, M.; Wahid, A.; Kobayashi, N.; Fujita, D.B.S.M.A.; Basra, S.M.A. Plant drought stress: Effects, mechanisms and management. In Sustainable Agriculture; Springer: Dordrecht, The Netherlands, 2009; pp. 153–188. [Google Scholar]
  10. Asada, K. Production and scavenging of reactive oxygen species in chloroplasts and their functions. Plant Physiol. 2006, 141, 391–396. [Google Scholar] [CrossRef] [Green Version]
  11. Ahmadi, A.; Baker, D.A. The effect of water stress on the activities of key regulatory enzymes of the sucrose to starch pathway in wheat. Plant Growth Reg. 2001, 35, 81–91. [Google Scholar] [CrossRef]
  12. Yang, J.; Zhang, J.; Wang, Z.; Zhu, Q.; Liu, L. Water deficit induced senescence and its relationship to the remobilization of pre-stored carbon in wheat during grain filling. Agron. J. 2001, 93, 196–206. [Google Scholar] [CrossRef]
  13. Chaves, M.M.; Maroco, J.P.; Pereira, J.S. Understanding plant responses to drought from genes to the whole plant. Funct. Plant Biol. 2003, 30, 239–264. [Google Scholar] [CrossRef]
  14. Cornic, G. Drought stress inhibits photosynthesis by decreasing stomatal aperture not by affecting ATP synthesis. Trends Plant Sci. 2000, 5, 187–188. [Google Scholar] [CrossRef]
  15. Bayat, H.; Nemati, H.; Tehranifar, A.; Gazanchian, A. Screening different crested wheatgrass (Agropyron cristatum (L.) Gaertner) accessions for drought stress tolerance. Arch. Agron. Soil Sci. 2016, 62, 769–780. [Google Scholar] [CrossRef]
  16. Caser, M.; Angiolillo, F.D.; Chitarra, W.; Lovisolo, C.; Ruffoni, B.; Pistelli, L.; Pistelli, L.; Scariot, V. Ecophysiological and phytochemical responses of Salvia sinaloensis Fern. to drought stress. J. Plant Growth Regul. 2018, 84, 383–394. [Google Scholar] [CrossRef]
  17. Ji, X.; Shiran, B.; Wan, J. Importance of pre-anthesis anther sink strength for maintenance of grain number during reproductive stage water stress in wheat. Plant Cell Environ. 2010, 33, 926–942. [Google Scholar] [CrossRef] [PubMed]
  18. Cappelli, A.; Guerrini, L.; Parenti, A.; Palladino, G.; Cini, E. Effects of wheat tempering and stone rotational speed on particle size, dough rheology and bread characteristics for a stone-milled weak flour. J. Cereal Sci. 2020, 91, 102879. [Google Scholar] [CrossRef]
  19. Cappelli, A.; Mugnaini, M.; Cini, E. Improving roller milling technology using the break, sizing, and reduction systems for flour differentiation. LWT—Food Sci. Technol. 2020, 133, 110067. [Google Scholar] [CrossRef]
  20. Cappelli, A.; Bettaccini, L.; Cini, E. The kneading process: A systematic review of the effects on dough rheology and resulting bread characteristics, including improvement strategies. Trends Food Sci. Technol. 2020, 104, 91–101. [Google Scholar] [CrossRef]
  21. Cappelli, A.; Canessa, J.; Cini, E. Effects of CO2 snow addition during kneading on thermoregulation, dough rheological properties, and bread characteristics: A focus on ancient and modern wheat cultivars. Int. J. Refrig. 2020, 117, 52–60. [Google Scholar] [CrossRef]
  22. Ray, D.K.; Mueller, N.D.; West, P.C.; Foley, J.A. Yield trends are insufficient to double global crop production by 2050. PLoS ONE 2013, 8, 66428. [Google Scholar] [CrossRef] [Green Version]
  23. Ahmad, R.; Qadir, S.; Ahmad, N.; Shah, K.H. Yield potential and stability of nine wheat varieties under water stress conditions. Int. J. Agric. Biol. 2003, 5, 7–9. [Google Scholar]
  24. Beltrano, J.; Marta, G.R. Improved tolerance of wheat plants (Triticum aestivum L.) to drought stress and rewatering by the arbuscular mycorrhizal fungus Glomus claroideum: Effect on growth and cell membrane stability. Braz. J. Plant Physiol. 2008, 20, 234–240. [Google Scholar] [CrossRef]
  25. Amin, M.; Khan, M.R.; Hassan, S.S.; Khan, A.A.; Imran, M.; Goheer, M.A.; Hina, S.M.; Perveen, A. Monitoring agricultural drought using geospatial techniques: A case study of Thal region of Punjab, Pakistan. J. Water Clim. Chang. 2020, 11, 203–216. [Google Scholar] [CrossRef]
  26. Ahmad, A.; Khan, M.R.; Shah, S.H.; Kamran, M.A.; Wajid, S.A.; Amin, M.; Khan, A.; Arshad, M.N.; Cheema, M.J.; Saqib, Z.A.; et al. Agro-Ecological Zones of Punjab—Pakistan, 2019; Food and Agricultural Organization of the United Nations (FAO): Rome, Italy, 2019. [Google Scholar]
  27. Nachabe, M.H. Refining the definition of field capacity in the literature. J. Irrig. Drain. Eng. 1998, 124, 230–232. [Google Scholar] [CrossRef]
  28. Schonfeld, M.A.; Johnson, R.C.; Carver, B.F.; Mornhinweg, D.W. Water relations in winter wheat as drought resistance indicators. Crop Sci. 1988, 28, 526–531. [Google Scholar] [CrossRef]
  29. Long, S.P.; Bernacchi, C.J. Gas exchange measurements, what can they tell us about the underlying limitations to photosynthesis? Procedures and sources of error. J. Exp. Bot. 2003, 54, 2393–2401. [Google Scholar] [CrossRef] [Green Version]
  30. Steel, R.G.D.; Torrie, J.H.; Dickey, D.A. Principles and Procedures of Statistics. A Biometrical Approach; McGraw Hill Book Co.: New York, NY, USA, 1997; pp. 400–428. [Google Scholar]
  31. Budak, H.; Kantar, M.; Yucebilgili, K.K. Drought tolerance in modern and wild wheat. Sci. World J. 2013, 2013, 548246. [Google Scholar] [CrossRef] [Green Version]
  32. Allahverdiyev, T. Effect of drought stress on some physiological traits of durum (Triticum durum Desf.) and bread (Triticum aestivum L.) wheat genotypes. J. Stress Physiol. Biochem. 2015, 11, 29–38. [Google Scholar]
  33. Marček, T.; Hamow, K.A.; Vegh, B.; Janda, T.; Darko, E. Metabolic response to drought in six winter wheat genotypes. PLoS ONE 2019, 14, e0212411. [Google Scholar] [CrossRef] [Green Version]
  34. Zandalinas, S.I.; Mittler, R.; Balfagón, D.; Arbona, V.; Gómez-Cadenas, A. Plant adaptations to the combination of drought and high temperatures. Physiol. Plant. 2018, 162, 2–12. [Google Scholar] [CrossRef] [PubMed] [Green Version]
  35. Chen, Y.E.; Liu, W.J.; Su, Y.Q.; Cui, J.M.; Zhang, Z.W.; Yuan, M.; Zhang, H.Y.; Yuan, S. Different response of photosystem II to short and long-term drought stress in Arabidopsis thaliana. Physiol. Plant. 2016, 158, 225–235. [Google Scholar] [CrossRef]
  36. Farshadfar, E.; Amiri, R. Genetic analysis of physiological indicators of drought tolerance in bread wheat using diallel technique. Genetika 2015, 47, 107–118. [Google Scholar] [CrossRef]
  37. Yasir, T.A.; Min, D.; Chen, X.; Condon, A.G.; Hu, Y.G. The association of carbon isotope discrimination (D) with gas exchange parameters and yield traits in Chinese bread wheat cultivars under two water regimes. Agric. Water Manag. 2013, 119, 111–120. [Google Scholar] [CrossRef]
  38. Kalaji, H.M.; Jajoo, A.; Oukarroum, A.; Brestic, M.; Zivcak, M.; Samborska, I.A.; Cetner, M.D.; Łukasik, I.; Goltsev, V.; Ladle, R.J. Chlorophyll a fluorescence as a tool to monitor physiological status of plants under abiotic stress conditions. Acta Physiol. Plant 2016, 38, 102. [Google Scholar] [CrossRef] [Green Version]
  39. Zhang, M.; Lv, D.; Ge, P.; Bian, Y.; Chen, G.; Zhu, G.; Li, X.; Yan, Y. Phosphoproteome analysis reveals new drought response and defense mechanisms of seedling leaves in bread wheat (Triticum aestivum L.). J. Proteom. 2014, 109, 290–308. [Google Scholar] [CrossRef] [PubMed]
  40. Epée Missé, P.T. Wheat Seedling Physiological Adaptation to Overcome Water Stress. SSRN 2018, 2–11. [Google Scholar] [CrossRef]
  41. Saeidi, M.; Zabihi-e-Mahmoodabad, R. Evaluation of drought stress on relative water content and chlorophyll content of sesame (Sesamum indicum L.) genotypes at early flowering stage. Res. J. Environ. Sci. 2009, 3, 345–350. [Google Scholar]
  42. Dawood, M.F.A.; Abeed, A.H.A.; Aldaby, E.E.S. Titanium dioxide nanoparticles model growth kinetic traits of some wheat cultivars under different water regimes. Indian J. Plant Physiol. 2019, 24, 129–140. [Google Scholar] [CrossRef]
  43. Pandey, V.; Shukla, A. Acclimation and tolerance strategies of rice under drought stress. Rice Sci. 2015, 22, 147–161. [Google Scholar] [CrossRef] [Green Version]
  44. Centritto, M.; Lauteri, M.; Monteverdi, M.C.; Serraj, R. Leaf gas exchange, carbon isotope discrimination, and grain yield in contrasting rice genotypes subjected to water deficits during the reproductive stage. J. Exp. Bot. 2009, 60, 2325–2339. [Google Scholar] [CrossRef]
  45. Alaei, Y. The Effect of Amino Acids on Leaf Chlorophyll Content in Bread Wheat Genotypes under Drought Stress Conditions. Middle-East J. Sci. Res. 2011, 10, 99–101. [Google Scholar]
  46. Perdomo, J.A.; Capó-Bauçà, S.; Carmo-Silva, E.; Galmés, J. Rubisco and rubisco activase play an important role in the biochemical limitations of photosynthesis in rice, wheat, and maize under high temperature and water deficit. Front. Plant Sci. 2017, 8, 490. [Google Scholar] [CrossRef] [Green Version]
  47. Larbi, A.; Mekliche, A. Relative water content (RWC) and leaf senescence as screening tools for drought tolerance in wheat. Options Méditerranéennes. Série A Sémin. Méditerr. 2004, 60, 193–196. [Google Scholar]
  48. Hussain, H.A.; Hussain, S.; Khaliq, A.; Ashraf, U.; Anjum, S.A.; Men, S.; Wang, L. Chilling and drought stresses in crop plants: Implications, cross talk, and potential management opportunities. Front. Plant Sci. 2018, 9, 393. [Google Scholar] [CrossRef]
  49. Clarke, J.M.; McCaig, T.N. Evaluation of Techniques for Screening for Drought Resistance in Wheat. Crop Sci. 1982, 22, 503. [Google Scholar] [CrossRef]
  50. Izanloo, A.; Condon, A.G.; Langridge, P.; Tester, M.; Schnurbusch, T. Different mechanisms of adaptation to cyclic water stress in two South Australian bread wheat cultivars. J. Exp. Bot. 2008, 59, 3327–3346. [Google Scholar] [CrossRef] [PubMed] [Green Version]
  51. Mitchell, P.J.; O’Grady, A.P.; Tissue, D.T.; White, D.A.; Ottenschlaeger, M.L.; Pinkard, E.A. Drought response strategies define the relative contributions of hydraulic dysfunction and carbohydrate depletion during tree mortality. New Phytol. 2013, 197, 862–872. [Google Scholar] [CrossRef]
  52. Yasir, T.A.; Wasaya, A.; Hussain, M.; Ijaz, M.; Farooq, M.; Farooq, O.; Nawaz, A.; Hu, Y.G. Evaluation of physiological markers for assessing drought tolerance and yield potential in bread wheat. Physiol. Mol. Biol. Plants 2019, 25, 1163–1174. [Google Scholar] [CrossRef]
  53. Li, S.; Jiang, H.; Wang, J.; Wang, Y.; Pan, S.; Tian, H.; Duan, M.; Wang, S.; Tang, X.; Mo, Z. Responses of plant growth, physiological, gas exchange parameters of super and non-super rice to rhizosphere temperature at the tillering stage. Sci. Rep. 2019, 9, 10618. [Google Scholar] [CrossRef] [PubMed]
  54. Quamruzzaman, M.; Rahman, M.J.; Uddain, J.; Sarkar, M.D.; Subramaniam, S. Leaf gas exchange, reproductive development, physiological and nutritional changes of peanut as influenced by boron. J. Plant Interact. 2018, 13, 306–314. [Google Scholar] [CrossRef] [Green Version]
Figure 1. Influence of different drought levels on net photosynthesis of wheat genotypes.
Sustainability 13 04799 g001
Figure 2. Influence of different drought levels on stomatal conductance of wheat genotypes.
Sustainability 13 04799 g002
Figure 3. Influence of different drought levels on the transpiration rate of wheat genotypes.
Sustainability 13 04799 g003
Table 1. List of genotypes with their planting region, origin and year of release used in this study.
Sr. No.GenotypePlanting RegionOriginYear of Release
01Ujala-2016Irrigated areas of PunjabAARI-Faisalabad2016
02Gold-2016Irrigated areas of PunjabRARI Bahawalpur2016
03Johar-2016Irrigated areas of PunjabRARI Bahawalpur2016
04Galaxy-2013Irrigated areas of PunjabAARI-Faisalabad2013
05Ehsan-2016Rainfed areas of PunjabBARI-Chakwal2016
06Fath-e-Jang-16Rainfed areas of PunjabBARI-Chakwal2016
07Saher-2006Irrigated areas of PunjabAARI-Faisalabad2006
08Gandum-1All over PunjabNIBGE-Faisalabad2016
09Panjab-2011Irrigated areas of PunjabAARI-Faisalabad2011
10AAS-2011Irrigated areas of PunjabRARI Bahawalpur2011
11AS-2002Irrigated areas of PunjabAARI-Faisalabad2002
12Faisalabad-2008Irrigated areas of PunjabAARI-Faisalabad2008
13Lasani-2008Irrigated areas of PunjabAARI-Faisalabad2008
14Shafaq-2006Irrigated areas of PunjabAARI-Faisalabad2006
Table 2. Effect of different drought levels on relative water contents (%) and SPAD-chlorophyll of wheat genotypes.
Genotypes (G)Relative Water Contents (%)SPAD-Chlorophyll Value
WWMDSDMeans (G)WWMDSDMeans
Ujala-201677.0 b–d66.3 e–k53.3 o–p65.5 EF53.152.050.651.9 DE
Gold-201673.1 c–e62.6 h–n56.2 n–p64.0 F55.654.052.754.1 A–C
Johar-201685.7 a71.2 d–g62.3 i–n73.1 A56.352.450.853.2 CD
Galaxy-201373.1 c–e67.1 e–j65.2 f–l68.5 A–D59.453.354.155.6 A
Ehsan-201382.0 ab69.7 d–h58.3 l–p70.0 A–C54.553.751.853.3 CD
Fath-e-Jang81.5 ab72.0 d–f57.5 m–p70.3 A–C54.452.952.253.2 CD
Saher-200672.5 c–f68.4 e–i60.1 j–o66.9 B–D52.850.049.450.7 E
Gandum-180.7 ab70.7 b–g58.2 l–p69.9 A–C55.053.651.453.3 CD
Punjab-201182.7 ab68.4 e–i61.0 j–n70.7 A–C55.753.953.354.3 AC
AAS-201181.5 ab72.4 c–f64.6 g–m72.9 A54.552.852.053.1 CD
AS-200279.5 a–c61.9 i–n55.4 n–p65.6 C–D56.053.751.853.8 BC
FSD-200885.0 a71.3 d–g61.9 i–n72.7 A55.253.853.854.3 A–C
Lasani-200885.1 a70.5 d–g52.3 p69.3 A–D56.155.053.054.7 A–C
Shafaq-200684.8 a70.1 d–g59.2 k–p71.4 AB56.055.554.155.2 AB
Means drought (D)80.3 A68.8 B59.0 C 55.3 A53.3 B52.2 C
LSD (p ≤ 0.01) for drought (D)1.960.77
LSD for G4.241.66
LSD (D × G)7.35NS
D = drought; G = genotype; WW = well–watered; MD = mild drought; SD = severe drought. Means not sharing the same letters differ significantly at p ≤ 0.01, NS = Non-significant.
Table 3. Effect of different drought levels on plant height and fertile tillers per plant of wheat genotypes.
Genotypes (G)Plant Height (cm)Fertile Tillers Plant−1
WWMDSDMeans (G)WWMDSDMeans
Ujala-201665.5 c–k64.0 c–k60.9 g–l63.5 DE4.42 d–i4.00 g–m3.50 lm3.97 D
Gold-201665.8 b–k61.0 g–l60.8 g–l62.5 DF5.33 ab5.25 a–c3.58 k–m4.72 AB
Johar-201680.6 a58.7 i–m56.9 k–m65.4 CE5.42 a4.17 f–l3.83 i–m4.47 A–C
Galaxy-201380.6 a72.5 a–f66.3 b–k73.1 A5.42 a4.67 b–g4.50 d–i4.86 A
Ehsan-201362.2 f–k59.8 i–m58.1 i–m60.0 EF4.92 a–e4.42 d–i3.50 lm4.28 CD
Fath-e-Jang63.5 d–k62.0 f–k61.7 g–k62.4 D–F4.33 e–j4.17 f–l3.50 lm4.00 D
Saher-200660.6 h–l58.7 i–m50.3 lm56.5 F4.25 e–k4.08 g–m4.08 g–m4.14 CD
Gandum-164.2 c–k57.4 j–m60.8 g–l60.8 D–F4.83 a–f4.17 f–l3.67 j–m4.22 CD
Punjab-201173.2 a–e63.9 d–k61.0 g–k66.0 B–E5.08 a–d4.25 e–k3.83 i–m4.39 B–D
AAS-201174.6 a–c62.7 e–k59.2 i–m65.5 C–E4.67 b–g4.08 g–m3.67 j–m4.14 CD
AS-200270.8 a–h68.1 b–i49.8 m62.9 DE4.58 c–h4.17 f–l3.42 m4.06 CD
FSD-200870.5 a–h65.1 c–k63.2 d–k66.3 BD5.08 a–d3.92 h–m4.08 g–m4.36 B–D
Lasani-200873.4 a–d68.4 b–i67.9 b–j69.9 A–C4.83 a–f4.25 e–k3.83 i–m4.31 B–D
Shafaq-200676.4 ab71.4 a–g68.6 b–i72.1 AB4.58 c–h4.00 g–m3.50 lm4.03 D
Means drought (D)70.1 A63.8 B60.4 C 4.84 A4.26 B3.75 C
LSD (p ≤ 0.01) for drought (D)2.850.20
LSD for G6.170.43
LSD (D × G)10.680.74
D = drought; G = genotype; WW = well–watered; MD = mild drought; SD = severe drought. Means not sharing the same letters differ significantly at p ≤ 0.01.
Table 4. Effect of different drought levels on spike length and spikelets per spike of wheat genotypes.
Genotypes (G)Spike Length (cm)Spikelet Per Spike
WWMDSDMeans (G)WWMDSDMeans
Ujala-201610.3 ns9.68.09.3 B–D18.0 b–e16.7 d–g15.7 g16.8 E
Gold-201610.19.08.99.4 B–D18.0 b–e17.0 c–g16.0 f–g17.0 DE
Johar-201612.18.78.59.8 A–C23.0 a18.3 b–d17.3 b–g19.6 A
Galaxy-201310.810.39.710.3 AB19.0 a18.7 b–c17.7 b–f18.4 BC
Ehsan-20139.78.78.48.9 CD18.7 bc17.7 b–f16.7 d–g17.7 E
Fath-e-Jang9.68.37.88.6 D17.7 b–f17.7 b–f17.7 b–f17.7 E
Saher-200610.48.97.89.0 CD17.7 b–f17.7 b–f17.7 b–f17.7 E
Gandum-111.59.38.49.7 A–C18.7 bc17.7 d–f16.7 d–g17.7 E
Punjab-201111.110.09.710.3 AB19.0 b18.0 b–e16.7 d–g17.9 B–D
AAS-201110.89.59.39.9 A–C19.0 b17.7 b–f16.7 d–g17.8 B–D
AS-200212.010.09.510.5 A18.7 bc17.3 b–g16.3 e–g17.4 DE
FSD-200810.19.39.29.6 A–D18.0 b–e17.3 b–g16.0 f–g17.1 DE
Lasani-200811.010.19.710.2 AB18.0 b–e17.0 c–g16.3 e–g17.1 DE
Shafaq-200610.38.78.09.0 CD22.7 a17.0 c–g16.3 e–g18.7 AB
Means drought (D)10.7 A9.3 B8.8 C 19.0 A17.5 B16.7 C
LSD (p ≤ 0.01) for drought (D)0.470.45
LSD for G1.020.98
LSD (D × G)NS1.70
D = drought; G = genotype; WW = well–watered; MD = mild drought; SD = severe drought. Means not sharing the same letters differ significantly at p ≤ 0.01.
Table 5. Effect of different drought levels on spike weight and grains spike−1 of wheat genotypes.
Genotypes (G)Spike Weight (g)Grains Per Spike
WWMDSDMeans (G)WWMDSDMeans
Ujala-20161.54 c–f1.33 m–o1.31 n–q1.39 B–D34.3 e26.3 f–k24.3 i–k28.3 E
Gold-20161.58 c1.26 p–s1.25 q–s1.36 C–E36.0 de27.3 f–j25.3 g–k29.6 C–E
Johar-20161.80 a1.31 n–p1.30 m–q1.47 A42.0 a27.7 f–i25.3 g–k31.7 A–C
Galaxy-20131.69 b1.41 i–l1.38 lm1.49 A39.0 a–d29.7 f27.7 f–i32.1 A
Ehsan-20131.55 c–e1.40 i–l1.31 n–q1.42 B40.7 a–d28.7 fg25.7 g–k31.7 A–C
Fath-e-Jang1.57 cd1.33 m–o1.30 o–q1.40 BC39.7 a–c28.7 fg25.0 h–k31.1 A–D
Saher-20061.45 h–j1.36 l–n1.33 m–o1.38 B–D34.0 e28.0 f–h25.3 g–k29.1 DE
Gandum-11.50 e–h1.38 k–n1.31 n–q1.40 B–D41.7 a27.7 f–i26.0 g–k31.8 AB
Punjab-20111.46 g–i1.33 m–o1.29 o–r1.36 DE41.0 ab28.7 fg26.7 f–k32.1 AB
AAS-20111.46 g–i1.25 p–s1.22 s1.31 F40.0 ab28.0 f–h23.3 k30.4 A–E
AS-20021.45 h–k1.35 l–o1.29 o–r1.36 C–E40.7 ab28.0 f–h25.0 h–k31.2 A–D
FSD-20081.46 g–i1.31 n–q1.23 rs1.33 EF39.3 a–d26.0 g–k25.3 g–k30.2 A–E
Lasani-20081.48 f–h1.39 j–m1.23 s1.36 C–E38.0 b–d26.0 g–k25.3 g–k29.8 B–E
Shafaq-20061.52 d–g1.33 m–o1.30 o–q1.38 CD36.3 c–e26.3 f–k24.0 j–k28.9 E
Means drought (D)1.54 A1.34 B1.29 C 38.8 A27.6 B25.3 C
LSD (p ≤ 0.01) for drought (D)0.0170.97
LSD for G0.0382.11
LSD (D × G)0.0653.66
D = drought; G = genotype; WW = well–watered; MD = mild drought; SD = severe drought. Means not sharing the same letters differ significantly at p ≤ 0.01
Table 6. Effect of different drought levels on 100-grain weight and grain yield per plant of wheat genotypes.
Genotypes (G)100-Grain Weight (g)Grain Yield (g Plant−1)
WWMDSDMeans (G)WWMDSDMeans
Ujala-20163.4 f–i3.0 j–o3.0 j–o3.13 C–E6.8 d–g5.3 i–o4.6 l–o5.5 D
Gold-20163.4 e–i3.4 g–i3.1 i–n3.29 BC8.5 bc6.6 d–h4.5 no6.5 A–C
Johar-20164.1 a3.7 b–e3.2 h–l3.67 A9.8 a5.5 i–o5.0 j–o6.7 AB
Galaxy-20134.1 a3.4 d–h3.3 h–j3.60 A9.2 ab6.6 d–h6.2 e–i7.3 A
Ehsan-20133.8 bc3.2 h–k2.8 n–q3.28 BC7.6 cd6.2 e–i4.6 l–o6.1 B–D
Fath-e-Jang3.6 c–g3.2 h–l2.8 n–q3.21 B–D6.8 d–g5.5 h–o4.5 m–o5.6 D
Saher-20063.3 g–i2.9 l–p2.6 q2.95 E6.2 e–i5.6 h–n5.4 i–o5.7 CD
Gandum-13.9 a–c3.3 gi2.8 o–q3.33 B7.2 de5.8 g–k4.8 j–o5.9 B–D
Punjab-20113.9 a–c2.9 k–o2.9 m–q3.23 B–D7.4 cd5.7 h–l5.0 j–o6.0 B–D
AAS-20113.7 b–d3.2 h–m2.9 n–q3.25 BC6.8 d–g5.1 i–o4.5 no5.5 D
AS-20023.9 ab3.2 h–l2.6 pq3.26 BC6.6 d–h5.6 h–m4.4 o5.5 D
FSD-20083.6 c–g2.9 n–q2.7 o–q3.06 DE7.4 cd5.1 i–o5.0 j–o5.9 CD
Lasani-20083.6 c–g3.3 g–i2.8 n–q3.25 BC7.2 de5.9 f–j4.7 k–o5.9 B–D
Shafaq-20063.7 b–f3.2 h–l3.0 j–o3.28 BC6.9 d–f5.3 i–o4.5 l–o5.6 D
Means drought (D)3.7 A3.2 B2.9 C 7.4 A5.7 B4.8 C
LSD (p ≤ 0.01) for drought (D)0.080.3
LSD for G0.170.64
LSD (D × G)0.301.12
D = drought; G = genotype; WW = well–watered; MD = mild drought; SD = severe drought. Means not sharing the same letters differ significantly at p ≤ 0.01.
Table 7. Effect of different drought levels on biological yield per plant of wheat genotypes.
Genotypes (G)Biological Yield (g Plant−1)
WWMDSDMeans (G)
Ujala-201613.9 c–j12.4 d–m11.8 h–m12.7 CD
Gold-201617.6 ab15.3 bc11.5 i–m14.8 AB
Johar-201618.8 a13.1 c–m12.2 e–m14.7 AB
Galaxy-201318.0 a14.3 c–h14.0 c–i15.4 A
Ehsan-201315.3 bc14.8 cd11.6 i–m13.9 BC
Fath-e-Jang13.4 c–m12.8 c–m11.3 k–m12.5 CD
Saher-200613.6 c–k12.4 d–m12.2 e–m12.7 CD
Gandum-114.4 c–g12.9 c–m12.0 f–m13.1 CD
Punjab-201114.7 c–e12.4 d–m12.2 e–m13.1 CD
AAS-201113.6 c–l11.9 g–m11.4 j–m12.3 D
AS-200213.5 c–m12.8 c–m11.0 m12.4 CD
FSD-200814.8 cd12.7 d–m11.5 i–m13.0 CD
Lasani-200814.9 cd14.5 c–f12.2 e–m13.8 BC
Shafaq-200613.6 c–k11.8 h–m11.0 lm12.2 D
Means drought (D)14.9 A13.0 B12.0 C
LSD (p ≤ 0.01) for drought (D)51.8
LSD for G0.68
LSD (D × G)2.5
D = drought; G = genotype; WW = well–watered; MD = mild drought; SD = severe drought. Means not sharing the same letters differ significantly at p ≤ 0.01.
Table 8. Correlation between the physiological, gas exchange, and yield-related traits under well-watered conditions.
RWCChlPHFTSLSkSWGPSHGWGYBPnGs
Chl0.645 *
PH0.3640.767 **
FT0.535 *0.710 **0.553 *
SL0.3320.3610.510.276
Sk0.3730.3510.652 *0.2960.402
SW0.619 *0.4790.4490.584 *0.1830.529
GPS0.2360.3780.3120.4160.4760.2440.208
HGW0.557 *0.714 **0.645 *0.557 *0.614 *0.5250.480.484
GY0.625 *0.671 **0.565 *0.902 **0.2710.4430.875 **0.3360.568 *
B0.558 *0.616 *0.4660.894 **0.2360.3320.824 **0.2060.4350.977 **
Pn0.627 *0.539 *0.4840.603 *0.0610.30.673 **0.1170.4340.715 **0.675 **
Gs0.625 *0.668 **0.599 *0.563 *0.2060.2440.718 **0.0750.4620.715 **0.667 **0.813 **
E0.614 *0.579 *0.563 *0.632 *0.1330.2810.727 **0.0780.4430.760 **0.722 **0.896 **0.863 **
RWC = relative water contents; Chl = SPAD-chlrophyll; PH = Plant height; FT = Fertile tillers; SL = Spike length; Sk = Spikelet per spike; SW = Spike weight; GPS = Grains per spike; HGW = Hundred grain weight; GY = Grain yield; BY = Biological yield; Pn = Net Photosynthesis; Gs = Stomatal conductance; E = Transpiration rate. * significant; ** highly sig-nificant.
Table 9. Correlation between the physiological, gas exchange, and yield-related traits under mild stress conditions.
RWCChlPHFTSLSkSWGPSGWGYBYPnGs
Chl0.504
PH0.40.231
FT0.3470.0.2110.258
SL0.563 *0.3290.930 **0.764 **
Sk0.599 *0.588 *0.633 *0.3070.599 *
SW0.5270.3910.580 *0.4720.5250.706 **
GPS0.3340.2010.2110.2130.1830.3290.488
GW0.676 **0.3590.2580.3760.340.4890.656 *0.167
GY0.692 **0.4930.5280.330.540 *0.845 **0.709 **0.589 *0.661 **
B0.3760.5280.976 **0.865 **0.935 **0.542 *0.555 *0.210.2790.493
Pn0.875 **0.542 *0.4660.2580.5270.794 **0.639 *0.591 *0.4150.5290.376
Gs0.601 *0.540 *0.607 *0.3760.664 **0.610 *0.743 **0.4150.5240.5270.5290.632 *
E0.589 *0.1320.4030.2010.5290.5120.670 **0.4620.601 *0.4030.4360.669 **0.900 **
RWC = relative water contents; Chl = SPAD-chlrophyll; PH = Plant height; FT = Fertile tillers; SL = Spike length; Sk = Spikelet per spike; SW = Spike weight; GPS = Grains per spike; HGW = Hundred grain weight; GY = Grain yield; BY = Biological yield; Pn = Net Photosynthesis; Gs = Stomatal conductance; E = Transpiration rate. * significant; ** highly sig-nificant.
Table 10. Correlation between the physiological, gas exchange, and yield-related traits under severe drought conditions.
RWCChlPHFTSLSkSWGPSGWGYBPnGs
Chl0.774 **
PH0.670 **0.869 **
FT0.788 **0.845 **0.213
SL0.557 *0.3590.544 *0.485
Sk0.757 **0.728 **0.637 *0.574 *0.593 *
SW0.4050.130.3870.3050.3490.158
GPS0.4740.5190.554 *0.623 *0.5290.4220.555 *
GW0.786 **0.710 **0.554 *0.621 *0.4690.879 **0.2350.462
GY0.800 **0.748 **0.697 **0.941 **0.542 *0.538 *0.602 *0.730 **0.619 *
B0.614 *0.550 *0.703 **0.787 **0.625 *0.2560.4510.593 *0.3730.833 **
Pn0.536 *0.769 **0.737 **0.749 **0.3870.490.2130.3870.410.697 **0.633 *
Gs0.587 *0.633 *0.4050.681 **0.4640.4650.330.4640.490.684 **0.542 *0.743 **
E0.589 *0.681 **0.3910.639 *0.4510.564 *0.2070.2850.4690.602 *0.554 *0.714 **0.905 **
RWC = relative water contents; Chl = SPAD-chlrophyll; PH = Plant height; FT = Fertile tillers; SL = Spike length; Sk = Spikelet per spike; SW = Spike weight; GPS = Grains per spike; HGW = Hundred grain weight; GY = Grain yield; BY = Biological yield; Pn = Net Photosynthesis; Gs = Stomatal conductance; E = Transpiration rate. * significant; ** highly sig-nificant.
Publisher’s Note: MDPI stays neutral with regard to jurisdictional claims in published maps and institutional affiliations.

