Article

Correlation Analysis of Compounds in Essential Oil of Amomum tsaoko Seed and Fruit Morphological Characteristics, Geographical Conditions, Locality of Growth

1
Faculty of Chinese Pharmacy, Yunnan University of Traditional Chinese Medicine (TCM), No. 1076 Yuhua Road, Chenggong District, Kunming 650500, China
2
Human Phenome Institute, Fudan University, No.825 Zhangheng Road, Pudong New District, Shanghai 201203, China
3
CAS Key Laboratory of Magnetic Resonance in Biological Systems, State Key Laboratory of Magnetic Resonance and Atomic and Molecular Physics, National Centre for Magnetic Resonance in Wuhan, Wuhan Institute of Physics and Mathematics, Innovation Academy for Precision Measurement Science and Technology, Chinese Academy of Sciences, West No.30, Xiaohongshan, Wuchang District, Wuhan 430071, China
*
Authors to whom correspondence should be addressed.
These authors have contributed equally to this work.
Agronomy 2021, 11(4), 744; https://doi.org/10.3390/agronomy11040744
Submission received: 24 March 2021 / Revised: 8 April 2021 / Accepted: 9 April 2021 / Published: 12 April 2021

Abstract

:
Amomum tsaoko is a perennial herb belonging to Zingiberaceae. Its dried ripe fruit is an important food additive, spice and materia medicai in Southeast Asia. For hundreds of years of cultivation, morphological variations have existed. The essential oil is one of the major active products of the A. tsaoko fruit and seed. In this study, we collected 12 populations in Yunnan province, and the correlation analysis of compounds was focused on the essential oil of A. tsaoko seed and its fruit morphological characteristics, geographical conditions, and locality of growth. The results showed that the difference in morphological characteristics between populations is greater than the difference within the population. High altitude areas are beneficial for biomass accumulation. Another interesting finding is that selecting specific functional or odor type materials could reference the morphologies of A. tsaoko fruit and seed. Furthermore, the qualitative and quantitative analysis of compounds in essential oil could be used to distinguish the producing area of the A. tsaoko fruit. These results are crucial in realizing the determination of botanical origin and evaluating the quality of A. tsaoko fruit. Meanwhile, it makes clear that various other studies on this plant deserve more attention.

1. Introduction

Amomum tsaoko Crevost et Lemaire is a perennial herb belonging to Zingiberaceae. Based on a novel multi-marker phylogenetic framework using matK and nrITS, new genera Lanxangia was described [1]. A. tsaoko got a new name Lanxangia tsaoko [1]. In this study, A. tsaoko still follow the Flora of China [2]. Its dried ripe fruit, commonly known as black cardamom, Tsaoko Fructus or Caoguo, is an important food additive and spice in Southeast Asia, including China, Korea, and Japan [3,4]. It is also a common materia medica in China. For a long time in history, it has been used for the interior obstruction of cold-dampness and distending pain in the epigastrium and abdomen, stuffiness and fullness, vomiting, malaria with cold and fever, and pestilence fever [5]. In recent years, A. tsaoko have been proved having anti-inflammatory effect against insects, antitumor effect in liver cancer cells, anti-angiogenesis efficacy in ovarian cancer, and inhibited sphingosine kinases 1 and 2 (SPHK1/2) [6,7]. The essential oil is one of the major active products of the black cardamom, mainly consisting of monoterpene hydrocarbons and oxygenated monoterpenes [8]. It has been proven to be related to a broad spectrum of bioactivities, such as antimicrobial, antibacterial, insecticidal, antioxidant activities, sedative, analgesic, and hypnotic effects [8,9,10,11,12].
Nowadays, the wild (or natural) population of A. tsaoko is extremely hard to find. However, it is easy to cultivate with little plant management required. The resource usage is mainly dependent on its cultivation. In China, it is randomly planted in the southeast of Yunnan province, mainly in the moist, broadleaved forests. In the last 200 years, to increase the consumption and gradual disappearance of the wild (or natural) population, the cultivated area has expanded [13]. Now, there is about 90% producing area of A. tsaoko in Yunnan province [14]. Typically, it could be harvested three years after planting and produce for about 20 years. As a result, A. tsaoko is a valuable economic plant in the mountainous regions of Yunnan province.
After years of cultivation, morphological variations have developed in the fruits and seeds of A. tsaoko. According to the length-width ratio and shape of the ends, the fruit types are defined as elliptic, cone-shaped, spindle-shaped, and spheroidal [15]. In different regions, the frequencies of distinct shapes are variable [15]. In China, people believe that larger or roundish ones have a more prominent smell, which may indicate good quality and higher price. However, there is no direct evidence to support this. There is little to no report on whether the odor or the ingredient of essential oils correlates with its geographical conditions. Furthermore, very little was known whether the essential oils were separated into different places and whether the characteristic components could discover the locality of growth.
For the analysis of the volatile compounds in the essential oil, spectroscopy provides powerful analytical methods. Gas chromatography-mass spectrometer/flame ionization detector (GC-MS/FID), nuclear magnetic resonance (NMR), near infrared (NIR), mid-infrared (MIR), ultraviolet-visible spectroscopy (UV-vis) and Raman spectroscopy have been applied on many complex matrices [16]. In this study, GC-MS was used to quantitate the volatile compounds in essential oil relatively. We then measured the morphological characteristics, collected geographical conditions, and investigated the composition and content differences in essential oils of black cardamom. The correlation analysis of compounds and morphological variables, geographical conditions, and locality of growth were carried out. The results could help select a cultivated land, or specific functional or odor type materials by referencing the morphologies of A. tsaoko fruit and seed, and the identification of A. tsaoko producing area.

2. Materials and Methods

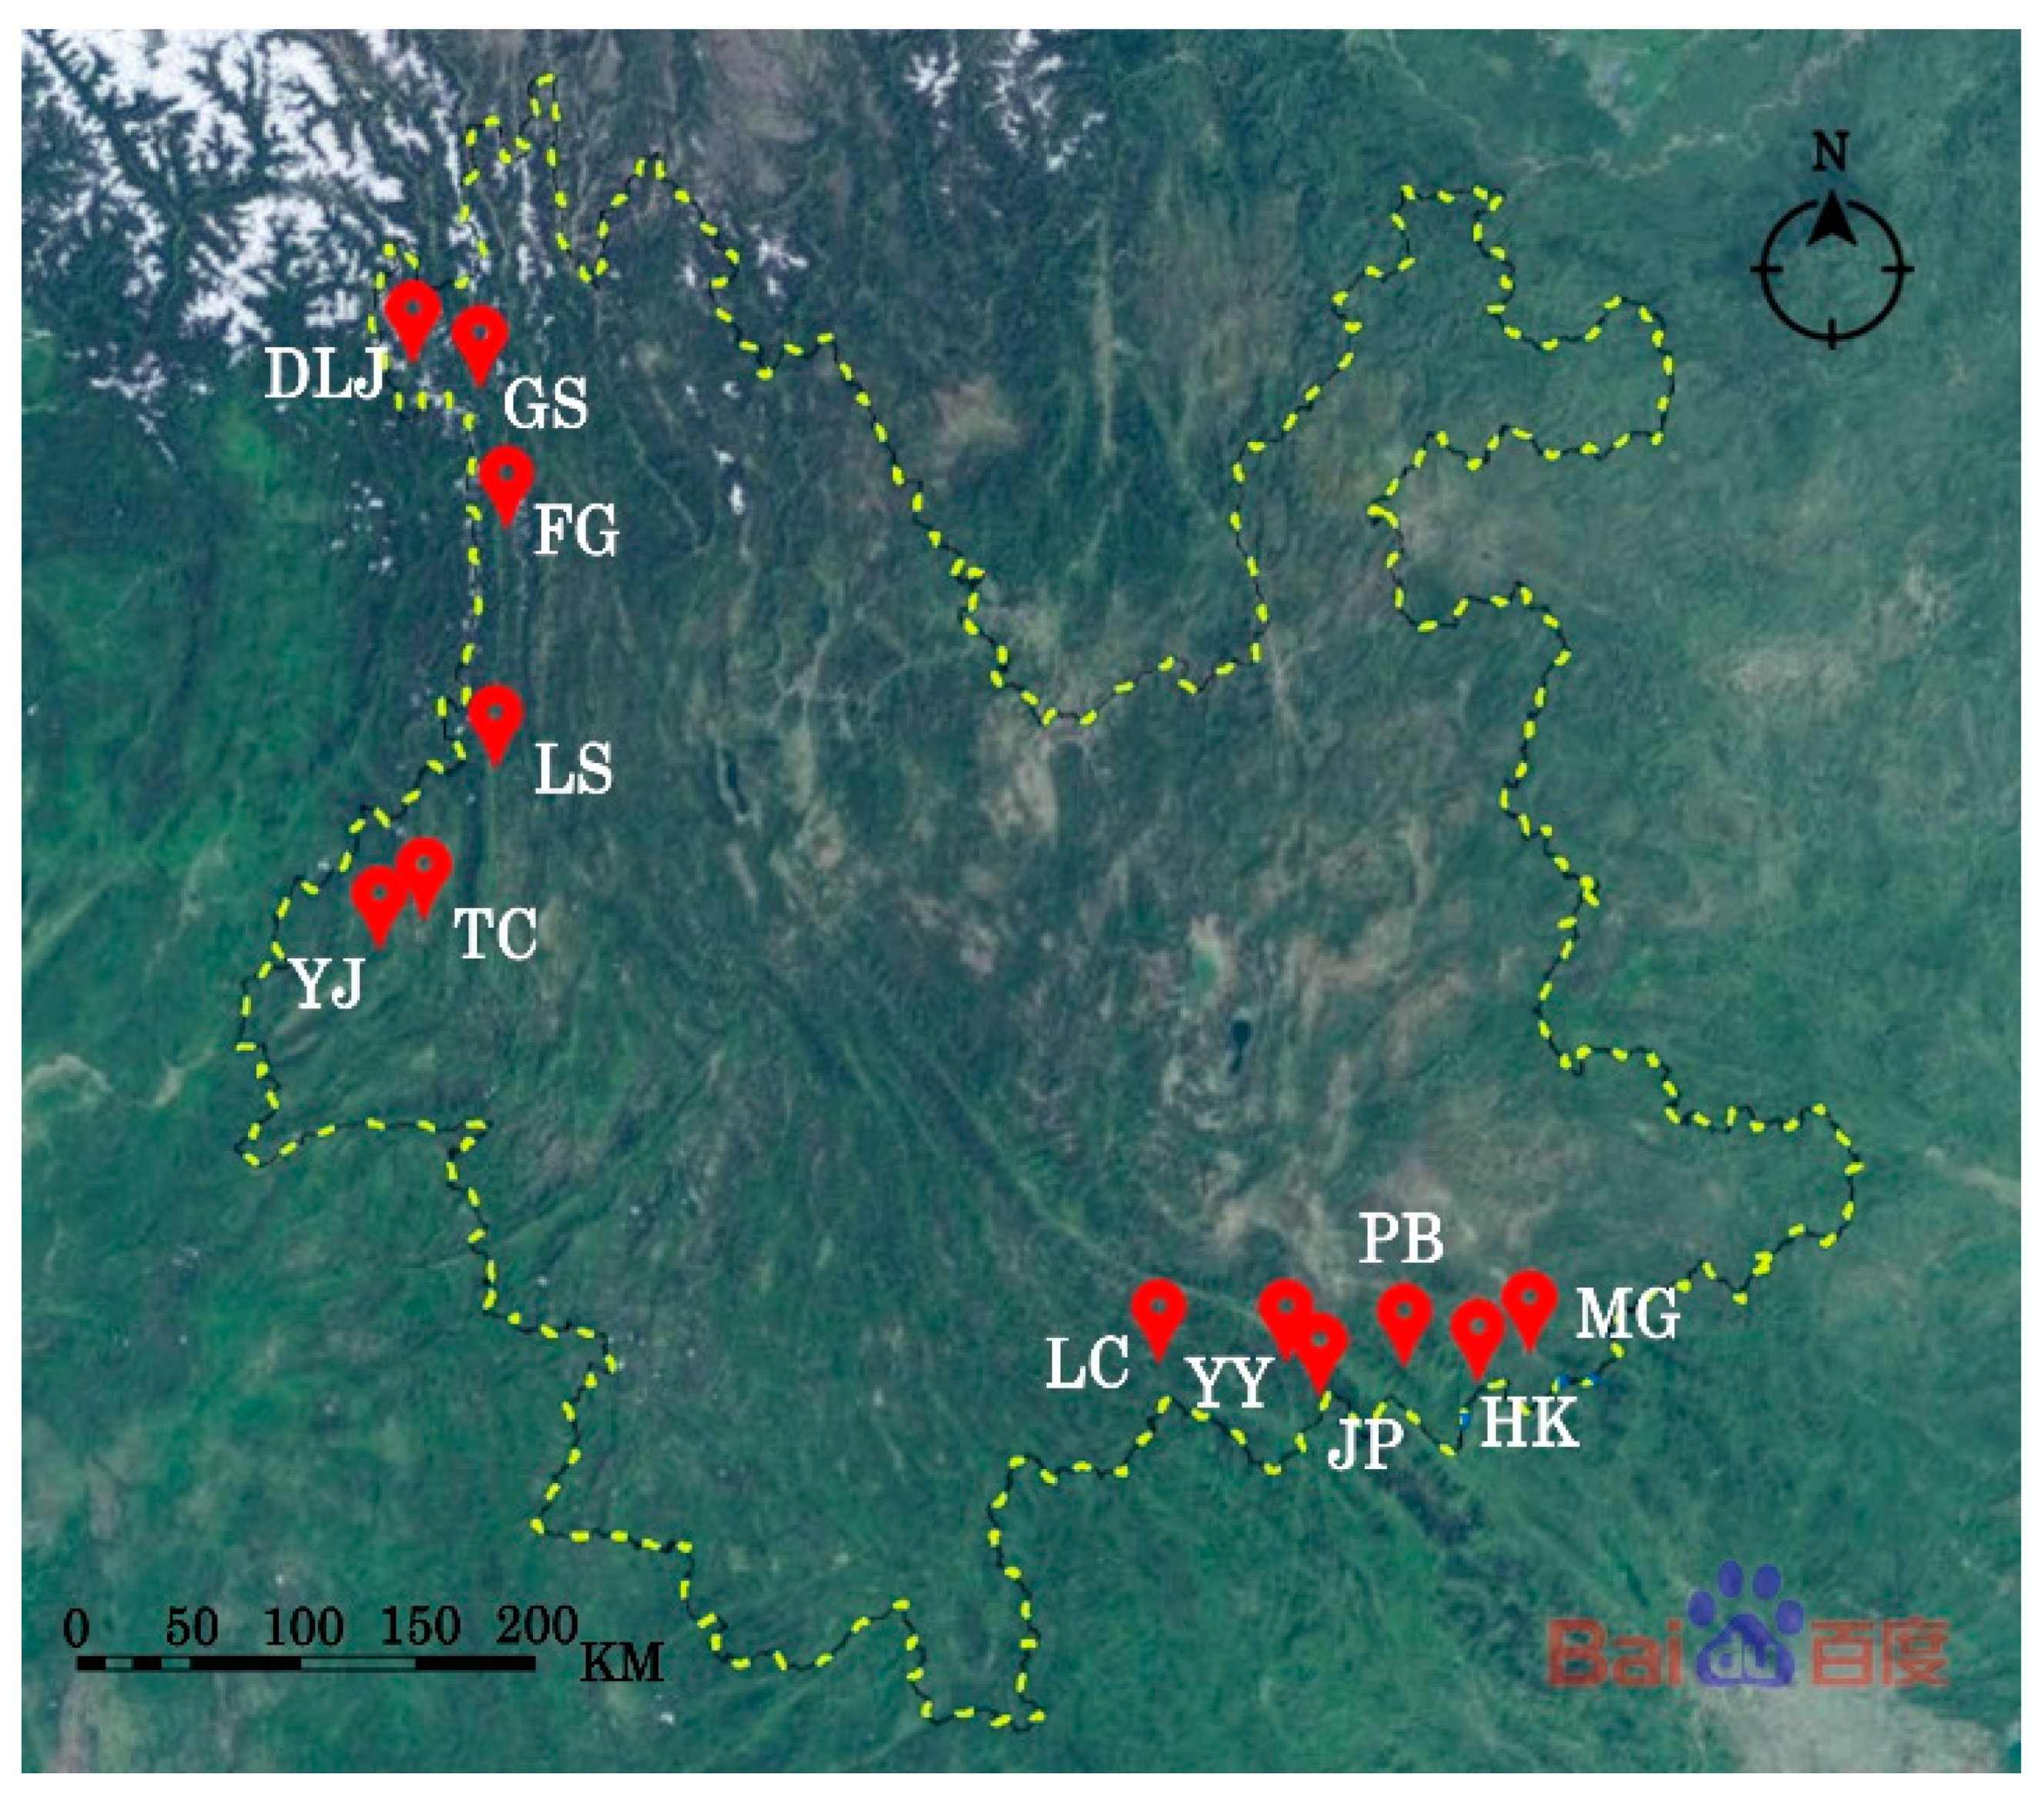
2.1. Plant Materials

A. tsaoko ripe fruits were collected from 12 populations at early ripeness in autumn of 2018, as shown in Table 1 and Figure 1. All the fruits were identified as A. tsaoko fruits by Yao-wen Yang, and all voucher specimens were deposited in the herbarium of the museum of the Yunnan University of Chinese Medicine.

2.2. Chemicals

All solvents and reagents were of analytical grades. n-Hexane (GC grade) was purchased from Merck KGaA, Germany. C7–C30 Saturated Alkanes were purchased from Sigma-Aldrich. He (99.999% purity) was provided by Shanghai Lvmin Gas Co., Ltd., Shanghai, China.

2.3. Measurements of Morphological Characteristics

A total of 30 fruits from each population were randomly chosen and their morphological characteristics were measured. Fruit length and width were measured using a slide caliper (accuracy 0.1 mm). An electronic scale (accuracy 0.01 g) was used to access data on fruit fresh weight, fruit dry weight, and 1000 seed weight.

2.4. Sample Preparation for GC-MS (SIM)

A. tsaoko fruits were dried using an electro-thermostatic blast oven (DHG-9140A, Gongyi Yuhua Instrument Co., Ltd., Gongyi, China) under 25 °C for 10 days, turned twice daily. Seeds were separated from the dried fruit. Seeds from the same plant were put together and ground using a portable high-speed pulverizer (DFT-200, Wenling Linda Machinery Co., Ltd., Wenling, China). The essential oil was extracted from the seeds powdered by hydrodistillation according to the essential oil extraction method I in the Chinese pharmacopoeia [5]. Each population prepared six parallel samples of essential oil.
The essential oil samples were diluted 100 times and filtered using a 0.22-μm PTFE Millipore filtration (Tianjin Jinteng experimental equipment Co., Ltd., Tianjin, China). After discarding the primary filtrate, the subsequent filtrate was collected into SureStop vials (C5000-2W, Thermo Fisher Scientific, Waltham, MA, USA) and stored at −80 ℃ until analysis. All samples were treated consistently.
A 200-μL of each sample was mixed to get the QC sample. The mixture was then placed into SureStop vials with inner tubes (200 μL each vial) (C4010-630, Thermo Fisher Scientific, Waltham, MA, USA).

2.5. GC-MS Analysis

The GC-MS analysis of the essential oil was carried out using an Agilent 9000 GC system coupled with an Agilent 5977B MSD. The sample was introduced into the instrument through split injection with a pressure of 25 psi. at 280 °C, and the injection volume was 1 μL. Compounds were separated along a HP-5MS capillary column (30 m × 0.25 mm × 0.25 μm film thickness). The optimized temperature program is shown in Supporting Table S1. GC-MS data was obtained from split ratios of 44:1 and 8:1. The carrier gas was helium at a flow rate of 1.0 mL/min.
MS detection was obtained in an electron impact mode at 70 eV. The temperature of the MS transfer line, quadrupole, and ion source were set at 280 °C, 150 °C, and 230 °C, respectively. The full scan m/z range was 15–300 Da.
In the sequence, the samples were run randomly, and one QC injection was added after every seven sample injections to ensure data stability.

2.6. Compound Identification and Quantification

Deconvolution was performed using the Agilent MassHunter Qualitative Analysis Workflows software (version B.08.00, Agilent Technologies, Inc., Santa Clara, CA, USA). Based on full scan mass spectral data and deconvolution results, the fragmentation patterns were compared with NIST17 (version 2.3.0.0, National institute of standards and technology (NIST) Gaithersburg, MD, USA) library. The identified compounds were further confirmed by comparing them with published literature. Retention indices were then taken as a reference to double-check the identification results.
The selected ion monitoring (SIM) mode was used to quantitate. One quantifier and at least two qualifiers for each of the target compounds were selected. The quantifiers were chosen based on the specificity and intensity of ions.

2.7. Statistical Analysis

All GC-MS (SIM) data were auto-integrated first and manually checked to ensure the right peak integration using the Agilent MassHunter Quantitative Analysis software (version B.09.00, Agilent Technologies, Inc., Santa Clara, CA, USA). The data was integrally normalized to the QC samples using the MetNormalizer package [17]. Univariate statistical analysis was performed using the Student’s t-test or Mann-Whitney U test where appropriate, and false discovery rates were used to control error propagation. The results were visualized by a volcano plot using the R ggplot2 and ggrepel package. For each population, the mean of compound contents in essential oil and morphology information were calculated, and the Spearman rank test was then performed to evaluate their correlation and visualized using the corrplot package. The R corrplot package used is the Visualisation of a Correlation Matrix (Version 0.84), which is available from https://github.com/taiyun/corrplot (accessed on 20 July 2020) [18]. Furthermore, the compound contents in essential oil and morphology correlation networks were constructed by the cytoscape software (v3.30) [19].
Data were treated with unit variance (UV) scaling before subjected to multivariate analyses. Principal component analysis (PCA) and orthogonal partial least squares discrimination analysis (OPLS-DA) were performed using the SIMCA software (12.0.0.0, Umetrics AB, Umea, Sweden). Several model parameters were evaluated to ensure model quality and avoid overfitting risks, such as the R2X, R2Y, Q2Y and the p-value of CV-ANOVA.

3. Results and Discussion

3.1. Morphological Characteristics

In this study, all four fruit types were detected in almost 12 populations. As shown in Table 2, the mean value of length, width, and length-width ratios were 3.29–3.73 cm, 2.47–3.13 cm, and 1.20–1.38, respectively. The relative standard deviations (RSDs) were relatively higher within the population. The number of seeds in one fruit showed a high variation with RSDs greater than 30%. However, the RSD of 1000 seeds’ weight was no more than 4%. That means the seeds’ weight was more consistent within the population, but not among the populations. Similarly, although the fresh and dry weight of fruit had relatively higher RSDs, the RSDs of dehydration rate were lesser than 6%. The oil yield of seeds from the same population were 2.93–3.99%, but the average RSD was an extremely low number (2.37%). The results suggest that the difference between populations is greater than the difference within population. The location should be chosen for plantation.
Meanwhile, the result of correlation analysis of morphological variations and geographical conditions was shown in Figure 2. The breadth, fresh weight, dry weight, and 1000 seeds’ weight are positively correlated to altitude with p < 0.05. This result might indicate that high altitude localities is beneficial for accumulation of biomass of A. tsaoko fruits. This is consistent with previous reports of Stevia rebaudiana leaves [20]. However, the correlation between biomass and altitude is controversial [21]. Some studies have shown an inverse relationship. For example, the forage yield decreased significantly with the increasing altitude in Alpine Meadow of Sanjiangyuan, China [21]. More parameters, such as nutrient element in soil, are worth investigating [22].
Among these 12 populations, it is notable that the fruits from YY have the highest fruit weight, fruit size, and 1000 seeds’ weight, and the oil yield of seeds was 3.91%, which was also on the high side. This indicated that Yuanyang (YY) is suitable for the A. tsaoko fruit biomasses.

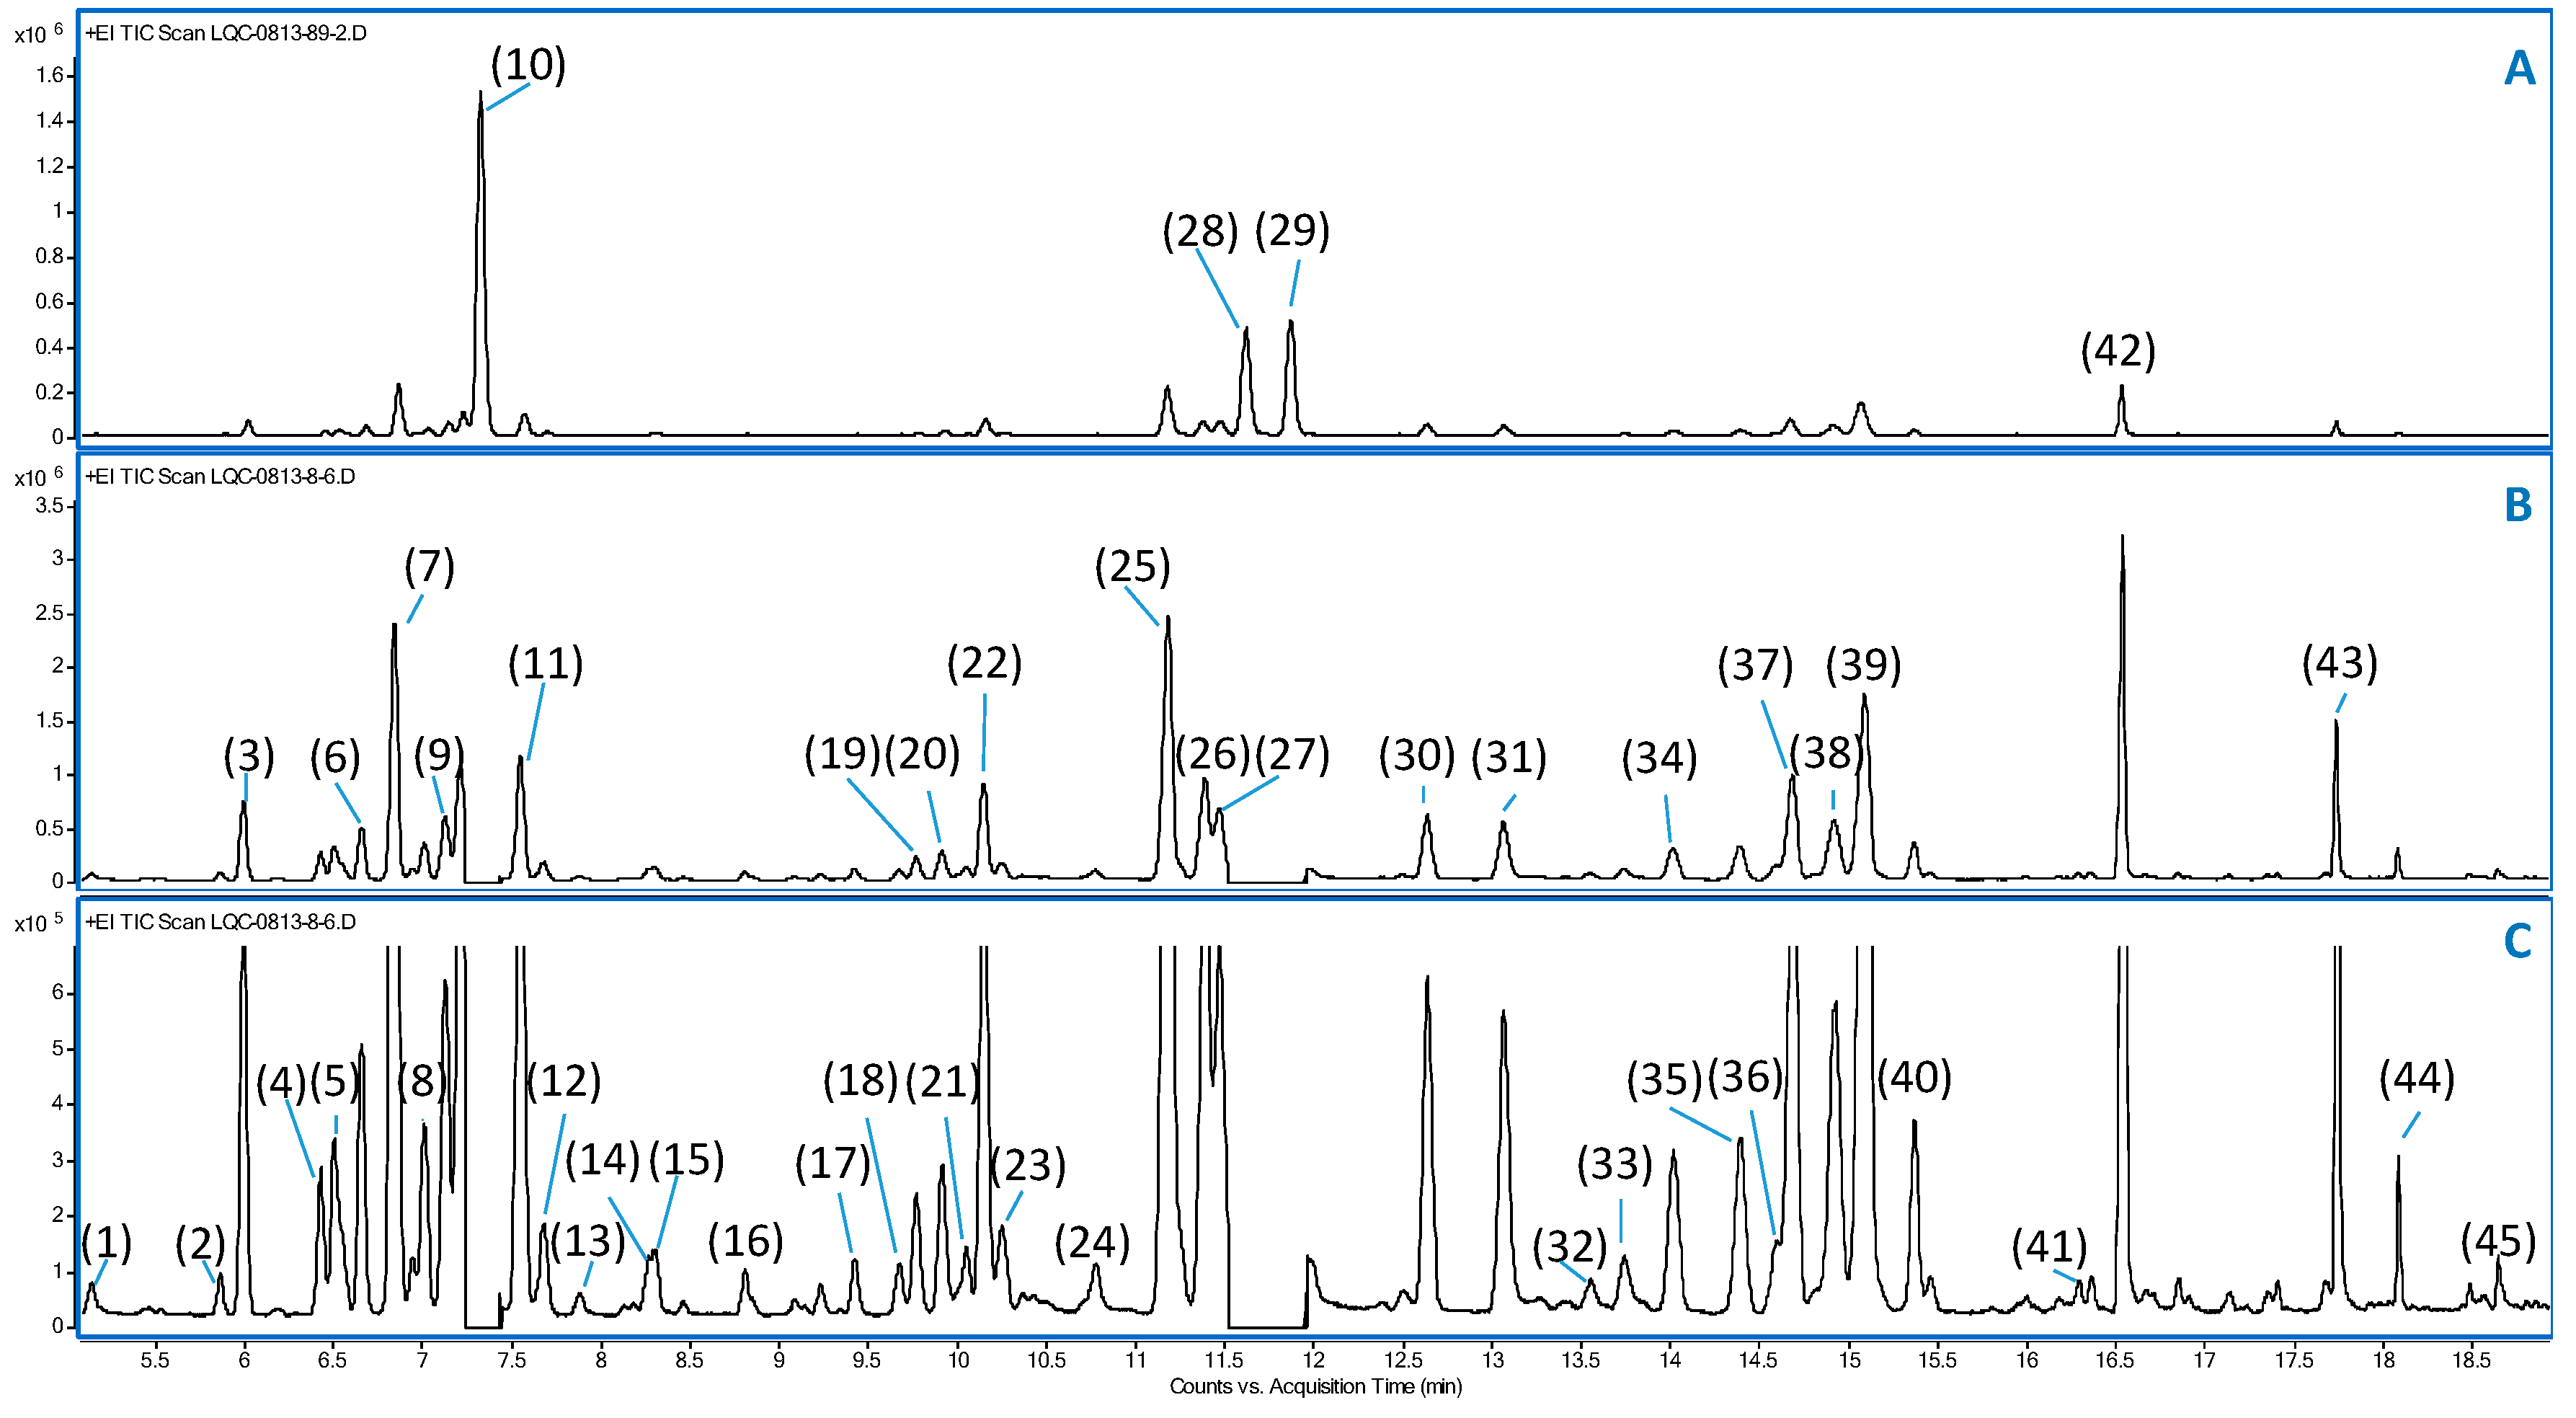
3.2. Compound Identification and Quantification

After the deconvolution, 45 peaks with signal-noise-ratio higher than ten under the split ratio 8:1 were chosen and identified. The GC-MS chromatogram with label peaks is shown in Figure 3. The identification results are shown in Table 3, including 10 monoterpene hydrocarbons, 12 oxygenated monoterpenes, eight indane derivatives, eight straight chain aldehyde, three esters, one oxygenated sesquiterpenes, and three unknowns. The compounds were identified mainly based on full scan mass spectral data, compared with the NIST17 (version 2.3.0.0, NIST, Gaithersburg, MD, USA) library. The compounds, 5-indanecarbaldehyde and six C10H12O, which are probably 2,3,3A,7A-tetrahydro-1H-indene-4(5)-carbaldehydes, could not be found in the NIST library and were identified by comparing them with the mass spectral data in previous studies [23,24].
GC-MS (SIM) data were acquired under the split ratio 44:1. The selected ions were shown in Supporting Table S2 and the underlined ions were quantifiers, while the other ions were qualifiers. All GC-MS (SIM) data were auto-integrated first, followed by manual checking. Peak 26, which had more than 20% missing data, was not used in further analyses. The data was integrally normalized to the QC samples, followed by a PCA analysis. The results were shown in Supporting Figures S1 and S2. Data RSDs decreased, and the QC samples were closely clustered, which indicated good stability of the method. One sample from YY and one from FG were regarded as an outlier and removed from further analyses because they were out of the 95% confidence interval.

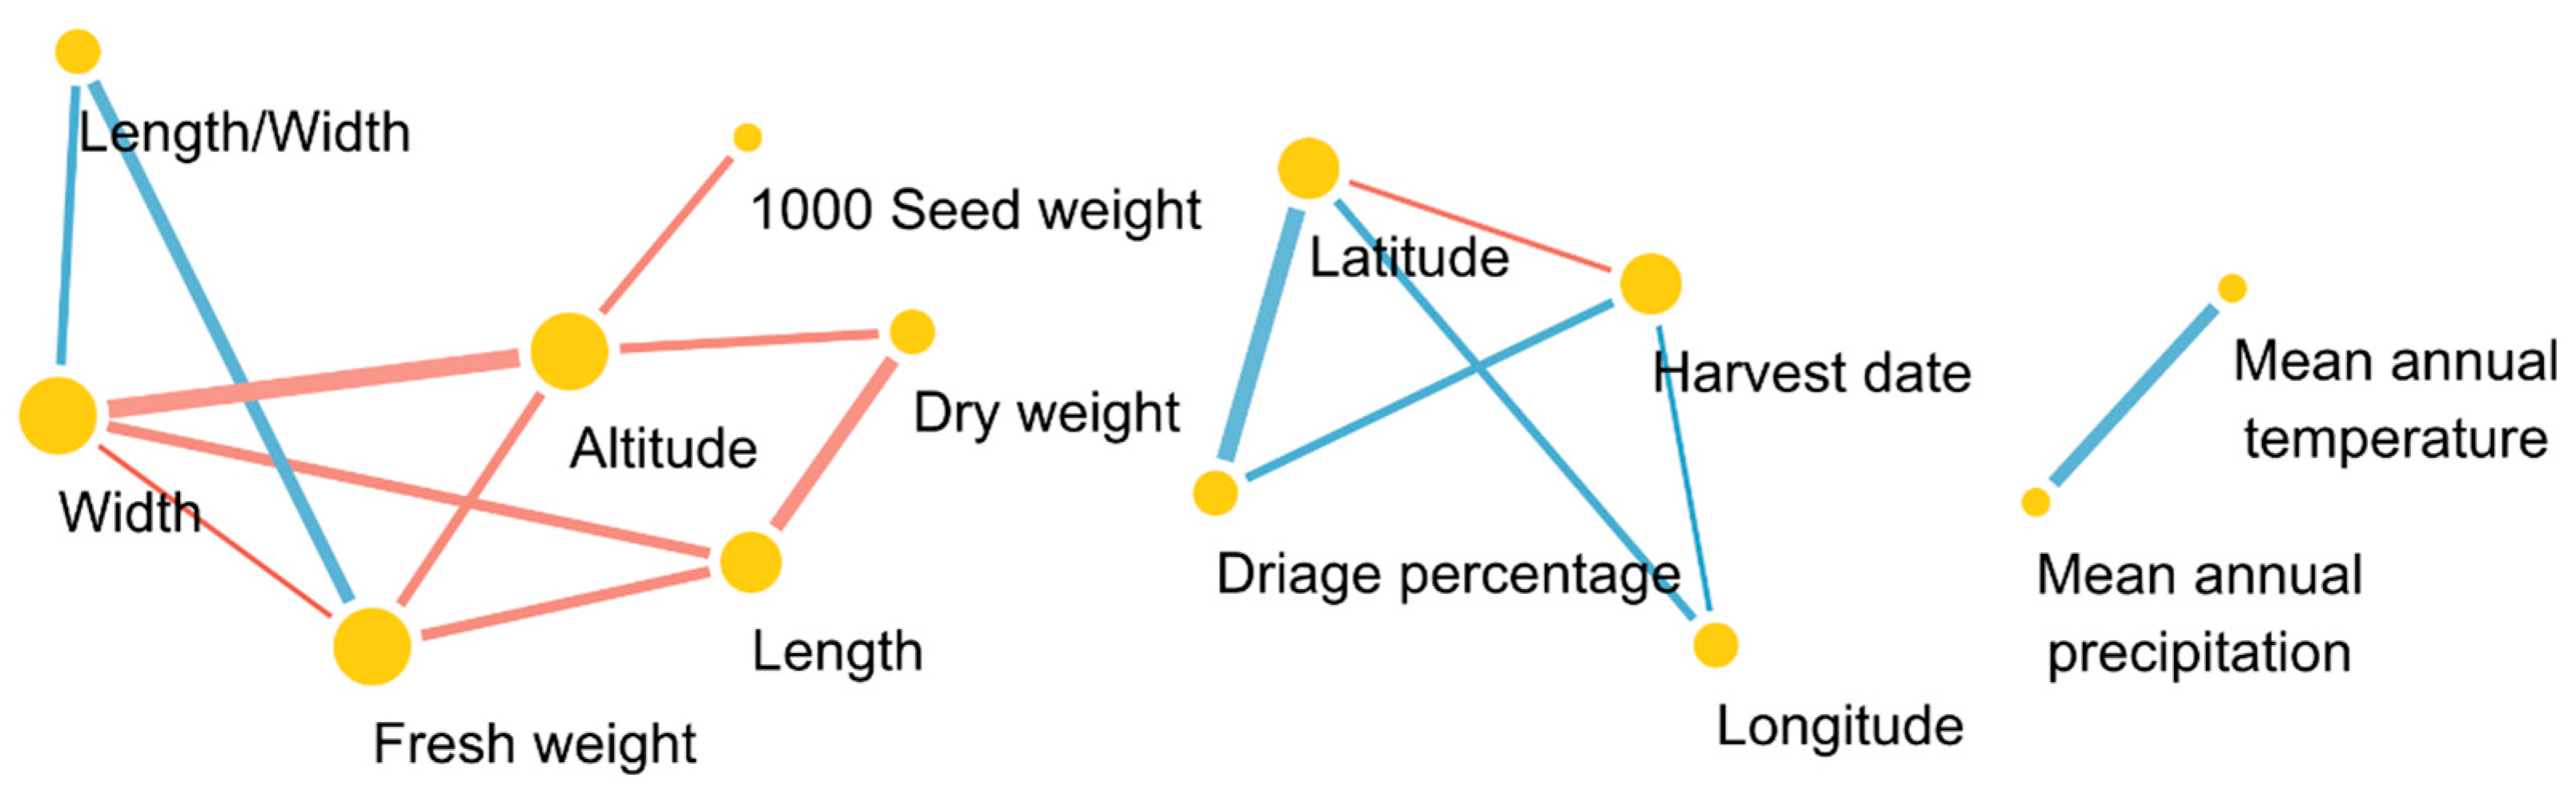
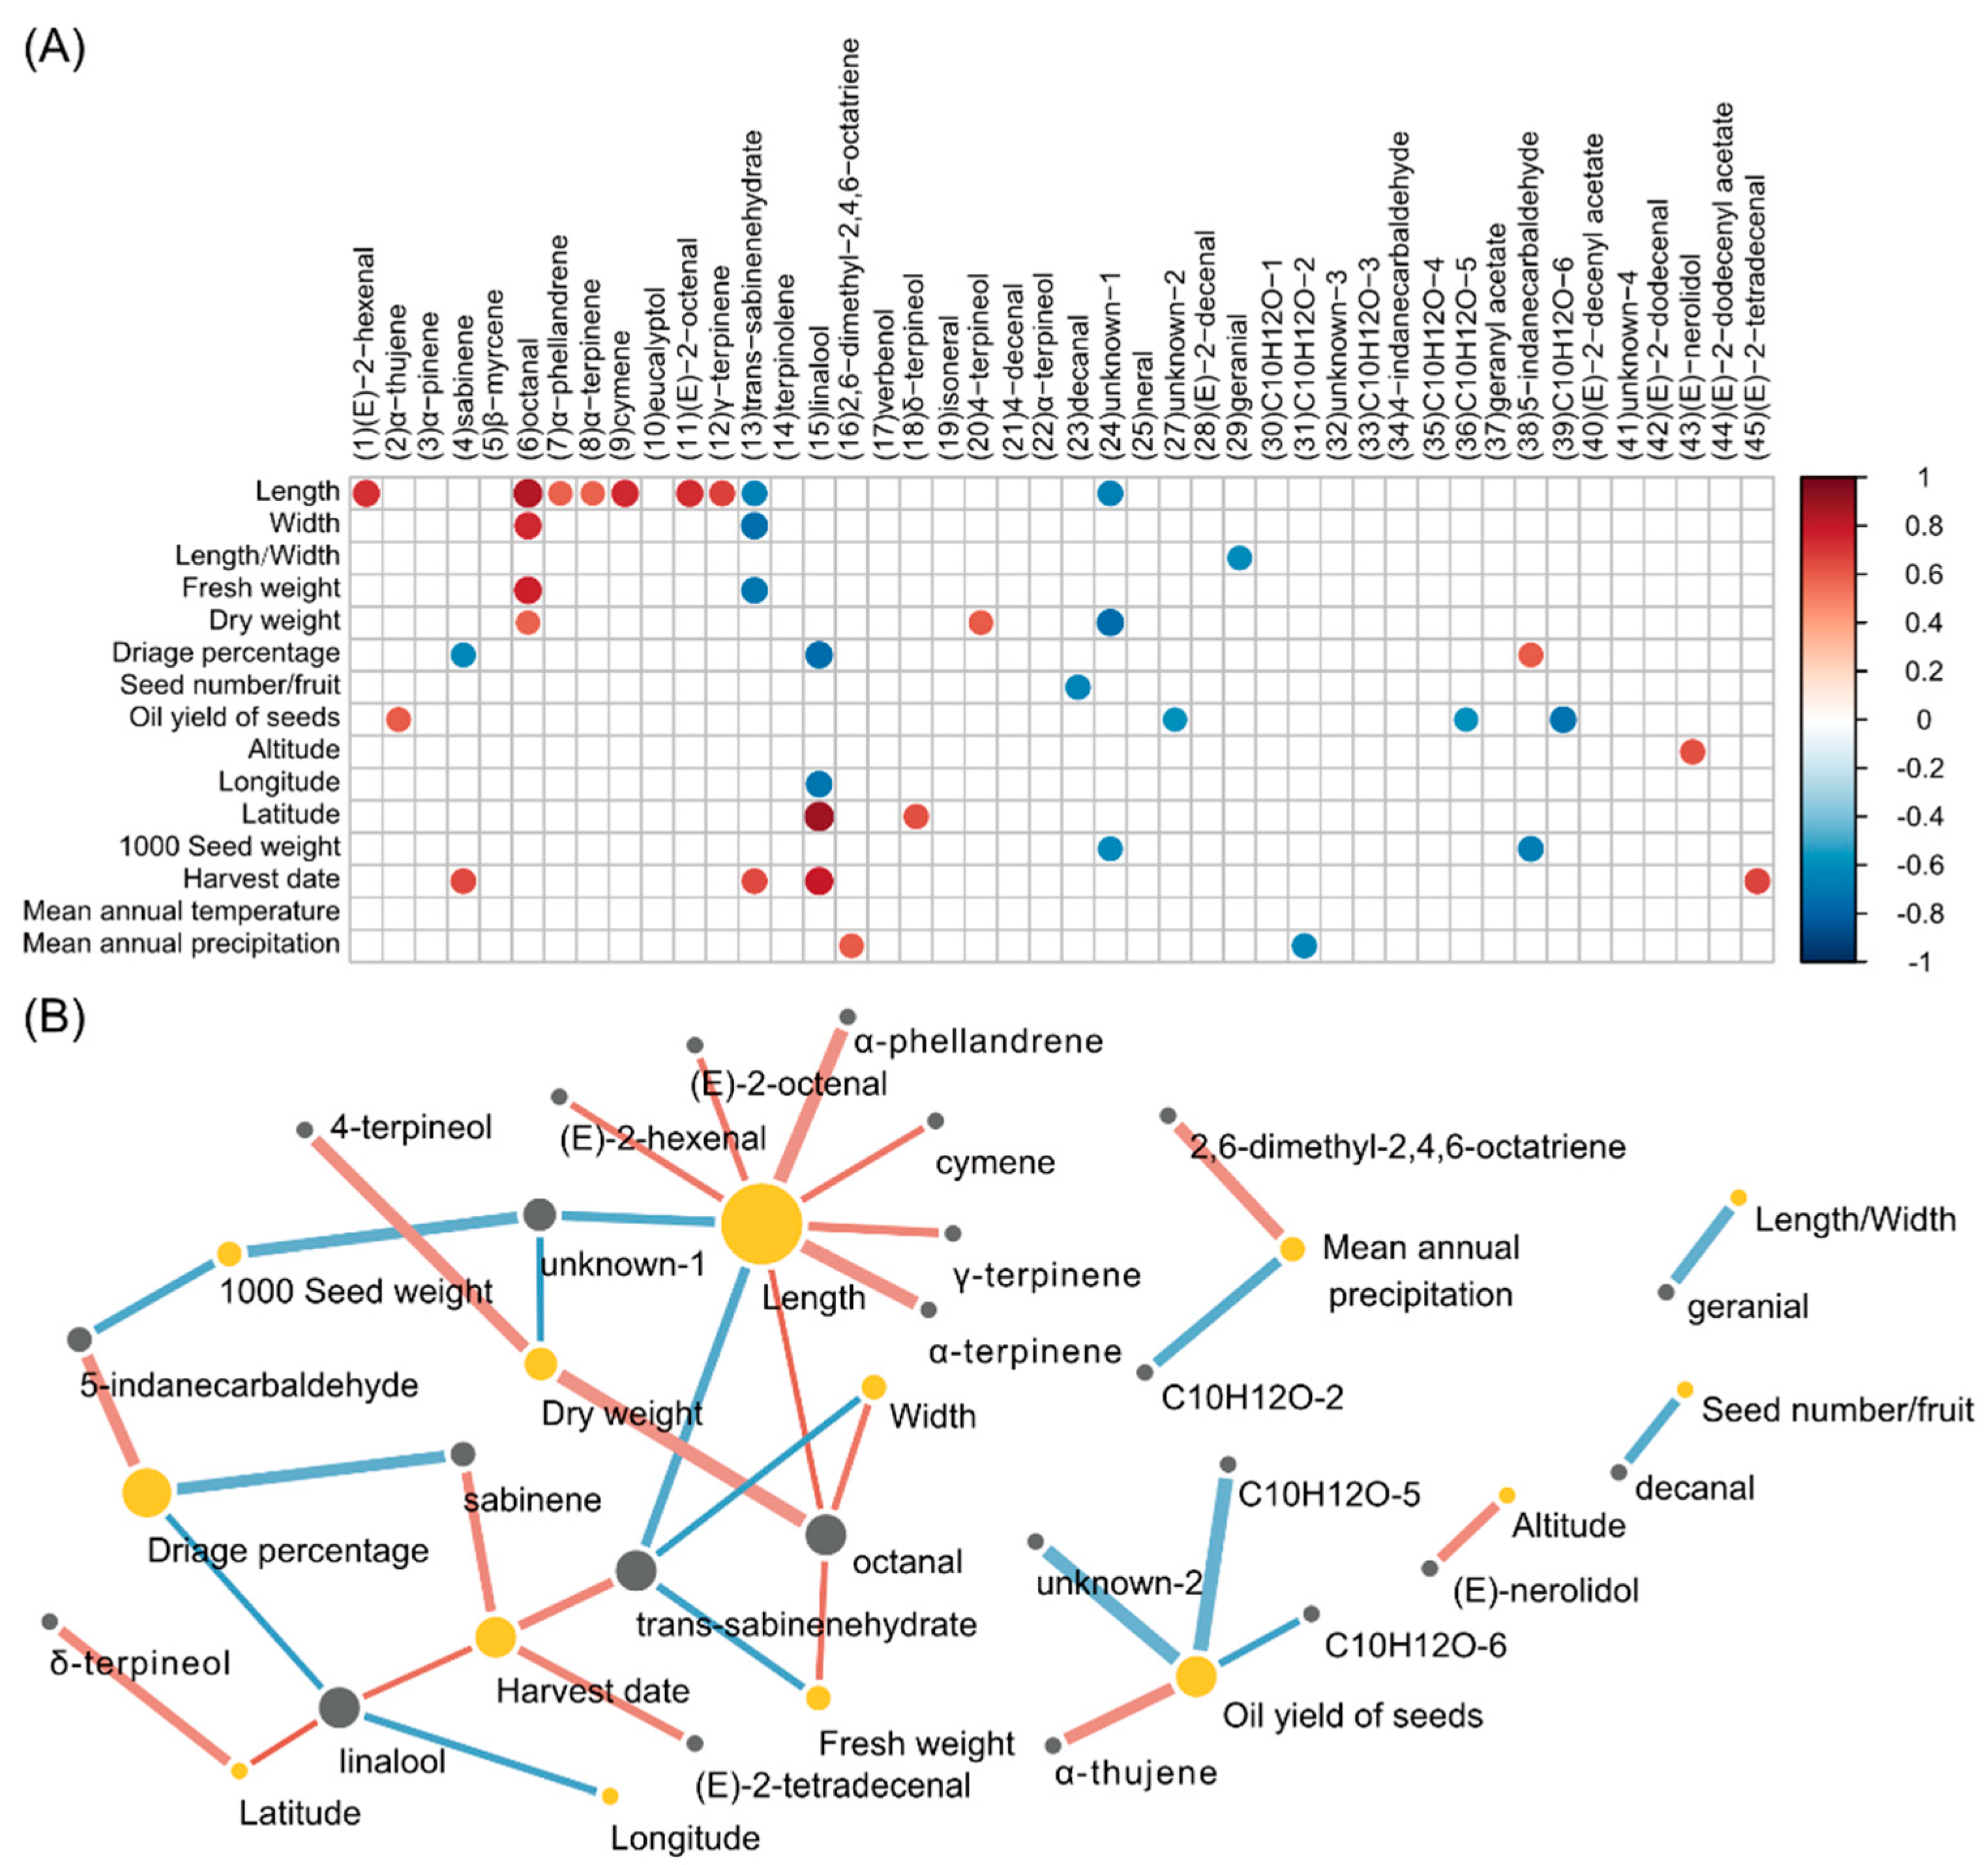
3.3. Correlation between Compounds and Morphological Characteristics, Geographical Conditions

The plant morphology is related to multiple factors. The two most important ones are genes and the environment. The composition and content of essential oils are also influenced by multiple factors, such as genotype, geographical conditions, harvest time, and drying methods [25,26,27,28]. In this study, the correlation analysis between morphological variables, geographical conditions, and compounds in essential oils have been carried out. The results were shown in Figure 4.
There were nine compounds related to fruit lengths. Seven of them, (E)-2-hexenal (1), octanal (6), α-phellandrene (7), α-terpinene (8), cymene (9), (E)-2-octenal (11), and γ-terpinene (12), are positive correlations, with p < 0.05. Trans-sabinenehydrate (13) and unknown-1 (24) are negatively correlated to length. It is notable that all of them, excluding trans-sabinenehydrate (13), can be used as a fragrance in the cosmetics and food industries for their aromas. For example, the octanal (6) is with a fruit-like odor, α-terpinene (8) has citrus and lemon-like aromas, and (E)-2-octenal (11), used in preparing chicken, has cucumber flavor. Homologous, octanal (6), and trans-sabinenehydrate (13) showed the same trend to the breadth and fresh weight with p < 0.05. The octanal (6) showed the same trend to dry weight. None of them had a correlation to length-width ratio and water content. These results suggest that the scent of the black cardamom is more relevant to its absolute size than its shape, and a longer length meant a stronger aroma. This is consistent with a folk belief that the larger black cardamom has a stronger smell. Furthermore, α-phellandrene (7) has anti-nociceptive and anti-inflammatory effects. The α-terpinene (8) has various biological activities, including acaricidal, antiprotozoal, and antioxidant properties. That means the longer one should be better for bioactivities.
The seeds’ number is negatively correlated to decanal (23). The 1000 seeds’ weight has the same trend to unknown-1 (24) and 5-indanecarbaldehyde (38). The decanal (23) is a flavoring agent. Moreover, the seeds’ number and 1000 seeds’ weight also contribute to the choice of the odor types.
The oil yield of seeds is an important characteristic to judge the commercial quality of black cardamom. This has a positive correlation to α-thujene (2) and a negative correlation to unknown-2 (27), C10H12O-5 (36), and C10H12O-6 (39), with p < 0.05. α-thujene (2), being the major compound (61.4–69.8%) in the essential oil of Boswellia serrata, has been proven to be responsible for enhanced antifungal and antioxidant activities [29]. For using these biological activities, the oil yield of seeds might be the reference value. Fruits collected from Jingping (JP) obtained the highest oil yield in these 12 locations, followed by Tengchong (TC) and Pingbian (PB), that is 4.17%, 4.08%, and 4.03%, respectively (Table 2).
The linalool (15) is used in perfumery. This is negatively correlated to the longitude and reverse trend to the latitude. Therefore, for the purpose of obtaining a high content of linalool (15), the northwest area in the Yunnan province is a better choice than the southeast area. δ-terpineol (18) is also positively correlated to the latitude. It is worth mentioning that the altitude has positive correlation to (E)-nerolidol (43), with p < 0.05. A recent report indicated the (E)-nerolidol (43) was a potent volatile signal involved in defense of Empoasca onukii and Colletotrichum fructicola in the tea plant. Early responses included the activation of a mitogen-activated protein kinase and WRKY, an H2O2 burst and the induction of jasmonic acid and abscisic acid signaling. High levels of defense-related chemicals accumulated, which possessed broad spectrum anti-herbivore or anti-pathogen properties, and ultimately triggered resistance [30]. In this study, the result suggested that the ripe fruits of A. tsaoko, which is collected in a higher altitude area, accumulated a higher level of (E)-nerolidol (43). However, more research is needed to approach the function in A. tsaoko.
The annual average precipitations are positively correlated to the 2,6-dimethyl-2,4,6-octatriene (16), which is a plant source volatile organic compound. It has been reported that growth of fungi Botrytis cinerea was significantly inhibited when the mycelia were exposed to an atmosphere containing 2,6-dimethyl-2,4,6-octatriene (16). When Phaseolus vulgaris is infected with Colletotrichum lindemuthianum, there is a response [31]. The fruits of A. tsaoko may be infected by different fungi in areas with different precipitations; this is worth more attention in the future.
In addition, the correlation between the harvest date and the compounds were analyzed. The fruit period of A. tsaoko is from August to December. When the fruit is ripe, its pericarp presents a reddish-brown color. The samples used in this study were harvested when the fruit turned reddish-brown. Sabinene (4), trans-sabinenehydrate (13), linalool (15), and (E)-2-tetradecenal (45) increased over time. Sabinene (4) and linalool (15) are perfumery, and (E)-2-tetradecenal (45) has a citrus odor. These suggest that the harvest date might affect the odor type of the black cardamom. Unfortunately, our harvest dates were concentrated in 4–5 August 2018 and 30 October to 7 November 2018. More research covering longer time periods to confirm this result is needed.

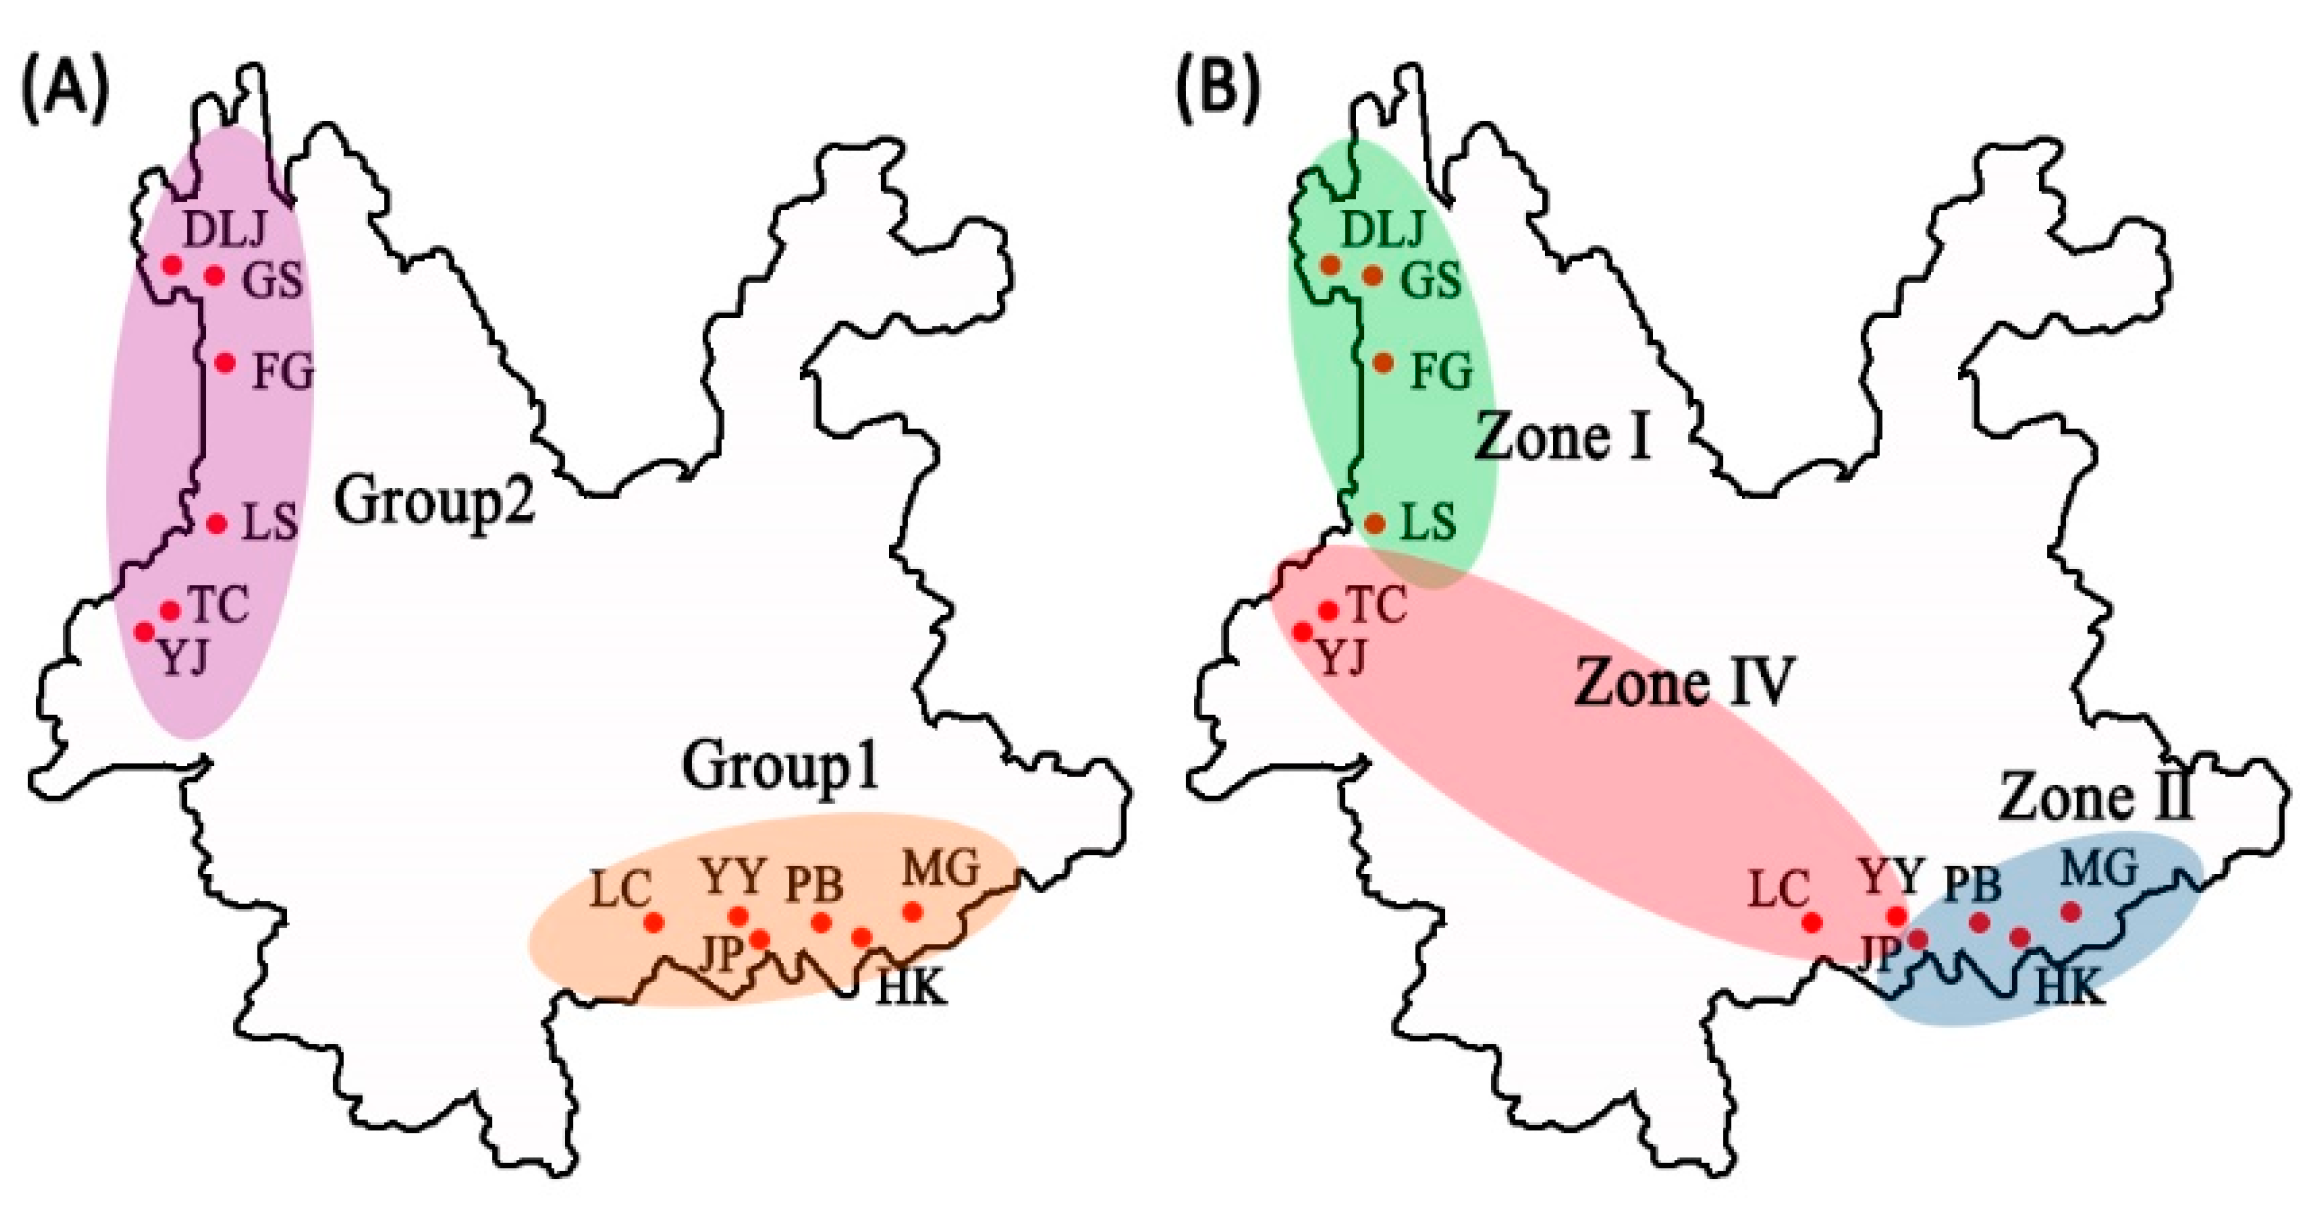
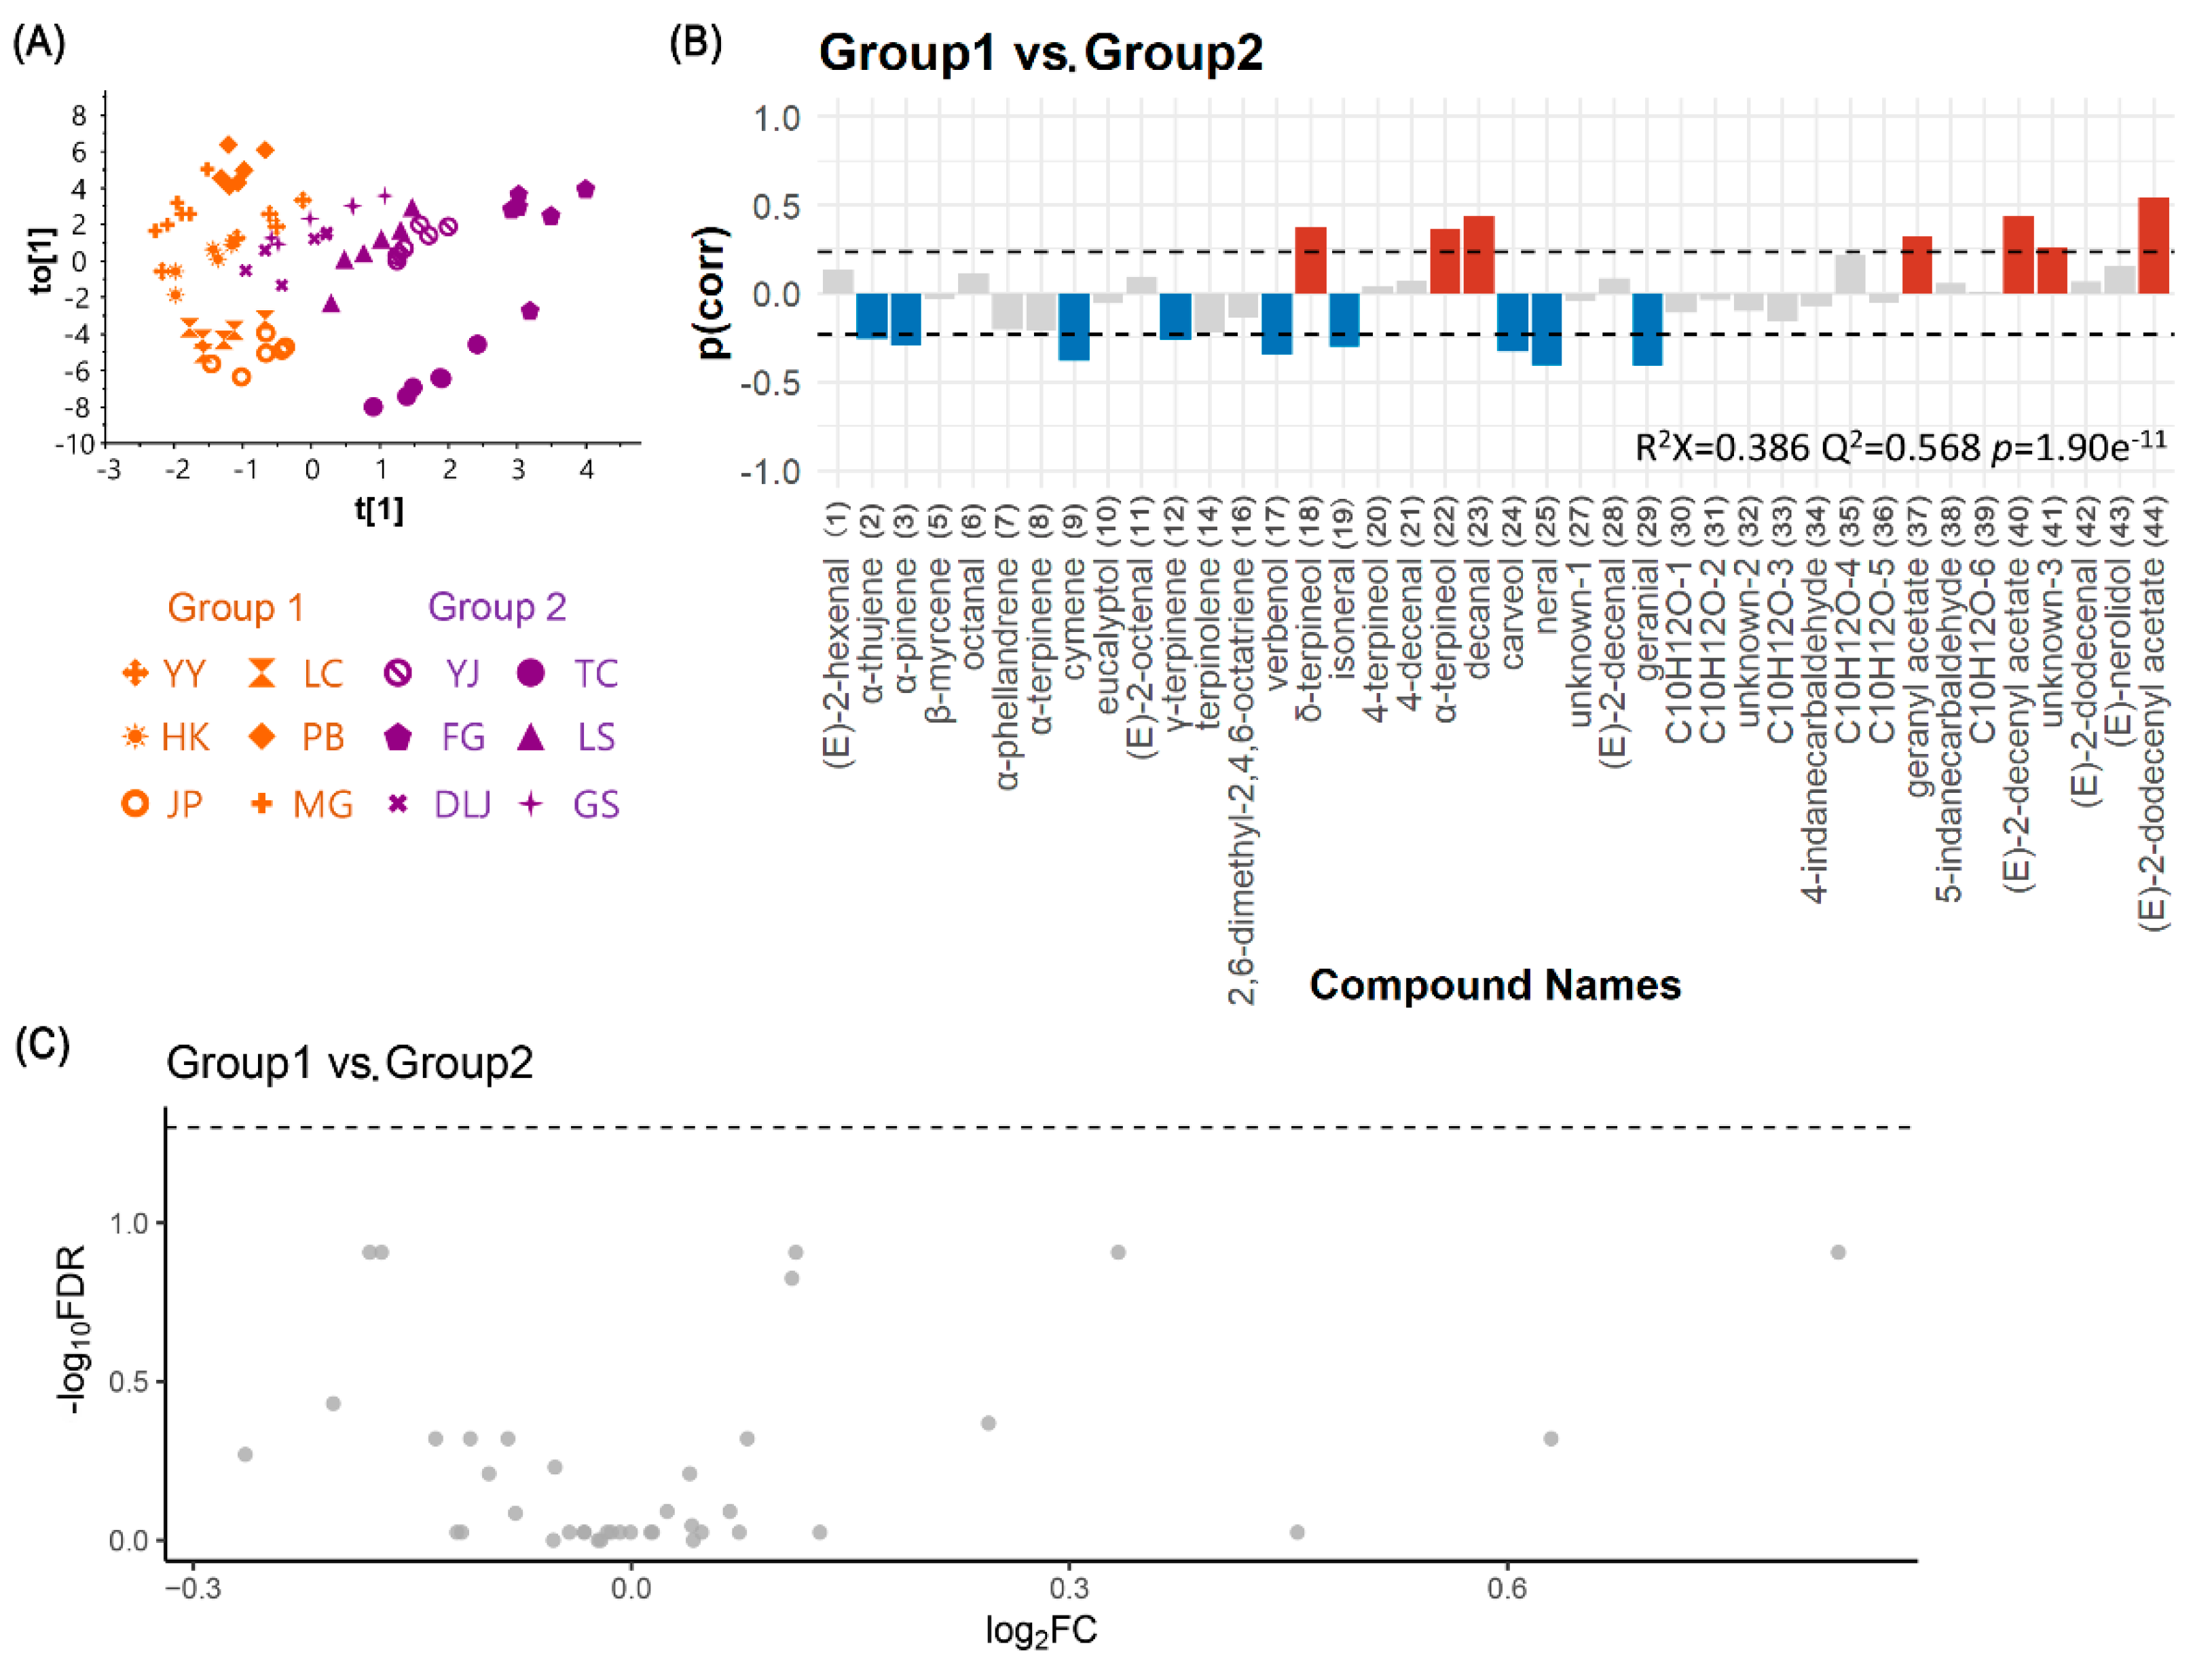
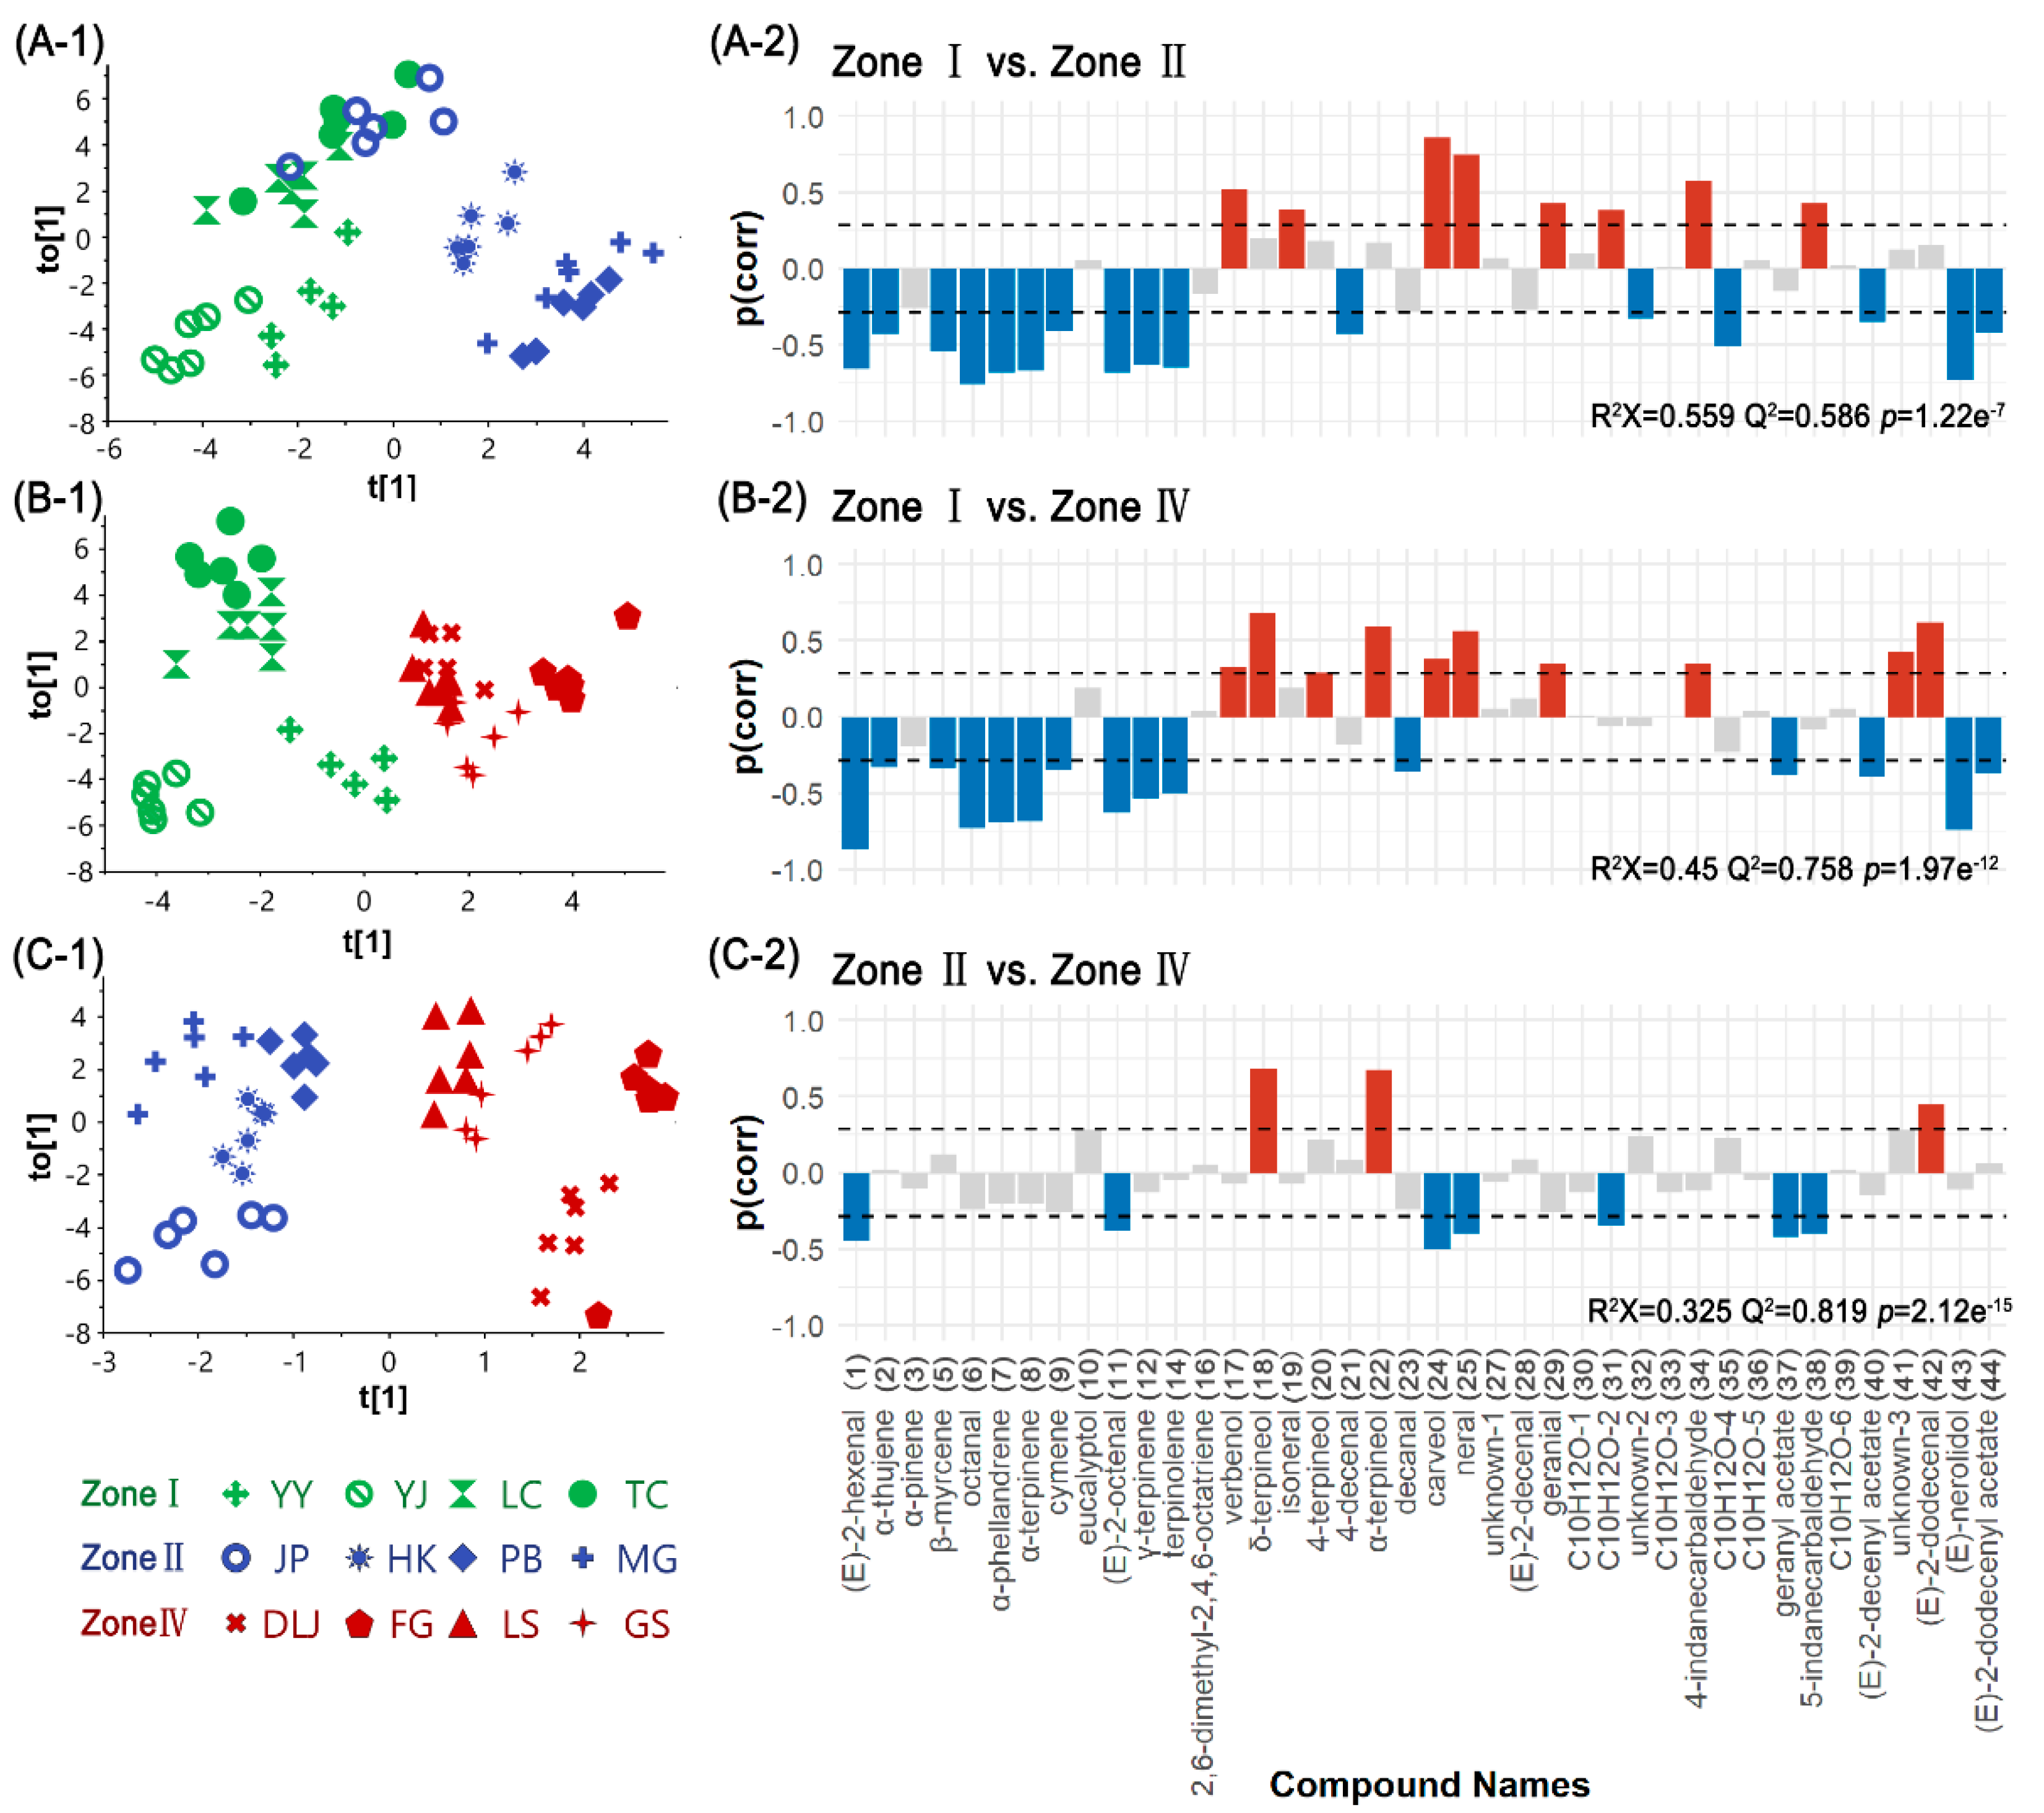
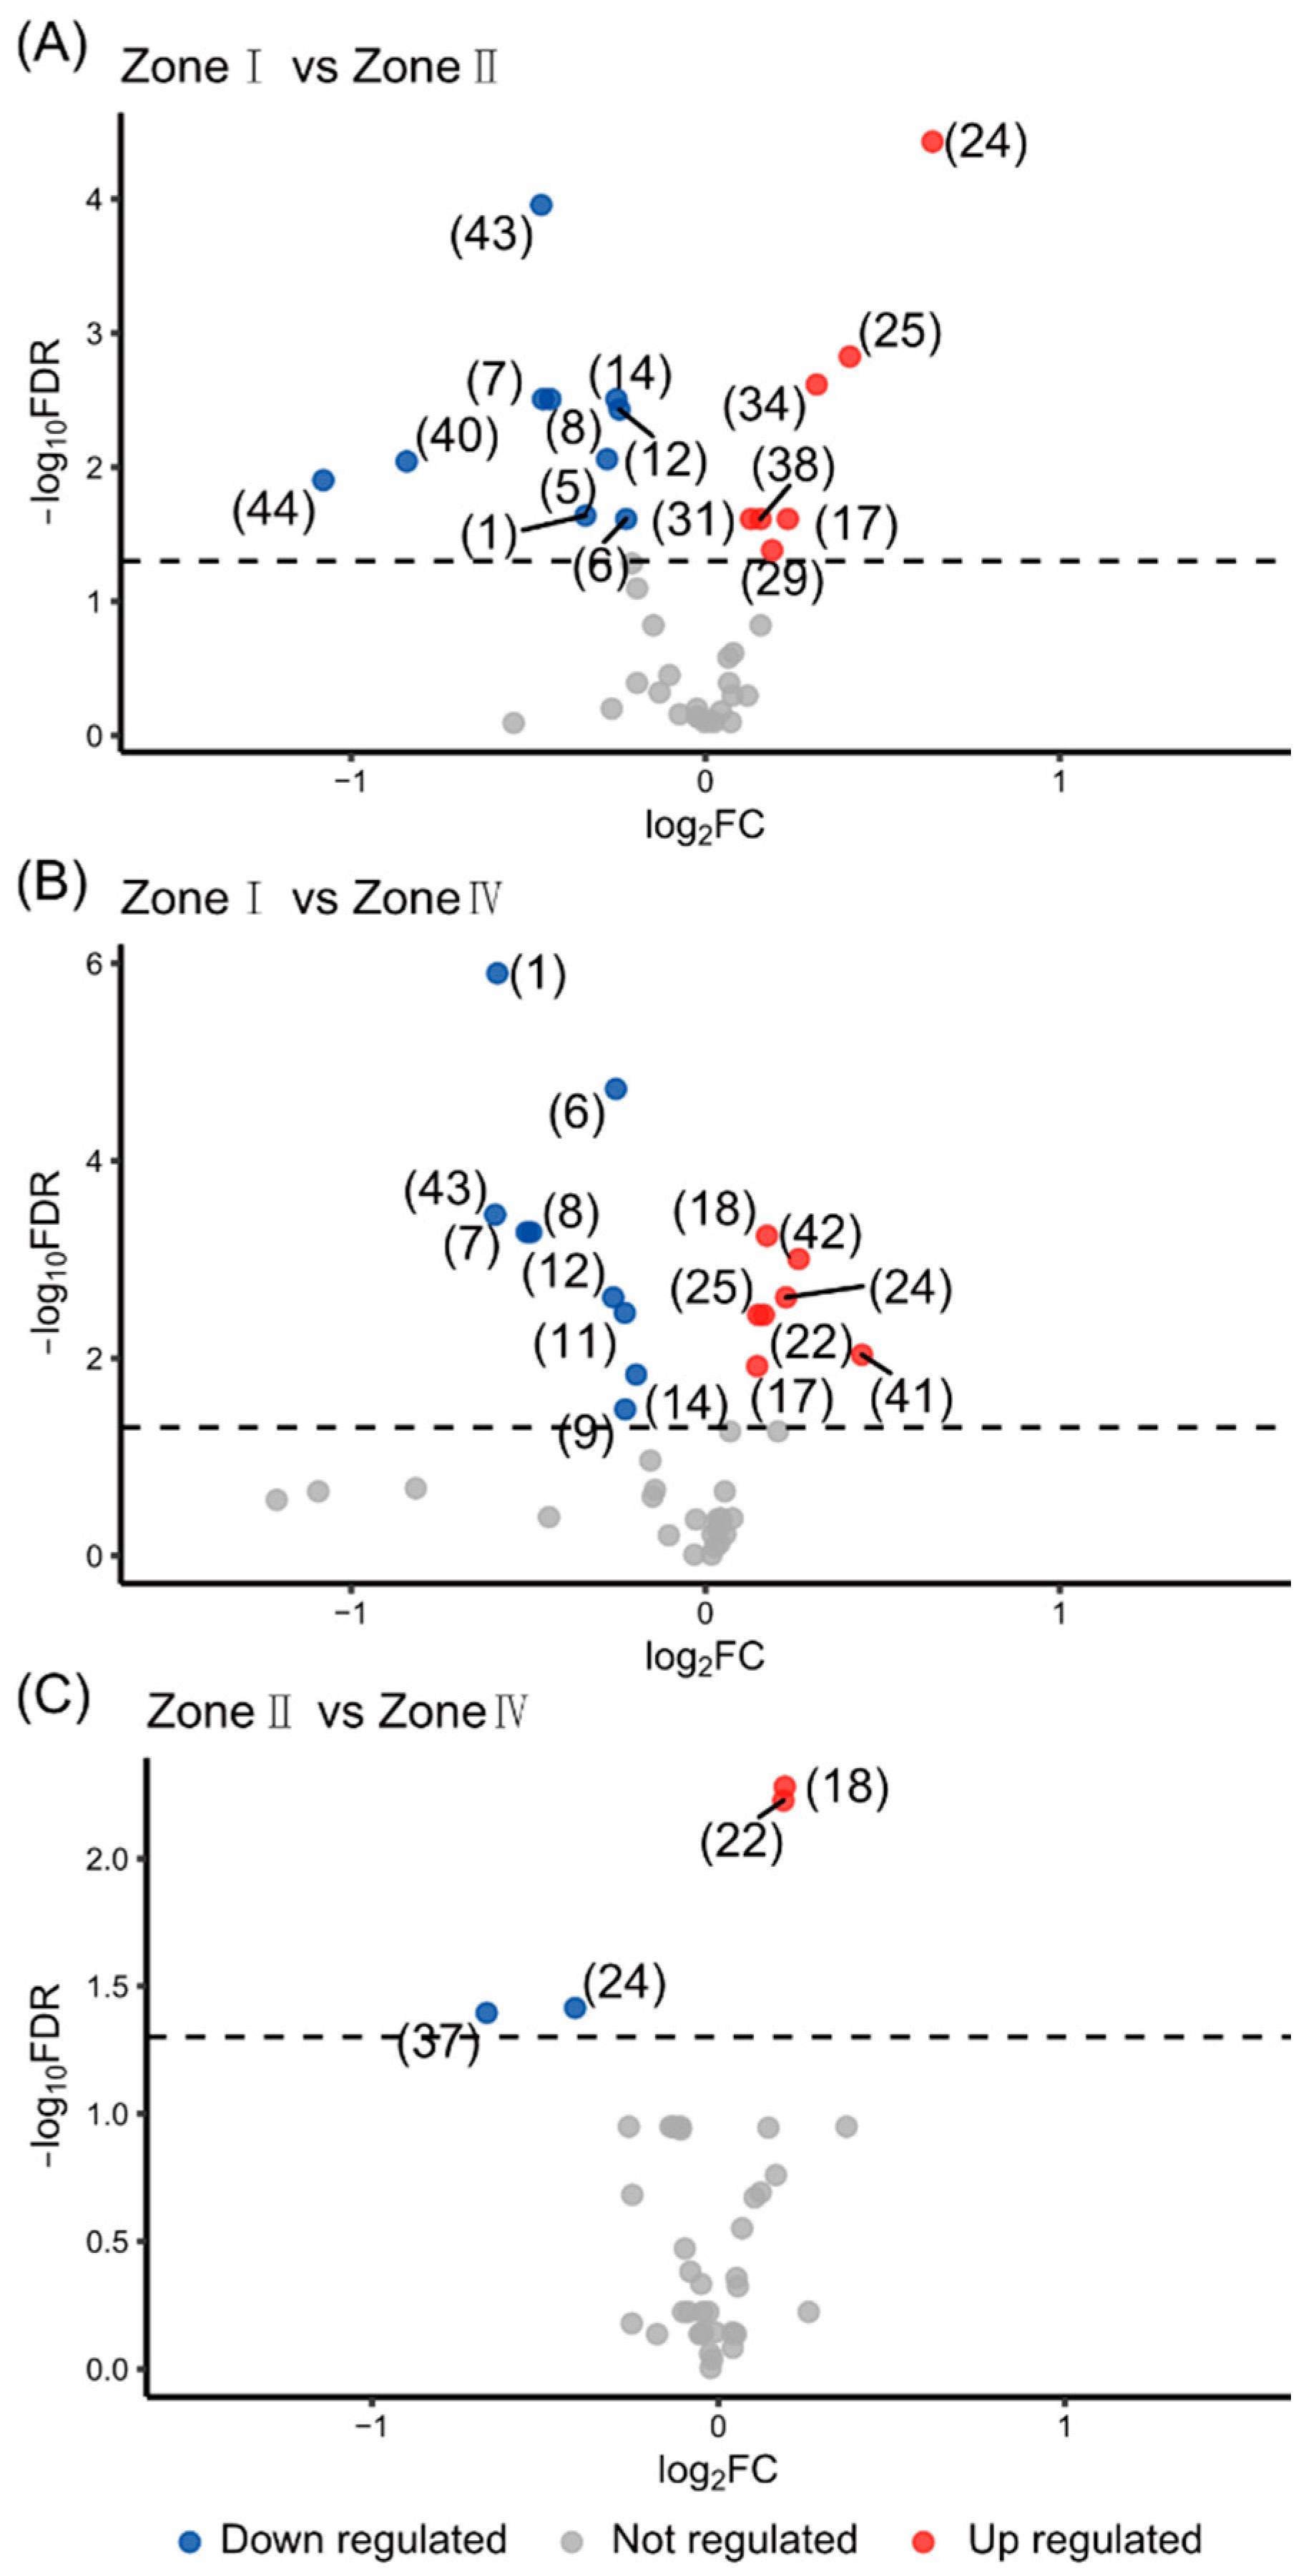
3.4. Correlation between Compounds and Locality of Growth

Considering that sabinene (4), trans-sabinenehydrate (13), linalool (15), and (E)-2-tetradecenal (45) were related to the harvest date, they have been excluded from the analysis of correlation between compounds and distribution areas.
As shown in the Figure 5A, the 12 populations were split into two groups. Group 1 consisted of Yuanyang (YY), Lvchun (LC), Hekou (HK), Pingbian (PB), Jinping (JP), and Maguan (MG). Group 2 included Yingjiang (YJ), Tengchong (TC), Fugong (FG), Lushui (LS), Gongshan (GS), and Dulongjiang (DLJ). Preferentially, OPLS-DA was carried out. Figure 6A showed the result. Groups 1 and 2 had differences with Q2 greater than 0.56 while p-values 1.9 × 10⁻¹¹. The 16 compounds were highlighted by significant level to discriminate Groups 1 and 2 (Figure 6B). However, the volcano plot of the univariate statistical analysis showed that there is no compound having significant differences between the two groups (Figure 6C).
Considering that A. tsaoko have been planted for centuries, the geographical conditions may have an effect on its essential oil. The floristic zones have been mentioned, to have larger geographic areas composed of similar plant species or plant groupings. Based on a theory, the Yunnan province was divided into five floristic zones [32]. Now, A. tsaoko distributes in three of these floristic zones: the south and southwest zone (zone I), the southeast zone (zone II), and the west and northwest zone (zone IV). Zone II has the longest cultivation history for A. tsaoko in China. A. tsaoko produced in zones I and IV were introduced from zone II. In this study, Yuanyang (YY), Lvchun (LC), Yingjiang (YJ), and Tengchong (TC) populations were in zone I. Hekou (HK), Pingbian (PB), Jinping (JP), and Maguan (MG) populations were in zone II. Fugong (FG), Lushui (LS), Gongshan (GS), and Dulongjiang (DLJ) populations were in zone IV. Therefore, these 12 populations were split into three groups (Figure 5B), and followed by establishing the OPLS-DA model. Results showed that zone I and II had outstanding differences with Q2 greater than 0.58 and p-values smaller than 1.2 × 10⁻⁷ (Figure 7(A1)). Meanwhile, zone I and IV showed significant differences with Q2 greater than 0.75 and p-values smaller than 1.9 × 10⁻¹² (Figure 7(B1)). Furthermore, zone II and zone IV showed specific differences with Q2 greater than 0.81 and p-values smaller than 2.1 × 10⁻¹⁵ (Figure 7(C1)). The compounds, which were employable to discriminate, are shown in Figure 7(A2,B2,C2).
The results of univariate statistical analysis showed in Figure 8 and Table 4. The intergroup differences of zone I and II were highlighted by significant higher levels of verbenol (17), unknown-1 (24), neral (25), geranial (29), C10H12O-2 (31), 4-indanecarbaldehyde (34), and 5-indanecarbaldehyde (38) but lower levels of (E)-2-hexenal (1), β-myrcene (5), octanal (6), α-phellandrene (7), α-terpinene (8), γ-terpinene (12), terpinolene (14), (E)-2-decenyl acetate (40), (E)-nerolidol (43), and (E)-2-dodecenyl acetate (44). Meanwhile, verbenol (17), δ-terpineol (18), α-terpineol (22), unknown-1 (24), neral (25), unknown-4 (41), and (E)-2-dodecenal (42) presented higher level in zone IV than in zone I. However, (E)-2-hexenal (1), octanal (6), α-phellandrene (7), α-terpinene (8), cymene (9), (E)-2-octenal (11), γ-terpinene (12), terpinolene (14), (E)-2-decenyl acetate (40), and (E)-nerolidol (43) presented lower level in zone IV than in zone I. Moreover, compared with zone II, δ-terpineol (18) and α-terpineol (22) had higher levels and unknown-1 (24) and geranyl acetate (37) had lower levels in zone IV.
Taking all these together, it was apparent that the compounds in essential oil could be used to distinguish the producing area of the A. tsaoko fruit. In other words, the place of origin might indicate the component characteristic in the essential oil of the A. tsaoko fruit.

4. Conclusions

For hundreds of years of cultivation, A. tsaoko has been distributed in three of the floristic zones in the Yunnan province: the south and southwest zone (zone I), the southeast zone (zone II), and the west and northwest zone (zone IV). Until now, the morphological characteristics have been presented such that the difference between population is greater than the difference within population. The correlation analysis of the morphological variations and geographical conditions showed that the high-altitude localities are beneficial for the accumulation of biomass. Among these 12 populations, the fruits from Yuanyang (YY) have the highest fruit weight, fruit size, and 1000 seeds’ weight. Therefore, the Yuanyang (YY) is suitable for A. tsaoko fruit biomasses.
Focusing on the relative quantity of compounds in the essential oil and morphological characteristics, it is interesting to find that the selection of specific functional or odor type materials could reference the morphologies of the A. tsaoko fruit and seed. For example, the longer length means a stronger aroma and potentially higher pharmacological activity in acaricidal, antiprotozoal, and antioxidant properties. Meanwhile, more attention must be paid to the harvest date in the process of collection.
Qualitative and quantitative analyses of compounds in the essential oil could be used to distinguish the producing area of the A. tsaoko fruit. Moreover, the locality of growth might indicate the component characteristic in the essential oil of the A. tsaoko fruit. These results are crucial in realizing the determination of botanical origin and evaluating the quality of A. tsaoko fruit. Meanwhile, it is clear that various other studies on this plant deserve more attention.

Supplementary Materials

The following are available online at https://www.mdpi.com/article/10.3390/agronomy11040744/s1. Table S1: The optimised temperature program of GC/MS. Table S2: Selected ions used in SIM mode. Figure S1: PCA score plot of samples and QC. Figure S2: Change of RSD after SVR normalization.

Author Contributions

G.L.: conceptualization, resources. Q.L.: data curation, formal analysis, writing—original draft preparation. J.W.: methodology, data curation, formal analysis. Q.H.: investigation. P.L.: methodology. Y.Y.: conceptualization, data curation, funding acquisition. Y.L.: methodology, data curation. H.T.: writing—reviewing and editing. H.X.: conceptualization, funding acquisition, project administration, writing—reviewing. All authors have read and agreed to the published version of the manuscript.

Funding

This research was funded by the National Natural Science Foundation of China (31300281), Beijing, China; Key Fund for Traditional Chinese Medicine Cooperation of Application Fundamental Research in Yunnan Province [2018FF001-(010)], Kunming, Yunnan, China; National Natural Science Foundation of China (81660631), Beijing, China; and the Special Fund for Traditional Chinese Medicine Cooperation of Application Fundamental Research in Yunnan Province [2017FF116-(004)], Kunming, Yunnan, China.

Institutional Review Board Statement

Not applicable.

Informed Consent Statement

Not applicable.

Data Availability Statement

Data available in a publicly accessible repository.

Acknowledgments

The study was supported financially by We are grateful to Baojun Ma from Yunnan ZamZam Flavor Food Co., Ltd. (Kunming, Yunnan, China) for assistance in collecting the samples.

Conflicts of Interest

The authors report no declarations of interest.

References

  1. de Boer, H.; Newman, M.; Poulsen, A.D.; Droop, A.J.; Fér, T.; Hiên, L.T.T.; Hlavatá, K.; Lamxay, V.; Richardson, J.E.; Steffen, K.; et al. Convergent morphology in Alpinieae (Zingiberaceae): Recircumscribing Amomum as a monophyletic genus. Taxon 2018, 67, 6–36. [Google Scholar] [CrossRef]
  2. Wu, D.L.; Kai, L. Flora of China; Science Press: Beijing, China, 2000; Volume 24, pp. 347–356. [Google Scholar]
  3. Kim, J.G.; Jang, H.; Le, T.P.L.; Hong, H.R.; Lee, M.K.; Hong, J.T.; Lee, D.; Hwang, B.Y. Pyranoflavanones and Pyranochalcones from the Fruits of Amomum tsaoko. J. Nat. Prod. 2019, 82, 1886–1892. [Google Scholar] [CrossRef]
  4. Yang, Y.W.; Liu, X.L.; Pu, C.X.; Qian, Z.G.; Guan, K.Y. The Influence of Altitude and Latitude on Breeding of Amomum tsaoko (Zingiberaceae). J. Biosci. Med. 2014, 2, 9–17. [Google Scholar] [CrossRef] [Green Version]
  5. Chinese Pharmacopoeia Commission. Pharmacopoeia of the People’s Republic of China; China Medical Science and Technology Press: Beijing, China, 2015; Volume IV, pp. 203–204. [Google Scholar]
  6. Chen, C.; You, F.; Wu, F.; Luo, Y.; Zheng, G.; Xu, H.; Liu, Y. Antiangiogenesis Efficacy of Ethanol Extract from Amomum tsaoko in Ovarian Cancer through Inducing ER Stress to Suppress p-STAT3/NF-kB/IL-6 and VEGF Loop. Evid. Based Complement Altern. Med. 2020, 2020, 2390125. [Google Scholar] [CrossRef] [PubMed] [Green Version]
  7. Lee, S.; Lee, J.C.; Subedi, L.; Cho, K.H.; Kim, S.Y.; Park, H.-J.; Kim, K.H. Bioactive compounds from the seeds of Amomum tsaoko Crevost et Lemaire, a Chinese spice as inhibitors of sphingosine kinases, SPHK1/2. RSC Adv. 2019, 9, 33957–33968. [Google Scholar] [CrossRef] [Green Version]
  8. Cui, Q.; Wang, L.T.; Liu, J.Z.; Wang, H.M.; Guo, N.; Gu, C.B.; Fu, Y.J. Rapid extraction of Amomum tsaoko essential oil and determination of its chemical composition, antioxidant and antimicrobial activities. J. Chromatogr. B Anal. Technol. Biomed. Life Sci. 2017, 1061, 364–371. [Google Scholar] [CrossRef]
  9. Yang, Y.; Yan, R.W.; Cai, X.Q.; Zheng, Z.L.; Zou, G.L. Chemical composition and antimicrobial activity of the essential oil of Amomum tsaoko. J. Sci. Food Agric. 2008, 88, 2111–2116. [Google Scholar] [CrossRef]
  10. Wang, Y.; You, C.X.; Wang, C.F.; Yang, K.; Chen, R.; Zhang, W.J.; Du, S.S.; Geng, Z.F.; Deng, Z.W. Chemical Constituents and Insecticidal Activities of the Essential Oil from Amomum tsaoko against Two Stored-Product Insects. J. Oleo Sci. 2014, 63, 1019–1026. [Google Scholar] [CrossRef] [Green Version]
  11. Guo, N.; Zang, Y.P.; Cui, Q.; Gai, Q.Y.; Jiao, J.; Wang, W.; Zu, Y.G.; Fu, Y.J. The preservative potential of Amomum tsaoko essential oil against E. coil, its antibacterial property and mode of action. Food Control. 2017, 75, 236–245. [Google Scholar] [CrossRef]
  12. Zhang, T.T.; Lu, C.L.; Jiang, J.G. Bioactivity evaluation of ingredients identified from the fruits of Amomum tsaoko Crevost et Lemaire, a Chinese spice. Food Funct. 2014, 5, 1747–1754. [Google Scholar] [CrossRef]
  13. Liu, G.; Jin, M.; Cai, C.; Ma, C.; Chen, Z.; Gao, L. Soil Microbial Community Structure and Physicochemical Properties in Amomum tsaoko-based Agroforestry Systems in the Gaoligong Mountains, Southwest China. Sustainability 2019, 11, 546. [Google Scholar] [CrossRef] [Green Version]
  14. Ma, M.L.; Lei, E.; Meng, H.L.; Wang, T.T.; Xie, L.Y.; Shen, D.; Zhou, X.W.; Lu, B.Y. Cluster and principal component analysis based on SSR markers of Amomum tsaoko in Jinping County of Yunnan Province. AIP Conf. Proc. 2017, 1864, 020070. [Google Scholar] [CrossRef] [Green Version]
  15. Zhang, W.; Lu, B.Y.; Meng, H.L.; Wei, X.; Yang, Z.Q.; Yang, S.C. Phenotypic diversity analysis of the fruit of Amomum tsaoko Crevost et Lemarie, an important medicinal plant in Yunnan, China. Genet. Resour. Crop Evol. 2019, 66, 1145–1154. [Google Scholar] [CrossRef]
  16. Kharbach, M.; Marmouzi, I.; El Jemli, M.; Bouklouze, A.; Vander Heyden, Y. Recent advances in untargeted and targeted approaches applied in herbal-extracts and essential-oils fingerprinting—A review. J. Pharm. Biomed. Anal. 2020, 177, 112849. [Google Scholar] [CrossRef]
  17. Shen, X.T.; Gong, X.Y.; Cai, Y.P.; Guo, Y.; Tu, J.; Li, H.; Zhang, T.; Wang, J.L.; Xue, F.Z.; Zhu, Z.J. Normalization and integration of large-scale metabolomics data using support vector regression. Metabolomics 2016, 12, 89. [Google Scholar] [CrossRef]
  18. Wei, T.Y.; Simko, V. R Package “Corrplot”: Visualization of a Correlation Matrix (Version 0.84). 2017. Available online: https://github.com/taiyun/corrplot (accessed on 20 July 2020).
  19. Shannon, P.; Markiel, A.; Ozier, O.; Baliga, N.S.; Wang, J.T.; Ramage, D.; Amin, N.; Schwikowski, B.; Trey, I. Cytoscape: A software environment for integrated models of biomolecular interaction networks. Genome Res. 2003, 13, 2498–2504. [Google Scholar] [CrossRef]
  20. Díaz-Gutiérrez, C.; Trillos, Á.T.; Villa, V.; Silva, Z.; Acevedo, L.; Arroyave, C.; Poschenrieder, C.; Peláez, C. Altitude and fertilization type: Concentration of nutrients and production of biomass in Stevia rebaudiana Bertoni. J. Plant Nutr. 2020, 44, 322–336. [Google Scholar] [CrossRef]
  21. Chen, D.D.; Li, Q.; Liu, Z.; He, F.; Chen, X.; Xu, S.; Zhao, X.; Zhao, L. Variations of Forage Yield and Nutrients with Altitude Gradients and Their Influencing Factors in Alpine Meadow of Sanjiangyuan, China. J. Soil Sci. Plant Nutr. 2020, 20, 2164–2174. [Google Scholar] [CrossRef]
  22. Tan, Q.; Wang, G. Decoupling of nutrient element cycles in soil and plants across an altitude gradient. Sci. Rep. 2016, 6, 34875. [Google Scholar] [CrossRef]
  23. Starkenmann, C.; Mayenzet, F.; Brauchli, R.; Wunsche, L.; Vial, C. Structure elucidation of a pungent compound in black cardamom: Amomum tsaoko Crevost et Lemarie (Zingiberaceae). J. Agric. Food Chem. 2007, 55, 10902–10907. [Google Scholar] [CrossRef]
  24. Sim, S.; Tan, S.K.; Kohlenberg, B.; Braun, N.A. Amomum tsaoko—Chinese Black Cardamom: Detailed Oil Composition and Comparison with two other cardamom species. Nat. Prod. Commun. 2019, 14, 1934578X1985767. [Google Scholar] [CrossRef] [Green Version]
  25. Ahn, S.Y.; Choi, H.S. Compositional Changes in Cassia mimosoides var. noname (M.) Essential Oil. J. Essent. Oil Bear. Plants 2009, 12, 509–520. [Google Scholar] [CrossRef]
  26. Ghasemi Pirbalouti, A.; Mahdad, E.; Craker, L. Effects of drying methods on qualitative and quantitative properties of essential oil of two basil landraces. Food Chem. 2013, 141, 2440–2449. [Google Scholar] [CrossRef]
  27. Tohidi, B.; Rahimmalek, M.; Arzani, A. Essential oil composition, total phenolic, flavonoid contents, and antioxidant activity of Thymus species collected from different regions of Iran. Food Chem. 2017, 220, 153–161. [Google Scholar] [CrossRef]
  28. He, X.C.; Wang, S.Y.; Shi, J.Y.; Sun, Z.L.; Lei, Z.T.; Yin, Z.L.; Qian, Z.G.; Tang, H.R.; Xie, H. Genotypic and Environmental Effects on the Volatile Chemotype of Valeriana jatamansi Jones. Front. Plant. 2018, 10, 1003. [Google Scholar] [CrossRef] [PubMed]
  29. Gupta, M.; Rout, P.K.; Misra, L.N.; Gupta, P.; Singh, N.; Darokar, M.P.; Saikia, D.; Singh, S.C.; Bhakuni, R.S. Chemical composition and bioactivity of Boswellia serrata Roxb. essential oil in relation to geographical variation. Plant Biosyst. Int. J. Deal. All Asp. Plant Biol. 2017, 151, 623–629. [Google Scholar] [CrossRef]
  30. Chen, S.L.; Zhang, L.P.; Cai, X.M.; Li, X.; Bian, L.; Luo, Z.X.; Li, Z.Q.; Chen, Z.M.; Xin, Z.J. (E)-Nerolidol is a volatile signal that induces defenses against insects and pathogens in tea plants. Hortic. Res. 2020, 7, 52. [Google Scholar] [CrossRef] [PubMed] [Green Version]
  31. Quintana-Rodriguez, E.; Rivera-Macias, L.E.; Adame-Alvarez, R.M.; Torres, J.M.; Heil, M. Shared weapons in fungus-fungus and fungus-plant interactions? Volatile organic compounds of plant or fungal origin exert direct antifungal activity in vitro. Fungal Ecol. 2018, 33, 115–121. [Google Scholar] [CrossRef]
  32. Wu, Z.Y.; Zhu, Y.C. Yunnan Vegetation; Science Press: Beijing, China, 1987; pp. 31–32. [Google Scholar]
Figure 1. Map of the populations were sampled. Image source: Baidu.
Agronomy 11 00744 g001
Figure 2. Correlation analysis of the morphological variations and geographical conditions. Positive correlations are shown with red lines and negative correlations are shown with blue lines, the weight of lines representing the p value.
Agronomy 11 00744 g002
Figure 3. The GC-MS chromatogram with label peaks. (A): Total ion chromatography (TIC) obtained from split ratios of 44:1. (B): TIC obtained from split ratios of 8:1 with MS detector off at 7.20–7.45 min and 11.49–11.90 min. (C): Zoom in B on y-axis (intensity).
Agronomy 11 00744 g003
Figure 4. Correlation analysis between morphological variable and compounds. (A) The correlations with p < 0.05 are indicated with colored circles. Positive correlations are shown in red and negative correlations are shown in blue, the sizes of the circles representing the magnitude of the correlations. (B) The correlations with p < 0.05 are indicated with colored circles and lines. Positive correlations are shown in red lines and negative correlations are shown in blue lines, the weight of lines representing the p value. The smaller the p value, the thicker the line. Morphological variables are shown in yellow circles, compounds in gray.
Agronomy 11 00744 g004
Figure 5. Group information. (A) Group 1 and Group 2. (B) Zone I, zone II, and zone IV.
Agronomy 11 00744 g005
Figure 6. Correlation analysis between compounds in the essential oil and locality of growth (Groups 1 and 2). (A) Orthogonal partial least squares discrimination analysis (OPLS-DA) results. (B) The significant level of compounds to discriminate Groups 1 and 2. (C) The volcano plot of univariate statistical analysis of Groups 1 and 2.
Agronomy 11 00744 g006
Figure 7. Correlation analysis between compounds in the essential oil and locality of growth (zone I, zone II, and zone IV). (A) Zone I vs. zone II. (B) Zone I vs. zone IV. (C) Zone II vs. zone IV. (A1,B1,C1) OPLS-DA results. (A2,B2,C2) The significant level of compounds to discriminate the zones.
Agronomy 11 00744 g007
Figure 8. The volcano plot of univariate statistical analysis. (A) Zone I vs. zone II. (B) Zone I vs. zone IV. (C) Zone II vs. zone IV. The compounds are shown by their number in Table 3.
Agronomy 11 00744 g008
Table 1. Information of selected regions plant were sampled.
RegionAbbr.Longitude (° N)Latitude (° E)Altitude (m)Mean Annual Temperature (°C)Mean Annual Precipitation (mm)Date of HarvestCollectorVoucher
YuanyangYY103.023323.00701651.624.41189.130 October 2018Guodong LiZMCG0017
LvchunLC102.430322.99891648.516.62415.231 October 2018Congwei YangZMCG0018
YingjiangYJ98.213124.95061985.419.31464.031 October 2018Guodong LiZMCG0019
TengchongTC98.393325.07611483.916.51531.031 October 2018Yaowen YangZMCG0020
HekouHK104.122522.8742900.023.02022.75 September 2018Guodong LiZMCG0015
PingbianPB103.692422.99151325.516.51650.05 September 2018Guodong LiZMCG0014
JinpingJP103.229322.78521243.118.02330.029 October 2018Guodong LiZMCG0016
MaguanMG104.397223.00861320.016.91345.04 September 2018Guodong LiZMCG0013
FugongFG98.869227.02891218.216.91443.37 November 2018Guodong LiZMCG0024
LushuiLS98.852725.8540822.021.2747.62 November 2018Guodong LiZMCG0021
GongshanGS98.672227.74971502.316.03700.07 November 2018Guodong LiZMCG0023
DulongjiangDLJ98.349227.89501486.515.03900.07 November 2018Guodong LiZMCG0022
Table 2. The analysis of morphological characteristics.
RegionAbbr.Length *Width *Length/Width *Fresh Weight *Dry Weight *Dehydration Rate *Seed Number/Fruit *1000 Seeds Weight #Oil Yield of Seeds &
cmRSD %cmRSD % RSD %gRSD %gRSD %%RSD %CountRSD %gRSD %%RSD %
YuanyangYY3.7316.093.138.631.2015.9319.7925.775.1523.8873.921.6544.1732.3377.311.053.912.05
LvchunLC3.5012.862.7010.371.308.8013.8528.233.2929.4876.261.4733.7736.8466.943.973.852.34
YingjiangYJ3.5112.252.7012.591.3113.1814.1031.703.2432.7277.192.2232.0337.4670.861.073.481.44
TengchongTC3.3617.862.579.731.3117.1412.5129.983.0132.5676.162.6730.9335.3166.302.354.081.23
HekouHK3.3614.292.6013.461.3013.6412.2630.912.9137.4676.705.4039.5330.5358.330.863.993.01
PingbianPB3.2914.592.649.851.2615.7512.8225.822.7428.4778.652.9932.9032.4659.560.994.031.74
JinpingJP3.5116.812.6710.111.3213.4712.9430.143.0731.6076.422.4230.1343.8466.011.584.173.36
MaguanMG3.4414.532.7111.441.2711.7913.7028.393.1736.2877.125.4737.3045.4755.971.842.934.81
FugongFG3.3115.412.4912.051.3415.6712.2431.783.0935.6075.072.6429.6740.1466.531.013.461.45
LushuiLS3.3514.932.4712.551.3820.1311.1226.892.8131.6775.092.1430.7737.1864.172.233.541.41
GongshanGS3.2915.812.6411.361.2617.5812.5228.273.0934.9575.802.9930.3336.3072.012.933.143.50
DulongjiangDLJ3.3613.102.5111.551.3512.6011.9529.213.2829.2772.581.5735.6031.1865.232.543.672.18
Average 3.4214.882.6511.141.3014.6413.3228.923.2431.9975.912.8033.9336.5965.771.873.692.37
* n = 30, # n = 3, & n = 6.
Table 3. The identification results of compounds in essential oil.
No.RTActual RIReference RIActual RI-
Reference RI
Name
15.14849853−4(E)-2-hexenal
25.86925926−1α-thujene
35.99933935−2α-pinene
46.429709682sabinene
56.509859832β-myrcene
66.659991003−4octanal
76.84100710034α-phellandrene
87.01102310158α-terpinene
97.12103410268cymene
107.351046103214eucalyptol
117.5510681072−4(E)-2-octenal
127.681071105417γ-terpinene
137.88107910727trans-sabinenehydrate
148.26109510887terpinolene
158.31110110974linalool
168.8011301131−12,6-dimethyl-2,4,6-octatriene
179.421166113333verbenol
189.67117311667δ-terpineol
199.771179116514isoneral
209.911184117864-terpineol
2110.051196119424-decenal
2210.15119711898α-terpineol
2310.25120712025decanal
2410.771230 unknown-1
2511.1812441246−2neral
2611.3912561259−3geraniol
2711.461259 unknown-2
2811.63126512650(E)-2-decenal
2911.87127512696geranial
30 *12.631315 C10H12O-1
31 *13.061325 C10H12O-2
3213.551343 unknown-3
33 *13.741348 C10H12O-3
3414.0213561307494-indanecarbaldehyde
35 *14.391366 C10H12O-4
36 *14.591370 C10H12O-5
3714.6813841387−3geranyl acetate
38 *14.921388 5-indanecarbaldehyde
39 *15.091393 C10H12O-6
4015.37140714061(E)-2-decenyl acetate
4116.361452 unknown-4
4216.5414671482−15(E)-2-dodecenal
4317.741575155916(E)-nerolidol
4418.0916081609−1(E)-2-dodecenyl acetate
4518.65167616733(E)-2-tetradecenal
*: compounds that are identified based on published literatures.
Table 4. The results of univariate statistical analysis.
No.NameZone I vs. Zone IIZone I vs. Zone IVZone II vs. Zone IV
1(E)-2-hexenal
5β-myrcene
6octanal
7α-phellandrene
8α-terpinene
9cymene
11(E)-2-octenal
12γ-terpinene
14terpinolene
17verbenol++
18δ-terpineol ++
22α-terpineol ++
24unknown-1++
25neral++
29geranial+
31C10H12O-2+
344-indanecarbaldehyde+
37geranyl acetate
385-indanecarbaldehyde+
40(E)-2-decenyl acetate
41unknown-4 +
42(E)-2-dodecenal +
43(E)-nerolidol
44(E)-2-dodecenyl acetate
Publisher’s Note: MDPI stays neutral with regard to jurisdictional claims in published maps and institutional affiliations.

