Article

Estimation of Genetic Parameters and Wood Yield Selection Index in a Clonal Trial of Korean Pine (Pinus koraiensis) in Northeastern China

1
State Key Laboratory of Tree Genetics and Breeding, Northeast Forestry University, Harbin 150040, China
2
Department of Natural Resources Management, Faculty of Agricultural Sciences, University of Kinshasa, P.O. Box 117, Kinshasa XI 023, Congo
*
Authors to whom correspondence should be addressed.
Sustainability 2021, 13(8), 4167; https://doi.org/10.3390/su13084167
Submission received: 26 February 2021 / Revised: 1 April 2021 / Accepted: 1 April 2021 / Published: 8 April 2021
(This article belongs to the Special Issue Forest Resources Management)

Abstract

:
In order to determine suitable traits for selecting high-wood-yield Korean pine materials, eleven morphological characteristics (tree height, basal diameter, diameter at breast height, diameter at 3 meter height, stem straightness degree, crown breadth, crown height, branch angle, branch number per node, bark thickness, and stem volume) were investigated in a 38-year-old Korean pine clonal trial at Naozhi orchard. A statistical approach combining variance and regression analysis was used to extract appropriate traits for selecting elite clones. Results of variance analysis showed significant difference in variance sources in most of the traits, except for the stem straightness degree, which had a p-value of 0.94. Moderate to high coefficients of variation and clonal repeatability ranged from 10.73% to 35.45% and from 0.06% to 0.78%, respectively. Strong significant correlations on the phenotypic and genotypic levels were observed between the straightness traits and tree volume, but crown breadth was weakly correlated to the volume. Four principal components retaining up to 80% of the total variation were extracted, and stem volume, basal diameter, diameter at breast height, diameter at 3 meter height, tree height, and crown height displayed high correlation to these components (r ranged from 0.76 to 0.98). Based on the Type III sum of squares, tree height, diameter at breast height, and branch number showed significant information to explain the clonal variability based on stem volume. Using the extracted characteristics as the selection index, six clones (PK105, PK59, PK104, PK36, PK28, and K101) displayed the highest Qi values, with a selection rate of 5% corresponding to the genetic gain of 42.96% in stem volume. This study provides beneficial information for the selection of multiple traits for genetically improved genotypes of Korean pine.

1. Introduction

The Korean pine breeding program remains among the largest coniferous tree improvement programs in Northeastern China that are carried out [1]. Pinus koraiensis was primarily selected to increase its wood yield. A few years later, however, seed yield was taken into account, responding to users’ demand for the seeds and nuts of Korean pine and following the official decree in 2016 against the cutting of natural forests. Korean pine offers many economic benefits. Its wood is more appreciated in construction, and its seeds are variously used in diet and medicine [2,3].
P. koraiensis is much desired, being preferred in community reforestation projects following the services it provided in Northeastern China [4]. However, the planting of stock with desirable genetic properties is still lower than the planting demand [5]. Because of the limitation of asexual propagation techniques due to the difficulty of producing large amounts of planting materials by cuttings, tissue culture, somatic embryogenesis, and other asexual methods, seed orchards took an important place in improving Korean pine [6].
The improvement of Korean pine dates back more than a half century [7]. To date, significant gains have been realized, and several studies reported some improvements in growth rate, and seed and wood quality [8,9,10,11]. Facing multiple needs and a permanent global change, multi-objective approaches have been suggested for the sustainable management of forest resources [12]. In tree improvement, selection for multiple characteristics has been introduced to meet multiple purposes.
From this perspective, the establishment of selection criteria in a tree improvement program remains a critical step for choosing appropriate individual trees on which future breeding objectives will focus [13]. Several selection methods, for a particular trait or multiple traits, can be used for the purpose of improvement. Among these methods, the comprehensive evaluation by Qi value, for instance, assigns importance to the weighting of correlated characteristics when simultaneously enhancing various traits [14,15]. On another side, Leakey and Page [16] referred to the breeding ideotypes approach, which consists in the combination of biomass-related traits to define a hypothetical model of suitable plants producing an economic yield.
Multiple traits selection has been applied to select superior Korean pine materials in different phases for its breeding, including clonal, provenance, and progeny tests [17,18]. The selection of multiple traits presents some advantages over tree selection for a single particular characteristic [19], especially when the characteristics are positively correlated and display high heritability [20]. However, correlation coefficients, although important for indirect selection, are not sufficient to designate more specific traits to be used as the selection index because of positive and negative effects between linked traits, due principally to uncontrollable and complex trait interaction [21].
Pathway analysis, consisting of measurement of the weight of variance of dependent variables and independent ones [22], involves the conversion of correlation coefficients into direct or indirect effects through a multiple regression equation that calculates the impact of correlated variables with precision. Pathway analysis has revealed associations between cause and effect among yield and yield-related traits of genotypes in agronomic plants [23], as well as different growing environments or habitats [24,25]. By reducing a large set of variables into underlying correlated factors [26], principal component analysis (PCA) appears to be a useful tool to highlight trait combinations that greatly contribute to the variation among tree populations under characterization [27,28].
Combining correlation, pathway analysis, and PCA in a multiple-trait comprehensive evaluation could be a powerful statistical method for selecting suitable values in multiple traits to achieve improvement goals.
Given that first generation Korean pine was selected for timber production, and that stem volume represents the major part of the above-ground tree biomass, knowledge of any effects of other growth characteristics on volume would allow the prediction of various gains from the orchard. As there has been little research previously on these aspects, especially on a multiple-usage tree species, this study tries to determine the effects of other growth traits on the volume of Korean pine. It specifically aims to (1) investigate the growth performances of different clones; (2) establish correlations between growth characteristics and their effects on wood yield; (3) highlight the optimum number of traits proper for a comprehensive evaluation index to select superior clones; and (4) select elite clones with high clonal values for future breeding purposes. This work is written from the perspective of setting up a basic theory for the efficient selection of trees for genetic improvement.

2. Materials and Methods

2.1. Data Collection and Trial Design

The morphological characteristics were measured in Naozhi forestry seed orchard (41°05′ N, 126°06′ E), located on the western hillside of Changbai Mountain in Linjiang town, Northeastern China (Figure 1). This region belongs to the northern cold-temperate continental monsoon climate; summer is warm and rainy, and winter is cold and long. The annual average temperature varies between 4 and 6 °C and the annual average rainfall range between 750 and 1000 mm. The frost-free period is 135 days. The soil type corresponds to the Albi-Boric Argosols, according to the American soil taxonomy [29], and it is dominated by dark brown soil more than 40 cm thick with important textural constituents of sand (15.13%), silt (63.31%), and clay (21.56%) [30].
One hundred and ten clones (named from PK01 to PK110; see Table 11) were used as experimental materials. These clones were chosen, based on their growth performances, from the natural distribution area of P. koraiensis in Linjiang town in Jilin Province in 1978. The materials were grafted and planted with 4-year-old seedlings in the spring of 1980. The experimental design consisted of a completely randomized block, with 10 blocks containing 110 different clones, and one ramet of each clone planted with inter-plant and row spacing of 7.0 m × 7.0 m.

2.2. Growth Trait Measurement

The following traits were measured in living ramets of each clone in July 2018: tree height (Ht), basal diameter (BD), diameter at breast height (DBH), diameter at 3 m height (DIAM3), stem straightness degree (SSD), crown breadth (CB), crown height (CH), branch number per node (BNN), branch angle (BA), and bark thickness (BT). Ht and CH were measured with a meter ruler; BD, DBH, and DIAM3 were measured by a caliper; SSD was estimated and squared before calculation according to Zhao et al. [31]. CB was calculated by averaging the values of north–south and east–west crown width, and CH was obtained by subtracting the value of tree height at the first branch from the total tree height. The average number of BA was measured with a protractor at 3 m height. The number of branches (BNN) was counted on the first five nodes. Pieces of bark were removed at the base of the trunk and at a 1.3 m height of the stem, and were measured by caliper. Their average gave the BT. The stem volume (Vol.) of each tree was calculated according to Louppe’s method [32], using the coefficient of 0.41 for coniferous trees in the formula proposed by the following equation:
V o l . = D B H 2   × H t × π × F C 40,000

2.3. Statistical Analysis

All the data were analyzed using XLSTAT 2019 [33], and IBM SPSS version 20 [34,35]. Firstly, the traits were tested for normality by Shapiro–Wilk’s test, and standardized by subtracting the mean value and dividing by the standard deviation to meet the assumption of the normal distribution of residuals. Average values, ranges, and standard error (SE) were calculated. To estimate clonal/genotype and random/environmental effects, the mixed linear model (Equation (2)) was employed to join together the fixed and random effects, and F-tests of one-way analysis of variance were used to test the significance in the variance sources [36].
P ij =   μ + b i + a ij + ε ij
where Pij is the phenotypic performance of an individual tree j of clone i, μ is the overall mean, a ij is the random clonal effects, b i is the fixed effect of the block, and ε ij is the residual value of the trait. Because each block contained a unique ramet from each clone, there were not computable interaction effects of clones and blocks from the mixed model. Clonal values were calculated through the relationship in Equation (3), and the variance component was estimated using the relationship in the Equation (4), considering the micro-environmental conditions in the orchard to be equal.
a ij = P ij   μ b i
  σ P i j 2 = σ a i 2 + σ ε 2
where σ Y i j 2 , σ a i 2 , and σ ε 2 symbolize the total phenotypic variance, genotypic variance, and variance of within-plot error, respectively [37]. A discriminatory factor analysis using PCA was done to determine traits that retained most of the variation in investigated clones [38]. The PCA analysis aimed to summarize the information contained in the eleven original traits into a smaller set of new composite variants (principal components) with a minimum loss of information, and to discover the relationship between new factors with single traits [39]. Standardized data were used prior to PCA regarding different scales of units of variables. The repeatability of clones was estimated using the clonal variance component divided by the total phenotypic variance that was equal to the subtraction of the inverse of F (Fisher–Yates) coefficients in ANOVA (1/F) from the unit value (1) as indicated by Zheng et al. [40].
R = σ a i 2 σ a i 2 + σ ε 2 = 1 1 F
To determine correlation of traits and determine whether multiple-trait selection supported the genetic breeding purpose, Pearson’s correlation coefficient r A ( xy ) was calculated using phenotypic values, and broad-sense genetic correlation was computed using genotypic variance of clones for all phenotypic traits according to Porth et al. [41] and Pan et al. [42], as per following equations:
r A   ( xy ) =   COV P ( x , y ) σ p ( x ) σ p ( y )
r g   ( xy ) =   COV g ( x , y ) σ p ( x ) σ p ( y )
where COVP(x,y) and COVg(x,y) are covariance between phenotypic and genetic values of traits x and y; and σ p ( x ) and σ p ( y ) are variance components of traits x and y, respectively. To determine the extent of phenotypic variation, the coefficient of variation (PCV) was calculated by dividing the standard deviation by mean values from each trait, following Hai et al. [43]:
PCV = SD X ¯
where X ¯ and SD were the mean value and standard deviation, respectively, for a given trait.
To determine the effects of growth characteristics on the wood yield of clones, a regression analysis was performed taking tree volume as the independent variable in the linear modal (Equation (9)). Trait contributions were then deduced from regression coefficients according to Couto et al. [44].
Y = P 1 X 1 + P 2 X 2 +   P n X n + ( 1 R 2 )
where Y represents the dependent variable, the stem volume; X1, X2…, Xn were the explanatory independent variables representing the other growth traits; and p1, p2…, pn were regression coefficients. The pathway diagram showing trait effects was constructed in Amos Software, IBM SPSS Amos 23 (http://www-03.ibm.com/spss-amos, accessed on 21 December 2020) [35]. Multicollinearity statistics of variables were done to detect variables with identical effects. Twelve statistical parameters—including R2, adjusted R2, mean square error (MSE), root mean square error (RMSE), mean absolute percentage error (MAPE), Durbin Watson statistic (DW), Mallows’ Cp, Akaike information criterion (AIC), Bayesian information criterion (SBC), predicted residual error sum of squares (PRESS), and quality index (Q)—were computed to verify the goodness of the fit of statistics of the regression model.
A comprehensive evaluation (Equation (10)) was made to rank the clones for selection using clonal phenotypic performances in the Qi value formula according to Zhao et al. [31]:
Qi = j = 1 n a i
where Q i is the comprehensive evaluation value, a i = X ij / X jmax ,   X ij is the mean value of a given trait, and X jmax is the maximum mean value of the trait.
To estimate the genetic gain from the selected clones, the formula developed by Francisco et al. [45] was applied (Equation (11)). Considering P. koraiensis logs, the expected economic gain was deduced by extrapolating the unitary economic value per cubic meter of wood multiplied by the logged production and realized gain in stem volume (Equation (12)).
Δ G = h 2 × W / X ¯
Δ Eco . = Price ×   volume   unit × realized   gain   in   stem   vol .

3. Results

3.1. ANOVA and Variation Parameters

To characterize the phenotypic variation of different clones of Korean pine in the Naozhi orchard, 11 morphological traits were measured. Significant differences were found in all the investigated traits, providing a selection basis for breeding purposes (Table 1). ANOVA results showed that the clonal phenotypic average values were significantly different in most of the traits (p ≤ 0.001), except for SSD, for which clone averages did not differ significantly (p = 0.94). Moreover, the growth was significantly different for blocks with certain characteristics, showing the environmental effects in the orchard (Table 1).
Average values, ranges, and variation parameters of different traits are shown in Table 2. The average Ht was 11.53 m, with a maximum value of 14.22 m, which was higher than the minimum by over 53%. For diameters at different levels, the highest mean value was observed in BD, which differed from the DBH and DIAM3 by 1.82 cm and 4.36 cm, respectively. Between the maximum average value of volume (0.709 m3) and the minimum, a 40.39% gap was recorded. For stem BT, the maximum average value (9.00 mm) was higher than the minimum one (5.00 mm) by 44%. The SSD showed a gap of less than one unit scale among clones (30% of gap). The maximum average values in crown-related traits were observed in BNN, at over 85%, and the lowest were observed in CB, at 48%. Apart from SSD and CH, the traits with high differences (over 50%) among clonal averages were useful for selecting clones of great genetic value.
To delineate the extent of variation of each trait, phenotypic coefficients of variation (PCV) were calculated. The PCV values ranged from 10.73% to 35.45% (Table 2). The highest PCV (35.45%) was observed in Vol., followed by 29.18% in BNN, and 24.17% in BT. The lowest PCV value (10.76%) was observed in SSD. Characteristics showing greater PCV values, higher than 15%, efficiently supported the selection of the 110 Korean pine clones.
To determine the proportion of the variation that was due to the genotypes of clones, clonal repeatability (R) was computed to separate genotypic and environmental effects on clone growth. The proportion of variation related to the genotypes of clones was thus calculated for each trait. The repeatability values ranged from 0.060 to 0.78 (Table 2). The highest R (0.78) was found in Vol., followed by diameters, DBH, BD, and DIAM3, with 0.767, 0.766, and 0.724, respectively. Ht (0.641), CH (0.601), and BA (0.523) indicated important genotypic influence on the growth of clones in these traits. The lowest R value was observed in SSD (0.060).

3.2. Correlation Analysis

The relationship between traits at the phenotypic and genotypic level was tested by Pearson correlation coefficient. The phenotypic relationships are shown in Table 3. There was strong significant positive correlation between Ht, BD, DBH, DIAM3, CH, and Vol., and between CH and Ht. The highest correlation coefficient was 0.928, between DBH and BD; followed by 0.904 (between the Vol. and DBH and Ht with CH); 0.897 (between the DBH and DIAM3); 0.876 (between Vol. and H); 0.829 (between the BD and DIAM3); 0.801 (between Vol. and DIAM3); 0.708 (between the Vol. and Ht); and 0.671 (between the V and CH). Traits related to the crown (BT and SSD, BA, BNN, CB and CH) were weakly correlated to other traits and to each other. Genotypic correlation coefficients were close to phenotypic correlation coefficients (Figure 2), indicating balanced genotypic and environmental effects on the clones’ growth.

3.3. Principle Components Analysis

Traits displaying high variation in clones were extracted by principal component analysis (PCA) to describe the correlation between growth characteristics and the intended variation concentrated in the principal components. Four principal components were retained from the PCA analysis with a cumulative variance of 82.11% on the total explained variance (Table 4). The four principal components comprised 45.36%, 15.11%, 11.23%, and 10.40%, respectively, of the total variation. In the first principal component (F1), the traits Ht, DB, DBH, DIAM3, Vol., and CH exhibited positive eigenvalues, and loading values ranged from 0.37 to 0.44 and from 0.68 to 0.92 (Table 5 and Table 6). This shows that the F1 primarily represented stem traits, and that these traits would be useful for selecting stem growth, as there is a high positive correlation between these traits and F1 (Table 7). In the second principal component (F2), the absolute values of Ht, CH, BT, and SSD in the eigenvectors and loading vectors were higher but negative, indicating that F2 represented the stem characteristics that would negatively affect the stem selection. In the third principal component (F3), the eigenvalue and loading values of the SSD, CB, and BNN were higher, and the value of SSD was inferior to that shown in F2, which indicated that F3 represented a part of the crown characteristics. In the fourth PC (F4), BNN and BA were higher that might principally describe the crown characteristics. Traits with high eigenvalues and loading values also showed high correlation in the corresponding components (Table 7).

3.4. Regression Analysis

The best regression model for all 11 morphological traits was selected using the statistical parameters of goodness of fit statistics, including MSE, R2, adjusted R2, Mallows’ Cp, Akaike’s AIC, Schwarz’s SBC, and Amemiya’s PC (Table 8). The analysis of variance on the dependent variable (Vol.) showed a significant difference (Table 9), indicating that the regression analysis was feasible when taking the stem volume as the dependent variable. Out of 11 independent variables, only BDH and Ht showed high positive regression coefficients on stem volume (0.71 and 0.39, respectively), t-values of 39.93 and 20.64, Pr < 0.0001 (Table 10), and high positive effects on stem volume (Figure 3). The standardized regression coefficients ranged from −0.97 to 1.64. Based on the Type III sum of squares, Ht, DBH, BTH, BA, CB, and SSD showed significant information to explain the variability of stem volume. Among the explanatory variables, DBH was the most influential.

3.5. Selection Index and Genetic Gain

Based on correlation coefficients and result of PCA analysis, traits Ht, BD, DBH, DIAM3, Vol., and CH were highlighted as the comprehensive evaluation index. The Qi values of different clones in these selected traits ranged from 2.11 to 2.78 (Table 11). With a selection rate of 5%, six clones (PK105, PK104, PK59, PK28, PK36, and K102) exhibited high-growth performances (Figure S1). The Qi values of the six selected clones were 2.78, 2.75, 2.74, 2.67, 2.67, and 2.64; and the corresponding genetic gains were 11.60%, 11.72%, 12.02%, 11.65%, 42.96%, and 12.58% in Ht, BD, DBH, DIAM3, Vol., and CH, respectively (Table 12).

4. Discussion

Different ramets of cloned genotypes may have various phenotypic performances in different microenvironmental conditions [46], which may lead to a certain amount of variation among trees within genotypes. Variation analysis helped to evaluate the magnitude of difference, and also to see if the difference was significant at the individual level, or at the level of the genotype, the blocks, and/or the interaction of blocks and genotypes [47]. In this study, 11 growth characteristics of stem and crown were analyzed on 38-year-old Korean pine clones. Significant differences were found in variance sources (clone and blocks, p ≤ 0.001) for most of the investigated phenotypic characteristics, indicating the feasible selection of clones. These results were almost similar to previous research on the growth, seed, and wood properties of Korean pine [48], although the level of significance in this study seems slightly high, owing probably to different environmental conditions and different genotypes and ages of the studied materials.
When different clones are planted in a macro-site with approximately similar environmental conditions, the clonal average allows the selection of excellent genotypes by minimizing environmental effects at the individual level [49]. Average performances of different genotypes helped to establish a clonal ranking to select the elite ones [42]. In this study, average values of 14.22 m, 39.40 cm, 37.60 cm, 0.71 m3, and 11.40 m in Ht, BD, DBH, DIAM3, Vol., and CH, respectively, and their annual increment (Table 2), were greater than those reported previously for Norway spruce and Casuarina junghuhniana [50,51], reflecting the good growing conditions for Pinus koraiensis at the Naozhi seed orchard.
Variation parameters are mostly considered as the main factors to select trees for breeding purposes [52,53]. In this study, the difference in variation of different traits as given by PCV values varied from 10.73% to 35.45%, which were higher (considering the stand age) in comparison to the study of Lee et al. [54]. This demonstrates that the selection made on this population was well founded, although, compared to those values obtained with Betula platyphylla [43] and Eucalyptus sp. [55], the investigated traits here seem to be less varied. However, these results were close to those reported previously on Korean pine by Liang et al. [11] and Wang et al. [17].
BA, Ht, BD, DBH, DIAM3, CH, and Vol. were highly inherited (0.523 to 0.778) (Table 2), meaning that these traits will be recognized by different clones than CB, BNN, and SSD, which showed lower repeatability of clones (R, 0.060 to 0.392), even for the unique macro site. The high repeatability in this study was in accordance with Yin et al. [56], which reported repeatability of 0.849, 0.687, and 0.362 in Ht, DBH, and SSD, respectively, in Larix olgensis clones.
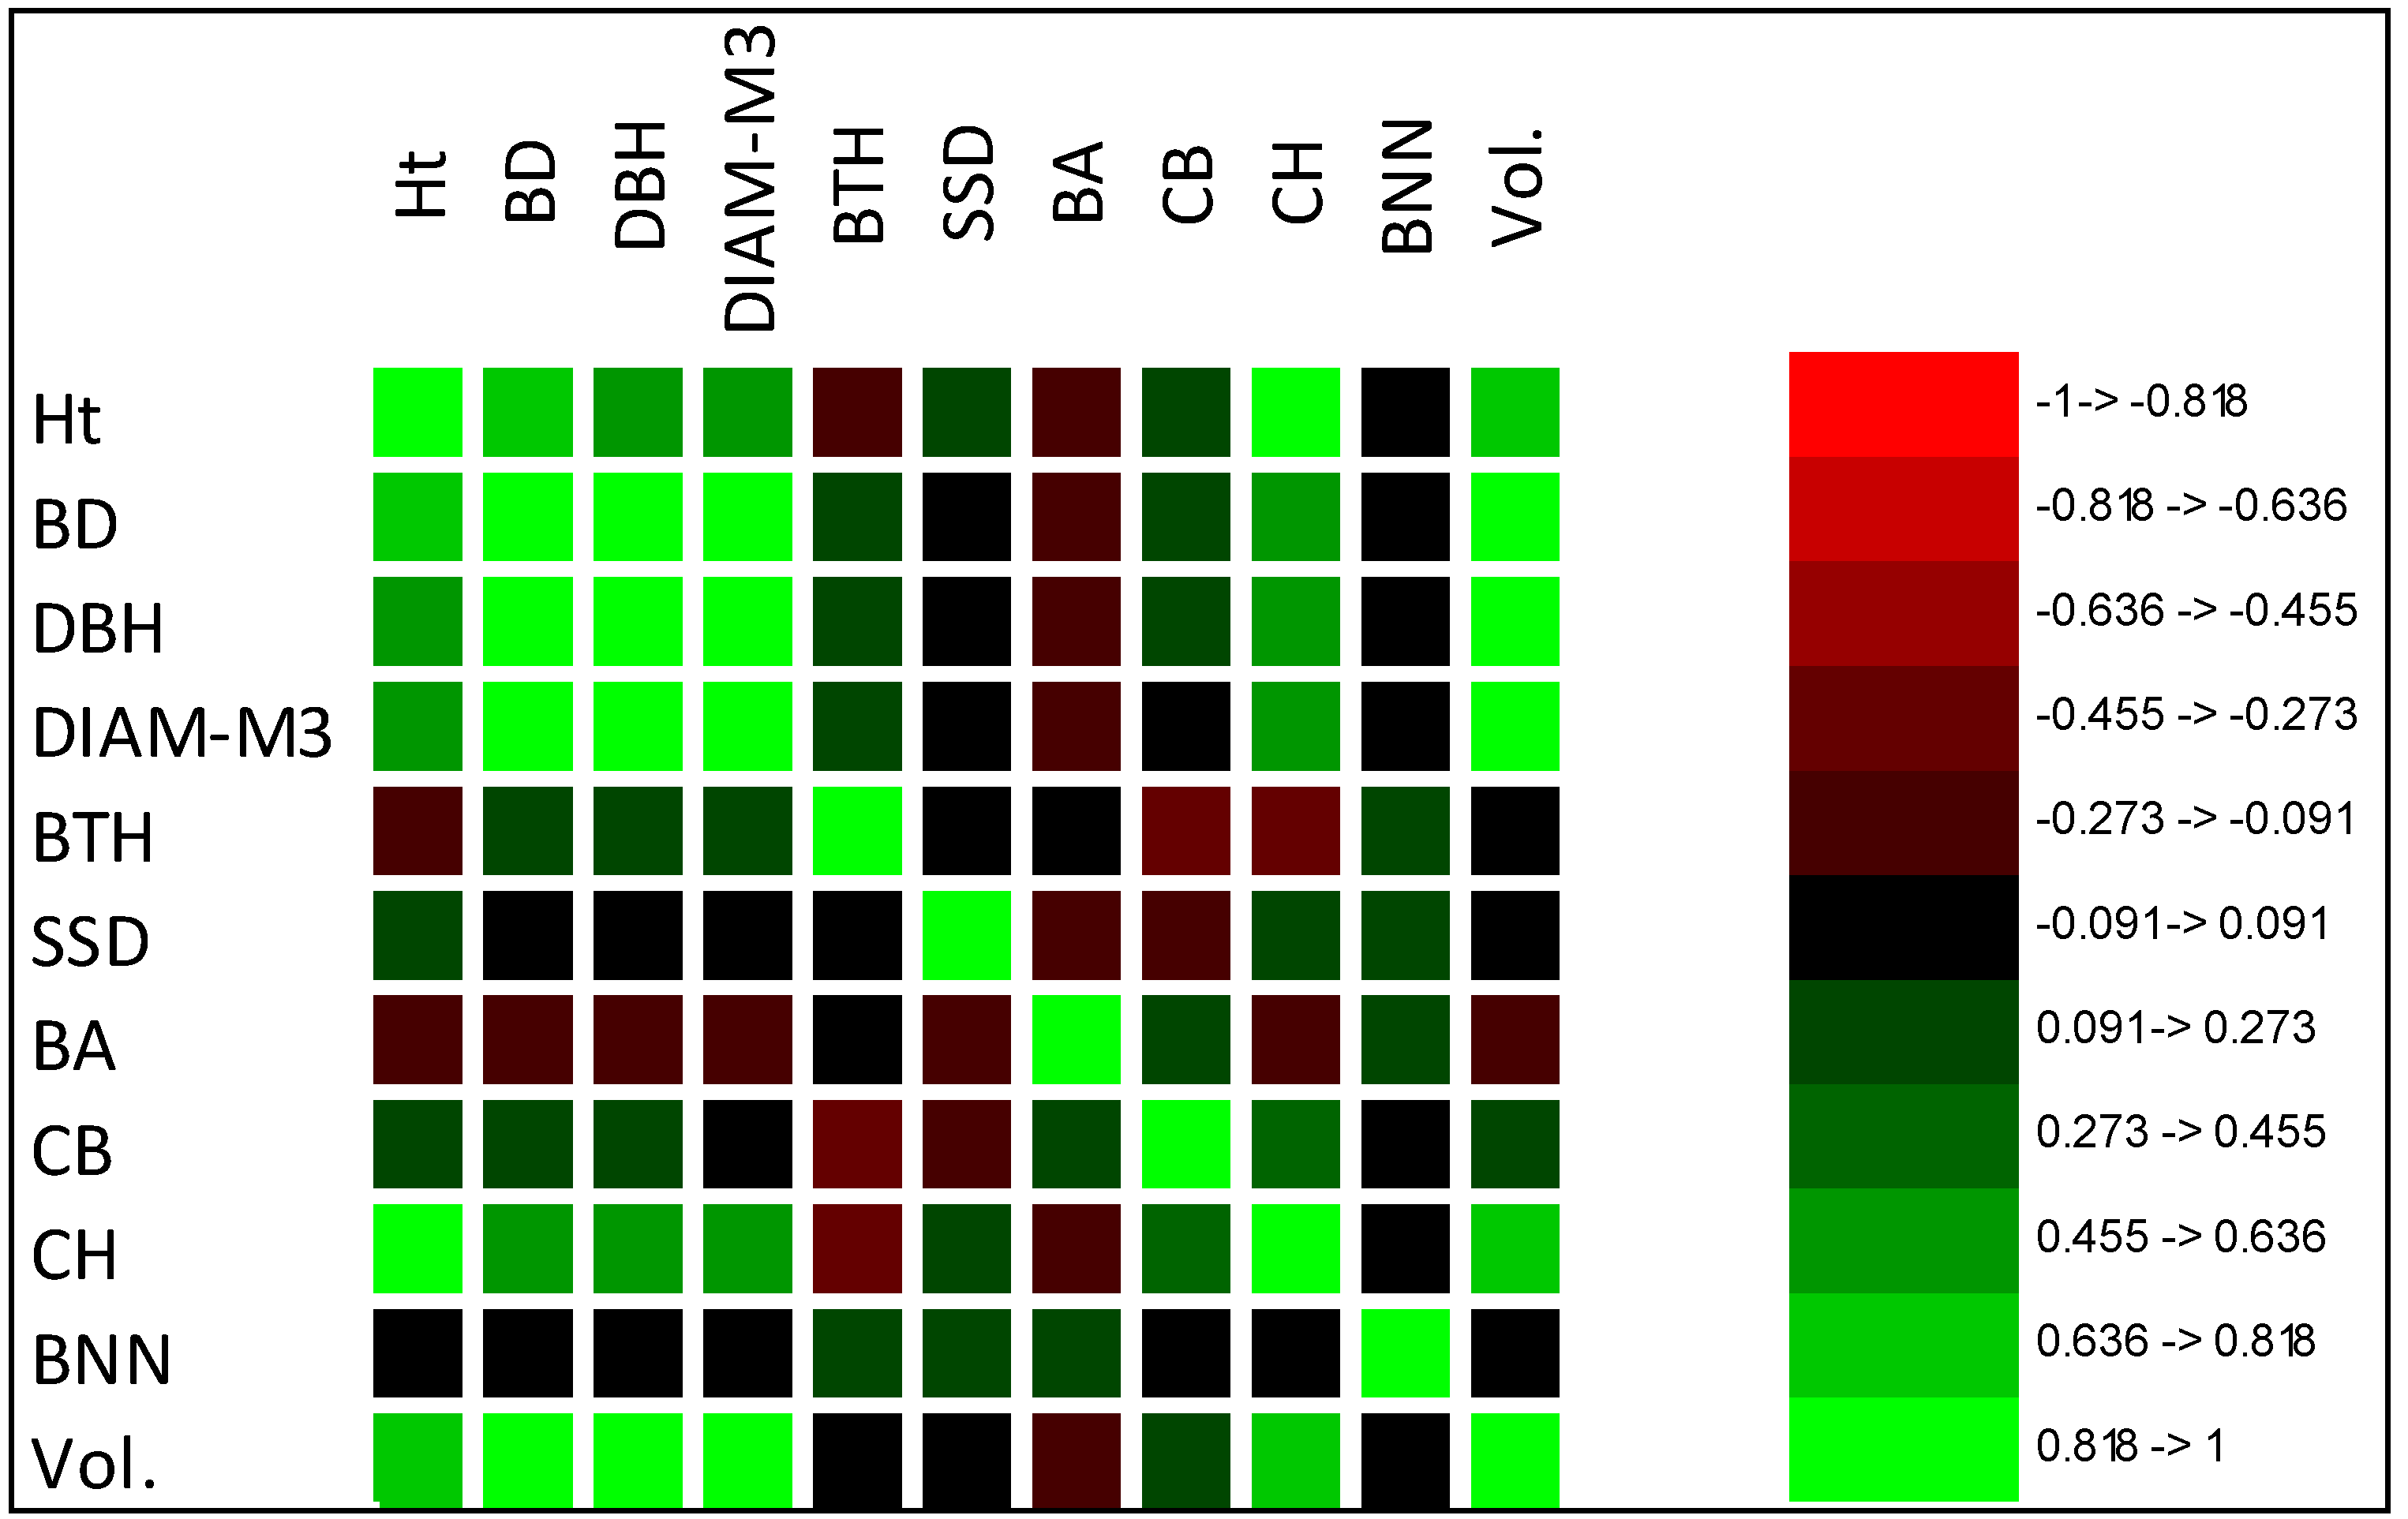
The interdependence of traits was revealed by correlation coefficients [57]. This relationship is an important parameter in tree improvement when selecting for multiple characteristics [58]. High genotypic correlation is a high degree of pleiotropy, signifying that many common gene loci affect several traits [24]. In the present study, moderate to high phenotypic and genotypic correlation was found between Ht, BD, DBH, DIAM3, CH, and Vol., indicating that these traits would be improved simultaneously when selecting elite clones using tree volume as an index [59], whereas SSD, CB, or AB would be slightly improved or would need to be selected independently, as they showed weak and negative correlations with stem volume [59]. The correlation results were in agreement with previous studies by Zhao et al. [41] and Hui et al. [60], suggesting indirect selection of Ht, BD, and DBH by volume in Betula platyphylla and Larix olgensis families in Northeastern China.
Although correlation coefficients explained the inference for traits’ indirect selection, regression coefficients provided more precision to appreciate the influences of trait interactions and traits’ contributions to the related wood yield [61]. Korean pine was firstly bred to improve timber production, and growth traits such as volume were primarily taken into account in the selection process [4]. In this study, tree height, diameter at breast height, and branch number positively influenced the stem volume (Figure S1). DBH was the most influential trait, followed by Ht. In fact, in artificial plantations, growth in tree height and diameter at breast height were reported to be greatly influenced by interline and tree spacing. Wide spacing, for example, promotes growth in diameter, and reduced spacing promotes growth in height [62,63]. Considering individual influence diagnostics, from three to nine genotypes—including PK105, PK104, PK87, PK86, PK84, PK83, PK74, PK69, PK59, and PK57—showed outlier values, taking observation values of the cloned genotypes as a predictor, stem volume in the studentized deleted residuals with threshold was equal to 3, Cook’s distances had a threshold of 0.039, DFFits (Std.) a threshold of 0.603, and DFBetas (Std.) a threshold of 0.191 (Figure S2). Most of these clones were selected for their high growth performances (Figure S3). Regarding the goodness of fit statistics parameters, the fitted regression model significantly explained the instructive variables’ contribution to the wood yield based on stem volume (Table S1). The findings in this study were in agreement with Wang et al. [63], who found that diameter at breast height and tree height were the traits that most affected the stem volume in Korean pine.
PCA is a valuable technique in the selection process because it reduces a large number of indicators to new principal factors (components) that effectively summarize much of the variation in a complex dataset [64]. The method is very important in the selection of multiple traits, determining suitable traits that contribute most to the variation of the materials to be selected [65]. PCA helped to determine the trait that displayed great contributions to the variations in growth, wood, and seed traits [66]. In this study, variance contributions of Vol., DBH, BD, DIAM3, Ht, and CH were high in the PCI, demonstrating that these characteristics are the key traits accounting for most of the variations in these cloned genotypes, and further, they contribute more to wood yield production in the characterized clone population. The accumulating contribution of the first three principal axes accounted for over 82% of the total variation, which was higher compared to Singh et al. [67] and Du et al. [68]. This finding was likewise high compared to the cumulative variation of 78% found in the study of Wang et al. [17], who used PCA to select suitable traits in growth and wood properties of Korean pine. However, the high cumulative amount of variation in PCA in this study may be due to high multicollinearity among traits (Table S2).
Multiple-trait comprehensive evaluation has served as an accurate practice in multiple-trait selection referring to Qi value [41]. Since multiple-trait selection may reduce the genetic gain for some uncorrelated or negatively correlated traits, it is crucial to select appropriate traits to be used as the selection index [69]. Based on correlation coefficients and PCA results, six growth traits—including Ht, BD, DBH, DIAM3, CH, and Vol.—were retained and used to select superior clones in this study. The six elite clones (PK109, PK101, PK14, PK47, PK107, and PK27) displayed high Qi values using a selection rate of 5%. The generated genetic gain reached 42.96% in stem volume (Table 11), which was higher compared to the study of Liang et al. [11], possibly due to high variation (great PCV value) in stem volume in these materials.
Based on growth performance, the economic outcome of the Naozhi orchard was projected. In fact, estimating economic outcome from improved materials is of great importance to know whether outlay-related investments in tree improvement will be covered [70]. The current price reported for P. koraiensis logs was approximately 145.31 USD per cubic meter in Jilin Province [18]. Considering the average volume of clones (0.418 m3), and the genetic gain of 42.96% in volume for elite clones, the price of a single tree will be increased by 26.093 USD (i.e., 15% of the initial price) and the value of the stand volume per hectare will increase by 5325.10 USD with a plant spacing of 7.0 m × 7.0 m, or a density of 204.081 trees/hectare. This achievement was superior to that reported on improved Scots pine in northern Finland after clear-cutting [71]. However, the engendered economic value was significantly higher than that reported on sib-families Korean pine [18], which would be due to the difference in planting age and stand density per hectare, which has been mentioned as having an effect on wood yield per hectare in seed orchards [72].

5. Conclusions

Determining the selection criterion of trees for a breeding program is of great importance in achieving the goal of tree improvement. Out of 11 investigated traits in this study, six were highlighted based on correlation, regression coefficients, and principal component analysis. High coefficient of variance and heritability were observed, indicating that elite clone selection was viable. Strong positive correlation between traits suggested that those growth traits together promote the clone selection. Using the chosen growth traits as evaluation indicators, six P. koraiensis clones were selected as elite clones using a selection rate of 5%. The estimated economic gain was significantly substantial compared to other tree species. The combination of correlation analysis, regression coefficients, and principal components analysis, in addition to multiple-trait comprehensive evaluation, could provide a basis for highlighting useful growth traits and selecting improved varieties of other tree species. A selection integrating logs, wood properties, and seed production would have to be envisioned in the future in order to achieve a performance that takes into account the full economic value of Korean pine.

Supplementary Materials

The following are available online at https://www.mdpi.com/article/10.3390/su13084167/s1, Figure S1: Regression analyses on 11 morphological traits of Korean pine grown at the Naozhi orchard. Tree volume was taken as the independent variable and 10 trunk and branch traits as explanatory variables. The analysis was done in XLSTAT software version 2019-1, (https://www.xlstat.com/en/news/xlstat-version-2019-1, accessed on 27 December 2020); Figure S2: Influence diagnostics of 11 morphological traits of stem and branch in 110 P. koraensis clones at the Naozhi orchard. The stem volume was considered as independent variable. The analysis was done in XLSTAT software version 2019-1 (https://www.xlstat.com/en/news/xlstat-version-2019-1 accessed on 27 December 2020); Figure S3: Selected parent clones of P. koraensis grown in the Naozhi orchard. The figure shows the normal distribution of Qi values on 110 cloned parents. At the right side, the vertical red line highlights the clones in the top 10% of performances. The graph was made using XLSTAT software version 2019-1 (https://www.xlstat.com/en/news/xlstat-version-2019-1, accessed on 27 December 2020); Table S1: Goodness of fit statistics (Vol.); Table S2: Multicollinearity statistics of 11 morphological traits in Korean pine grown at the Naozhi orchard.

Author Contributions

Conceptualization, X.-Y.Z.; data curation, H.-Z.L.; formal analysis, D.K.K.; funding acquisition, X.-Y.Z.; investigation, H.-Z.L.; methodology, D.K.K.; project administration, X.-Y.Z.; resources, X.-Y.Z.; software, D.K.K.; validation, H.-Z.L.; writing—original draft, D.K.K.; writing—review & editing, H.-Z.L. All authors have read and agreed to the published version of the manuscript.

Funding

This research was funded by the Fundamental Research Funds for the Central Universities (2572020DR01).

Institutional Review Board Statement

Not applicable.

Informed Consent Statement

Not applicable.

Data Availability Statement

Not applicable.

Conflicts of Interest

The authors declare no conflict of interest.

References

  1. Wang, H.; Hong, J. Genetic resources, tree improvement and gene conservation of five-needle pines in East Asia. USDA For. Serv. Proc. RMRS-P 2004, 32, 73–78. [Google Scholar]
  2. Ferramosca, A.; Savy, V.; Einerhand, A.; Zara, V. Pinus koraiensis seed oil (PinnoThinTM) supplementation reduces body weight gain and lipid concentration in liver and plasma of mice. J. Anim. Feed. Sci. 2008, 17, 621–630. [Google Scholar] [CrossRef]
  3. Zhang, Z.; Zhang, H.; Zhou, Y.; Liu, L.; Yu, H.; Wang, X.; Feng, W. Variation of seed characters in Korean pine (Pinus koraiensis) multi-clonal populations. J. Beijing For. Univ. 2015, 37, 67–78. [Google Scholar]
  4. Wang, G.; Ning, Y.; Jin, J.; Zhang, S.; Yi, H. Study on the establishment technique of seed orchard for Korean pine improved generations. J. Nor. Univ. 2000, 28, 68–69. [Google Scholar]
  5. Cao, S.; Tian, T.; Chen, L.; Dong, X.; Yu, X.; Wang, G. Damage caused to the environment by reforestation policies in arid and semi-arid areas of China. Ambio 2010, 39, 279–283. [Google Scholar] [CrossRef]
  6. Xia, H.; Zhao, G.; Si, D.; Yin, S.; Li, Y.; Zheng, M.; Zhao, X. Construction and management technology of tree seed orchard in China. J. West China For. Sci. 2016, 45, 46–51. [Google Scholar]
  7. Cheng, T.; Sun, C. Comparative studies on the wood properties of the plantation-and natural-grown korean pines in the northeastern forest region of china. J. Sci. Silvae Sin. 1963, 8, 195–213. [Google Scholar]
  8. Hui-Mei, W.; De-An, X.; Wen-Jie, W.; Shu-Wen, Y. Genetic variations of wood properties and growth characters of Korean pines from different provenances. J. For. Res. 2002, 13, 277–280. [Google Scholar] [CrossRef]
  9. Feng, F.-J.; Sui, X.; Chen, M.-M.; Zhao, D.; Han, H.-J.; Li, M.-H. Mode of pollen spread in clonal seed orchard of Pinus koraiensis. Biophys. Chem. 2010, 1, 33–39. [Google Scholar] [CrossRef] [Green Version]
  10. Li, X.; Liu, X.T.; Wei, J.T.; Li, Y.; Tigabu, M.; Zhao, X.Y. Genetic Improvement of Pinus koraiensis in China: Current situation and future prospects. Forests 2020, 11, 148. [Google Scholar] [CrossRef] [Green Version]
  11. Liang, D.; Ding, C.; Zhao, G.; Leng, W.; Zhang, M.; Zhao, X.; Qu, G. Variation and selection analysis of Pinus koraiensis clones in northeast China. J. For. Res. 2016, 29, 611–622. [Google Scholar] [CrossRef]
  12. Klein, T.; Holzkämper, A.; Calanca, P.; Seppelt, R.; Fuhrer, J. Adapting agricultural land management to climate change: A regional multi-objective optimization approach. Landsc. Ecol. 2013, 28, 2029–2047. [Google Scholar] [CrossRef] [Green Version]
  13. Sniezko, R.A.; Koch, J. Breeding trees resistant to insects and diseases: Putting theory into application. Biol. Invasions 2017, 19, 3377–3400. [Google Scholar] [CrossRef]
  14. White, T.; Hodge, G. Best linear prediction of breeding values in a forest tree improvement program. Theor. Appl. Genet. 1988, 76, 719–727. [Google Scholar] [CrossRef] [PubMed]
  15. Jingmin, J.; Haiqing, S.; Zhaoxi, L. Multitraits Selection of Loblolly Pine Families for Pulpwood. J. For. Res. 1996, 5, 1–12. [Google Scholar]
  16. Leakey, R.; Page, T. The ’ideotype concept’ and its application to the selection of cultivars of trees providing agroforestry tree products. For. Trees Livelihoods 2006, 16, 5–16. [Google Scholar] [CrossRef]
  17. Wang, F.; Zhang, Q.; Tian, Y.; Yang, S.; Wang, H.; Wang, L.; Li, Y.; Zhang, P.; Zhao, X. Comprehensive assessment of growth traits and wood properties in half-sib Pinus koraiensis families. Euphytica 2018, 214, 1–15. [Google Scholar] [CrossRef]
  18. Kaviriri, D.K.; Liu, X.; Fan, Z.; Wang, J.; Wang, Q.; Wang, L.; Wang, L.; Khasa, D.; Zhao, X. Genetic Variation in Growth and Cone Traits of Pinus Koraiensis Half-Sib Families in Northeast China. Phyton 2020, 89, 57–69. [Google Scholar] [CrossRef]
  19. Falconer, D.S. Introduction to Quantitative Genetics; Oliver and Boyd: Edinburgh, UK, 1960. [Google Scholar]
  20. Falconer, D. Introdução à Genética Quantitativa; Tradução de Silva, M.A., Silva, J.C., Eds.; Universidade Federal de Viçosa: Viçosa, Brazil, 1981. [Google Scholar]
  21. Boxriker, M.; Möhring, J.; Piepho, H.P. Genetic and phenotypic correlation for breeding relevant traits in Dianthus caryophyllus L. Postharvest Biol. Technol. 2018, 143, 129–136. [Google Scholar] [CrossRef]
  22. White, T.; Adams, W.; Neale, D. Forest Genetics; Cabi: Cambridge, MA, USA, 2007. [Google Scholar]
  23. Gomes, R.L.; De-Almeida Lopes, Â.C. Correlations and path analysis in peanut. Crop Breed. Appl. Biotechnol. 2005, 5, 105–112. [Google Scholar] [CrossRef] [Green Version]
  24. Szareski, V.J.; Carvalho, I.R.; Demari, G.H.; Kehl, K.; Pelissari, G.; De Pelegrin, A.J.; Barbosa, M.H.; Da Rosa, T.C.; Dos Santos, N.L.; Da silva Martins, T. Path analysis of agronomic traits in soybean cultivars with determinate and indeterminate growing habits. Aust. J. Crop Sci. 2018, 12, 531. [Google Scholar] [CrossRef]
  25. Ferrari, M.; Carvalho, I.R.; De Pelegrin, A.J.; Nardino, M.; Szareski, V.J.; Olivoto, T.; Follmann, D.N.; Pegoraro, C.; Da Maia, L.C.; De Souza, V.Q. Path analysis and phenotypic correlation among yield components of soybean using environmental stratification methods. Aust. J. Crop Sci. 2018, 12, 193. [Google Scholar] [CrossRef]
  26. Jolliffe, I. Principal Component Analysis; International Encyclopedia of Statistical Science; Springer: Berlin/Heidelberg, Germany, 2011. [Google Scholar]
  27. Brewer, M.T.; Moyseenko, J.B.; Monforte, A.J.; Van der Knaap, E. Morphological variation in tomato: A comprehensive study of quantitative trait loci controlling fruit shape and development. J. Exp. Bot. 2007, 58, 1339–1349. [Google Scholar] [CrossRef] [PubMed] [Green Version]
  28. Mayavel, A.; Nagarajan, B.; Muthuraj, K.; Nicodemus, A.; Prabhu, R. Correlation and Path Coefficient Analysis of Selected Red Tamarind (Tamarindus indica var rhodocarpha) Genetic Resources. Int. J. Curr. Microbiol. App. Sci 2018, 7, 794–802. [Google Scholar] [CrossRef] [Green Version]
  29. Xu, Z.; Yu, G.; Zhang, X.; He, N.; Wang, Q.; Wang, S.; Xu, X.; Wang, R.; Zhao, N. Biogeographical patterns of soil microbial community as influenced by soil characteristics and climate across Chinese forest biomes. Appl. Soil Ecol. 2018, 124, 298–305. [Google Scholar] [CrossRef]
  30. Zhu, B.; Wang, X.; Fang, J.; Piao, S.; Shen, H.; Zhao, S.; Peng, C. Altitudinal changes in carbon storage of temperate forests on Mt Changbai, Northeast China. J. Plant Res. 2010, 123, 439–452. [Google Scholar] [CrossRef]
  31. Zhao, X.; Bian, X.; Liu, M.; Li, Z.; Li, Y.; Zheng, M.; Teng, W.; Jiang, J.; Liu, G. Analysis of genetic effects on a complete diallel cross test of Betula platyphylla. Euphytica 2014, 200, 221–229. [Google Scholar] [CrossRef]
  32. Mille, G.; Louppe, D. Mémento du Forestier Tropical; Editions Quae: Versailles, France, 2015. [Google Scholar]
  33. Addinsoft XLSTAT Statistical and Data Analysis Solution. Available online: https://www.xlstat.com (accessed on 1 April 2021).
  34. Field, A. Discovering Statistics Using IBM SPSS Statistics; Sage Publishing: Thousand Oaks, CA, USA, 2013. [Google Scholar]
  35. Barnidge, M.; De Zúñiga, H.G. Amos (software). Int. Encycl. Commun. Res. Methods 2017, 24, 1–3. [Google Scholar]
  36. Gezan, S.A.; White, T.L.; Huber, D.A. Comparison of experimental designs for clonal forestry using simulated data. For. Sci. 2006, 52, 108–116. [Google Scholar]
  37. Aït-Sahalia, Y.; Xiu, D. Principal component analysis of high-frequency data. J. Am. Stat. Assoc. 2018, 114, 1–17. [Google Scholar]
  38. Buzanskas, M.E.; Savegnago, R.P.; Grossi, D.A.; Venturini, G.C.; Queiroz, S.A.; Silva, L.C.; Júnior, R.T.; Munari, D.P.; Alencar, M.M. Genetic parameter estimates and principal component analysis of breeding values of reproduction and growth traits in female Canchim cattle. Reprod. Fertil. Dev. 2013, 25, 775–781. [Google Scholar] [CrossRef] [PubMed]
  39. Zheng, H.Q.; Hu, D.H.; Wang, R.H.; Wei, R.P.; Yan, S. Assessing Chinese Fir (Cunninghamia lanceolata) breeding parents in a 12-year grafted clone test. Forests 2015, 6, 3799–3808. [Google Scholar] [CrossRef] [Green Version]
  40. Porth, I.; White, R.; Jaquish, B.; Ritland, K. Partial correlation analysis of transcriptomes helps detangle the growth and defense network in spruce. N. Phytol. 2018, 218, 1349–1359. [Google Scholar] [CrossRef] [PubMed] [Green Version]
  41. Pan, Y.; Pei, X.; Wang, F.; Wang, C.; Shao, L.; Dong, L.; Zhao, X.; Qu, G.-Z. Forward, backward selection and variation analysis of growth traits in half-sib Larix kaempferi families. Silvae Genet. 2019, 68, 1–8. [Google Scholar]
  42. Hai, P.H.; Jansson, G.; Harwood, C.; Hannrup, B.; Thinh, H.H. Genetic variation in growth, stem straightness and branch thickness in clonal trials of Acacia auriculiformis at three contrasting sites in Vietnam. For. Ecol. Manag. 2008, 255, 156–167. [Google Scholar] [CrossRef]
  43. Zhao, X.; Xia, H.; Wang, X.; Wang, C.; Liang, D.; Li, K.; Liu, G. Variance and stability analyses of growth characters in half-sib Betula platyphylla families at three different sites in China. Euphytica 2016, 208, 173–186. [Google Scholar] [CrossRef]
  44. Couto, A.; Teodoro, P.; Trugilho, P. Path analysis of the energy density of wood in Eucalyptus clones. GMR 2017, 16, 1–17. [Google Scholar] [CrossRef]
  45. Francisco, F.; Messias, G.; Helaine, C.; Pedro, C.; Telma, N.; Ana, P.; Alexandre, P.; Geraldo, A. Selection and estimation of the genetic gain in segregating generations of papaya (Carica papaya L.). Crop Breed. Appl. Biotechnol. 2008, 8, 1–8. [Google Scholar]
  46. Egbäck, S.; Liziniewicz, M.; Högberg, K.-A.; Ekö, P.-M.; Nilsson, U. Influence of progeny and initial stand density on growth and quality traits of 21 year old half-sib Scots pine (Pinus sylvestris L.). For. Ecol. Manag. 2012, 286, 1–7. [Google Scholar] [CrossRef]
  47. Schwaegerle, K.E.; McIntyre, H.; Swingley, C. Quantitative genetics and the persistence of environmental effects in clonally propagated organisms. Evolution 2000, 54, 452–461. [Google Scholar] [CrossRef] [PubMed]
  48. Liang, D.; Yunzhe, J.; Guanghao, Z.; Yuanhai, D.; Weiwei, L.; Changlin, C.; Huan, W.; Zhao, X.Y. Variance analyses of growth and wood characteristics of 50 Pinus koraiensis clones. J. Beijing For. Univ. 2016, 38, 51–59. [Google Scholar]
  49. Yeong-Wan, S.; Balekoglu, S.; Jung-Kee, C. Growth pattern analysis by stem analysis of Korean white pine (Pinus koraiensis) in the central northern region of Korea. For. Sci. Technol. 2014, 10, 220–226. [Google Scholar] [CrossRef] [Green Version]
  50. Saltz, J.B.; Bell, A.M.; Flint, J.; Gomulkiewicz, R.; Hughes, K.A.; Keagy, J. Why does the magnitude of genotype-by-environment interaction vary? Ecol. Evol. 2018. [Google Scholar] [CrossRef] [PubMed]
  51. Osorio, L.F.; White, T.L.; Huber, D.A. Age trends of heritabilities and genotype-by-environment interactions for growth traits and wood density from clonal trials of Eucalyptus grandis Hill ex Maiden. Silvae Genet. 2001, 50, 108–116. [Google Scholar]
  52. Levkoev, E.; Kilpeläinen, A.; Luostarinen, K.; Pulkkinen, P.; Mehtätalo, L.; Ikonen, V.-P.; Jaatinen, R.; Zhigunov, A.; Kangas, J.; Peltola, H. Differences in growth and wood density in clones and provenance hybrid clones of Norway spruce. Can. J. For. Res. 2017, 47, 389–399. [Google Scholar] [CrossRef]
  53. Luechanimitchit, P.; Luangviriyasaeng, V.; Laosakul, S.; Pinyopusarerk, K.; Bush, D. Genetic parameter estimates for growth, stem-form and branching traits of Casuarina junghuhniana clones grown in Thailand. For. Ecol. Manag. 2017, 404, 251–257. [Google Scholar] [CrossRef]
  54. Lee, D.; Choi, J. A study on stand structure and growth characteristics of Korean white pine (Pinus koraiensis) in north central region of Gangwon province. JFES 2014, 30, 101–106. [Google Scholar]
  55. Yang, H.; Weng, Q.; Li, F.; Zhou, C.; Li, M.; Chen, S.; Ji, H.; Gan, S. Genotypic Variation and Genotype-by-Environment Interactions in Growth and Wood Properties in a Cloned Eucalyptus urophylla × E. tereticornis Family in Southern China. Science 2018, 64, 225–232. [Google Scholar] [CrossRef]
  56. Yin, S.; Xiao, Z.; Zhao, G.; Zhao, X.; Sun, X.; Zhang, Y.; Wang, F.; Li, S.; Zhao, X.; Qu, G.-Z. Variation analyses of growth and wood properties of Larix olgensis clones in China. J. For. Res. 2017, 28, 687–697. [Google Scholar] [CrossRef]
  57. Gleason, S.M.; Stephens, A.E.; Tozer, W.C.; Blackman, C.J.; Butler, D.W.; Chang, Y.; Cook, A.M.; Cooke, J.; Laws, C.A.; Rosell, J.A. Shoot growth of woody trees and shrubs is predicted by maximum plant height and associated traits. Funct. Ecol. 2018, 32, 247–259. [Google Scholar] [CrossRef] [Green Version]
  58. Hassegawa, M.; Savard, M.; Lenz, P.R.; Duchateau, E.; Gélinas, N.; Bousquet, J.; Achim, A. White spruce wood quality for lumber products: Priority traits and their enhancement through tree improvement. Int. J. For. Res. 2020, 93, 16–37. [Google Scholar] [CrossRef]
  59. Lande, R. The genetic covariance between characters maintained by pleiotropic mutations. Genetics 1980, 94, 203–215. [Google Scholar] [PubMed]
  60. Hui, X.; Guohui, Z.; Liansheng, Z.; Xiaoyang, S.; Shaopeng, Y.; Liang, D.; Li, Y.; Mi, Z.; Xiyang, Z. Genetic and variation analyses of growth traits of half-sib Larix olgensis families in northeastern China. Euphytica 2016, 212, 387–397. [Google Scholar] [CrossRef]
  61. Sjolte-Jørgensen, J. The influence of spacing on the growth and development of coniferous plantations. Int. J. For. Res. 1967, 2, 43–94. [Google Scholar]
  62. Pretzsch, H.; Biber, P.; Uhl, E.; Dahlhausen, J.; Rötzer, T.; Caldentey, J.; Koike, T.; Van Con, T.; Chavanne, A.; Seifert, T.; et al. Crown size and growing space requirement of common tree species in urban centres, parks, and forests. Urban For. Urban Green. 2015, 14, 466–479. [Google Scholar] [CrossRef] [Green Version]
  63. Wang, Q.B.; Zhang, Y.B.; Zou, W.; Tao, S.Y.; Wei, B. Correlation and path analysis on new poplar variety growth traits. For. Sci. Technol. 2011, 36, 5–7. [Google Scholar]
  64. Kanapeckas, K.; Tseng, T.M.; Vigueira, C.C.; Ortiz, A.; Bridges, W.C.; Burgos, N.R.; Fischer, A.J.; Lawton-Rauh, A. Contrasting patterns of variation in weedy traits and unique crop features in divergent populations of US weedy rice (Oryza sativa sp.) in Arkansas and California. Pest Manag. Sci. 2018, 74, 1404–1415. [Google Scholar] [CrossRef] [Green Version]
  65. Chase, K.; Carrier, D.R.; Adler, F.R.; Jarvik, T.; Ostrander, E.A.; Lorentzen, T.D.; Lark, K.G. Genetic basis for systems of skeletal quantitative traits: Principal component analysis of the canid skeleton. Proc. Natl. Acad. Sci. USA 2002, 99, 9930–9935. [Google Scholar] [CrossRef] [Green Version]
  66. Denton, O.; Nwangburuka, C. Genetic variability in eighteen cultivars of Solanum anguivi Lam. using principal component analysis (PCA) and single linkage cluster analysis (SLCA). Ann. Biol. Res. 2011, 2, 62–67. [Google Scholar]
  67. Singh, N.B.; Sharma, J.P.; Huse, S.K.; Thakur, I.K.; Gupta, R.K.; Sankhyan, H.P. Heritability, genetic gain, correlation and principal component analysis in introduced willow (Salix species) clones. Indian For. 2012, 138, 1100–1109. [Google Scholar]
  68. Du, Q.; Xu, B.; Gong, C.; Yang, X.; Pan, W.; Tian, J.; Li, B.; Zhang, D. Variation in growth, leaf, and wood property traits of Chinese white poplar (Populus tomentosa), a major industrial tree species in Northern China. Can. J. For. Res. 2014, 44, 326–339. [Google Scholar] [CrossRef]
  69. Guan, L.; Pan, H.; Huang, M.; Shi, J. Research on growth and wood properties joint genetic improvement of new clones of Poplus deltoides (I-69) × P. euramericana (I-45). J. Nan. For. Univ. 2005, 29, 6–10. [Google Scholar]
  70. Wu, H.X.; Eldridge, K.G.; Matheson, A.C.; Powell, M.B.; Mcrae, T.A.; Butcher, T.B.; Johnson, I.G. Achievements in forest tree improvement in Australia and New Zealand 8. Successful introduction and breeding of radiata pine in Australia. Aust. For. 2007, 70, 215–225. [Google Scholar] [CrossRef]
  71. Ahtikoski, A.; Pulkkinen, P. Cost-benefit analysis of using orchard or stand seed in Scots pine sowing, the case of northern Finland. New For. 2003, 26, 247–262. [Google Scholar] [CrossRef]
  72. Ahmed, A.K.M.; Fu, Z.; Ding, C.; Jiang, L.; Han, X.; Yang, A.; Ma, Y.; Zhao, X. Growth and wood properties of a 38-year-old Populus simonii × P. nigra plantation established with different densities in semi-arid areas of northeastern China. J. For. Res. 2020, 31, 497–506. [Google Scholar] [CrossRef]
Figure 1. Geographic location of the Naozhi orchard in Jilin province at northeast China. Map crafted with ArcGIS version 10.5.
Sustainability 13 04167 g001
Figure 2. Genotypic correlation coefficients of 11 morphological traits in 110 P. koraiensis clones grown at the Naozhi orchard. The analysis was performed in XLSTAT software version 2019-1, (on https://www.xlstat.com/en/news/xlstat-version-2019-1, accessed on 27 December 2020).
Sustainability 13 04167 g002
Figure 3. Path diagram of 11 morphological growth characteristics of 110 Korean pine clones at the Naozhi orchard.
Sustainability 13 04167 g003
Table 1. ANOVA analysis of growth traits in 110 P. koraiensis grown at the Naozhi orchard.
TraitsSourceSSdfMSFSig.
HtBlocks89.779.009.975.190.000
Clones620.89109.005.702.9650.000
BDBlocks384.499.0042.722.540.007
Clones7287.22109.0066.863.980.000
DBHBlocks118.079.0013.120.890.530
Clones6810.67109.0062.484.260.000
DIAM-M3Blocks162.959.0018.111.170.313
Clones6228.94109.0057.153.690.000
BTHBlocks159.149.0017.687.020.000
Clones542.44109.004.981.980.000
SSDBlocks8.709.000.9738.960.000
Clones5.47109.000.052.020.943
BABlocks3209.179.00356.570.690.710
Clones114,639.21109.001051.742.060.000
CBBlocks46.369.005.1515.740.000
Clones77.35109.000.712.1680.000
CHBlocks52.159.005.792.860.003
Clones601.49109.005.522.720.000
BNNBlocks94.649.005.522.720.000
Clones12.89109.005.792.860.000
Vol.Blocks0.259.000.031.980.040
Clones6.98109.000.0644.490.000
Df, SS, MS, and F were, respectively, degrees of freedom, sum of square, mean square, and F value in the F test. Ht, BD, DBH, BNN, DIAM3, CH, BT, SDD, BA, CB, and Vol. indicate tree height, basal diameter, diameter at breast height, diameter at 3 m height, branch number per node, crown height, bark thickness, stem straightness degree, branch angle, crown breadth, and volume, respectively. The same abbreviations are used in tables below.
Table 2. Average values, ranges, phenotypic coefficients of variations (PCV), and repeatability of growth traits in 110 P. koraiensis grown at the Naozhi orchard.
Traits (Unit)Mean_SERangesStd. DeviationPCVR
Ht (m)11.53 ± 0.069.25–14.221.6314.110.64
BD (cm)34.76 ± 0.1926.17–41.784.8513.960.77
DBH (cm)32.95 ± 0.0724.50–39.402.414.290.77
DIAM3 (cm)30.45 ± 0.1823.00–37.604.715.430.72
BT (mm)7.25 ± 0.075.00–9.001.7524.170.39
SSD (-)1.86 ± 0.011.63–2.120.2010.730.06
BA (°)142.39 ± 0.96107.50–168.324.3217.080.52
CB (m)3.84 ± 0.033.00–4.800.7619.870.32
CH (m)8.94 ± 0.066.83–11.401.6318.280.60
BNN (-)2.92 ± 0.032.10–3.780.8529.180.23
Vol. (m3)0.42 ± 0.010.20–0.710.1535.450.78
Table 3. Phenotypic correlation coefficients between growth traits of 110 P. koraiensis clones grown at the Naozhi orchard.
TraitsHtBDDBHDIAM-M3BTHSSDBACBCHBNNVol.
Ht1.0000.639 **0.601 **0.579 **−0.224 *0.137−0.1250.246 **0.965 **0.0850.807 **
BD 1.0000.943 **0.892 **0.1590.038−0.1600.1660.624 **0.0590.919 **
DBH 1.0000.932 **0.1550.047−0.192 *0.0990.582 **0.0010.943 **
DIAM-M3 1.0000.235 *0.075−0.1790.0730.541 **0.0330.889 **
BTH 1.0000.0510.024−0.305 **−0.304 **0.1130.049
SSD 1.000−0.158−0.195 *0.0970.1590.075
BA 1.0000.133−0.1820.095−0.181
CB 1.0000.277 **0.0450.146
CH 1.0000.0830.778 **
BNN 1.0000.060
Vol. 1.000
** indicates strong significant correlation at the 0.01 level (2-tailed); * indicates significant correlation at the 0.05 level (2-tailed).
Table 4. Principal component analysis of growth traits in 110 P. koraiensis grown at the Naozhi orchard.
F1F2F3F4F5F6F7F8F9F10F11
Eigenvalue4.991.661.241.140.740.620.410.100.060.030.01
Variability (%)45.3615.1111.2410.406.695.673.740.930.510.260.09
Cumulative %45.3660.4771.7182.1188.8094.4798.2199.1499.6599.91100.00
Table 5. Eigenvectors in PCA analysis of growth traits in 110 P. koraiensis grown at the Naozhi orchard.
TraitsF1F2F3F4
Ht0.841−0.3380.2070.072
BD0.930.169−0.1730.003
DBH0.9260.223−0.164−0.072
DIAM-M30.8940.288−0.161−0.028
BTH0.0140.828−0.2760.176
SSD0.1050.2530.7610.237
BA−0.23−0.174−0.5170.529
CB0.210−0.661−0.3150.177
CH0.825−0.4030.2270.030
BNN0.070.0740.1870.856
Vol.0.9840.052−0.046−0.004
Table 6. Factor load matrix in PCA analysis of growth traits in 110 P. koraiensis grown at the Naozhi orchard.
TraitsF1F2F3F4
Ht0.841−0.3380.2070.072
BD0.9300.169−0.1730.003
DBH0.9260.223−0.164−0.072
DIAM-M30.8940.288−0.161−0.028
BTH0.0140.828−0.2760.176
SSD0.1050.2530.7610.237
BA−0.226−0.174−0.5170.529
CB0.210−0.661−0.3150.177
CH0.825−0.4030.2270.030
BNN0.0730.0740.1870.856
Vol.0.9840.052−0.046−0.004
Table 7. Correlations between variables and extracted factors in PCA analysis of growth traits in 110 P. koraiensis grown at the Naozhi orchard.
TraitsF1F2F3F4
Ht0.841−0.3380.2070.072
BD0.9300.169−0.1730.003
DBH0.9260.223−0.164−0.072
DIAM-M30.8940.288−0.161−0.028
BTH0.0140.828−0.2760.176
SSD0.1050.2530.7610.237
BA−0.226−0.174−0.5170.529
CB0.210−0.661−0.3150.177
CH0.825−0.4030.2270.030
BNN0.0730.0740.1870.856
Vol.0.9840.052−0.046−0.004
Table 8. Summary of the variables’ selection in regression analysis of growth traits in 110 P. koraiensis grown at Naozhi Orchard.
Nbr. of VariablesVariablesMSER2Adjusted R2Mallows’ CpAkaike’s AICSchwarz’s SBCAmemiya’s PC
1DBH0.1120.8900.889486.876−239.468−236.7670.112
2Ht/DBH0.0210.9800.9793.713−423.422−418.0210.021
3Ht/DBH/BNN0.0200.9800.9801.513−425.714−417.6130.021
4Ht/DBH/BTH/BNN0.0200.9810.9801.371−425.971−415.1690.021
5Ht/DBH/SSD/CB/BNN0.0200.9810.9801.461−426.022−412.5200.021
6Ht/DBH/BTH/SSD/CB/BNN0.0200.9810.9802.106−425.501−409.2980.021
7Ht/BD/DBH/BTH/SSD/CB/BNN0.0200.9810.9804.009−423.609−404.7050.021
8Ht/BD/DBH/BTH/SSD/CB/CH/BNN0.0200.9810.9806.004−421.614−400.0100.021
9Ht/BD/DBH/BTH/SSD/BA/CB/CH/BNN0.0200.9810.9808.001−419.617−395.3130.022
10Ht/BD/DBH/DIAM-M3/BTH/SSD/BA/CB/CH/BNN0.0210.9810.98010.000−417.618−390.6130.022
The best model for the chosen selection criterion is displayed in bold and italic.
Table 9. Analysis of variance in regression analysis of growth traits in 110 P. koraiensis grown at the Naozhi orchard.
SourceDFSum of SquaresMean SquaresFPr > F
Model6108.9418.16916.17<0.0001
Error1042.060.02
Corrected total110111.00
Computed against model Y = 0.
Table 10. Model parameters in regression analysis of growth traits in 110 P. koraiensis grown at the Naozhi orchard.
SourceValueStandard ErrortPr > |t|Lower Bound (95%)Upper Bound (95%)
Intercept0.00
Ht0.390.0220.643<0.00010.3530.428
BD0.000.00
DBH0.710.0238.936<0.00010.6730.745
DIAM-M30.000.00
BTH0.020.071.1870.238−0.0120.049
SSD−0.020.014−1.5090.134−0.0490.007
BA0.000.000
CB−0.020.015−1.3790.171−0.0500.009
CH0.000.000
BNN0.030.0142.0760.0400.0010.056
Table 11. Comprehensive evaluation of 110 Korean pine clones grown at the Naozhi orchard.
ClonesQiClonesQiClonesQiClonesQiClonesQi
PK1052.78PK942.55PK82.48PK252.43PK42.34
PK1042.75PK462.54PK302.47PK622.42PK212.33
PK592.74PK542.54PK342.47PK682.42PK722.33
PK282.67PK482.54PK112.47PK702.42PK982.33
PK362.67PK102.53PK1032.47PK862.41PK902.32
PK1022.64PK262.53PK692.46PK432.41PK752.32
PK1092.64PK192.53PK1062.46PK52.41PK822.32
PK1012.63PK512.53PK32.46PK552.4PK912.32
PK142.62PK1002.53PK602.46PK22.4PK772.3
PK472.62PK372.52PK392.46PK182.39PK732.29
PK1072.61PK402.52PK532.46PK582.38PK442.27
PK272.6PK642.52PK382.45PK62.38PK202.26
PK322.6PK932.52PK122.45PK452.37PK762.26
PK412.59PK332.52PK352.45PK422.37PK972.23
PK802.59PK952.51PK662.45PK922.37PK742.22
PK562.59PK312.51PK232.45PK522.37PK852.19
PK242.56PK132.51PK652.44PK882.37PK792.19
PK172.56PK92.51PK162.44PK502.37PK712.18
PK12.56PK72.5PK992.44PK962.36PK842.17
PK292.56PK222.5PK1082.44PK782.36PK812.16
PK672.56PK892.5PK612.44PK492.34PK832.13
PK632.55PK572.49PK152.43PK1102.34PK872.11
Table 12. Genetic gain in selected growth traits of 110 Korean pines grown at the Naozhi orchard.
TraitsGenetic Gains (%)
Ht11.60
BD11.72
DBH12.02
DIAM311.65
CH12.58
Vol.42.96
Publisher’s Note: MDPI stays neutral with regard to jurisdictional claims in published maps and institutional affiliations.

