Article

Interactive Effects of Biosynthesized Nanocomposites and Their Antimicrobial and Cytotoxic Potentials

1
Microbiology Department, Faculty of Science, Ain Shams University, Cairo 11566, Egypt
2
Agricultural Microbiology Department, National Research Centre, 33 El-Bohouth Street, (Former El-Tahrir Street) Dokki, Giza 12622, Egypt
3
Microbiology Department, The Regional Center for Mycology and Biotechnology, Al-Azhar University, Cairo 11651, Egypt
*
Author to whom correspondence should be addressed.
Nanomaterials 2021, 11(4), 903; https://doi.org/10.3390/nano11040903
Submission received: 1 March 2021 / Revised: 26 March 2021 / Accepted: 27 March 2021 / Published: 1 April 2021

Abstract

:
The present study investigated the biosynthesis of silver (AgNPs), zinc oxide (ZnONPs) and titanium dioxide (TiO2NPs) nanoparticles using Aspergillusoryzae, Aspergillusterreus and Fusariumoxysporum. Nanocomposites (NCs) were successfully synthesized by mixing nanoparticles using a Sonic Vibra-Cell VC/VCX processor. A number of analytical techniques were used to characterize the synthesized biological metal nanoparticles. Several experiments tested biologically synthesized metal nanoparticles and nanocomposites against two types of human pathogenic bacteria, including Gram-positive Staphylococcus aureus and methicillin-resistant Staphylococcus aureus (MRSA), and Gram-negative Escherichia coli and Pseudomonasaeruginosa. Additionally, the antitumor activity in HCT-116 cells (colonic carcinoma) was also evaluated. Significant antimicrobial effects of various synthesized forms of nanoparticles and nanocomposites against E. coli and P. aeruginosa bacteria were detected. Various synthesized biogenic forms of nanoparticles and nanocomposite (9.0 to 29 mm in diameter) had high antibacterial activity and high antitumor activity against HCT-116 cells (colonic carcinoma) with IC50 values of 0.7–100 µg/mL. Biosynthesized NPs are considered an alternative to large-scale biosynthesized metallic nanoparticles and nanocomposites, are simple and cost effective, and provide stable nanomaterials.

1. Introduction

Biological synthesis of metal nanoparticles (NPs) is a new environmentally friendly approach in the context of green nanotechnology. The process of biological synthesis provides a wide range of environmentally acceptable methodologies and is cost effective, eco-friendly and very rapid [1]. These methods overcome the harmful effects on the environment caused by chemical synthesis. Biologically synthesized nanoparticles have many applications, such as catalysts of chemical reactions, biological labeling, antimicrobial agents, electrical batteries and optical receptors [2]. Microbial sources of nanoparticle production via metabolic activity are of great interest for nanoparticle precipitation.
Silver nanoparticles (AgNPs) have been widely used in the medical and cosmetic industries because of their unique antimicrobial properties [3]. AgNPs have a potent inhibitory effect against both Gram-negative (−ve) and Gram-positive (+ve) bacteria and yeasts on a large scale [4,5]. Recently, AgNPs were reported to destroy and damage the bacterial cell membrane; however, silver metal itself is considered a very good antibacterial agent [6,7]. Ag can destroy the structure of bacterial DNA; thus, respiratory enzymes in bacteria become inactivated due to the interaction of AgNPs with thiol groups; [8,9] additionally, AgNPs play an important role in the protection against human pathogenic bacteria, such as Escherichia coli (E. coli) and Staphylococcus aureus (Staph. aureus).
Zinc oxide is considered safe according to 21CFR182.8991 of the Food and Drug Administration of the United States of America (FDA) [10,11]. ZnO nanoparticles have enhanced antibacterial properties and efficiency, and effectively inhibit human pathogenic bacteria [12]. ZnONPs have great antibacterial effects against both Gram-positive (+ve) and Gram-negative (−ve) bacteria [13]. The antibacterial activity of ZnONPs increases concomitant to a decrease in particle size [14]. Development of zinc oxide-based therapeutic systems is expected to produce promising results [15].
Titanium dioxide is a metal that has special properties, such as good resistance to chemical erosion, nontoxicity, antimicrobial and anticancer effects [16]. TiO2 is attractive because it is stable, insoluble, nontoxic, resistant to corrosion and relatively inexpensive. Whether commercial or self-synthesized, TiO2 powders have significant variations in their structure, particle size and electronic properties that play a significant role in the photoactivity of TiO2. The photodegradation behaviors depend on the crystal structure of TiO2 [17].
Many strategies are available to overcome antibiotic resistance, including a reduction in the large use of antimicrobials, collection and analysis of the data, avoidance of inappropriate use of antimicrobial agents in farm animals, and development of new drugs and nanotechnology [18]. The development of nanotechnology has resulted in the synthesis of nano-sized organic and inorganic molecules with potential applications in textiles, medicine, food packaging, industry, and therapeutics. The development of new nano-sized antibacterial agents and nanocomposites can be an alternative strategy used to overcome antimicrobial resistance [18]. AgNPs have limited applications in the human body and have toxic effects on human cell lines [6]. Recently, silver has been shown to have a significant enhancing effect on the antibacterial activity of titanium dioxide because of the synergistic effect of nano-silver [7].
Ag-NPs and ZnO-NPs have been proved to have effective antimicrobial activity at very low concentrations even to resistant strains of microbes [19]. This is because they destroy many biological pathways in a cell and it would necessitate the microorganism to go through many concurrent transmutations to develop resistance [20]. Furthermore, they need very short contact time to cause a long-lasting cell growth inhibition [21]. Recently, the Ag/ZnO nanocomposite has been found to show enhanced antimicrobial activity against common microbes compared to the individual nanoparticles [22]. This is because the properties of the hybrid are not just the sum of the individual advantages of both nanoparticles but are derived from their synergic effect which creates a new class of hybrid-nanomaterials [23].
Bactericidal properties of silver-titanium dioxide nanocomposites in killing bacteria and viruses have been reported [24]. Metallic silver increases the photocatalytic activity of conjugated titanium dioxides, thereby decreasing the band gap of titanium dioxide to decrease the recombination of the charge carriers photoexcited from the valence point to the conduction band of titanium dioxide.
The degradation of organic pollutants is due to photoexcited charge carriers, and degradation of organic pollutants is specifically caused by holes, which act by forming high levels of hydroxyl radicals [25]. The presence of silver within titanium dioxide increases the antibacterial activity because of cell wall and membrane damage by AgNPs [26]. The Ag-TiO2 nanocomposites are advantageous for several reasons: (a) the antimicrobial effect and potential toxicity of titanium dioxide to normal cells are low because of the presence of a very low nontoxic concentration of silver, and titanium dioxide shows no cytotoxicity in the human body or cells; (b) strong photocatalytic effect-dependent removal of organic pollutants from wastewater; and (c) ability to destroy bacteria found in contaminated wastewater. The photocatalytic and antibacterial effects of TiO2-Ag nanocomposites have been documented in some studies; however, characterization of their structure and microstructure was not described [27,28]. The mechanism of action was not clearly discussed in recent studies [27]. To enhance the photocatalytic performance of various morphological shapes of nanocomposites, such as nanotubes, nanosheets were prepared as documented in some previous studies [29]. The synergistic activity of silver in the titanium dioxide matrix produces a potentially antibacterial material. In almost all cases, nanocomposite synthesis is considered to be highly complex because it requires expensive chemicals and several steps are time-consuming [30,31].
In this study, nanocomposites were synthesized by fast and facile mechanical alloying. Various biosynthesized nanoparticles and nanocomposites with antibacterial properties and antitumor efficiency were produced and can be applied in several biomedical products, which use metals nanoparticles (MNPs) and metal nanocomposites (MNPCs) for electrode modification.

2. Materials and Methods

Three isolates of Aspergillusoryzae, Aspergillusterreus and Fusariumoxysporum were isolated from soil and selected due to their growth and production of nanoparticles [32]. The isolates were selected based on the high efficiency for biosynthesis nanoparticles.

2.1. Biosynthesis of Silver (AgNPs), Zinc Oxide (ZnONPs) and Titanium Dioxide (TiO2NPs) Nanoparticles

For biosynthesis, the biomass of fungal cells was prepared, and fungi were aerobically grown in modified liquid Czapeck Dox medium (sucrose 30 g, NaNO3 2.0 g, KH2PO4 1 g, MgSO4 × 7H2O 0.5 g, KCl0.5 g and FeCl3 × 6H2O 0.001 g [33]) in 250 mL Erlenmeyer flasks containing 100 mL medium for the preparation of AgNPs and ZnONPs; TiO2NPs were prepared in malt extract broth (malt extract 30 g and peptone 5 g, pH 5.4 ± 0.2 [34]). The inoculated fungal isolates in the flasks were agitated at 150 rpm and incubated on an orbital shaker at 28 °C. Fungal biomass was harvested using a plastic sieve, and Milli-Q deionized water was used for extensive washing to remove any extra medium components from the fungal biomass. Fresh fungal biomass (20 g) was mixed with 100 mL of Milli-Q deionized water for 72 h at 28 °C in an Erlenmeyer flask and washed by agitation. The cell filtrate was collected after incubation by passing through Whatman filter paper No 1. The production of nanoparticles AgNPs, ZnONPs and TiO2NPs was performed as reported previously [14,35,36,37]. For synthesis of AgNPs, ZnONPs and TiO2NPs, zinc oxide (10 mM ZnO), titanium dioxide (5 mM TiO2) and silver nitrate (1.5 mM) were mixed with 50 mL of the fungal cell filtrate in a 250 mL Erlenmeyer flask and agitated in an orbital shaker for 5 min. A flask containing the control fungal cell filtrate without the metal ions was used as a control.

2.2. Preparation of Nanocomposites

Nanoparticles were mixed as shown in Table 1; 700 µg of AgNPs was added to 10 mL of double deionized water (DDW); 1400 µg of ZnONPs was added to 10 mL DDW, and 800 µg of TiO2NPs was added to 10 mL DDW. Then, the particles were mixed using a Sonic Vibra-Cell VC/VCX 750 processor at (NRC) National Research Centre, Cairo, Egypt; the samples were examined using UV spectrophotometry, FTIR, and TEM before and after sonication.

2.3. Characterization of Biosynthesized AgNPs, ZnONPs, TiO2NPs and Nanocomposites

The properties of AgNPs, ZnONPs, TiO2NPs and nanocomposites were determined based on ultraviolet–visible absorption spectra (UV-2401 PC) at wavelengths ranging from 200 to 800 nm. For FTIR spectroscopy analysis, vacuum-dried AgNPs, ZnONPs, TiO2NPs and nanocomposites were mixed with potassium bromide (KBr) at a ratio of 1:100, and the spectra were recorded by a Shimadzu 8400S instrument. Scanning data were acquired from the average of 49 data scans within the range from 4000 to 400 cm−1 to identify the functional groups involved in metal reduction and in the synthesis of nanoparticles and nanocomposites. The liquid reaction mixture after bioreduction was dried at 45 °C in a vacuum drying oven. Then, the dried mixture was collected for the determination of the formation of nanoparticles and nanocomposite. The purity phase, structure and crystallinity of the dried nanoparticles and nanocomposites were determined by analyzing their XRD patterns (Philips Analytical X-ray) at 30 kV, 20 mA with Cu Kα radiation. The spectra were analyzed, recorded and processed by WIN-FIT software [38]. The nanoparticles and nanocomposites were used to prepare a film on a carbon-coated copper grid for transmission electron microscopy and were analyzed at a voltage of 120 kV by a transmission electron microscope (Tecnai 120) [39].

2.4. Evaluation of Antibacterial Activity

Bacteriostatic activities were determined using four strains; the isolates being selected considering their availability, for measuring the antimicrobial effect including Gram-negative (−ve) bacteria Escherichia coli O157H7 and Pseudomonas aeruginosa ATCC10145 and Gram-positive (+ve) bacteria Staphylococcus aureus NRC 23,516 and methicillin-resistant Staphylococcus aureus (MRSA) NRC 629012. The isolated cultures were provided by the Agricultural Microbiology Department, National Research Centre, Cairo, Egypt. All bacterial strains were stored as frozen stocks at −80 °C (Protect Bacterial Preservation System, Technical Service Consultants) and maintained on Luria agar (LA) medium at 37 °C. Ampicillin antibiotic sensitivity disks were used to test the effect of a particular antibiotic on various bacterial cultures; each disk contained 10 µg ampicillin, which decreased the chance of developing resistance to antibiotics by bacterial strains. The bacteriostatic activities of nanoparticles were investigated by the disc diffusion method [40]. LB agar media were prepared in plates, sterilized and solidified; then, the bacterial cultures were plated using a swab. MNPs and nanocomposites (NCs) solutions at various concentrations (6.25, 12.5, 25, 50 and 100 μL) were placed in agar plates, which were incubated at 37 °C for 24 h. The inhibition zones were identified, measured and compared with the control samples (cell-free water extract).

2.5. Determination of the Antitumor Activity

HCT-116 (colonic carcinoma) cells were obtained from the VACSERA Tissue Culture Unit, Dokki, Egypt. Crystal violet staining was used to determine the cytotoxicity of the synthesized NPs and NCs in HCT116 tumor cells. Approximately 1 × 10⁴ cells were added to each well of 96-well culture plates for 24 h and incubated in a humidified atmosphere of 95% air and 5% CO2. The biosynthesized NPs and NCs were added at 0.2–100 μg/mL concentrations to HCT116 cells and incubated for 36 h. The control cells were treated with DMSO. Twenty microliters of crystal violet solution were added to each well for staining after the incubation, and the samples were incubated for an additional 4 h. Then, 200 μL DMSO was added. For the crystal violet assay, cells were stained at room temperature by 0.5% crystal violet (Sigma-Aldrich Corp., St. Louis, MO, USA) in 30% ethanol for 10 min. Cells were lysed by adding 1% SDS (sodium dodecyl sulfate) solution. The absorbance of the solution was determined using an ELISA plate reader at a wavelength of 595 nm [40]. To assess the potency of the antitumor activity of the compounds, the IC50 values were calculated as a concentration that inhibited cell viability corresponding to 50% viability of the control cells. The IC50 values (the half maximal inhibitory concentration) were calculated based on the best fit (R2 > 0.95) R2 = the square of the correlation of the Hill slope curve by nonlinear regression analysis of experimental data using Graph Pad Prism (version 5, Graph Pad Software, Inc., La Jolla, USA) according to the equation Y = 100/(1 + 10^((X − LogIC50) where (X) is log of dose, (Y) is the value of growth inhibition normalized to the control, and Hill Slope is a unitless slope factor [41].
Cell Viability was determined as follows [41]:
Cell Viability (%) = (Abs S/Abs C) × 100
where Abs S is the absorbance of the cells treated with NPs or NC and Abs C is the absorbance of untreated cells (control).

2.6. The statistical Analysis

All statistical analyses were performed using the SPSS (Statistical Package for the Social Sciences) software package (SPSS Inc., Routledge, NY, USA) and Excel (Microsoft, Routledge, NY, USA). The resulting data were used for the analysis of variance, and significant differences between the mean values were evaluated by using Duncan’s multiple range tests (p < 0.05).

3. Results

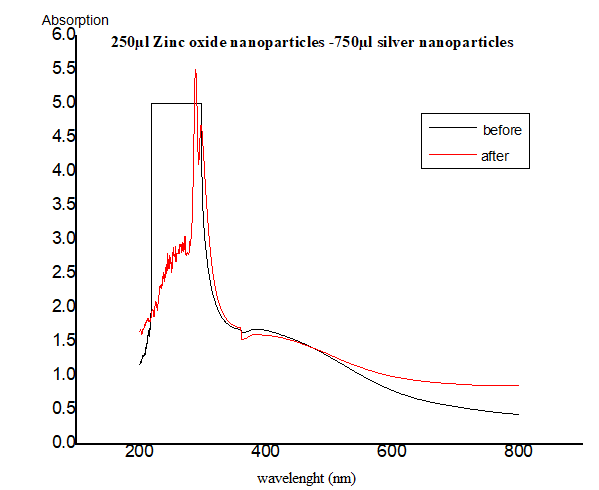
3.1. The UV–Vis Spectra

The ultraviolet absorption spectra were recorded after 72 h of the reaction of the cell filtrate with silver nitrate, zinc oxide and titanium dioxide metal ions (Figure 1). Extinction peaks were identified at approximately 420 nm for AgNPs, 377 nm for ZnONPs, and 360 nm for TiO2NPs. The reaction was evaluated after 72 h of incubation, and the peak intensity demonstrated an increase in the reaction progress corresponding to an increase in the number of NPs. The spectra of 14 nanocomposites were recorded before and after sonication; the results of Figure 2 show that the best NCs production was achieved by the composites of 500 μL AgNPs with 500 μL ZnONPs, 750 μL AgNPs with 250 μL ZnONPs, and 750 μL TiO2NPs with 250 μL ZnONPs, which had clear peaks on the UV spectra; the remaining nanocomposites did not show any peaks (not shown). These three nanocomposites were selected for further study based on the results of UV spectroscopy.

3.2. FTIR Spectrum of Nanoparticles

Figure 3A shows FTIR spectral analysis of AgNPs, ZnONPs and TiO2NPs. The FTIR spectrum of AgNPs showed a band at 3411 cm−1 assigned based on the characteristics of the hydroxyl groups and surface-adsorbed water. Appearance of the absorbance peaks at 3230 cm−1 corresponded to the stretching vibration of the NH stretching of Amide A. Additionally, the bands at 1631 and 1509 cm−1 corresponded to the stretching vibrations of C=C and Amide II. The absorption bands at 523 cm−1 corresponded to the stretching vibration of the oxygen-stretched bond.
FTIR for ZnONPs the groups at 3444 cm−1 were assigned to the surface-adsorbed water and the hydroxyl moiety of the ZnONPs groups. An absorbance peak at 3226 cm−1 corresponded to the stretching vibration of the N-H stretching bond, and a peak at 1458 cm−1 corresponded to the bending vibrations of –COO. A peak at 1385 cm−1 was assigned to the bending vibrations of the residual NO3. The absorption peaks at 592 and 438 cm−1 corresponded to the bending vibrations of =C-H bending and oxygen-stretched bonds.
A band in the FTIR spectrum of TiO2NPs at 3422 cm−1 was assigned to the stretching vibration of the hydroxyl group (O-H stretching) of TiO2NPs, and the bands at 1638 cm−1 corresponded to the bending vibrations of the N-H bond because of dihydrogen titanate phase formation. A peak at 1384 cm−1 indicated the formation of amide linkages, and a peak at 1095 cm−1 corresponded to the stretching vibration of C=C. The absorption bands at 762 and 445 cm−1 corresponded to the =C-H bending and oxygen-stretched bonds, respectively.
The FTIR spectrum analysis of composite nanoparticles of 500 μL AgNPs with 500 μL ZnONPs prepared without sonication with Sonic Vibra-Cell showed intense absorption bands at 870 cm−1 assigned to the C-N-C ring bending; a peak at 1196 cm−1 corresponded to the C-O stretching bond; the bands at 1428 and 3925 cm−1 were assigned to the C-C ring vibration stretching and N-H stretching (Amide A band), respectively. Treatment with Sonic Vibra-Cell resulted in appearance of intense absorption bands at 425 and 480 cm−1 corresponding to the -C stretching (Figure 3B).
A peak at 616 cm−1 was assigned to the C-C=O bond bending; a peak at 987 cm−1 was assigned to the O stretching vibration; the peaks at 1340 cm and 1398 cm−1 were assigned to aliphatic C-H bending and scissoring of CH3 and CH2 and C-H bending, respectively, and a peak at 2745 cm−1 was assigned to the aldehyde C-H bending. FTIR spectrum analysis of the composite nanoparticles formed by 750 μL AgNPs with 250 μL ZnONPs without treatment with Sonic Vibra-Cell showed intense absorption bands at 871, 1992 and 3767 cm−1 corresponding to the C-N-C ring bending, -N=C=N-, -N3, C=C=O, and NH and OH stretching, respectively. Treatment with Sonic Vibra-Cell resulted in appearance of intense absorption bands at 409, 1268, 1312 and 2075 cm−1 corresponding to the -C stretching, Amide III, C-N stretching of aromatic amine and C≡C stretching that was not present in symmetrical alkynes (Figure 3C).
FTIR spectrum analysis of composite nanoparticles formed by 750 μL TiO2NPs with 250 μL ZnONPs without treatment with Sonic Vibra-Cell showed intense absorption bands at 580, 871 and 3926 cm−1 corresponding to the hydroxyl group of the O-H compounds, C-N-C ring bending and N–H stretching bands (Amide A band), respectively. Treatment with Sonic Vibra-Cell resulted in appearance of intense absorption bands at 420 and 499 cm−1 associated with the -C stretching. A peak at 1194 cm−1 was assigned to C-O stretching; a peak at 1262 cm−1 corresponded to Amide III; the peaks at 1518.67, 1870.61 and 2069.25 cm−1 in Figure 3D corresponded to the absorption bands associated with CH2 and CH3, C=O and N=C=S, respectively.

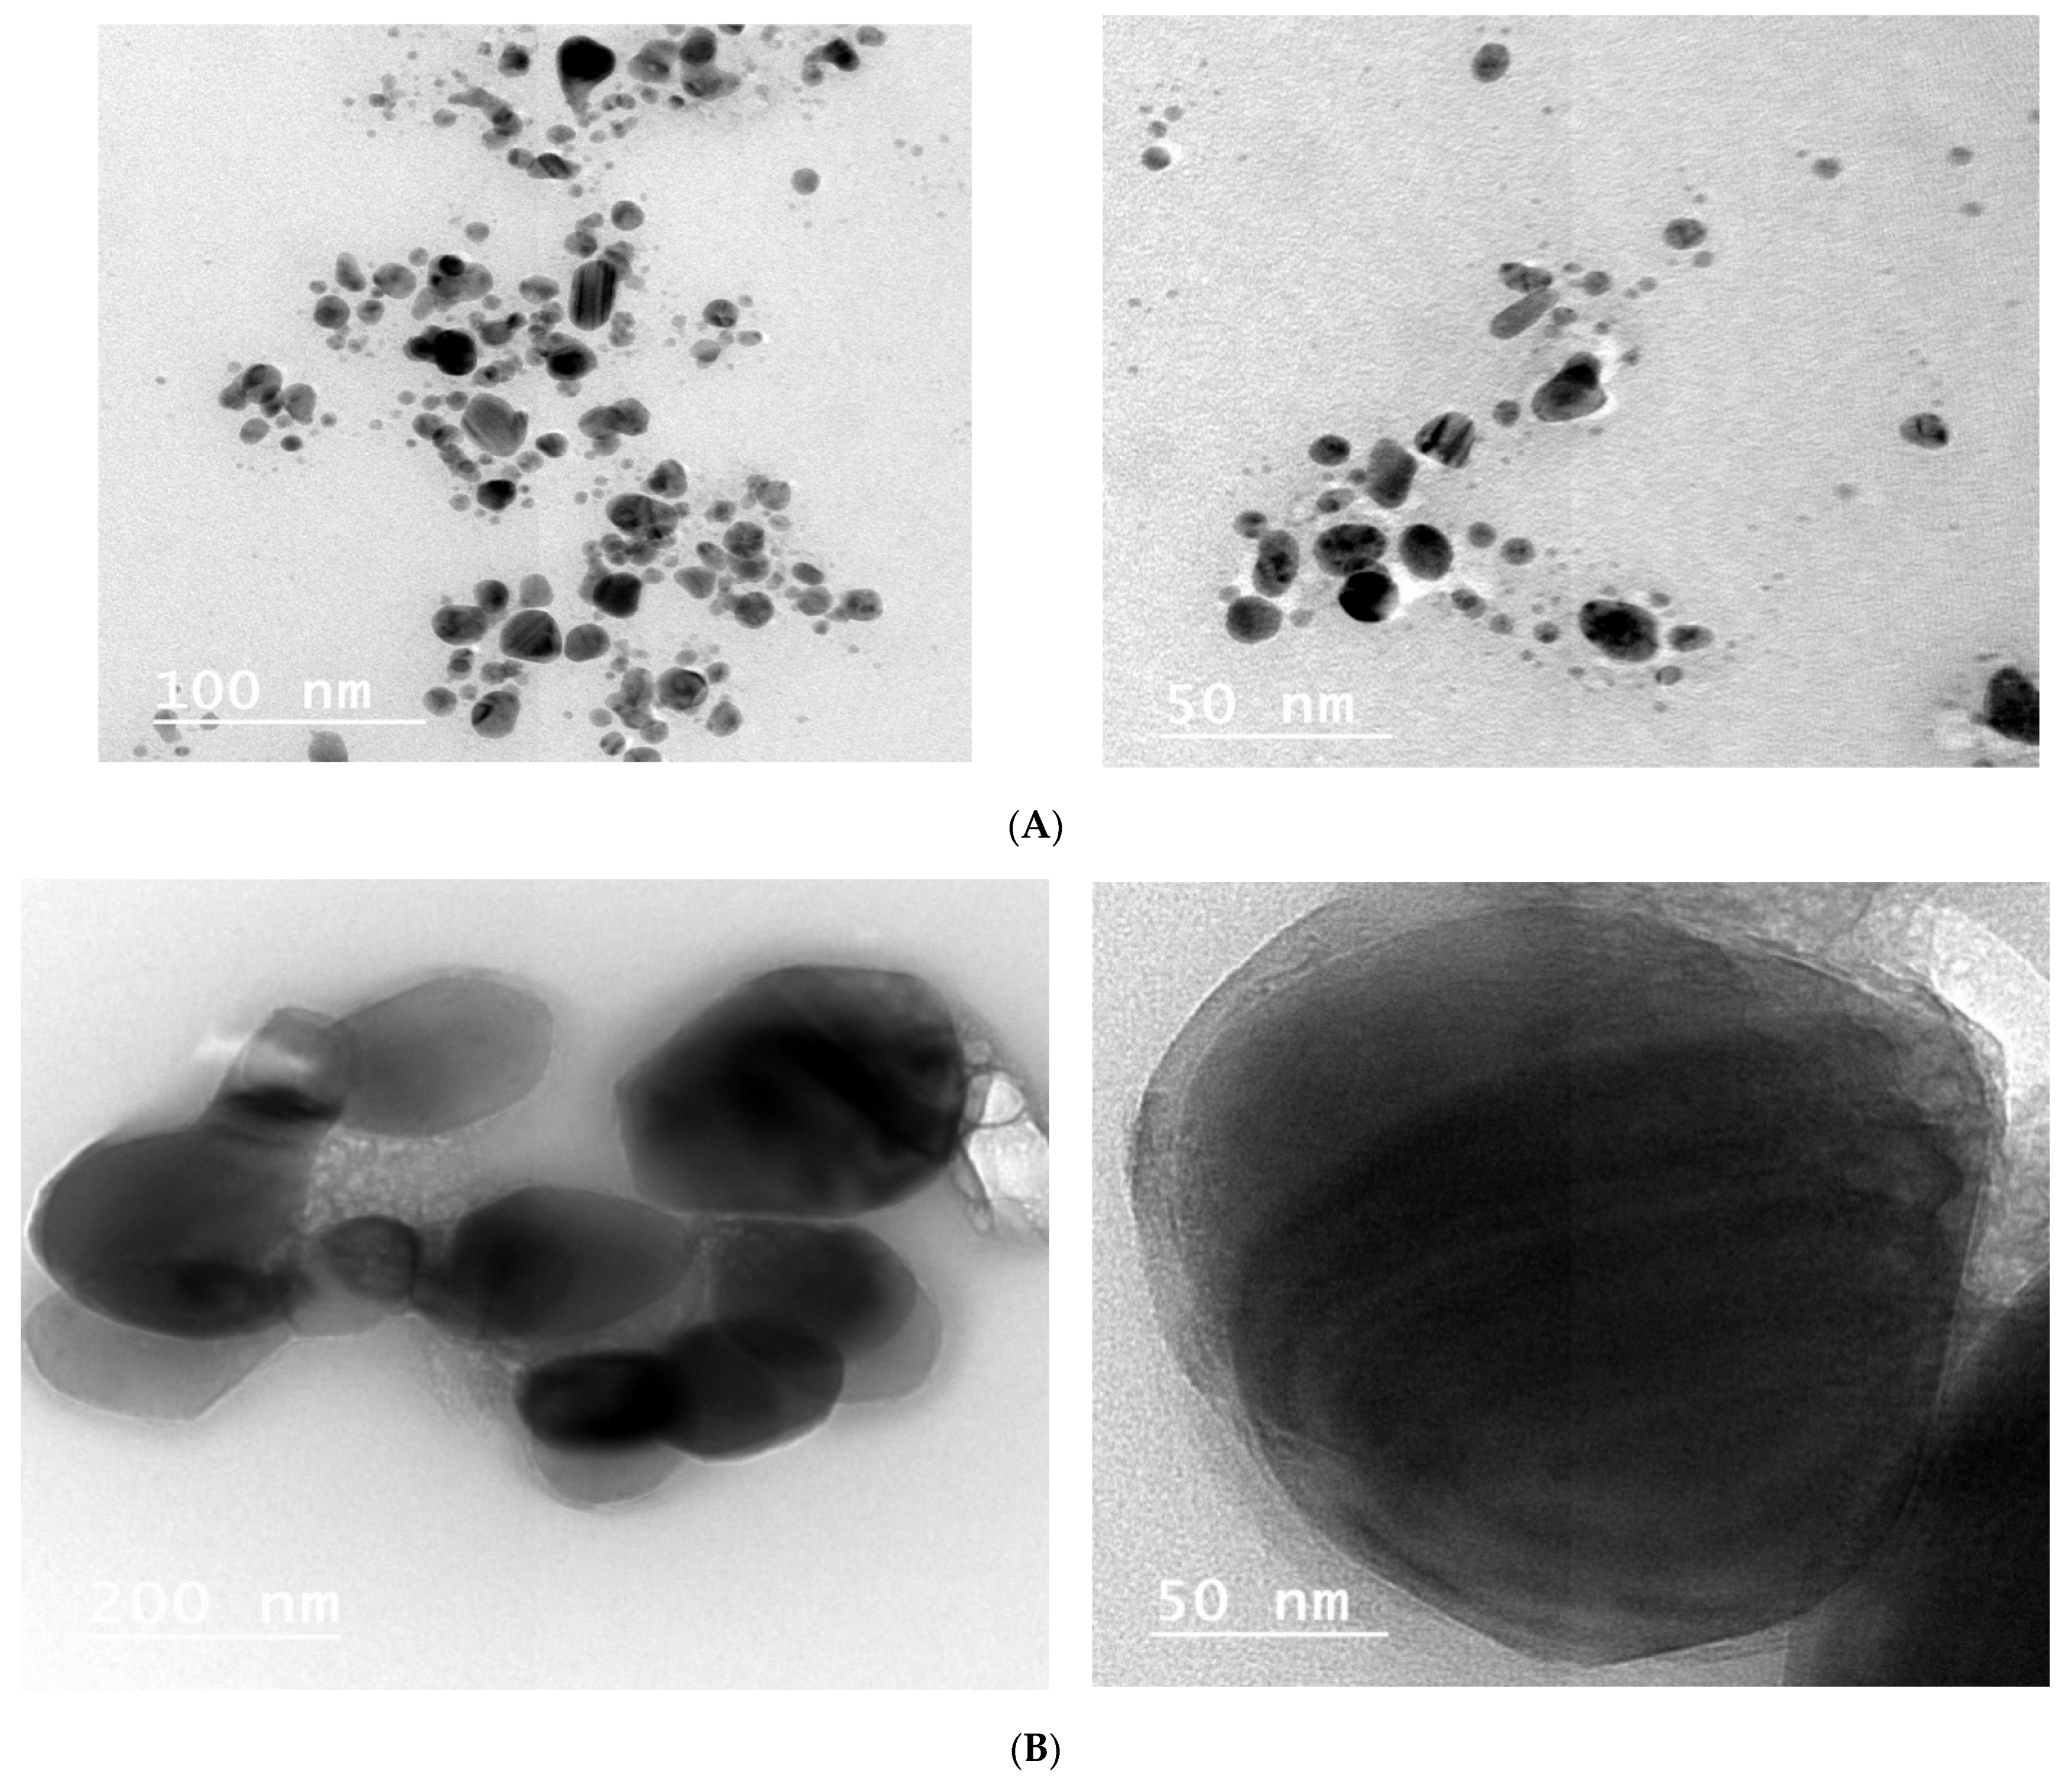
3.3. Analysis of Transmission Electron Microscope Images

The transmission electron microscopy images (Figure 4A–C) indicated that nanoparticles are spherical in shape with a wide range of size distributions. The larger particles appeared to consist of a number of small particles in an agglomerated shape. TEM microscopy images of AgNPs are shown in Figure 4A. The size of nanoparticles was in the range of approximately 5–30 nm; the spherical regular shape had smooth surfaces; and the distribution frequency included nanoparticles in the 10–15 nm range. TEM images of ZnONPs are shown in Figure 4B. The nanoparticles had regular cubic or spherical shape with smooth surfaces within approximately 70–130 nm size; almost all nanoparticles were 110 nm in size. On the other hand, the TEM image in Figure 4C shows that the TiO2NPs had a regular spherical shape with smooth surfaces and a size distribution within the range of approximately 50–90 nm. TEM shows that almost all particle sizes were 70 nm.
Figure 5 shows a diversity of the particle sizes of various composite nanoparticles before and after sonication. Additionally, the TEM images suggest that the particles were poly compact after sonication. The images of 500 μL AgNP–500 μL ZnONPs in Figure 5A,B show a polyhedral shape of Ag with ZnO dots on the surface of the particles. After sonication of TiO2 and ZnO NCs, the nanorods and flakes in zinc oxide were changed to a spherical shape, as shown in Figure 5E,F. A typical transmission electron microscopy image of the titanium dioxide–zinc oxide nanocomposite material was very similar to that of titanium dioxide and zinc oxide and looked like a sandwich. Similarly, transmission electron microscopy showed high-magnification images of the titanium dioxide-zinc oxide nanocomposite.

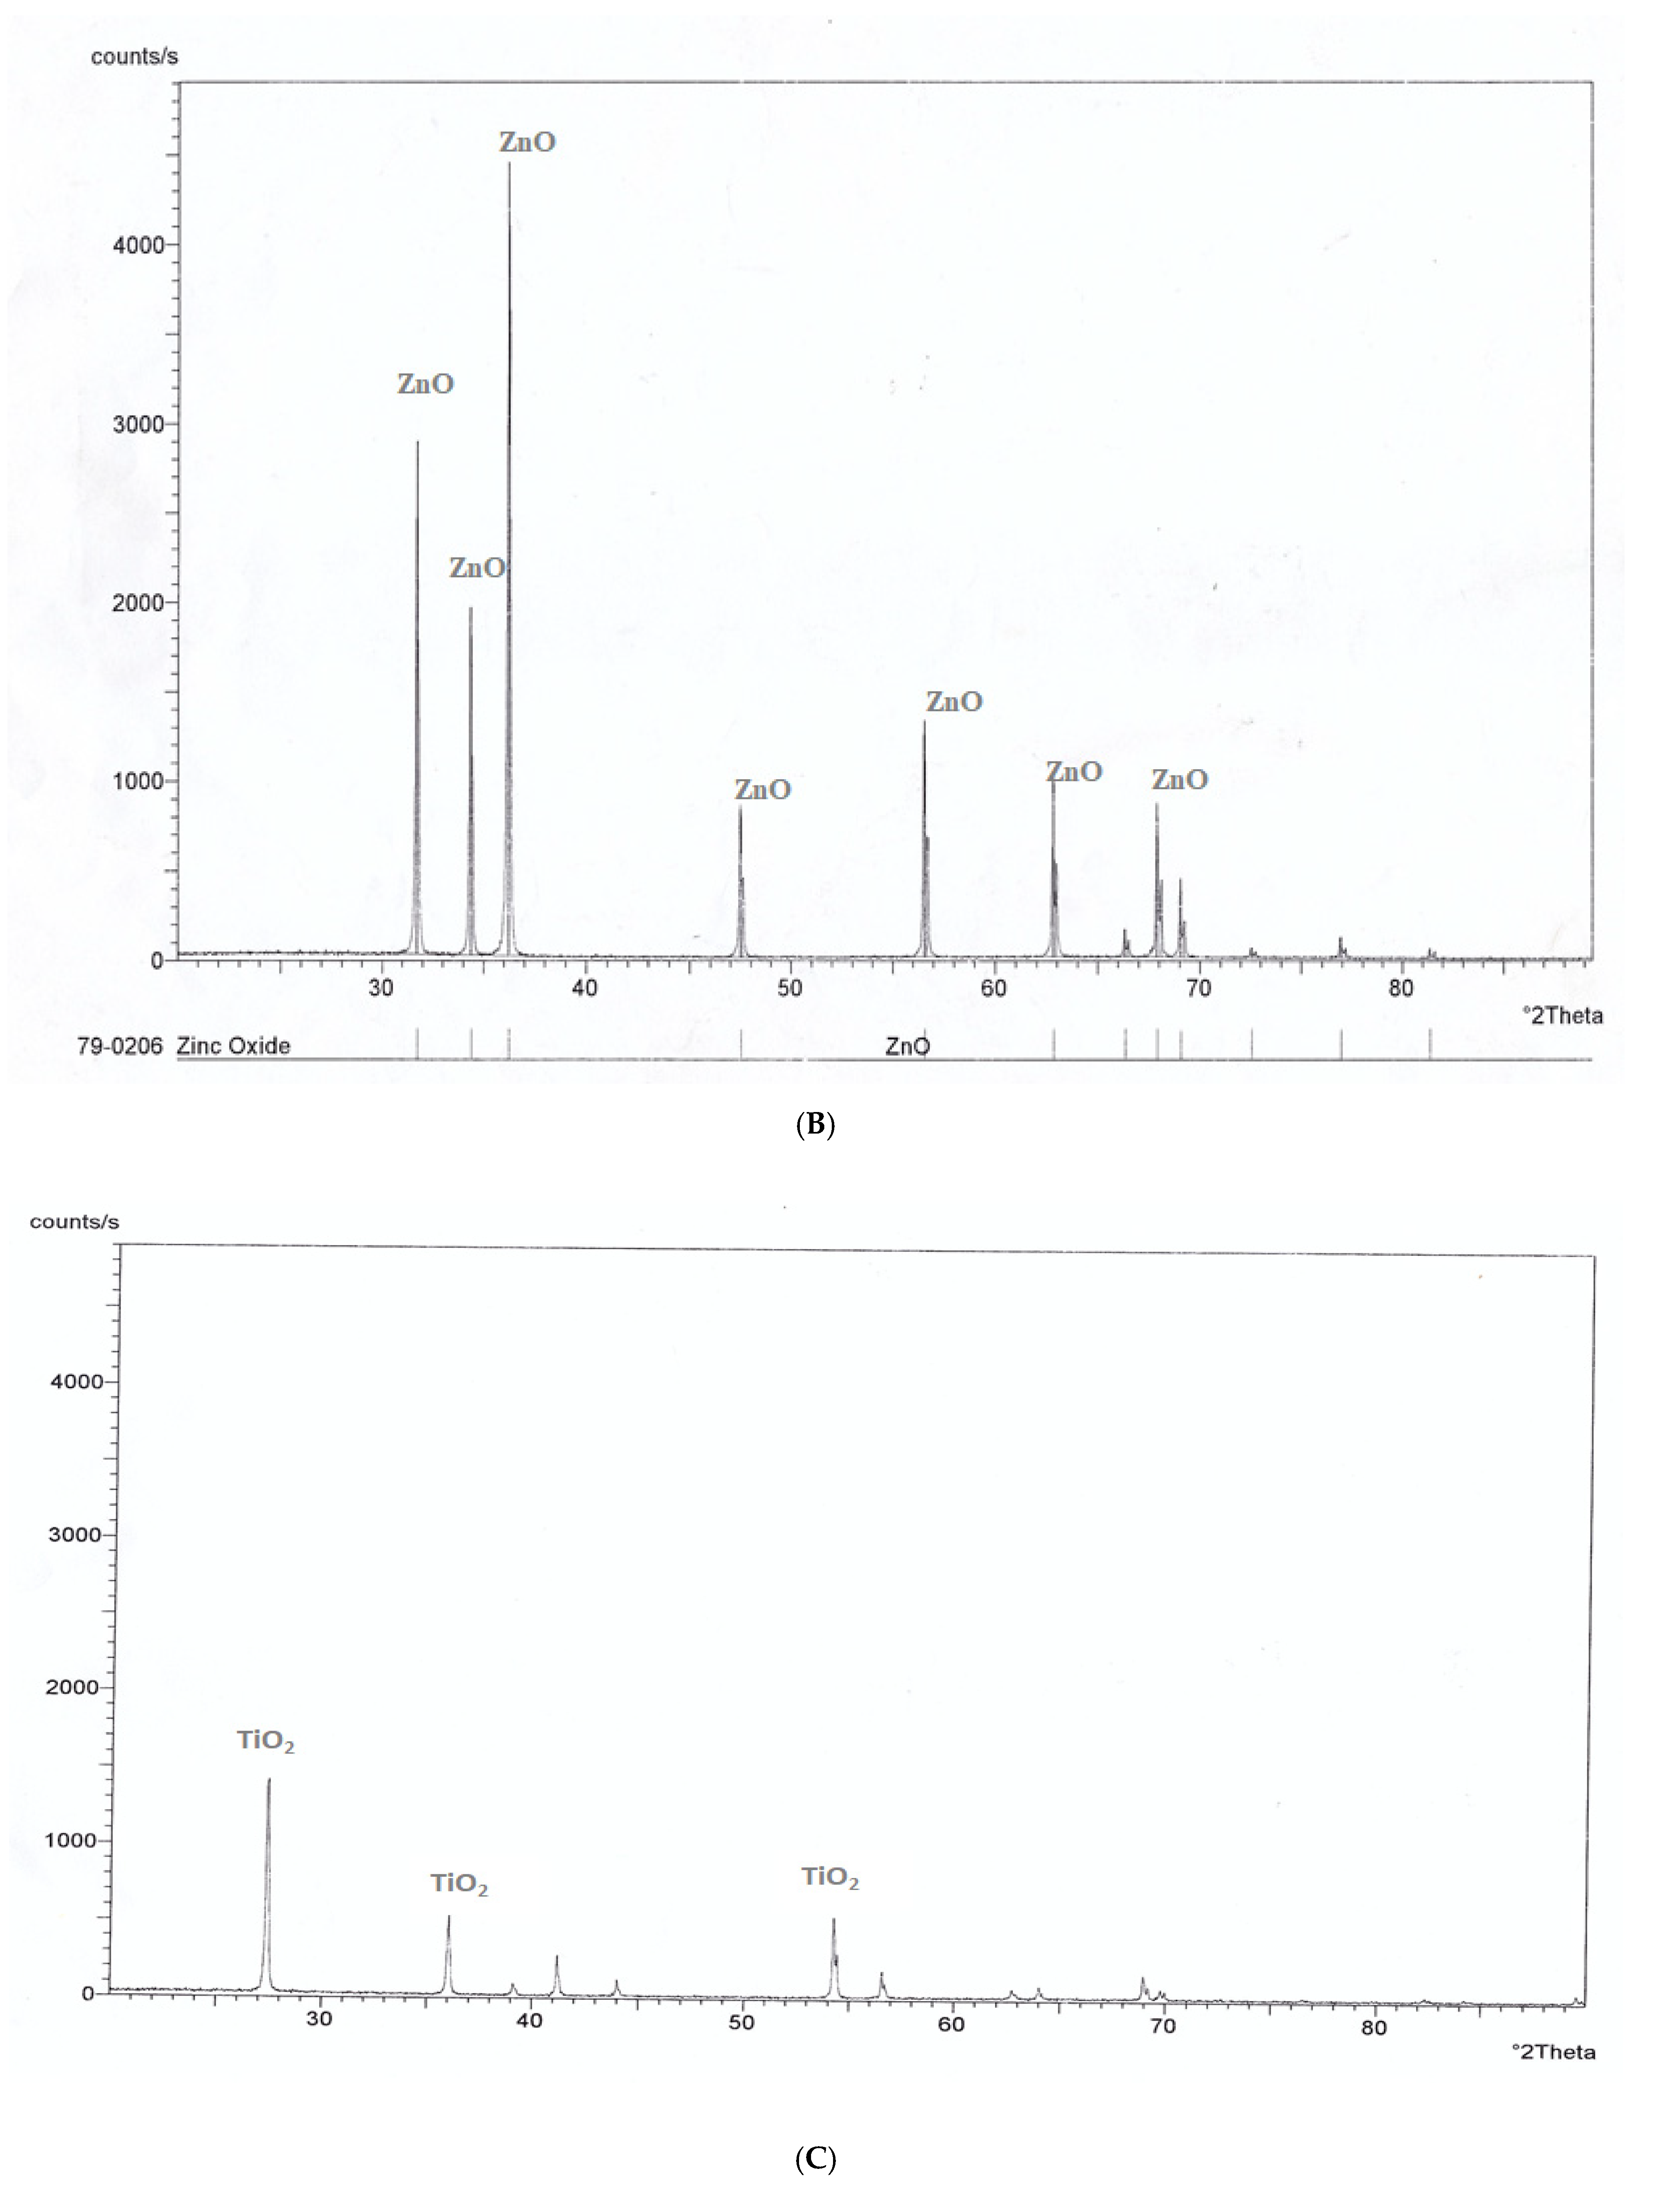
3.4. X-Ray Diffraction (XRD) Pattern Analysis

Phase purity and composition of the particles were examined by XRD; Figure 6A shows typical XRD pattern of AgNPs appeared in the range of 20–80° at a scanning step of 0.01. A number of Bragg reflections with 2θ values of 19.017°, 28.348°, 30.894°, 32.337°, 38.079° were observed corresponding to (001), (001), (003), (001) and (002) planes, documenting a typical XRD pattern of AgNPs in the range of 0–80° with Philips Analytical X-Ray. The phase purity and composition of the ZnONPs examined by XRD shows a typical XRD pattern of ZnONPs appeared in the range of 30–80° at a scanning step of 0.01 [42]. Figure 6C shows a typical XRD pattern of TiO2NPs appeared in the range of 30–80°. A number of Bragg reflections with 2θ values of 27.389°, 36.043°, 41.205°, 44.007°, 54.425°, 56.734°, 68.960° and 69.965° were observed corresponding to (101), (002), (002), (001), (001), (001), (001) and (002) planes, showing a typical XRD pattern of TiO2NPs in the range of 30–80° with Philips Analytical X-Ray. Figure 6D shows a typical XRD pattern of different nanocomposing (500 μL AgNPs–500 μL ZnONPs, 250 μL ZnONPs–750 μL AgNPs and 250 μL ZnONPs–750 μL TiO2NPs). Regarding nanocomposing 500 μL AgNPs–500 μL ZnONPs, Figure 6 shows that a number of Bragg reflections with 2θ values of 31.751°, 34.406° and 36.235° were observed corresponding to (001), (001) and (001) planes. However, in the nanocomposing 250 μL ZnONPs–750 μL AgNPs, a number of Bragg reflections with 2θ values of 31.7874°, 34.442° and 36.271° were observed corresponding to (001), (001), and (002) planes, and, in the case of nanocomposing 250 μL ZnONPs–750 μL TiO2NPs, in the range of 0–80°. A number of Bragg reflections with 2θ values of 31.810°, 34.463° and 36.289° were observed corresponding to (001), (002), and (002) planes with Philips Analytical X-Ray.

3.5. Application Studies of the Produced Nanoparticles

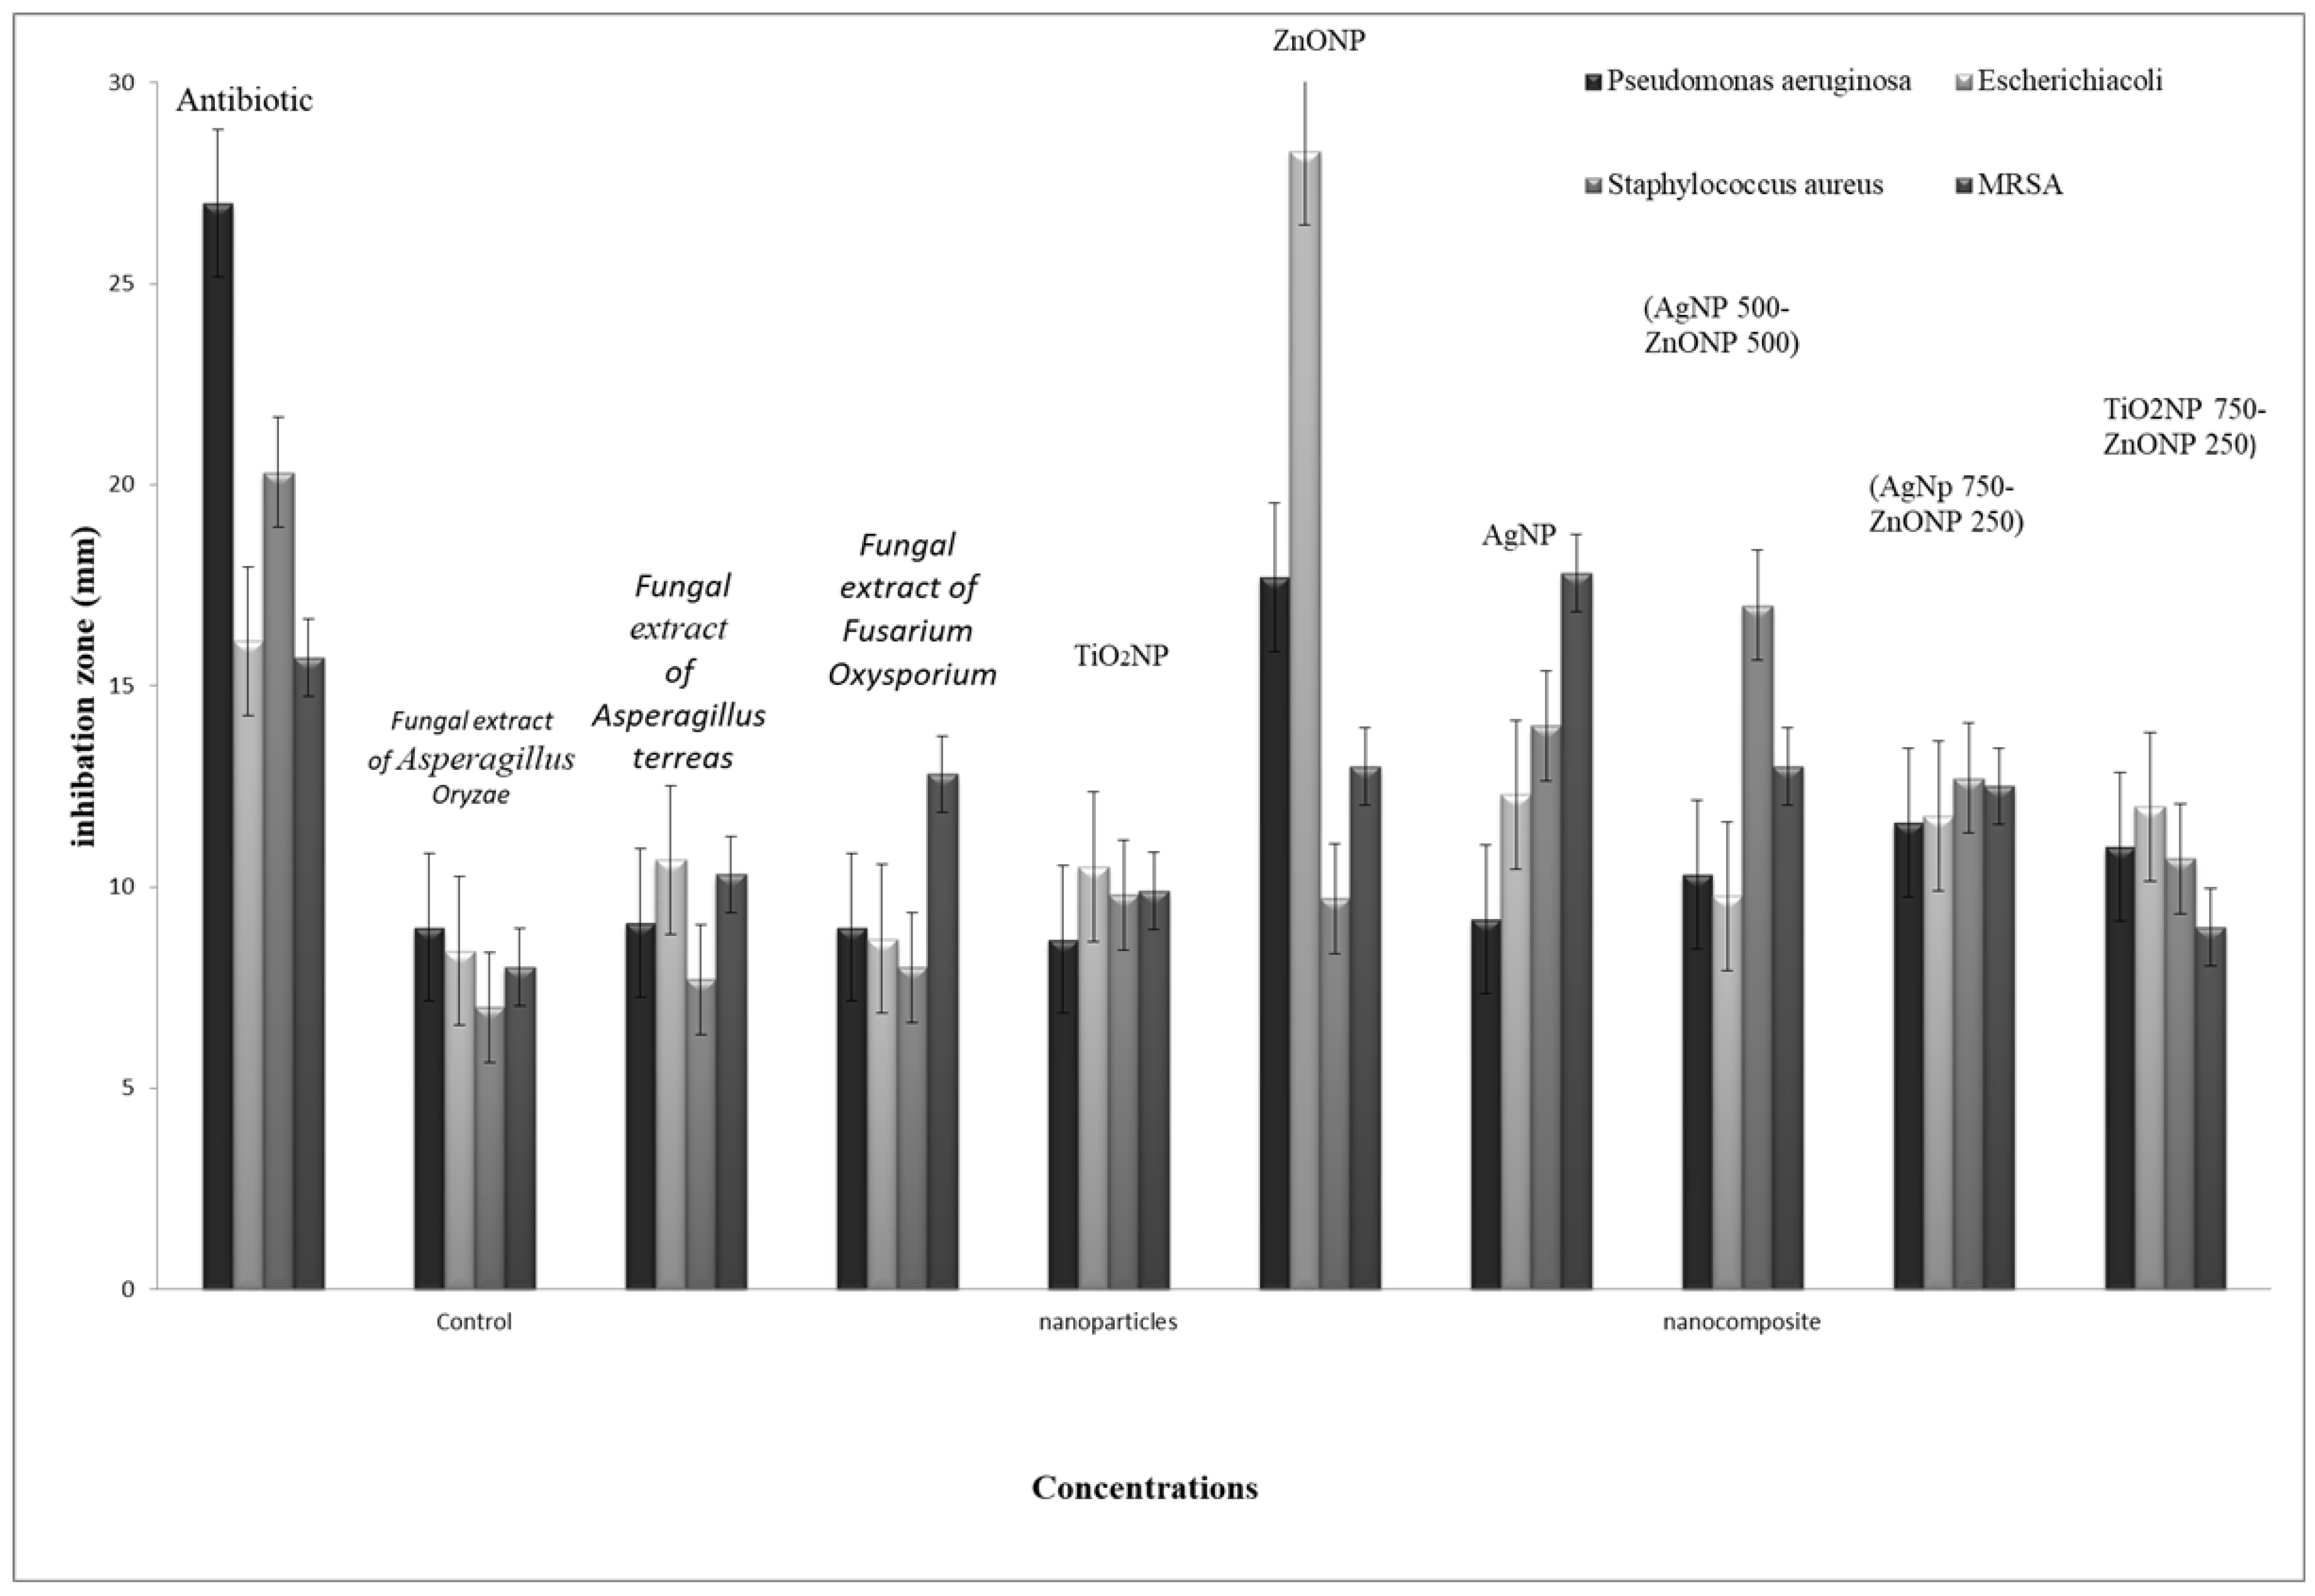
3.5.1. Comparative Toxicity Study of the Biosynthesized Nanoparticles and Nanocomposite on the Human Bacterial Diseases

Biosynthesized NPs and capped NC produced inhibition zones in Gram-negative bacteria (Escherichia coli O157H7 (E. coli) and Pseudomonas aeruginosa ATCC10145 (P. aeruginosa)), and Gram-positive bacteria (Staphylococcus aureus NRC23516 (Staph. aureus) and methicillin-resistant Staphylococcus aureus NRC629012 (MRSA)). The antimicrobial activity was assayed on LBA plates using the paper-disc method.

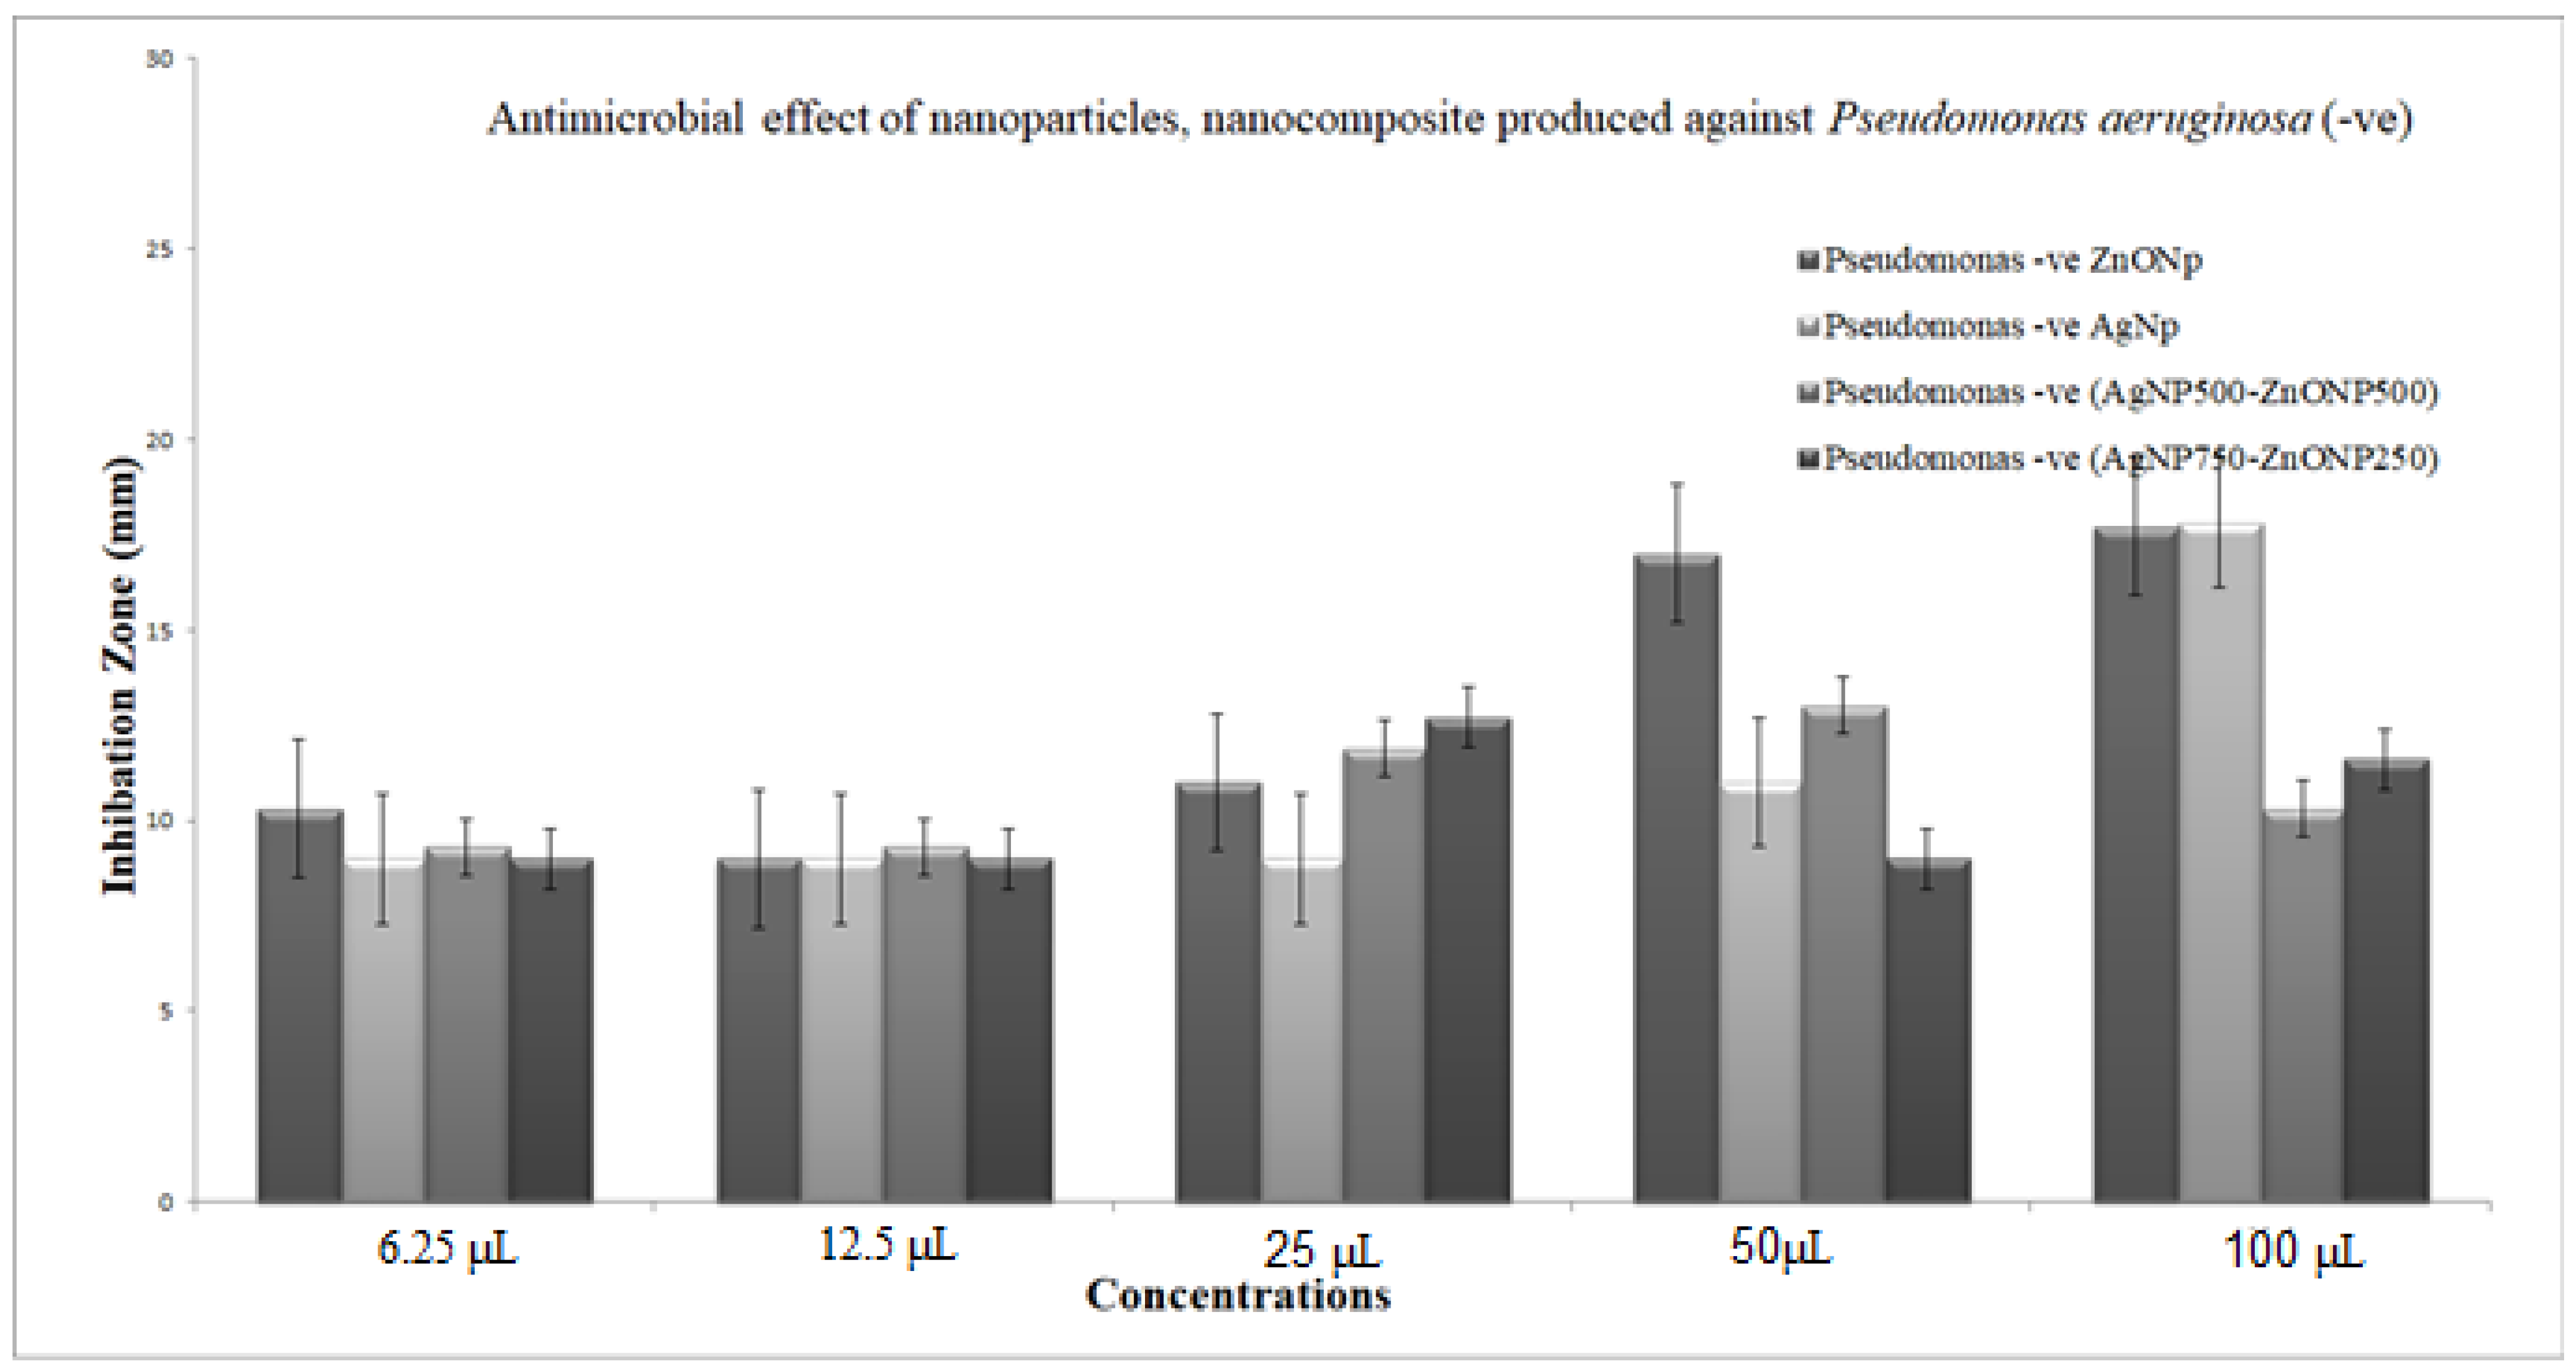
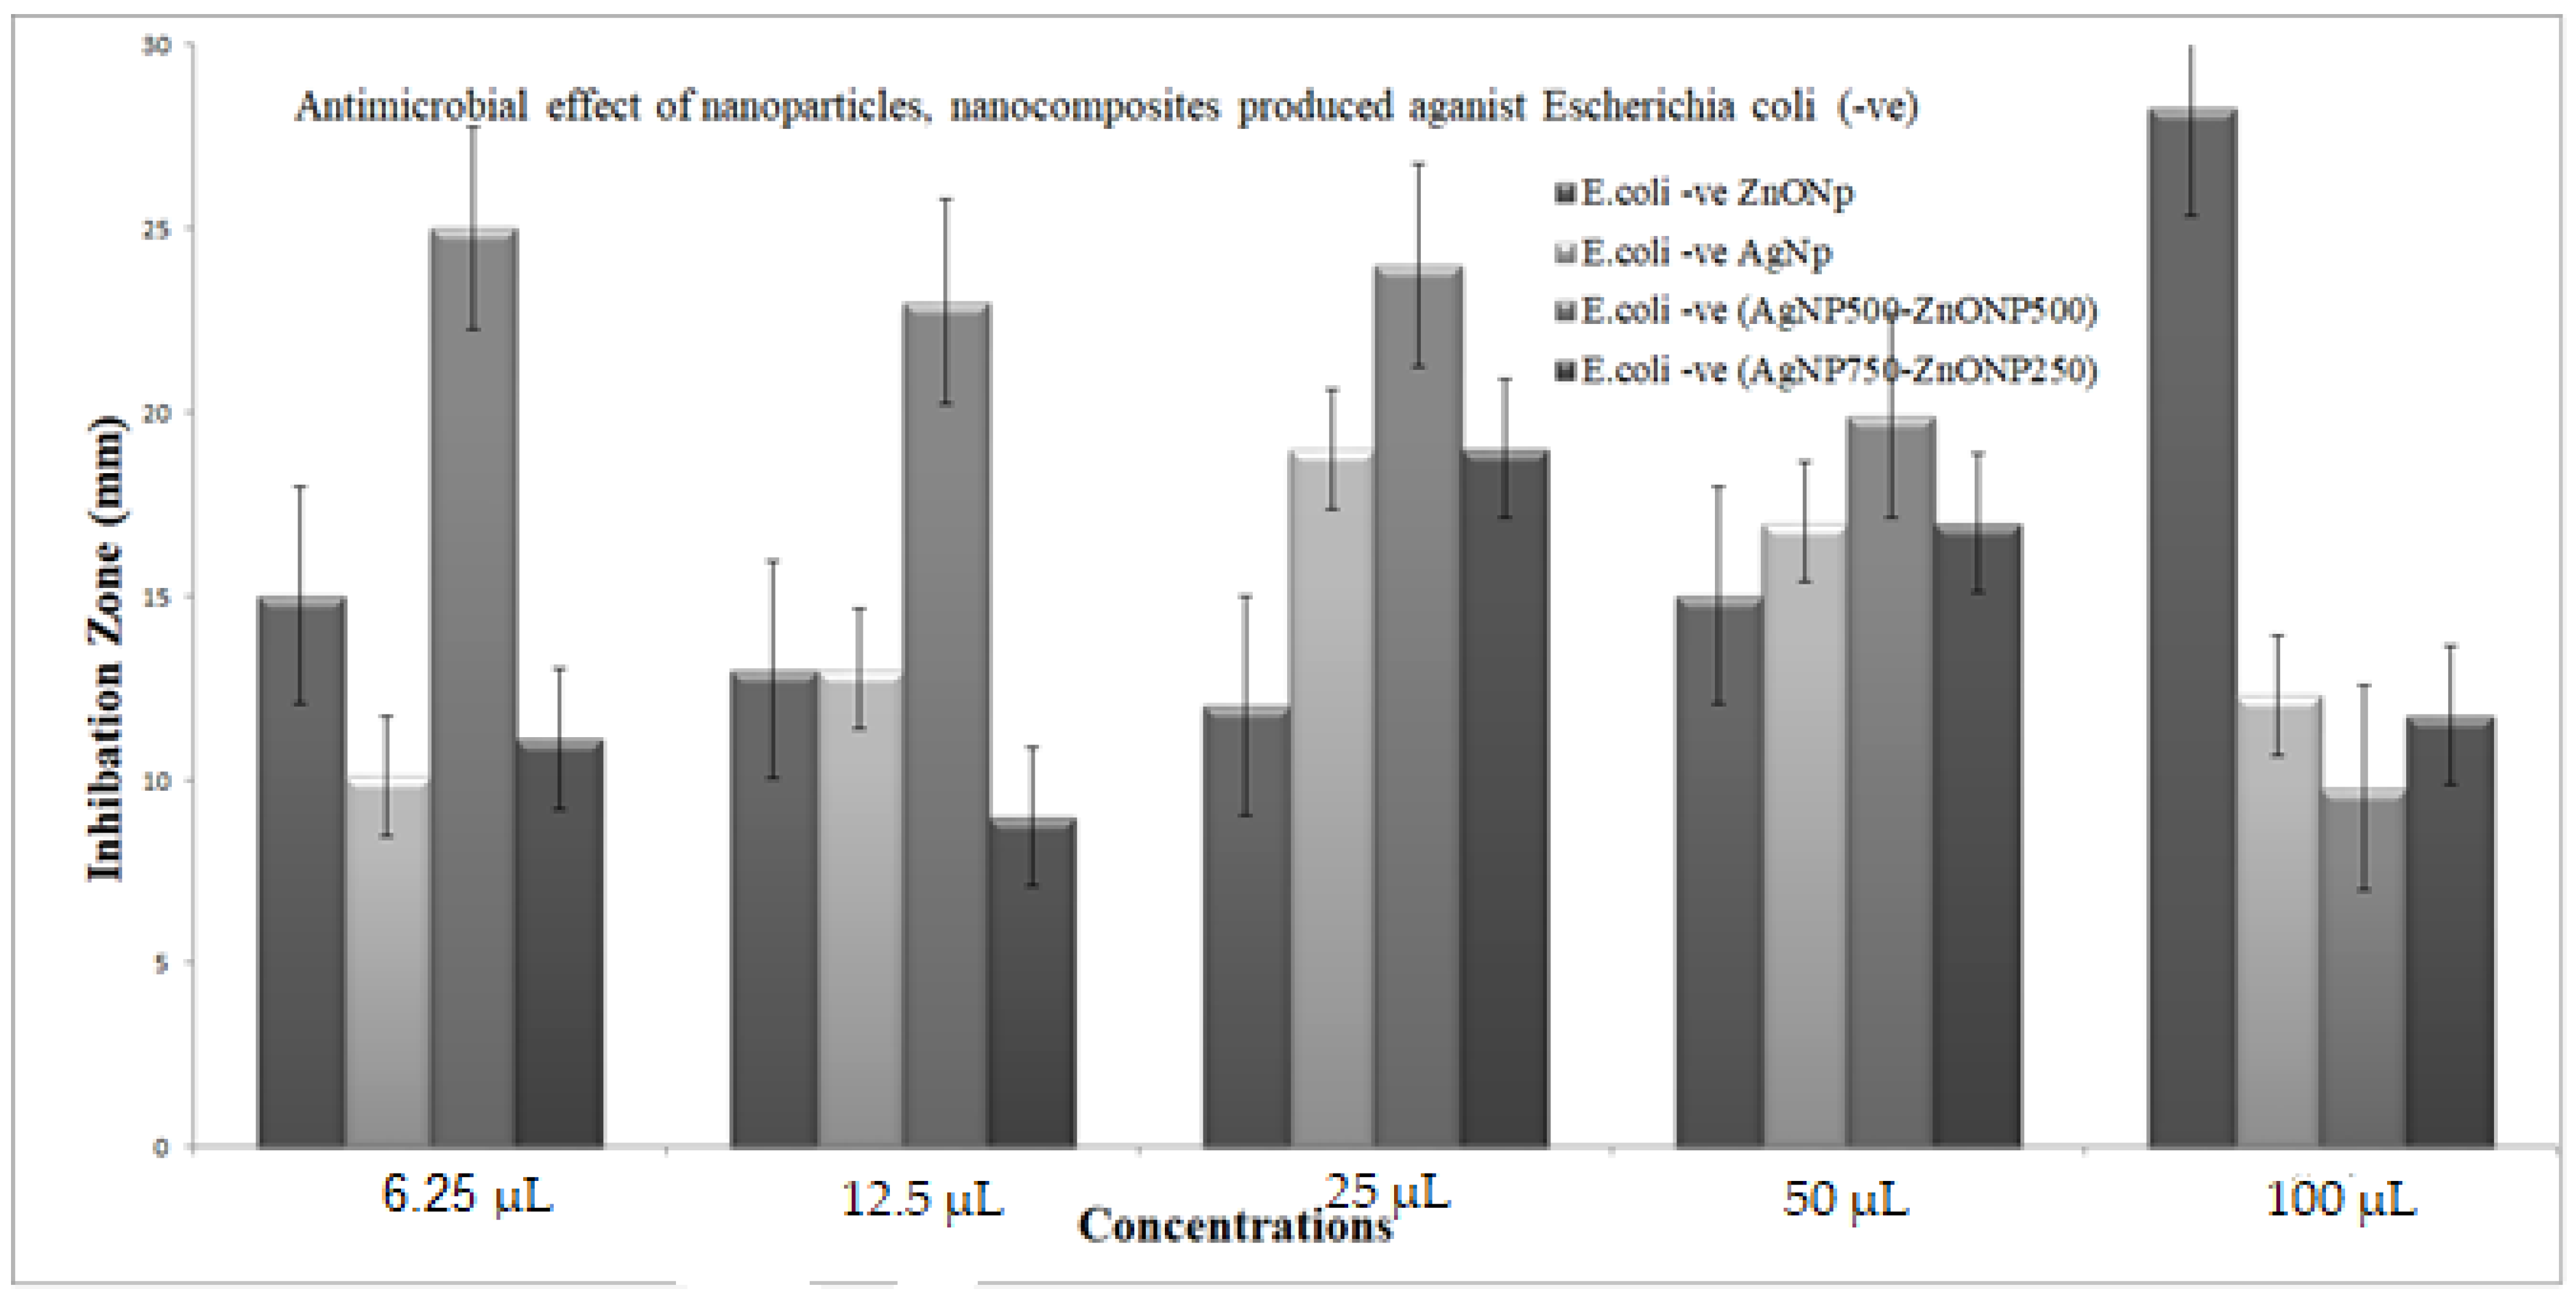
3.5.2. Antimicrobial Effect of Nanoparticles and Nanocomposite

The bacteriostatic activity assay of ZnONPs, TiO2NPs, AgNPs and NCs is shown in Figure 7. Various concentrations (6.25, 12.5, 25, 50 and 100 μL) were placed on the discs, and inhibition zones of various pathogenic microbes were measured. Figure 7 shows that, in general, 750 μL TiO2NPs–250 μL ZnONPs had the lowest activity towards bacteria with a limited inhibition zone. Antibacterial activity results revealed that ZnONPs, AgNPs and their composites are excellent antibacterial agents against both Gram-positive and Gram-negative bacteria. The result in Figure 7 also shows that NCs were better than nanoparticles in inhibiting the growth of P. aeruginosa at all concentrations used (100, 50, 25, 12.5 and 6.25 μL), with values 39.4%, 46.5%, 22.2%, 11%, and 11% greater, respectively, in the case of nanocomposite (750 μL AgNP–250 μL ZnONPs) compared to ZnONPs nanoparticles. Results also show that NCs were better than nanoparticles in inhibiting the growth of Escherichia coli at all concentrations used (100, 25, 12.5 and 6.25 μL), with values 48.9%, 28.2%, 17.11% and 33.3% greater, respectively, in the case of nanocomposite (750 μL AgNP–250 μL ZnONPs) compared to ZnONPs nanoparticles; at 50 μL, nanoparticles were 13.3% better than the nanocomposite. The inhibiting zones of Staph.aureus at all concentrations used (100, 25, 12.5 and 6.25 μL) were 30%, 28.2%, 17.11%, and 33.3% greater, respectively, in the case of nanocomposite (750 μL AgNP–250 μL ZnONPs) compared to ZnONP nanoparticles; at 50 μL nanoparticles were 13% better than the nanocomposite. The growth of MRSA at all concentrations used (50, 25, 12.5 and 6.25 μL) were 4%, 5.7%, 30%, and 133% greater, respectively, in the case of the nanocomposite (750 μL AgNP–250 μL ZnONPs) compared to ZnONPs nanoparticles; at 100 μL nanoparticles were 17.9% better than the nanocomposite.
Figure 8, Figure 9, Figure 10 and Figure 11 shows that most of the tested microbes were inhibited at low concentrations of the nanoparticles (6.25 μL), and the inhibition zones gradually increased with increasing concentrations of ZnONPs, AgNPs, composite 500 μL AgNPs–500 μL ZnONPs and composite 750 μL AgNPs–250 μL ZnONPs in the case of E. coli, Pseudomonas aeruginosa, Staphylococcus aureus, and MRSA (Figure 8). It was also observed that at concentrations of 100 and 50 μL, the zones became wider than those at other concentrations. In addition, the inhibition zones caused by nanoparticles and NCs were gradually increased in the case of E. coli and P. aeruginosa (Gram-negative bacteria), as shown in Figure 8 and Figure 9 compared with those detected in the case of Staph. aureus and MRSA (Gram-positive bacteria), which are illustrated in Figure 10 and Figure 11.

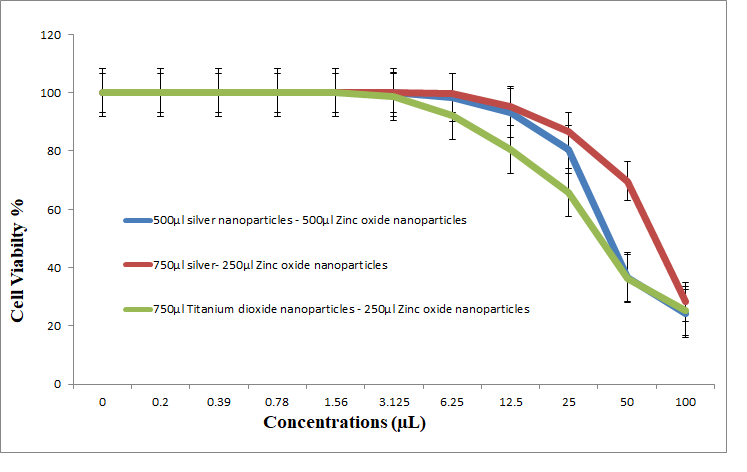
3.5.3. Antitumor Activity of Nanoparticles and Nanocomposites

Cytotoxic activity of nanoparticles was further tested in vitro by determining the number of surviving cells by staining HCT-116 cells (colonic carcinoma) with crystal violet; cell viability was determined after cultivation with nanoparticles for 24 h, and a control (no nanoparticles) was used for comparison.
The results indicated antitumor activity of biosynthesized NPs and NCs against the HCT-116 colonic carcinoma cell line; the cytotoxicity was increased concomitant to an increase in the concentrations of metal nanoparticles. Cell viability was dose-dependently decreased at a very low concentration (IC50 = 1.2 μL) in the case of AgNPs; the half maximal inhibitory concentration was characterized by IC50 => 100 μL in the case of the Aspergillusoryzae control (no nanoparticles) (Figure 12, Figure 13 and Figure 14). The results indicated that AgNPs selectively inhibited cancer cells. Cell viability was dose-dependently decreased at a very low concentration (IC50 = 0.7 μL) of ZnONPs; the control Aspergillusterreus (without nanoparticles) had an IC50 = 74.4 μL. At 25 μL, the inhibition became 0%, and the viability of HCT-116 tumor cells became 100% (Figure 12, Figure 13 and Figure 14). Cytotoxic effects of synthesized TiO2NPs against cancer cell lines have been limited [40].
In our study, crystal violet staining was used to evaluate the effect of TiO2NPs on HCT-116 cells (colonic carcinoma), and Fusariumoxysporum was used as a control. Dose-dependent cytotoxicity was detected in TiO2NP-treated HCT-116 cancer cells. The IC50 of TiO2NPs against HCT-116 cells was >100 μL, whereas the IC50 in the control samples was 82.9 μL (Figure 14). Our results also indicated that synthesized TiO2NPs have a higher cytotoxic effect against HCT-116 colon carcinoma cells at high concentrations, resulting in low viability; viability was increased at 6.25 μL concentration to 100%. At high concentrations, the number of viable HCT-116 cells was decreased after the treatment with the filtered extract of Fusariumoxysporum and with TiO2NPs. The number of viable cells was increased concomitant to a decrease in the concentration, and the inhibition was decreased concomitant to a decrease in the concentration of the filtered extract of Fusariumoxysporum and TiO2NPs.

3.5.4. Antitumor Activity of Nanocomposites

An antitumor assay for the composites 500 μL AgNPs–500 μL ZnONPs, 750 μL AgNPs–250 μL ZnONPs and 750 μL TiO2NPs–250 μL ZnONPs was used to investigate the influence of biosynthesized NPs and capping NCs on cell viability (Figure 15). Cell viability was determined as follows: Cell Viability (%) = (Abs S/Abs C) ×100. The data indicated a dose-dependent decrease at very low concentrations by nanocomposites (500 μL AgNPs–500 μL ZnONPs (IC50 = 42.4 μL); 250 μL ZnONPs–750 μL AgNPs (IC50 = 73.7 μL); and 250 μL ZnONPs–750 μL TiO2NPs (IC50 = 38.3 μL)).
In general, nanocomposites are considered to be highly toxic metals (Figure 15). At 3.125 μL, the inhibition was decreased to 0%, 0% and 1.32%, and the viability of the cells became 100%, 100% and 98.68%, respectively. The number of viable cells was increased concomitant to a decrease in the concentrations, and the inhibition was decreased concomitant to a decrease in the concentrations of three types of the nanoparticles.

4. Discussion

This study involved biosynthesis of AgNPs, ZnONPs and TiO2NP by Aspergillus sp. and Fusarium [42]. Manipulated conditions favored the activity resulting in the production of metal NPs and NCs. The ability to synthesize AgNPs, ZnONPs and TiO2NPs was identified by screening the isolates in the presence of silver nitrate, zinc oxide and titanium dioxide. The presence of AgNPs was observed by using ultraviolet–visible spectra. The surface plasmon resonance band peak in the visible range of approximately 422–428 nm was in agreement with the results of other studies [43]. Ultraviolet–visible spectroscopic studies detected surface plasmon resonance and confirmed the mechanism of the reduction of metal ions and formation of ZnONPs with a peak at 350 nm; thus, our results are in agreement with the data of other studies [44]. TiO2NPs had strong absorbance at approximately 360 nm (Figure 1). These results are similar to the data of another study [44]. By comparison, another study [45] reported that TiO2NPs synthesized using Lippiacitriodora leaf extract showed a strong ultraviolet–visible absorbance peak at 400 nm. Fourteen nanocomposites were tested before and after sonication; the best mixed NCs included 500 μL AgNPs–500 μL ZnONPs, 750 μL AgNPs–250 μL ZnONPs and 750 μL TiO2NPs–250 μL ZnONPs, which showed clear peaks on UV [46,47], indicating that AgNPs interacted with DNA; heating demonstrated a hypsochromic shift and widening of absorption spectra [46,47]. In the presence of DNA, a decrease in the intensity was due to partial corrosion of AgNPs [48]. FTIR measurements were performed to identify the presence of various functional groups in the biomolecules. Figure 3A illustrates detection of the peaks corresponding to the bioreduction of silver ions (Ag+) and capping responsible for the stabilization of AgNPs [49]. The FTIR spectrum of ZnONPs in Figure 3 showed absorption bands at 592 cm−1 and 438 cm−1 assigned to the stretching vibration of the Zn-O bonds, which confirmed the formation of ZnONPs [50]. Thus, surface-bound protein molecules act as stabilizers and prevent the aggregation of ZnONPs. FTIR spectra were recorded for TiO2NPs (Figure 3A). The band at 1638 cm−1 was specified as Amide I, [51] and the band at 1384 cm−1 was characteristic for the CH2 scissoring vibrations [52]. A peak at 760 cm−1 was attributed to the phenyl groups [53]. FTIR spectrum analysis of the composite nanoparticles 500 μL AgNPs–500 μL ZnONPs, 750 μL AgNPs–250 μL ZnONPs and 750 μL TiO2NPs–250 μL ZnONPs is shown in Figure 3B–D. The spectra indicated the appearance of the bond peaks corresponding to the O-H stretching at approximately 3925 cm−1 [54] and a band peak at approximately 1300 cm−1 attributed to Amide III [55]. The Fourier transform infrared spectrum of the Ag-ZnO nanocomposite showed an absorption band peak at approximately 1268 cm−1, corresponding to Amide I of polypeptides [56]. A peak at 1312 cm−1 was related to the C-N groups, and this group was related to the appearance of aliphatic amines that act as functional groups [57]. A 2075 cm−1 peak was related to the group C≡C carboxylic acids, stretching of alcohols, and ether and ester groups [58]. Fourier transform infrared spectra of the TiO2-ZnO nanocomposite with molar ratios different from those of ZnONPs are shown in Figure 3D; the wavenumber range was from 4000 to 400 cm−1. The peaks corresponded to the stretching symmetric vibration of the Ti-O-Ti bond, confirmed by the O-Ti-O flexion vibration bond with the band peaks at 550 and 700 cm−1 [59]. The peaks at approximately 580 cm and 880 cm−1 indicated the Ti-O-Ti symmetric stretching vibration and the Zn-O-Ti group vibration, respectively [60]. The Ti-O and Ti-O-C peaks were at 1518 and 1870 cm−1. The interaction between the Ti-O network and organic polymers caused a vibration. The absorption peaks at approximately 400–500 cm−1 were assigned to the metal oxygen Zn-O bonds. The peaks at 3500–3600 cm−1 indicated the presence of the O-H hydroxyl groups adsorbed on the nanoparticle surface. [49] Transmission electron microscopy of TiO2NPs and Ag-TiO2 nanocomposites revealed strong interactions between the AgNPs and TiO2NPs. The Schottky junction between the metal–metal oxide nanoparticles is formed by the effective interfacial interaction between nanoparticles [61,62]. XRD analysis (Figure 6A) indicated a centered structure of AgNPs based on 2θ at 19.017°, 28.348°, 30.894°, 32.337° and 38.079° corresponding to the (001), (001), (003), (001) and (002) planes, respectively [63]. The patterns show the main peaks corresponding to 2θ at 31.717° and 36.203° in multiple patterns (Figure 6B). The peaks are in close agreement with the data of the literature [64]. The diffraction peaks at 27.389°, 36.043°, 41.205°, 44.007°, 54.425°, 56.734°, 68.960° and 69.966° correspond to the (101), (002), (002), (001), (001), (001), (001) and (002) planes, respectively. Biosynthesized TiO2NPs have a more crystalline structure confirmed by the data of Figure 6C. The high-intensity peak 2θ = 27.3° completely matched the crystallographic plane (1 10) of the tetragonal structure anatase phase and is in agreement with the standard database of Philips Analytical and the data of [65]. The formation of silver crystalline clusters on the zinc oxide lattice was indicated by the appearance of silver bands in the XRD diffraction patterns due to the presence of distinct features at 31.788°, 34.442° and 36.271° corresponding to the (001), (001) and (002) reflecting planes, respectively [66]. The X-ray diffraction pattern of ZnO-TiO2 nanocomposite arrays was closely related to anatase titanium dioxide [66]. Two new band peaks corresponding to 100 and 101 of the quartzite zinc oxide were detected by Philips Analytical X-ray in agreement with our results (Figure 6).
The data of the antimicrobial activity assays indicated that AgNPs, ZnONPs, TiO2NPs and nanocomposites 500 μL AgNPs–500 μL ZnONPs, 750 μL AgNPs–250 μL ZnONPs and 750 μL TiO2NPs–250 μL ZnONPs had antimicrobial properties compared with the corresponding controls (filtrate extracts, Figure 7). The antibacterial activity data indicated that AgNPs, ZnONPs and their nanocomposites were good antibacterial agents against Gram-positive and Gram-negative bacteria and showed significant antibacterial ability (9.0 to 29 mm diameter) (Figure 7, Figure 8, Figure 9, Figure 10 and Figure 11). Qing et al. [9] documented an excellent photocatalytic antimicrobial effect of AgNPs compared to that of several nanoparticles. However, the authors in [67] reported that TiOPs had no antibacterial effect. Many authors have reported antibacterial effects of ZnONPs against several isolates, such as Staphylococcus sp., [68] methicillin-resistant Staphylococcus aureus, [69], Pseudomonas sp. [70] and Escherichia coli [71]. The mechanism of action of AgNPs is not clearly understood. Most likely, the antibacterial effect of AgNPs is related to mechanisms associated with antibiotics [72]. Generally, antibacterial properties of AgNPs are mainly related to silver cation release from AgNPs, which act as a reservoir for these cations [73]. ZnONPs were recently shown to inhibit the growth of Staphylococcus epidermis in a size- and concentration-dependent manner [74]. The results of Figure 7, Figure 8, Figure 9, Figure 10 and Figure 11 indicate a wide spectrum of antimicrobial effects of ZnONPs against several microorganisms. For example, aluminum oxide is toxic towards many cells, although some metal oxides are highly toxic [75]. Moreover, AgNPs toxicity was documented, [76] and titanium dioxide was shown to kill a number of bacteria [77]. Adding metals, such as titanium dioxide, to zinc oxide as a precursor can lead to noticeable results, and the precipitation method used in [28] demonstrated that silver-loaded zinc oxide accounted for an extreme increase in the antibacterial effect of zinc oxide. Silver-loaded zinc oxide is believed to be a new type of precursor for inorganic antibacterial agents [78]. The antibacterial activity of NPs and NCs of Ag-TiO2 and Ag-ZnO against Gram-negative (Escherichia coli and Pseudomonas aeruginosa) and Gram-positive (Staphylococcus aureus and MRSA (methicillin-resistant Staphylococcus aureus) bacteria is shown in Figure 7, Figure 8, Figure 9, Figure 10 and Figure 11. Ag-ZnONPs are highly efficient based on the comparison of antibacterial activities of Ag-ZnO nanoparticles to those of AgNP-TiO2NPs. A significant antibacterial effect against Gram-negative bacteria was shown in the case of both types of doped nanoparticles. Comparison between two types of bacteria, Gram-positive and Gram-negative, indicated that Gram-positive bacteria have a cell wall with a stronger molecular network, which is absent in Gram-negative bacteria; silver ions can penetrate through the cell walls of Gram-positive bacteria [79]. An increase in the silver doping concentration in the titanium dioxide and zinc oxide matrix exponentially reduced the percentage of viable bacteria [80]. Metallic nanoparticles effectively obstruct many microbial species according to in vitro antimicrobial studies [81]. Cancer is a multistep, dangerous and widely distributed disease. Oxidative damage and various chemical, physical, environmental and genetic factors can directly or indirectly induce its development. New and effective agents to control this disease are always needed. Various reports demonstrated that silver nanoparticles have important antiangiogenic properties. Compounds possessing antiangiogenic properties may have antitumor activity because they can block the activity of abnormally expressed signaling proteins [82]. Silver nanoparticles showed higher dose-dependent cytotoxic activity against all cell lines compared to that of onion extract alone [83], in agreement with our results in Figure 12. Many nonspecific effects in subcellular organelles and in the cellular microenvironment may explain the anticancer ability of NPs against HCT-116 cells (colonic carcinoma) with IC50 values of 0.7–100 µg/mL. The antitumor effects of unmodified and modified surfaces of ZnONPs and TiO2NPs with various diameters are summarized in Figure 13 and Figure 14. The key factors that determine cell viability and genetic alterations in tumor cells include nanoparticle size, aggregation tendency, agglomeration to transform the cell structure and nanoparticle diffusion in tumor microenvironments [84,85]. MNP effects on the cellular microenvironment and tissue physiology have not been well studied. It is necessary to develop effective therapies and obtain an in-depth understanding of anticancer activity of mechanical stimuli [86,87,88,89,90]. Additionally, the increased cytotoxic effect of TiO2-ZnO-Au nanocomposites was compared to that of TiO2NPs and ZnONPs against Du-145 prostate cancer cells [91]. In addition, MNPs provide improved biocompatibility, better surficial stability, and binding affinity for biomolecule conjugation [91,92,93]. Cantilever bending was detected during recognition and binding of a transcription factor to its target sequence on the cantilever [93,94]. The morphological nanosticks of Ag-Au/ZnO nanoparticles can be accommodated into the cells and can damage cancer cells [95], as illustrated by our result in Figure 15.

5. Conclusions

Nanocomposites were synthesized in a fast and facile manner using mechanical alloying. Nanocomposites were observed before and after sonication. Various biosynthesized nanoparticles and nanocomposites with antibacterial properties and antitumor efficiency were produced for applications in several biomedical products, and MNPs and MNPCs were used for electrode modification. Nanocomposites could induce a cytotoxic response and interacted with DNA at concentrations of 500 μL AgNPs–500 μL ZnONPs, 750 μL AgNPs–250 μL ZnONPs and 750 μL TiO2NPs–250 μL ZnONPs. Hence, monitoring the toxicity of biosynthesized nanoparticles should be taken into account for safety assessment.

Author Contributions

D.E.-K., conceptualization, methodology, validation, investigation. M.A., conceptualization, software, validation, formal analysis, writing-original draft preparation, review, editing. S.M.E., visualization, review, editing and supervision. N.M.A., conceptualization, methodology and supervision. E.A.H., methodology, validation, investigation. All authors have read and agreed to the published version of the manuscript.

Funding

This research received no external funding.

Institutional Review Board Statement

Not applicable.

Informed Consent Statement

Not applicable.

Data Availability Statement

The data presented in this study are available on request from the corresponding author.

Acknowledgments

The authors thank all participants, my deep thanks to colleagues of the Agricultural Microbiology Department National Research Centre and Ain Shams University.

Conflicts of Interest

The authors declare no conflict of interest.

References

  1. Kalpana, V.N.; Devi Rajeswari, V. A Review on Green Synthesis, Biomedical Applications, and Toxicity Studies of ZnO NPs. Bioinorg. Chem. Appl. 2018, 2018, 3569758. [Google Scholar] [CrossRef]
  2. Fang, X.; Wang, Y.; Wang, Z.; Jiang, Z.; Dong, M. Microorganism Assisted Synthesized Nanoparticles for Catalytic Applications. Energies 2019, 12, 190. [Google Scholar] [CrossRef] [Green Version]
  3. Verma, P.; Maheshwari, S.K. Applications of Silver Nanoparticles in Diverse Sectors. Int. J. Nano Dimens. 2019, 10, 18–36. [Google Scholar]
  4. Ghareib, M.M.; Attia, M.; Awad, N.M.; Matter, M.Z.; El-Kahky, D. Screening of Fusariumspp Resistance to Silver Ions for Ability to Synthesize Silver Nanoparticles from Egyptian Soils. Glob. Adv. Res. J. 2015, 4, 366–382. [Google Scholar]
  5. Roy, A.; Bulut, O.; Some, S.; Mandal, A.; Yilmaz, M. Green Synthesis of Silver Nanoparticles: Biomole-cule-Nanoparticle Organizations Targeting Antimicrobial Activity. RSC Adv. 2018, 9, 2673–2702. [Google Scholar] [CrossRef] [Green Version]
  6. Kvítek, L.; Panáček, A.; Soukupová, J.; Kolář, M.; Večeřová, R.; Prucek, R.; Holecová, M.; Zbořil, R. Effect of Surfactants and Polymers on Stability and Antibacterial Activity of Silver Nanoparticles (NPs). J. Phys. Chem. C 2008, 112, 5825–5834. [Google Scholar] [CrossRef]
  7. Gaidau, C.; Petica, A.; Ignat, M.; Iordache, O.; Ditu, L.-M.; Ionescu, M. Enhanced Photocatalysts based on Ag-TiO2 and Ag-N-TiO2 Nanoparticles for Multifunctional Leather Surface Coating. Open Chem. 2016, 14, 383–392. [Google Scholar] [CrossRef]
  8. Khalandi, B.; Asadi, N.; Milani, M.; Davaran, S.; Abadi, A.J.; Abasi, E.; Akbarzadeh, A. A Review on Potential Role of Silver Nanoparticles and Possible Mechanisms of their Actions on Bacteria. Drug Res. 2017, 67, 70–76. [Google Scholar] [CrossRef] [PubMed]
  9. Qing, Y.A.; Cheng, L.; Ruiyan, L.; Liu, G.; Zhang, Y.; Tang, X.; Wang, J.; Liu, H.; Qin, Y. Potential Antibacterial Mechanism of Silver Nanoparticles and the Optimization of Orthopedic Implants by Advanced Modification Technologies. Int. J. Nanomed. 2018, 13, 3311–3327. [Google Scholar] [CrossRef] [Green Version]
  10. Fernando, S.; Gunasekara, T.; Holton, J. Antimicrobial Nanoparticles: Applications and Mechanisms of Action. Sri Lankan J. Infect. Dis. 2018, 8, 2–11. [Google Scholar] [CrossRef]
  11. Wang, Y.-W.; Cao, A.; Jiang, Y.; Zhang, X.; Liu, J.-H.; Liu, Y.; Wang, H. Superior Antibacterial Activity of Zinc Oxide/Graphene Oxide Composites Originating from High Zinc Concentration Localized around Bacteria. ACS Appl. Mater. Interfaces 2014, 6, 2791–2798. [Google Scholar] [CrossRef]
  12. Ancona, A.; Dumontel, B.; Garino, N.; Demarco, B.; Chatzitheodoridou, D.; Fazzini, W.; Engelke, H.; Cauda, V. Lipid-Coated Zinc Oxide Nanoparticles as Innovative ROS-Generators for Photodynamic Therapy in Cancer Cells. Nanomaterials 2018, 8, 143. [Google Scholar] [CrossRef] [Green Version]
  13. Vijayakumar, S.; Vaseeharan, B.; Sudhakaran, R.; Jeyakandan, J.; Ramasamy, P.; Sonawane, A.; Padhi, A.; Velusamy, P.; Anbu, P.; Faggio, C. Bioinspired Zinc Oxide Nanoparticles using Lycopersiconesculentum for Antimicrobial and Anticancer Applications. J. Clust. Sci. 2019, 30, 1465–1479. [Google Scholar] [CrossRef]
  14. El-kahky, D.; Attia, M.; Easa, S.; Awad, N.; Helmy, E. Biosynthesized of Zinc Oxide Nanoparticles Using Aspergillusterreus and their Application as Antitumor and Antimicrobial Activity. Glob. Adv. Res. J. Agric. Sci. 2019, 8, 90–100. [Google Scholar]
  15. Dayakar, T.; VenkateswaraRao, K.; Bikshalu, K.; Rajendar, V.; Park, S.-H. Novel Synthesis and Structural Analysis of Zinc Oxide Nanoparticles for the Non Enzymatic Glucose Biosensor. Mater. Sci. Eng. C 2017, 75, 1472–1479. [Google Scholar] [CrossRef] [PubMed]
  16. Punitha, V.N.; Vijayakumar, S.; Sakthive, B.; Praseetha, P.K. Protection of Neuronal Cell Lines, Antimicrobial and Photocatalytic Behaviours of Eco-Friendly TiO2 Nanoparticles. J. Environ. Chem. Eng. 2020, 8, 104343. [Google Scholar]
  17. Shih, Y.; Lin, C. Effect of particle size of titanium dioxide nanoparticleaggregates on the degradation of one azo dye. Environ. Sci. Pollut. Res. 2012, 19, 1652–1658. [Google Scholar] [CrossRef]
  18. Akhtar, M.S.; Swamy, M. Biosynthesis and Characterization of Silver Nanoparticles from Methanol Leaf Extract of Cassia didymobotyra and Assessment of Their Antioxidant and Antibacterial Activities. J. Nanosci. Nanotechnol. 2015, 15, 9818–9823. [Google Scholar] [CrossRef]
  19. Kim, J.S.; Kuk, E.; Yu, K.N.; Kim, J.H.; Park, S.J.; Lee, H.J. Antimicrobial effects of silver nanoparticles. Nanomed. Nanotechnol. Biol. Med. 2007, 3, 95–101. [Google Scholar] [CrossRef]
  20. Qiong, L.J.; Li, X.Z.; Dai, Z.; Lu, Z.; Yang, H.; Chen, R. Enhanced antibacterial activity and mechanism studies of Ag/Bi2O3 nanocomposites. Adv. Powder Technol. 2018, 29, 2082–2090. [Google Scholar]
  21. Gunalan, S.; Rajeswari, S.; Venckatesh, R. Green synthesizedzinc oxide nanoparticles against bacterial and fungal pathogens. Prog. Nat. Sci. Mater. Int. 2012, 22, 693–700. [Google Scholar] [CrossRef] [Green Version]
  22. Gupta, J.; Mohapatra, J.; Bahadur, D. Visible light drivenmesaporous Ag-embedded ZnO nanocomposites: Reactive oxygen species enhanced photocatalysis, bacterial inhibition and photodynamic therapy. Dalton Trans. 2017, 46, 685–696. [Google Scholar] [CrossRef] [PubMed]
  23. Youssef, A.M.; El-Nahrawy, A.M.; Hammad, A.B.A. Sol-gel synthesisand characterizations of hybrid chitosan-PEG/calcium silicate nanocomposite modified with ZnO-NPs and (E102) for optical and antibacterial applications. Int. J. Biol. Macromol. 2017, 97, 561–567. [Google Scholar] [CrossRef] [PubMed]
  24. Amin, S.A.; Pazouki, M.; Hosseinnia, A. Synthesis of TiO2–Ag Nanocomposite with Sol–Gel Method and Investigation of Its Antibacterial Activity against E. coli. Powder Technol. 2009, 196, 241–245. [Google Scholar] [CrossRef]
  25. Brook, L.A.; Evans, P.; Foster, H.A.; Pemble, M.E.; Steele, A.; Sheel, D.W.; Yates, H.M. Highly Bioactive Silver and Silver/Titania Composite Films Grown by Chemical Vapour Deposition. J. Photochem. Photobiol. A 2007, 187, 53–63. [Google Scholar] [CrossRef] [Green Version]
  26. Feng, Q.L.; Wu, J.; Chen, G.Q.; Cui, F.; Kim, T.; Kim, J. A Mechanistic Study of the Antibacterial Effect of Silver Ions on Escherichia coli and Staphylococcus aureus. J. Biomed. Mater. Res. 2000, 52, 662–668. [Google Scholar] [CrossRef]
  27. Endo Kimura, M.; Janczarek, M.; Bielan, Z.; Zhang, D.; Wang, K.; Markowska-Szczupak, A.; Kowalska, E. Photocatalytic and Antimicrobial Properties of Ag2O/TiO2 Heterojunction. ChemEngineering 2019, 3, 3. [Google Scholar] [CrossRef] [Green Version]
  28. Zhang, H.; Chen, B.; Jiang, H.; Wang, C.; Wang, H.; Wang, X. A strategy for ZnO Nanorod Mediated Multi-Mode Cancer Treatment. Biomaterials 2011, 32, 1906–1914. [Google Scholar] [CrossRef] [PubMed]
  29. Chen, F.; Liu, Z.; Liu, Y.; Fang, P.; Dai, Y. Enhanced Adsorption and Photocatalytic Degradation of High-Concentration Methylene Blue on Ag2O-Modified TiO2-Based Nanosheet. Chem. Eng. J. 2013, 221, 283–291. [Google Scholar] [CrossRef]
  30. Akhavan, O. Lasting Antibacterial Activities of Ag–TiO2/Ag/a-TiO2 Nanocomposite thin Film Photocatalysts under Solar Light Irradiation. J. Colloid Interface Sci. 2009, 336, 117–124. [Google Scholar] [CrossRef]
  31. Dawson, A.; Kamat, P.V. Semiconductor−Metal Nanocomposites. Photoinduced Fusion and Photocatalysis of Gold-Capped TiO2 (TiO2/Gold) Nanoparticles. J. Phys. Chem. B 2001, 105, 960–966. [Google Scholar] [CrossRef]
  32. El-Kahky, D. Improvement of the Antimicrobial Properties of Nanoparticles and Application in Water Purification. Ph.D. Thesis, Ain Shams University, Cairo, Egypt, 2019. [Google Scholar]
  33. Christine, O.D. Modified Czapek Dox Agar (Dehydrated). Saboutaudia 1962, 1, 214–219. [Google Scholar]
  34. Bottoni, P.; Scatena, R. The Role of CA 125 as Tumor Marker: Biochemical and Clinical Aspects. In Advances in Cancer Biomarkers: From Biochemistry to Clinic for a Critical Revision; Scatena, R., Ed.; Springer: Dordrecht, The Netherlands, 2015; pp. 229–244. [Google Scholar]
  35. Ahmad, A.; Mukherjee, P.; Senapati, S.; Mandal, D.; Khan, M.I.; Kumar, R.; Sastry, M. Extracellular Biosynthesis of Silver Nanoparticles Using the Fungus Fusariumoxysporum. Colloids Surf. B 2003, 28, 313–318. [Google Scholar] [CrossRef]
  36. Ahmad, A.; Senapati, S.; Khan, M.I.; Kumar, R.; Sastry, M. Extracellular Biosynthesis of Monodisperse Gold Nanoparticles by a Novel ExtremophilicActinomycete, Thermomonospora sp. Langmuir 2003, 19, 3550–3553. [Google Scholar] [CrossRef]
  37. Ahmad, A.; Senapati, S.; Khan, M.I.; Kumar, R.; Ramani, R.; Srinivas, V.; Sastry, M. Intracellular Synthesis of Gold Nanoparticles by a Novel AlkalotolerantActinomycete, Rhodococcus Species. Nanotechnology 2003, 14, 824–828. [Google Scholar] [CrossRef]
  38. Krumm, S. WINFIT 1.0—A Computer Program for X-Ray Diffraction Line Profile Analysis. Acta Univ. Carol. Geol. 1994, 38, 253–261. [Google Scholar]
  39. Williams, D.; Carter, C.B. Transmission Electron Microscopy: A Textbook for Materials Science; Plenum Press: New York, NY, USA, 1996. [Google Scholar]
  40. Jeevan, R.; Cromwell, D.A.; Trivella, M.; Lawrence, G.; Kearins, O.; Pereira, J.; Sheppard, C.; Caddy, C.; van der Meulen, J. Reoperation Rates after Breast Conserving Surgery for Breast Cancer among Women in England: Retrospective Study of Hospital Episode Statistics. BMJ 2012, 345, e4505. [Google Scholar] [CrossRef] [Green Version]
  41. Saotome, K.; Morita, H.; Umeda, M. Cytotoxicity Test with Simplified Crystal Violet Staining Method using Microtitre Plates and Its Application to Injection Drugs. Toxicol. In Vitro 1989, 3, 317–321. [Google Scholar] [CrossRef]
  42. Shivananda, C.S.; Asha, S.; Madhukumar, R.; Satish, S.; Narayana, B.; Byrappa, K.; Wang, Y.; Sangappa, Y. Biosynthesis of Colloidal Silver Nanoparticles: Their Characterization and Potential Antibacterial Activity. Macromol. Res. 2016, 24, 684–690. [Google Scholar] [CrossRef]
  43. Rajan, A.; Cherian, E.; Gurunathan, D.B. Biosynthesis of Zinc Oxide Nanoparticles Using Aspergillusfumigatus JCF and Its Antibacterial Activity. Int. J. Mod. Sci. Technol. 2016, 1, 52–57. [Google Scholar]
  44. Kirthi, A.V.; Rahuman, A.A.; Rajakumar, G.; Marimuthu, S.; Santhoshkumar, T.; Jayaseelan, C.; Elango, G.; Zahir, A.A.; Kamaraj, C.; Bagavan, A. Biosynthesis of Titanium Dioxide Nanoparticles Using Bacterium Bacillus subtilis. Mater. Lett. 2011, 65, 2745–2747. [Google Scholar] [CrossRef]
  45. Sun, B.; Reale, T.; Schroeder, S.; Pettey, M.; Smith, R. On the Accuracy of Vaisala RS41 versus RS92 Upper-Air Temperature Observations. J. Atmos. Ocean. Technol. 2019, 36, 635–653. [Google Scholar] [CrossRef]
  46. Yanari, S.; Bovey, F.A. Interpretation of the Ultraviolet Spectral Changes of Proteins. J. Biol. Chem. 1960, 235, 2818–2826. [Google Scholar] [CrossRef]
  47. Nir, S. Polarizability Calculations on Water, Hydrogen, Oxygen, and Carbon Dioxide. J. Chem. Phys. 1973, 59, 3341–3355. [Google Scholar] [CrossRef]
  48. Bregadze, V.; Melikishvili, Z.; Giorgadze, T.; Monaselidze, J.; Jaliashvili, Z.; Khuskivadze, T. Point Defects in Double Helix Induced by Interaction of Silver Nanoparticles with DNA. Russ. Chem. Bull. 2012, 62, 1914–1918. [Google Scholar]
  49. Jyoti, K.; Baunthiyal, M.; Singh, A. Characterization of Silver Nanoparticles Synthesized Using Urticadioica Linn. Leaves and their Synergistic Effects with Antibiotics. J. Radiat. Res. Appl. Sci. 2016, 9, 217–227. [Google Scholar] [CrossRef] [Green Version]
  50. Ahlam, A.A.; Shaniba, V.S.; Jayasree, P.R.; Manish Kumar, P.R. Spondiaspinnata (L.f.) Kurz Leaf Extract Derived Zinc Oxide Nanoparticles Induce Dual Modes of Apoptotic-Necrotic Death in HCT 116 and K562 Cells. Biol. Trace Elem. Res. 2020. [Google Scholar] [CrossRef]
  51. Abdel-Raouf, N.; Al-Enazi, N.; Ibraheem, I.; Alharbi, R.; Alkhulaifi, M. Bactericidal Efficacy of Ag and Au Nanoparticles Synthesized by the Marine Alga Laurenciacatarinensis. Int. J. Pharm. Res. Allied Sci. 2017, 2017, 213–226. [Google Scholar]
  52. Harish Kumar, K.; Savalgi, V. Microbial Synthesis of Zinc Nanoparticles Using Fungus Isolated from Rhizosphere Soil. Int. J. Curr. Microbiol. Appl. Sci. 2017, 6, 2359–2364. [Google Scholar]
  53. Tang, J.; Fu, X.; Ou, Q.; Gao, K.; Man, S.-Q.; Guo, J.; Liu, Y. Hydroxide Assisted Synthesis of Monodisperse and Biocompatible Gold Nanoparticles with Dextran. Mater. Sci. Eng. C 2018, 93, 759–767. [Google Scholar] [CrossRef] [PubMed]
  54. Nugrahani, I.; Ibrahim, S.; Mauludin, R.; Almira, M. Hydrate Transformation Study of Fluoroquinolone Antibiotics Using Fourier Transform Infrared Spectroscopy (FTIR). Int. J. Pharm. Pharm. Sci. 2015, 7, 246–252. [Google Scholar]
  55. Tiernan, H.; Byrne, B.; Kazarian, S.G. ATR-FTIR Spectroscopy and Spectroscopic Imaging for the Analysis of Biopharmaceuticals. Spectrochim. Acta Part A 2020, 241, 118636. [Google Scholar] [CrossRef] [PubMed]
  56. Ravulapalli, S.; Mariserla, B.M.K.; Soma, V.R.; Saritha, R.; Rao, D. Biosynthesis of Silver Nanoparticles Using CoriandrumSativum Leaf Extract and Their Application in Nonlinear Optics. Adv. Sci. Lett. 2010, 3, 138–144. [Google Scholar]
  57. Smith, R.C. Infrared Spectra of Substituted1, 10-Phenanthrolines. Ph.D. Thesis, Iowa State University, Ames, IA, USA, 1961. [Google Scholar]
  58. Rahman, M.T.; Vargas, M.; Ramana, C.V. Structural Characteristics, Electrical Conduction and Dielectric Properties of Gadolinium Substituted Cobalt Ferrite. J. Alloy. Compd. 2014, 617, 547–562. [Google Scholar] [CrossRef]
  59. Suresh, S.; Karthikeyan, S.; Jayamoorthy, K. FTIR and Multivariate Analysis to Study the Effect of Bulk and Nano Copper Oxide on Peanut Plant Leaves. J. Sci. Adv. Mater. Devices 2016, 1, 343–350. [Google Scholar] [CrossRef] [Green Version]
  60. Rahim, A.; Amiri, S. Anti-Corrosion Hybrid Nanocomposite Coatings with Encapsulated Organic Corrosion Inhibitors. J. Polym. Res. 2015, 12, 587–593. [Google Scholar]
  61. Ding, D.; Liu, K.; He, S.; Gao, C.; Yin, Y. Ligand-Exchange Assisted Formation of Au/TiO2Schottky Contact for Visible-Light Photocatalysis. Nano Lett. 2014, 14, 6731–6736. [Google Scholar] [CrossRef] [Green Version]
  62. Ansari, S.; Khan, M.M.; Ansari, M.; Cho, M.H. Silver Nanoparticles and Defect-Induced Visible Light Photocatalytic and Photoelectrochemical Performance of Ag@m-TiO2 Nanocomposite. Sol. Energy Mater. Sol. Cells 2015, 141, 162–170. [Google Scholar] [CrossRef]
  63. Ottoni, C.A.; Simões, M.F.; Fernandes, S.; dos Santos, J.G.; da Silva, E.S.; de Souza, R.F.B.; Maiorano, A.E. Screening of Filamentous Fungi for Antimicrobial Silver Nanoparticles Synthesis. AMB Express 2017, 7, 31. [Google Scholar] [CrossRef] [Green Version]
  64. Chaudhuri, S.K.; Malodia, L. Biosynthesis of Zinc Oxide Nanoparticles Using Leaf Extract of Calotropisgigantea: Characterization and Its Evaluation on Tree Seedling Growth in Nursery Stage. Appl. Nanosci. 2017, 7, 501–512. [Google Scholar] [CrossRef]
  65. Boningari, T.; Inturi, S.N.R.; Suidan, M.; Smirniotis, P.G. Novel One-Step Synthesis of Sulfur Doped-TiO2 by Flame Spray Pyrolysis for Visible Light Photocatalytic Degradation of Acetaldehyde. Chem. Eng. J. 2018, 339, 249–258. [Google Scholar] [CrossRef]
  66. Wannes, B.; Zaghouania, B.R.; Dimassia, W. Effect of Experimental Condition on Properties of Zinc Oxide Films Prepared by Sol-Gel Deposition with Ammonium Hydroxide as an Additive. J. Text. Sci. Eng. 2018, 8, 2165–3064. [Google Scholar]
  67. Roy, A.; Parveen, A.; Koppalkar, A.; Prasad, M. Effect of Nano-Titanium Dioxide with Different Antibiotics against Methicillin- Resistant Staphylococcus Aureus. J. Biomater. Nanobiotechnol. 2010, 1, 37. [Google Scholar] [CrossRef] [Green Version]
  68. Hajimohammad, A.; Fozouni, L. Antibacterial Effect of Zinc Oxide Nanoparticles on Mupirocin-Resistant Staphylococcus aureus Isolated from Nasal Carriers. Int. J. Basic Sci. Med. 2018, 3, 78–82. [Google Scholar] [CrossRef]
  69. Jesline, A.; John, N.P.; Narayanan, P.M.; Vani, C.; Murugan, S. Antimicrobial Activity of Zinc and Titanium Dioxide Nanoparticles against Biofilm-Producing Methicillin-Resistant Staphylococcus aureus. Appl. Nanosci. 2015, 5, 157–162. [Google Scholar] [CrossRef] [Green Version]
  70. Jiang, H.S.; Qiu, X.-N.; Li, G.-B.; Li, W.; Yin, L. Silver Nanoparticles Induced Accumulation of Reactive Oxygen Species and Alteration of Antioxidant Systems in the Aquatic Plant Spirodelapolyrhiza. Environ. Toxicol. Chem. 2014, 33, 1398–1405. [Google Scholar] [CrossRef]
  71. Tewari, S. Green Synthesis, Characterization and Antibacterial Activity of ZnO Nanoparticles. Am. J. Plant Sci. 2018, 9, 2158–2742. [Google Scholar]
  72. Chang, T.C.; Chen, C.-C.; Cheng, K.M.; Chin, C.Y.; Chen, Y.H.; Chen, X.A.; Sun, J.-R.; Young, J.J.; Chiueh, T.-S. Trimethyl Chitosan-Capped Silver Nanoparticles with Positive Surface Charge: Their Catalytic Activity and Antibacterial Spectrum Including Multidrug-Resistant Strains of Acinetobacterbaumannii. Colloids Surf. B 2017, 155, 61–70. [Google Scholar] [CrossRef]
  73. Ajitha, B.; Ashok Kumar Reddy, Y.; Reddy, P.S. Biogenic Nano-Scale Silver Particles by Tephrosiapurpurea Leaf Extract and their Inborn Antimicrobial Activity. Spectrochim. Acta Part A 2014, 121, 164–172. [Google Scholar] [CrossRef]
  74. Palanikumar, L.; Ramasamy, S.; Balachandran, C. Size-Dependent Antimicrobial Response of Zinc Oxide Nanoparticles. Nanobiotechnol. IET 2014, 8, 111–117. [Google Scholar] [CrossRef]
  75. Jones, N.; Ray, B.; Ranjit, K.; Manna, A. Antibacterial Activity of ZnO Nanoparticle Suspensions on a Broad Spectrum of Microorganisms. FEMS Microbiol. Lett. 2008, 279, 71–76. [Google Scholar] [CrossRef] [PubMed] [Green Version]
  76. Liu, L.; Yang, J.; Xie, J.; Luo, Z.; Jiang, J.; Yang, Y.; Liu, S. The Potent Antimicrobial Properties of Cell Penetrating Peptide-Conjugated Silver Nanoparticles with Excellent Selectivity for Gram-Positive Bacteria over Erythrocytes. Nanoscale 2013, 5, 3834–3840. [Google Scholar] [CrossRef]
  77. Hsiao, I.L.; Huang, Y.-J. Effects of Various Physicochemical Characteristics on the Toxicities of ZnO and TiO2 Nanoparticles toward Human Lung Epithelial Cells. Sci. Total Environ. 2011, 409, 1219–1228. [Google Scholar] [CrossRef]
  78. Sirelkhatim, A.; Mahmud, S.; Seeni, A.; Kaus, N.H.M.; Ann, L.C.; Bakhori, S.K.M.; Hasan, H.; Mohamad, D. Review on Zinc Oxide Nanoparticles: Antibacterial Activity and Toxicity Mechanism. Nano-Micro Lett. 2015, 7, 219–242. [Google Scholar] [CrossRef] [PubMed] [Green Version]
  79. Gupta, G.; Senapati, V.; Dhawan, A.; Shanker, R. Heteroagglomeration of Zinc Oxide Nanoparticles with Clay Mineral Modulates the Bioavailability and Toxicity of Nanoparticle in Tetrahymena pyriformis. J. Colloid Interface Sci. 2017, 495, 9–18. [Google Scholar] [CrossRef] [PubMed]
  80. Banerjee, S.; Gopal, J.; Muraleedharan, P.; Tyagi, A.; Raj, B. Physics and Chemistry of Photocatalytic Titanium Dioxide: Visualization of Bactericidal Activity Using Atomic Force Microscopy. Curr. Sci. 2006, 90, 1378–1383. [Google Scholar]
  81. Dizaj, S.M.; Lotfipour, F.; Barzegar-Jalali, M.; Zarrintan, M.H.; Adibkia, K. Antimicrobial Activity of the Metals and Metal Oxide Nanoparticles. Mater. Sci. Eng. C 2014, 44, 278–284. [Google Scholar] [CrossRef]
  82. Barua, S.; Konwarh, D.R.; Bhattacharya, S.S.; Das, P.; Devi, K.S.; Maiti, T.; Mandal, M.; Karak, N. Non-Hazardous Anticancerous and Antibacterial Colloidal ‘Green’ Silver Nanoparticles. Colloids Surf. B 2012, 105, 37–42. [Google Scholar] [CrossRef] [PubMed]
  83. Gomaa, E.Z. Antimicrobial, Antioxidant and Antitumor Activities of Silver Nanoparticles Synthesized by Allium cepa Extract: A Green Approach. J. Genet. Eng. Biotechnol. 2017, 15, 49–57. [Google Scholar] [CrossRef]
  84. Ahamed, M.; Khan, M.A.M.; Akhtar, M.J.; Alhadlaq, H.A.; Alshamsan, A. Ag-Doping Regulates the Cytotoxicity of TiO2 Nanoparticles via Oxidative Stress in Human Cancer Cells. Sci. Rep. 2017, 7, 17662. [Google Scholar] [CrossRef]
  85. Behzadi, S.; Serpooshan, V.; Tao, W.; Hamaly, M.A.; Alkawareek, M.Y.; Dreaden, E.C.; Brown, D.; Alkilany, A.M.; Farokhzad, O.C.; Mahmoudi, M. Cellular Uptake of Nanoparticles: Journey inside the Cell. Chem. Soc. Rev. 2017, 46, 4218–4244. [Google Scholar] [CrossRef]
  86. Lu, P.J.; Fang, S.W.; Cheng, W.L.; Huang, S.C.; Huang, M.C.; Cheng, H.F. Characterization of Titanium Dioxide and Zinc Oxide Nanoparticles in Sunscreen Powder by Comparing Different Measurement Methods. J. Food Drug Anal. 2018, 26, 1192–1200. [Google Scholar] [CrossRef]
  87. Lucky, S.S.; Soo, K.C.; Zhang, Y. Nanoparticles in Photodynamic Therapy. Chem. Rev. 2015, 115, 1990–2042. [Google Scholar] [CrossRef]
  88. Sakhrani, N.; Padh, H. Organelle Targeting: Third Level of Drug Targeting. Drug Des. Dev. Ther. 2013, 7, 585–599. [Google Scholar]
  89. Hou, X.-S.; Wang, H.-S.; Mugaka, B.P.; Yang, G.-J.; Ding, Y. Mitochondria: Promising Organelle Targets for Cancer Diagnosis and Treatment. Biomater. Sci. 2018, 6, 2786–2797. [Google Scholar] [CrossRef]
  90. Taş, A.; Cakmak, N.; Ağbektaş, T.; Silig, Y. Cytotoxic Activity of Zinc Oxide/Titanium Dioxide Nanoparticles on Prostate Cancer Cells. Int. J. Chem. Technol. 2019, 3, 113–120. [Google Scholar] [CrossRef]
  91. Yoon, J.Y. Basic Principles of Electrochemical Bio sensing Using a Smartphone; Elsevier: Amsterdam, The Netherlands, 2020. [Google Scholar]
  92. Dong, X.-X.; Yang, J.-Y.; Luo, L.; Zhang, Y.-F.; Mao, C.; Sun, Y.-M.; Lei, H.-T.; Shen, Y.-D.; Beier, R.C.; Xu, Z.-L. Portable AmperometricImmunosensor for Histamine Detection Using Prussian Blue-Chitosan-Gold Nanoparticle Nanocomposite Films. Biosens. Bioelectron. 2017, 98, 305–309. [Google Scholar] [CrossRef] [Green Version]
  93. Ma, H.; Gao, P.; Qian, P.; Su, Y. Size-Dependent Electrochemical Properties of Pure Metallic Nanoparticles. J. Phys. Chem. C 2020, 124, 3403–3409. [Google Scholar] [CrossRef]
  94. Braun, T.; Ghatkesar, M.K.; Backmann, N.; Grange, W.; Boulanger, P.; Letellier, L.; Lang, H.-P.; Bietsch, A.; Gerber, C.; Hegner, M. Quantitative Time-Resolved Measurement of Membrane Protein–Ligand Interactions Using Microcantilever Array Sensors. Nat. Nanotechnol. 2009, 4, 179–185. [Google Scholar] [CrossRef] [PubMed]
  95. Murugesan, B.; Sonamuthu, J.; Samayanan, S.; Arumugam, S.; Mahalingam, S. Highly Biological Active Antibiofilm, Anticancer and Osteoblast Adhesion Efficacy from MWCNT/PPy/Pd Nanocomposite. Appl. Surf. Sci. 2018, 434, 400–411. [Google Scholar] [CrossRef]
Figure 1. Ultra-violet visible spectrophotometer recorded after 72 h of reactions of solution of AgNPs, ZnONPsand TiO2NPs.
Nanomaterials 11 00903 g001
Figure 2. Ultra-violet visible spectra recorded of nanocomposites before and after sonication.
Nanomaterials 11 00903 g002aNanomaterials 11 00903 g002b
Figure 3. FTIR of (A) AgNPs, ZnONPs and TiO2NPs; (B) composite 500 μL AgNPs–500 μL ZnONPs; (C) composite 750 μL AgNPs–250 μL ZnONPs; (D) composite 750 μL TiO2NPs–250 μL ZnONPs before and after.
Nanomaterials 11 00903 g003
Figure 4. TEM micrograph (A) AgNPs, (B) ZnONPs, (C) TiO2NPs.
Nanomaterials 11 00903 g004aNanomaterials 11 00903 g004b
Figure 5. TEM micrograph (A,B) composite 500 μL AgNPs–500 μL ZnONPs; (C,D) composite 750 μL AgNPs–250 μL ZnO nanoparticles; (E,F) composite 750 μL TiO2 nanoparticles–250 μL ZnO nanoparticles.
Nanomaterials 11 00903 g005
Figure 6. X-ray diffraction pattern of AgNPs (A), ZnONPs (B), TiO2NPs (C) and diffraction pattern of composite nanoparticles (D) composite 500 μL AgNPs–500 μL ZnO nanoparticles, composite 750 μL AgNPs–250 μL ZnO nanoparticles and composite 750 μL TiO2 nanoparticles–250 μL ZnO nanoparticles.
Nanomaterials 11 00903 g006aNanomaterials 11 00903 g006b
Figure 7. The inhibition zones of biosynthesized nanoparticles and capping nanocomposite. SD±, standard deviation.
Nanomaterials 11 00903 g007
Figure 8. The antimicrobial activity of the nanoparticles and nanocomposite produced against Pseudomonas aeruginosa showing increasing inhibition zone with increasing amounts of nanoparticles: 6.25, 12.5, 25, 50 and 100 μL with volume made up to 100 μL with distilled water wherever needed. Zinc oxide nanoparticles (ZnONPs); silver nanoparticles (AgNPs); composite 500 μL AgNPs–500 μL ZnONPs; composite 750 μL AgNPs–250 μL ZnONPs nanoparticles. SD±, standard deviation.
Nanomaterials 11 00903 g008
Figure 9. The antimicrobial activity of the nanoparticles and nanocomposite produced against Escherichia coli. Data showing increasing inhibition zone with increasing amounts of nanoparticles: 6.25, 12.5, 25, 50 and 100 μL with volume made up to 100 μL with distilled water wherever needed. Zinc oxide nanoparticles (ZnONPs); silver nanoparticles (AgNPs); composite 500 μL AgNPs–500 μL ZnONPs; composite 750 μL AgNPs–250 μL ZnONPs nanoparticles. SD±, standard deviation.
Nanomaterials 11 00903 g009
Figure 10. The antimicrobial activity of the nanoparticles and nanocomposite produced against human pathogenic microbe: Staphylococcus aureus. Data showing increasing inhibition zone with increasing amounts of nanoparticles: 6.25, 12.5, 25, 50 and 100 μL with volume made up to 100 μL with distilled water wherever needed. Zinc oxide nanoparticles (ZnONPs); silver nanoparticles (AgNPs); composite 500 μL AgNPs–500 μL ZnONPs; composite 750 μL AgNPs–250 μL ZnONPs nanoparticles. SD±, standard deviation.
Nanomaterials 11 00903 g010
Figure 11. The antimicrobial activity of the nanoparticles and nanocomposite produced against human pathogenic microbe: MRSA sp. Data showing increasing inhibition zone with increasing amounts of nanoparticles: 6.25, 12.5, 25, 50 and 100 μL with volume made up to 100 μL with distilled water wherever needed. Zinc oxide nanoparticles (ZnONPs); silver nanoparticles (AgNPs); composite 500 μL AgNPs–500 μL ZnONPs; composite 750 μL AgNPs–250 μL ZnONPs nanoparticles. SD±, standard deviation.
Nanomaterials 11 00903 g011
Figure 12. Viability of HCT-116 cells (colon carcinoma cell) (24 h incubation). Treatment with cell filtrate of Aspergillusoryzae as control and treatment with silver biosynthesized nanoparticles (AgNPs).
Nanomaterials 11 00903 g012
Figure 13. Viability of HCT-116 cells (colon carcinoma cell) (24 h incubation). Treatment with cell filtrate of Asperagillusterreus as control and treatment with zinc oxide biosynthesized nanoparticles (ZnONPs).
Nanomaterials 11 00903 g013
Figure 14. Viability of HCT-116 cells (colon carcinoma cell) (24 h incubation). Treatment with cell filtrate of Fusariumoxysporium as control and treatment with titanium dioxide biosynthesized nanoparticles (TiO2NPs).
Nanomaterials 11 00903 g014
Figure 15. Viability of HCT-116 cells (colon carcinoma cell) (24 h incubation) and treatment with titanium dioxide biosynthesized nanoparticles. Composite 500 μL silver nanoparticles–500 μL zinc oxide nanoparticles; composite 750 μL silver–250 μL zinc oxide nanoparticles; composite 750 μL titanium dioxide nanoparticles–250 μL Zinc oxide nanoparticles.
Nanomaterials 11 00903 g015
Table 1. Mixed ratio nanocomposite (v/v) between Ag, ZnO and TiO2 nanoparticles.
No.Nanoparticles μLNo.Nanoparticles μL
1250 μL AgNPs750 μL ZnONPs8250 μL ZnONPs750 μL TiO2NPs
2250 μL AgNPs750 μL TiO2NPs9333 μL ZnONPs667 μL AgNPs
3333 μL AgNPs667 μL ZnONPs10333 μL ZnONPs667 μL TiO2NPs
4333 μL AgNPs667 μL TiO2NPss11250 μL TiO2NPs750 μL AgNPs
5500 μL AgNPs500 μL ZnONPs12250 μL TiO2NPs750 μL ZnONPs
6500 μL AgNPs500 μL TiO2NPs13333 μL TiO2NPs667 μL AgNPs
7250 μL ZnONPs750 μL AgNPs14333 μL TiO2NPs667 μL ZnONPs
AgNPs: silver nanoparticles, ZnONPs: Zinc oxide nanoparticles, TiO2NPs: Titanium dioxide nanoparticles.
Publisher’s Note: MDPI stays neutral with regard to jurisdictional claims in published maps and institutional affiliations.

