
Designing a Sustainability Assessment Framework for Selecting Sustainable Wastewater Treatment Technologies in Corporate Asset Decisions


Abstract
: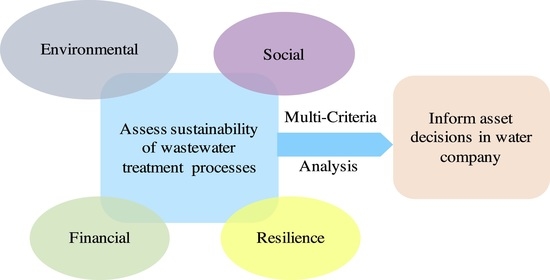
1. Introduction
- Comprehensiveness: sustainability assessment should cover a holistic scope integrating the environmental, social and economic dimension of sustainability
- Pluralism: compared to the prescriptive process of other impact assessments, each sustainability assessment process should be designed and tailored to the specific context [15]
- Intergenerational equity: wider and long-term impacts should also be assessed to ensure the decision demonstrates corporate social responsibility and value for future generations [17]
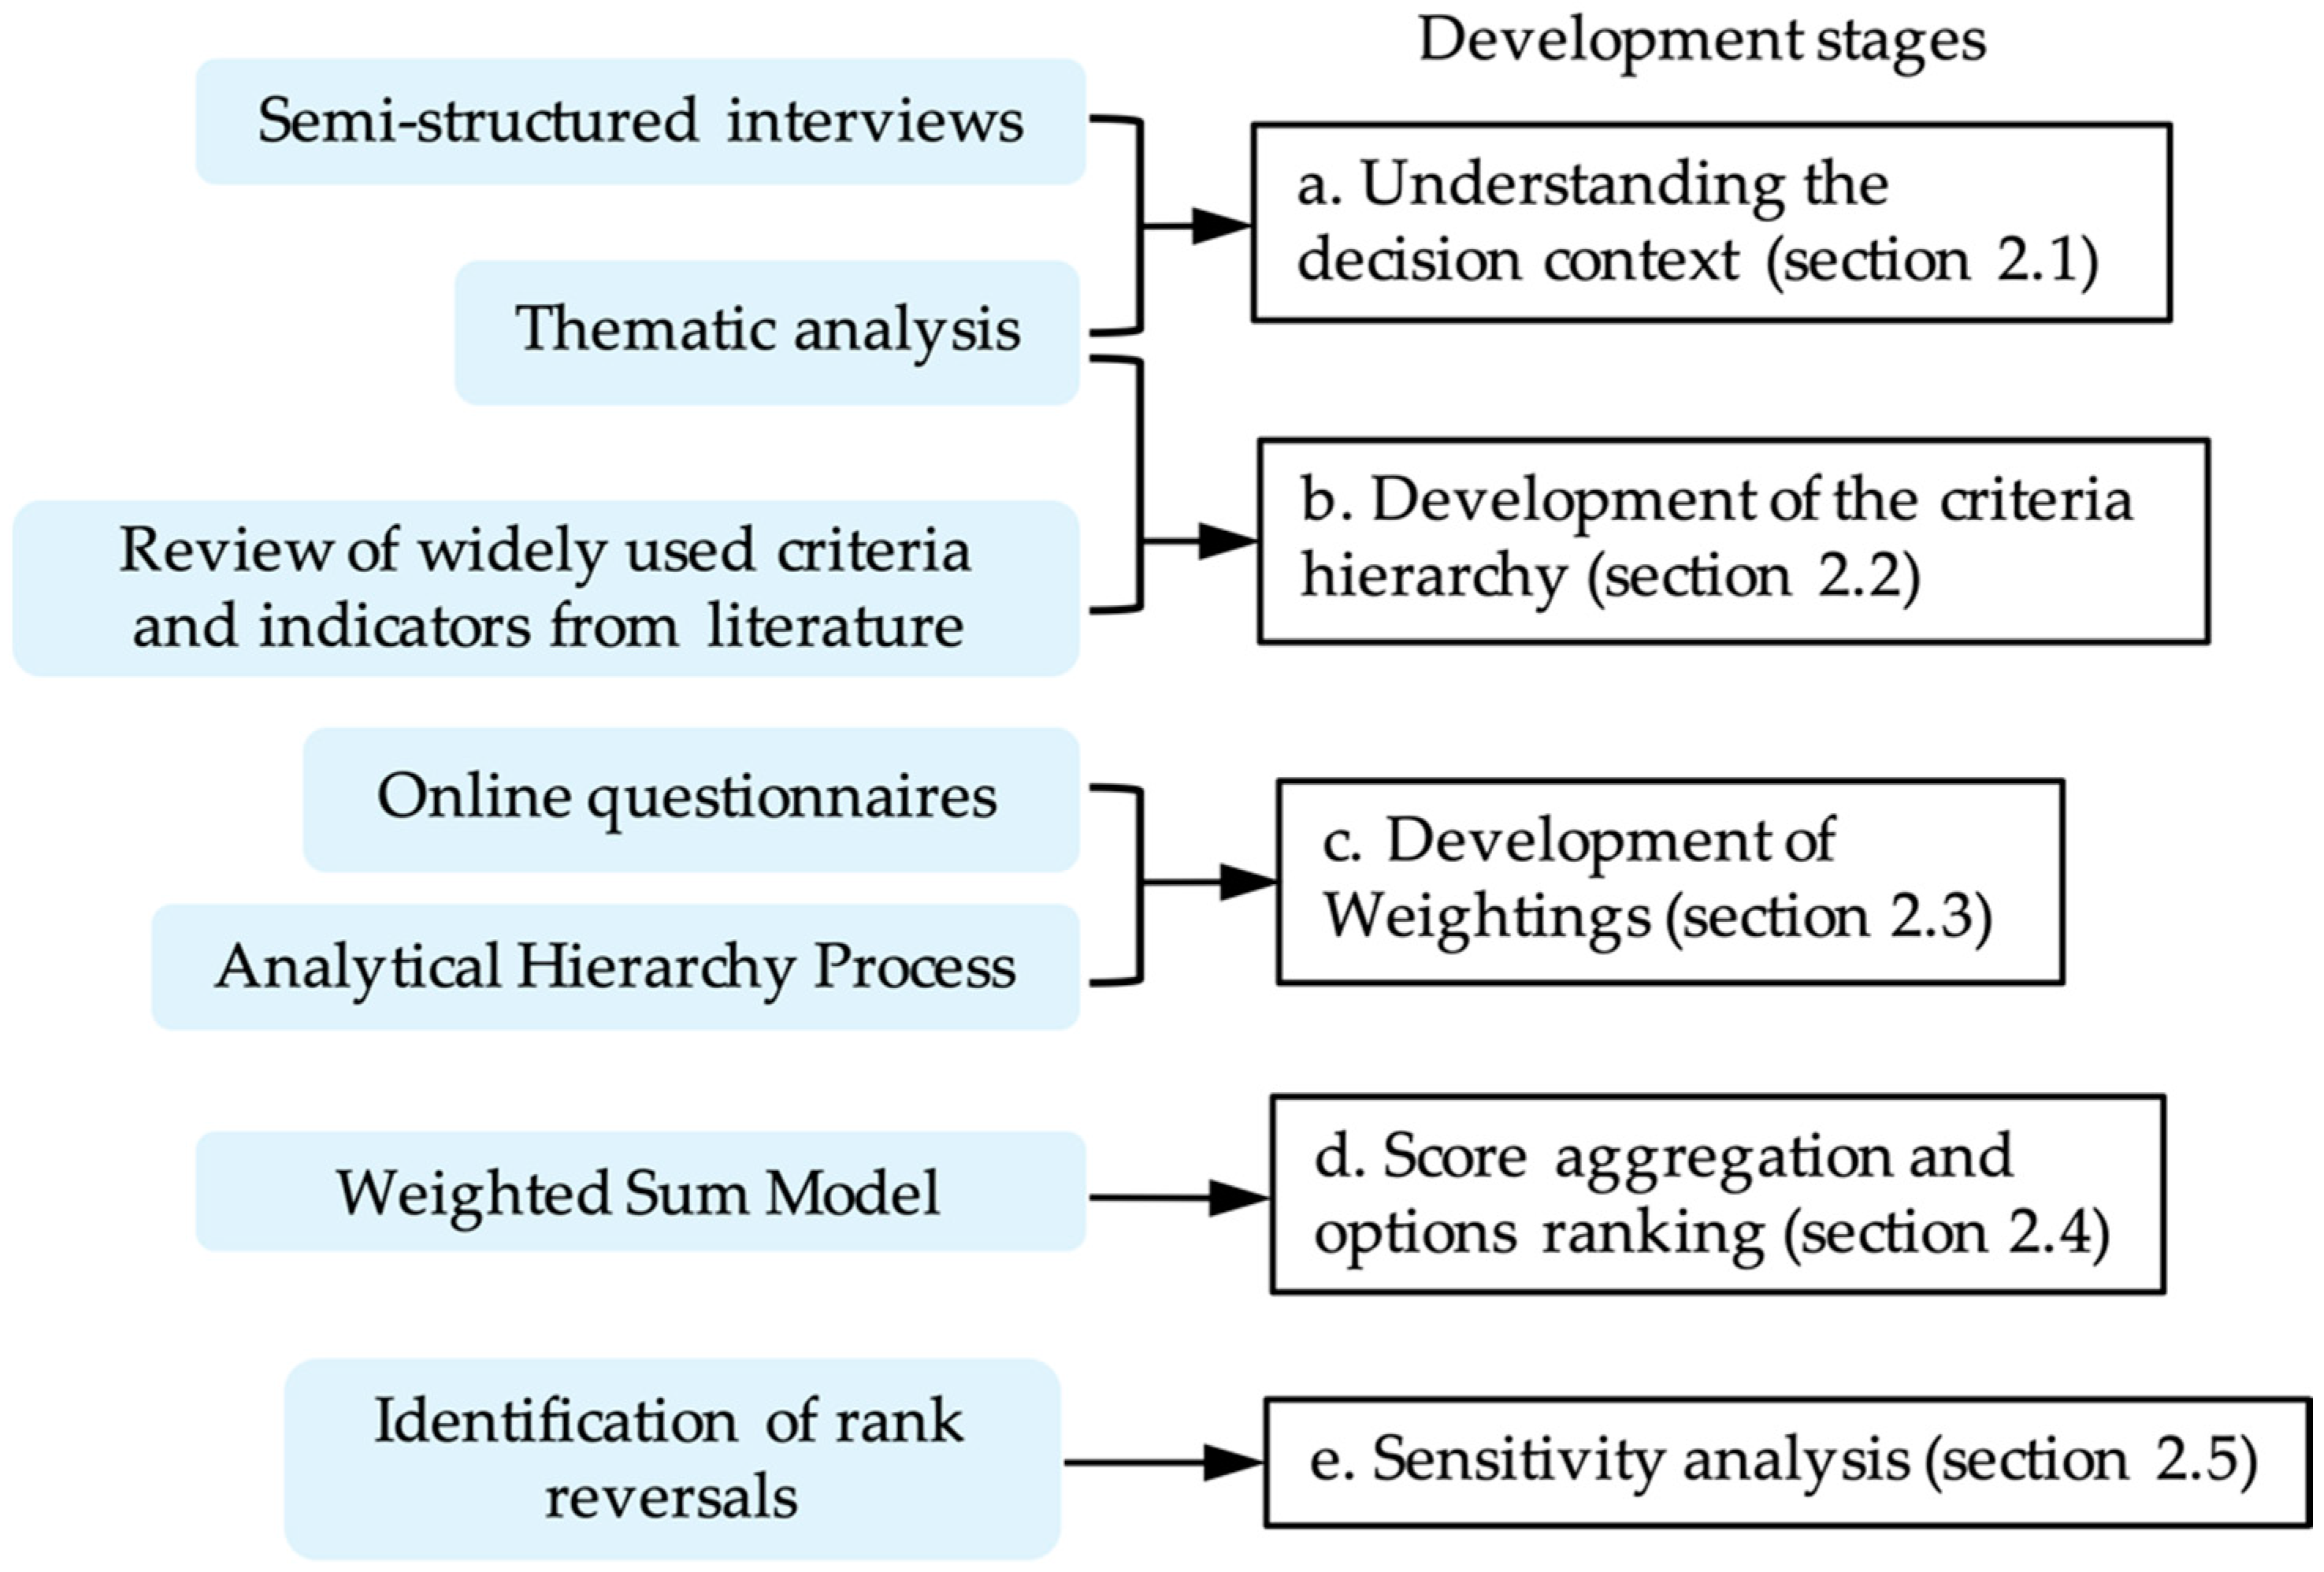
2. Materials and Methods
2.1. Understand the Decision Context
- (1)
- What is your role and daily activities in the company?
- (2)
- What are the current decision-making practices and drivers for wastewater asset investment?
- (3)
- What are the biggest challenges in making that decision?
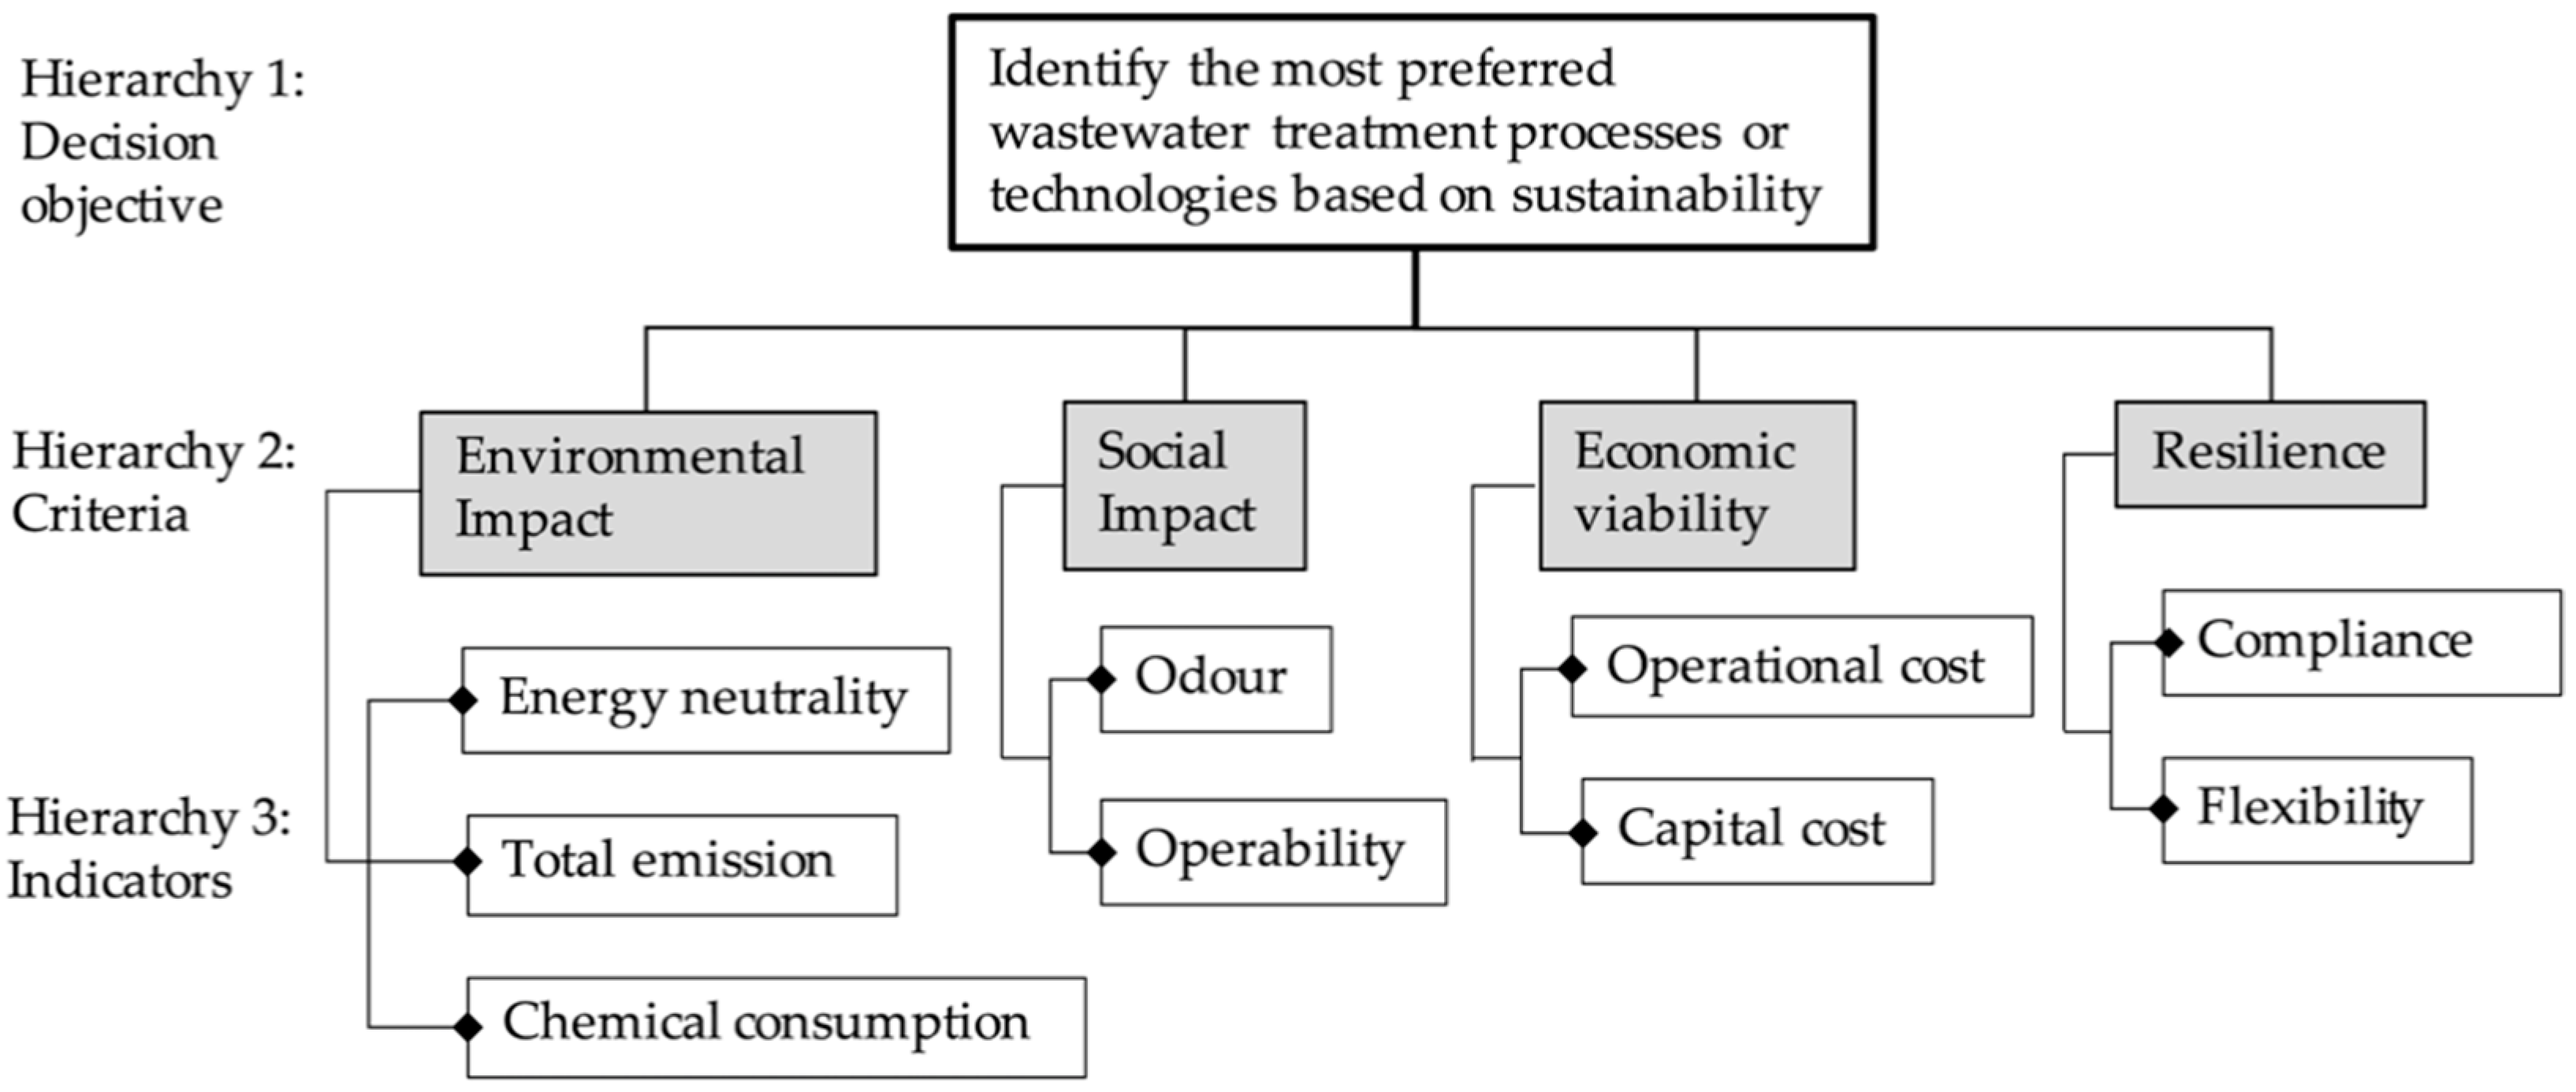
2.2. Development of the Criteria Hierarchy
2.3. Development of Weightings
2.3.1. Weighting Allocation Using AHP
2.3.2. Group Weightings
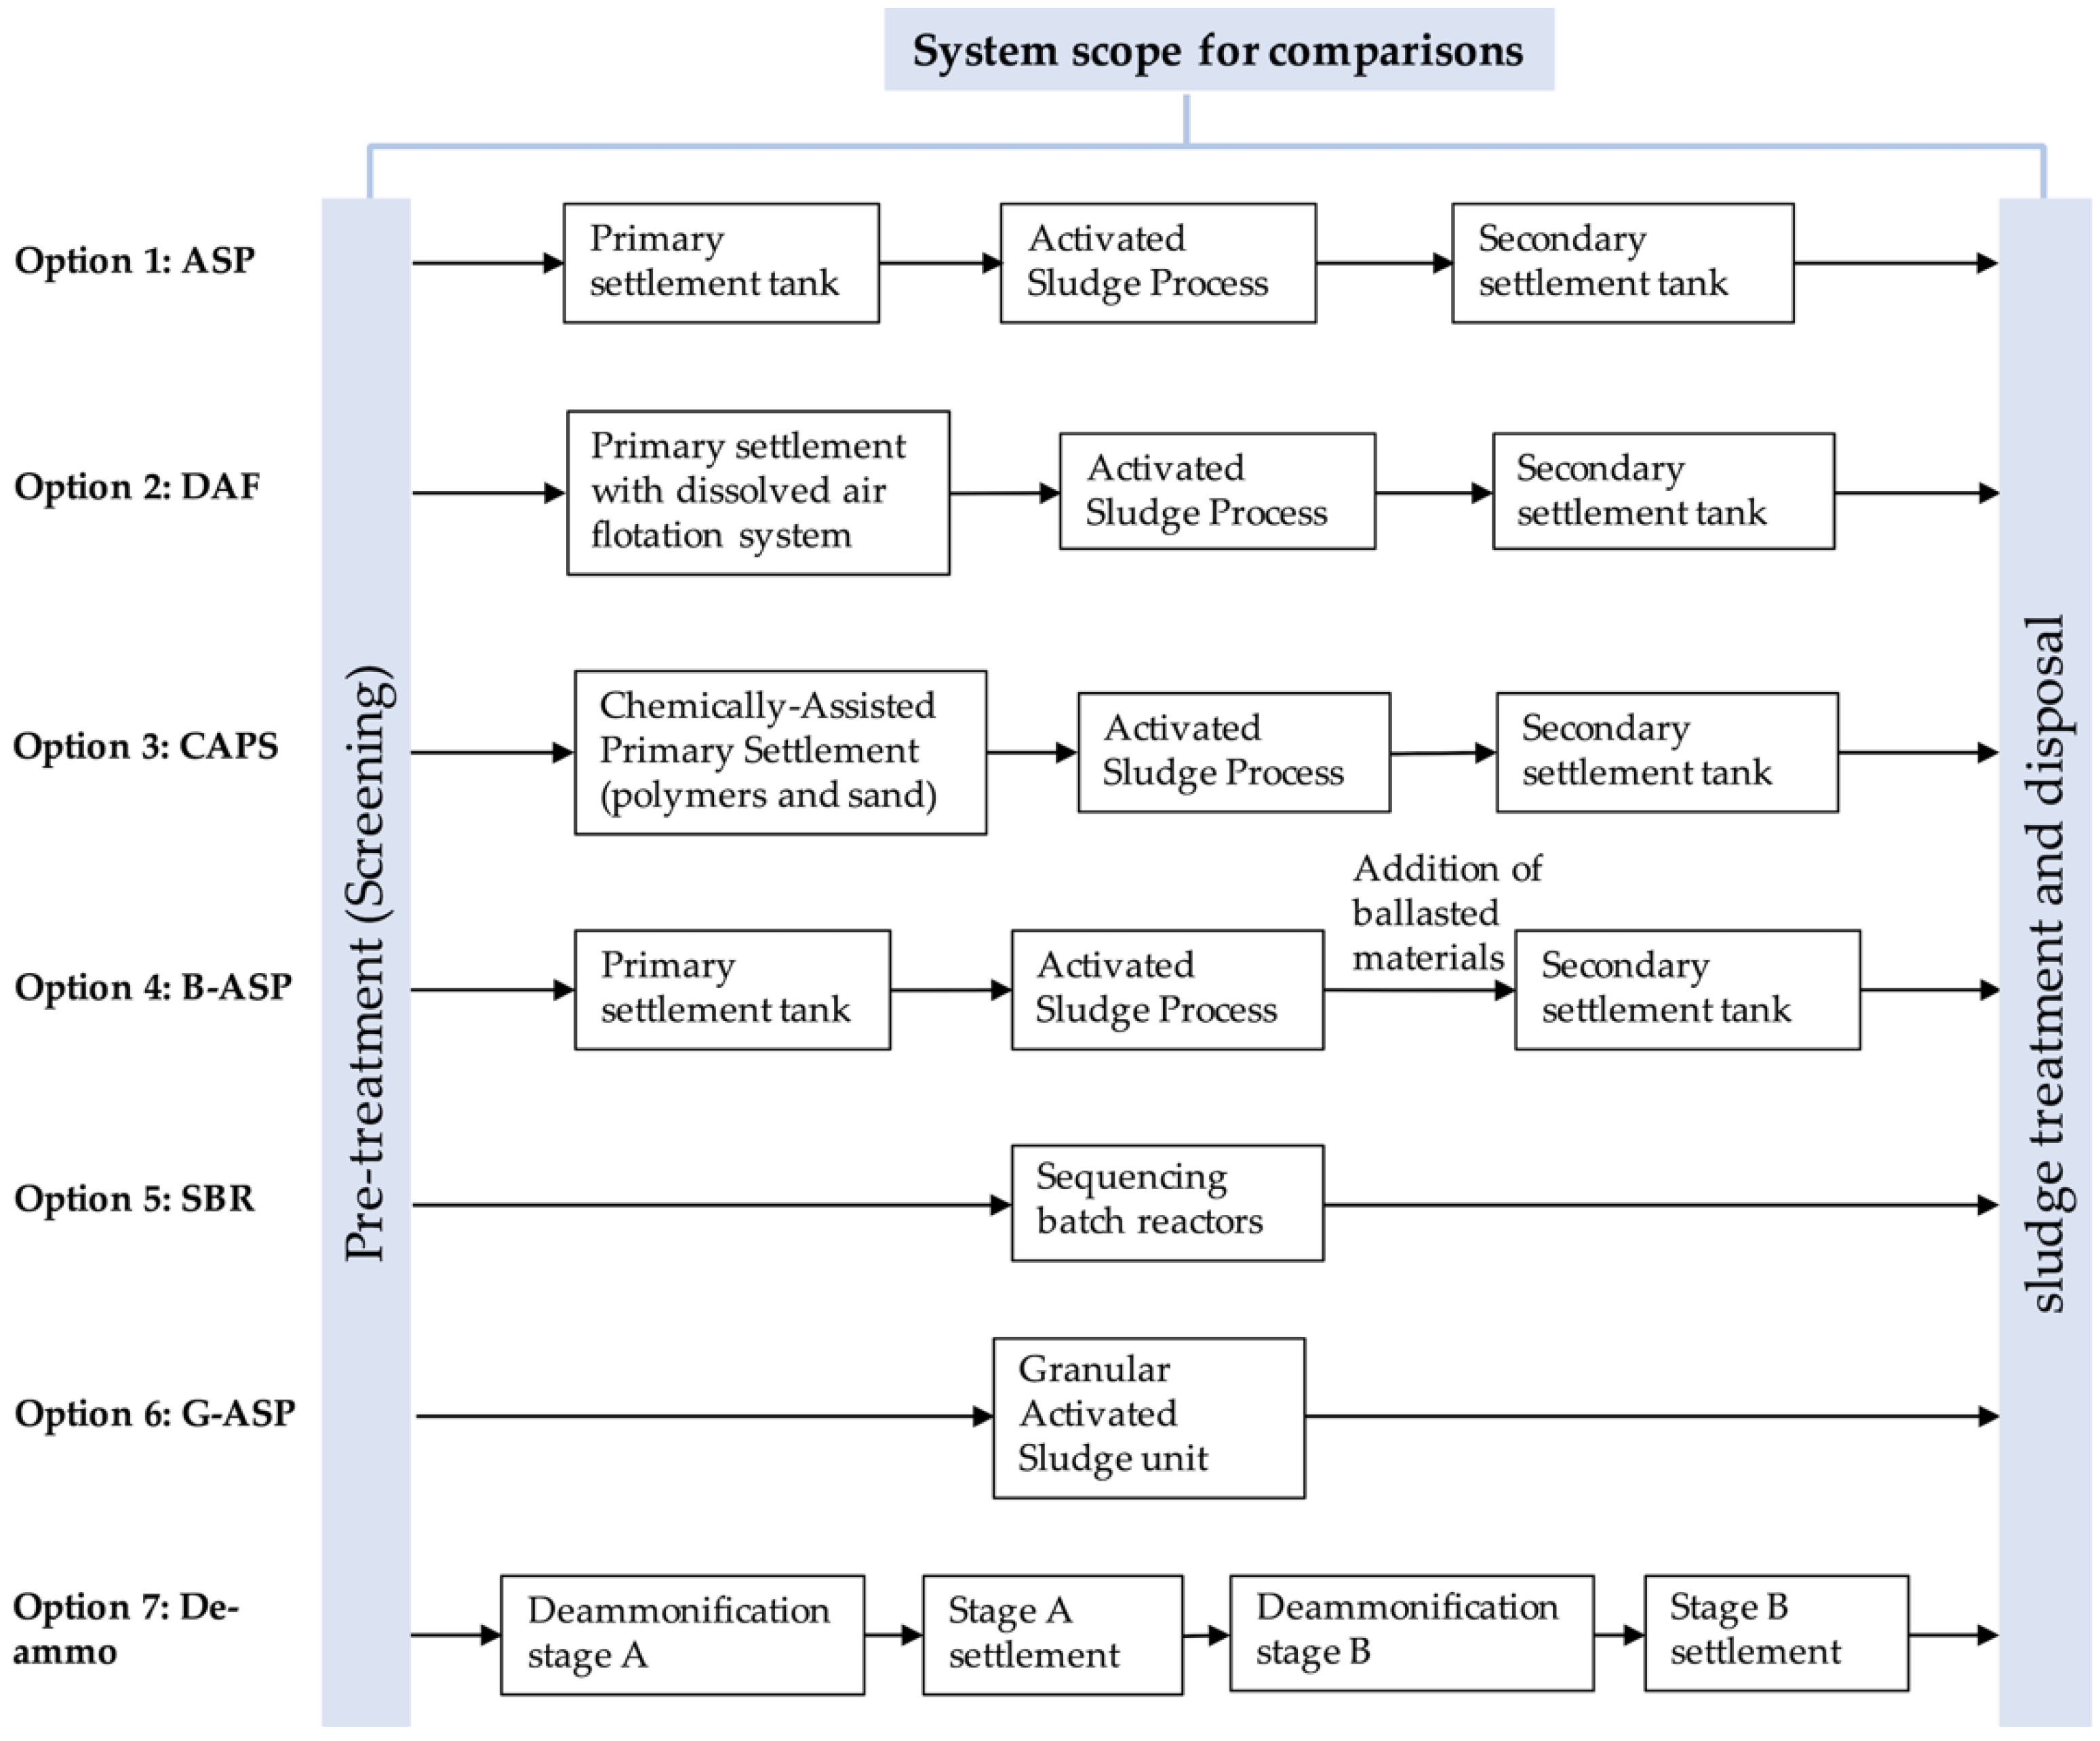
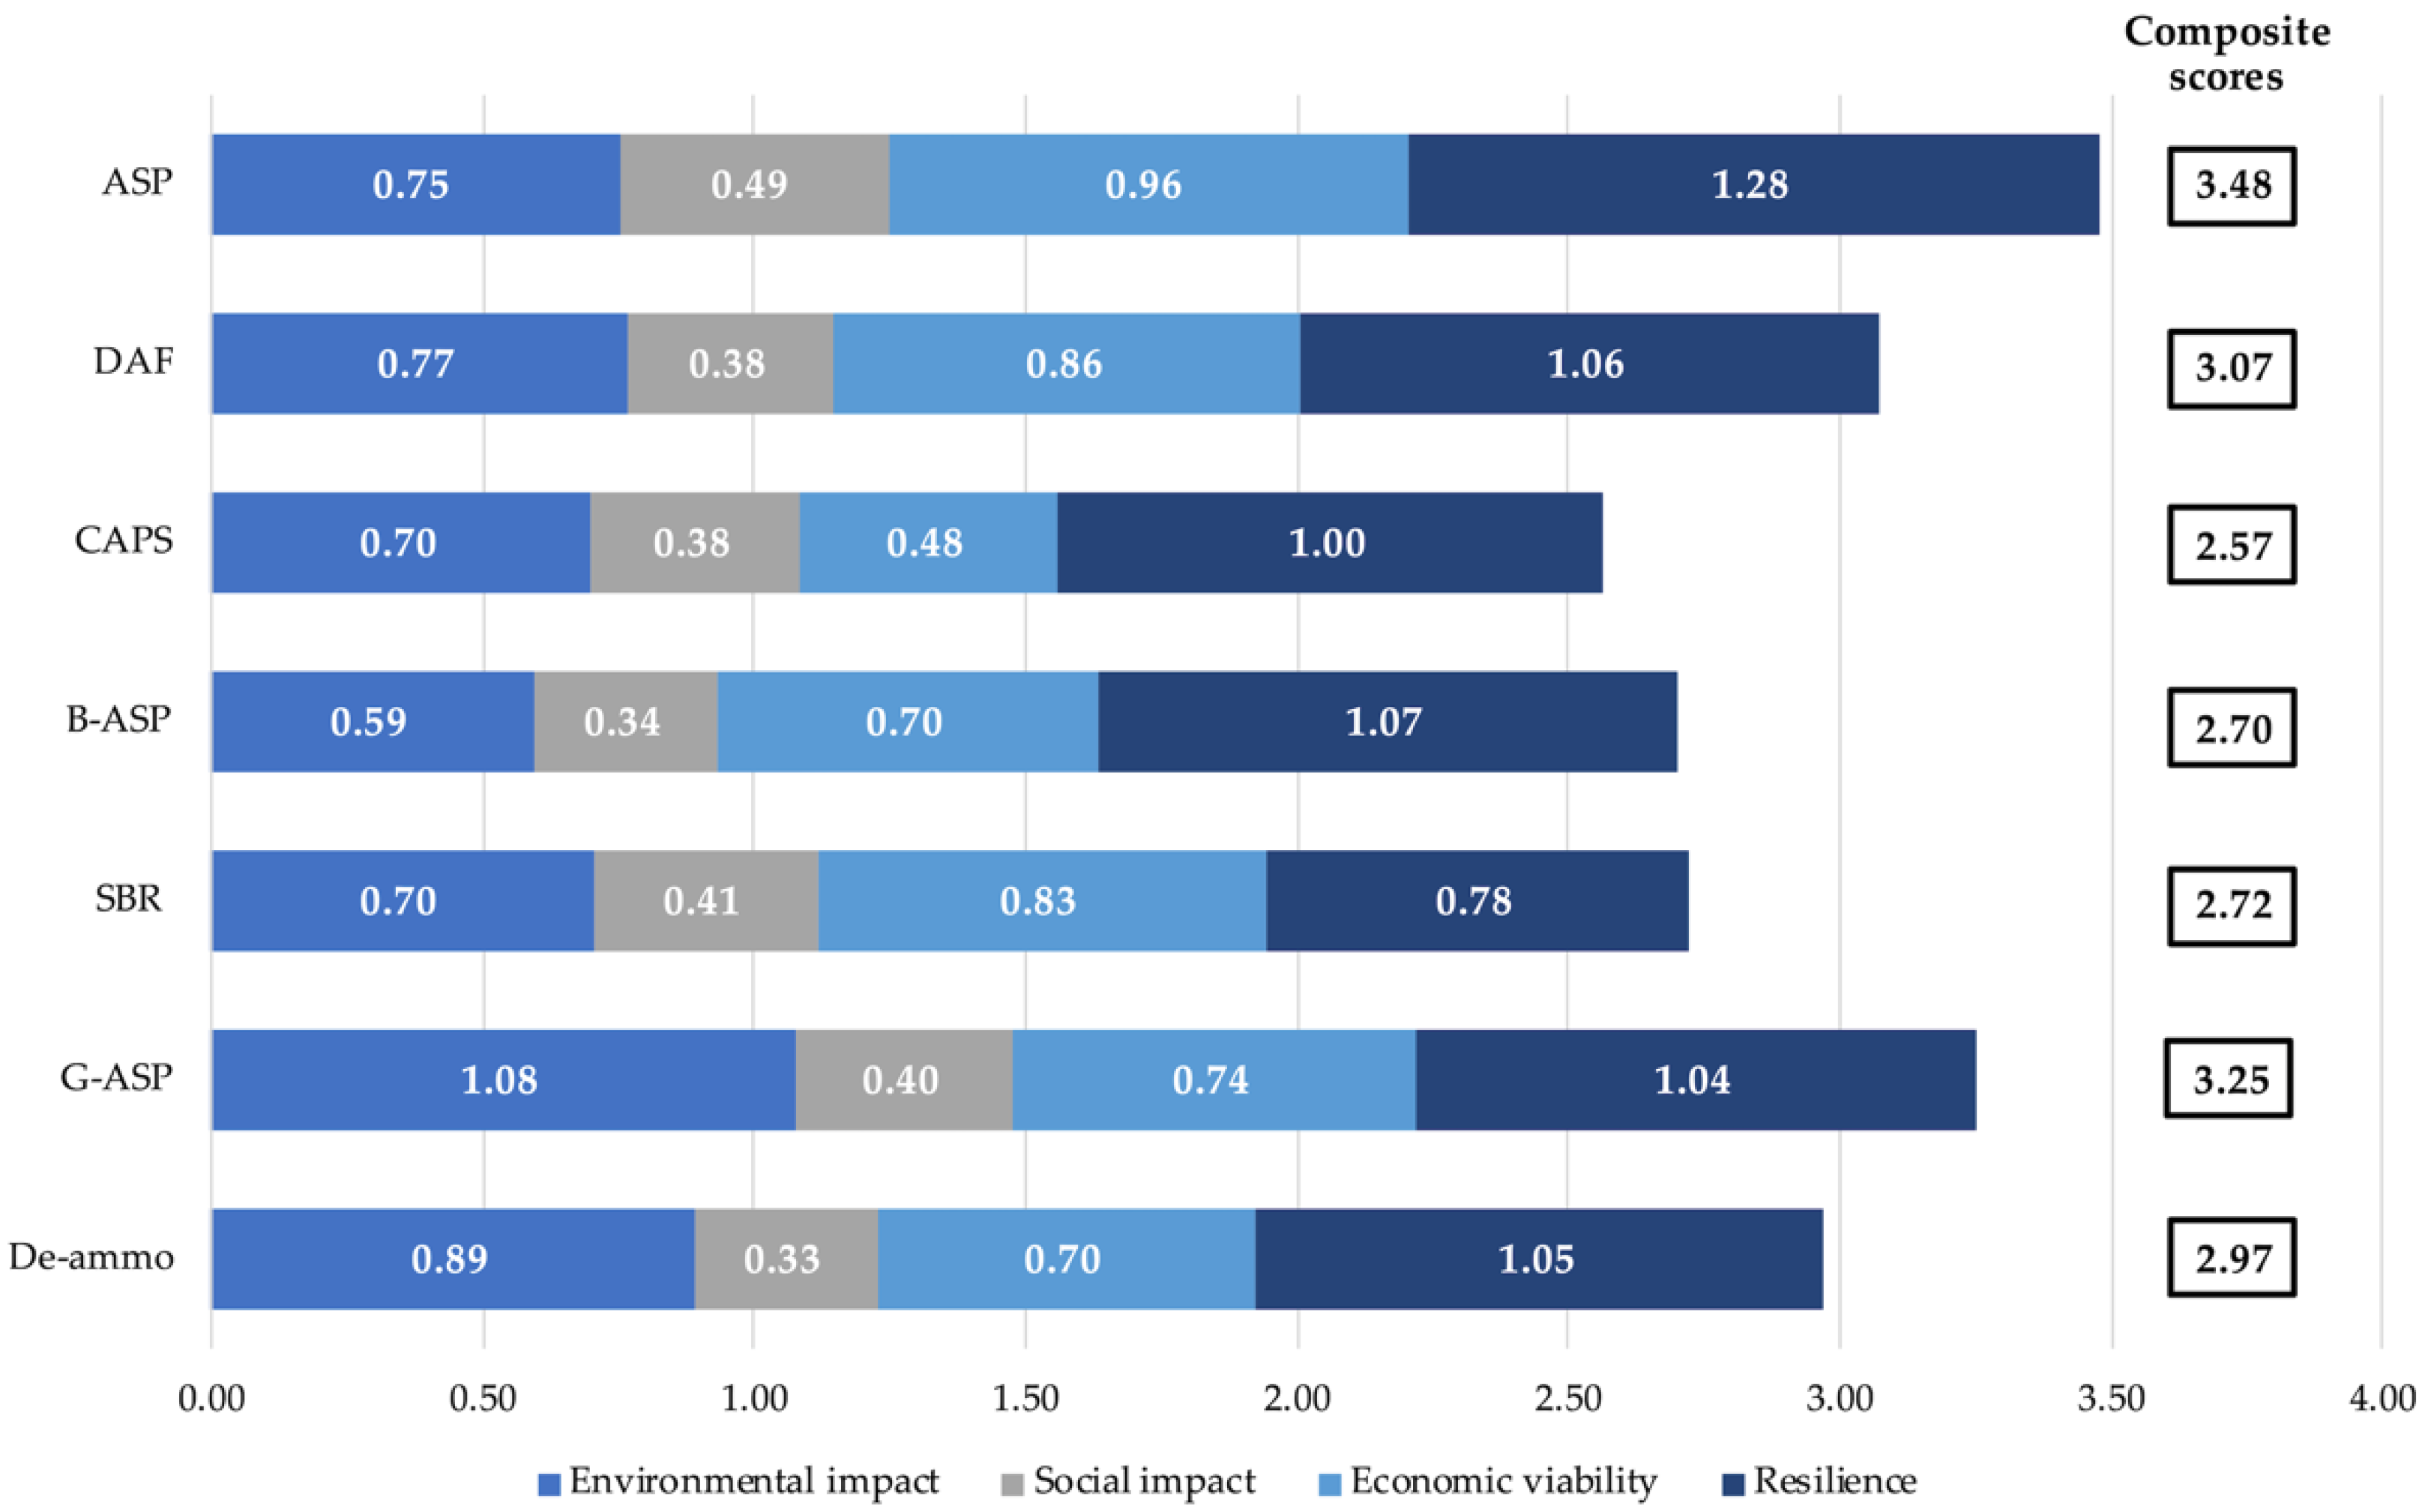
2.4. Score Aggregation and Options Ranking
- Activated Sludge Process (solo, as a baseline) (ASP)
- Dissolved Air Flotation (DAF)
- Chemically Assisted Primary Settlement (CAPS)
- Ballasted Activated Sludge Process (B-ASP)
- Sequencing Batch Reactor (SBR)
- Granular Activated Sludge Process (G-ASP)
- Mainstream De-ammonification process (De-ammo)
2.5. Sensitivity Analysis
3. Results and Discussion
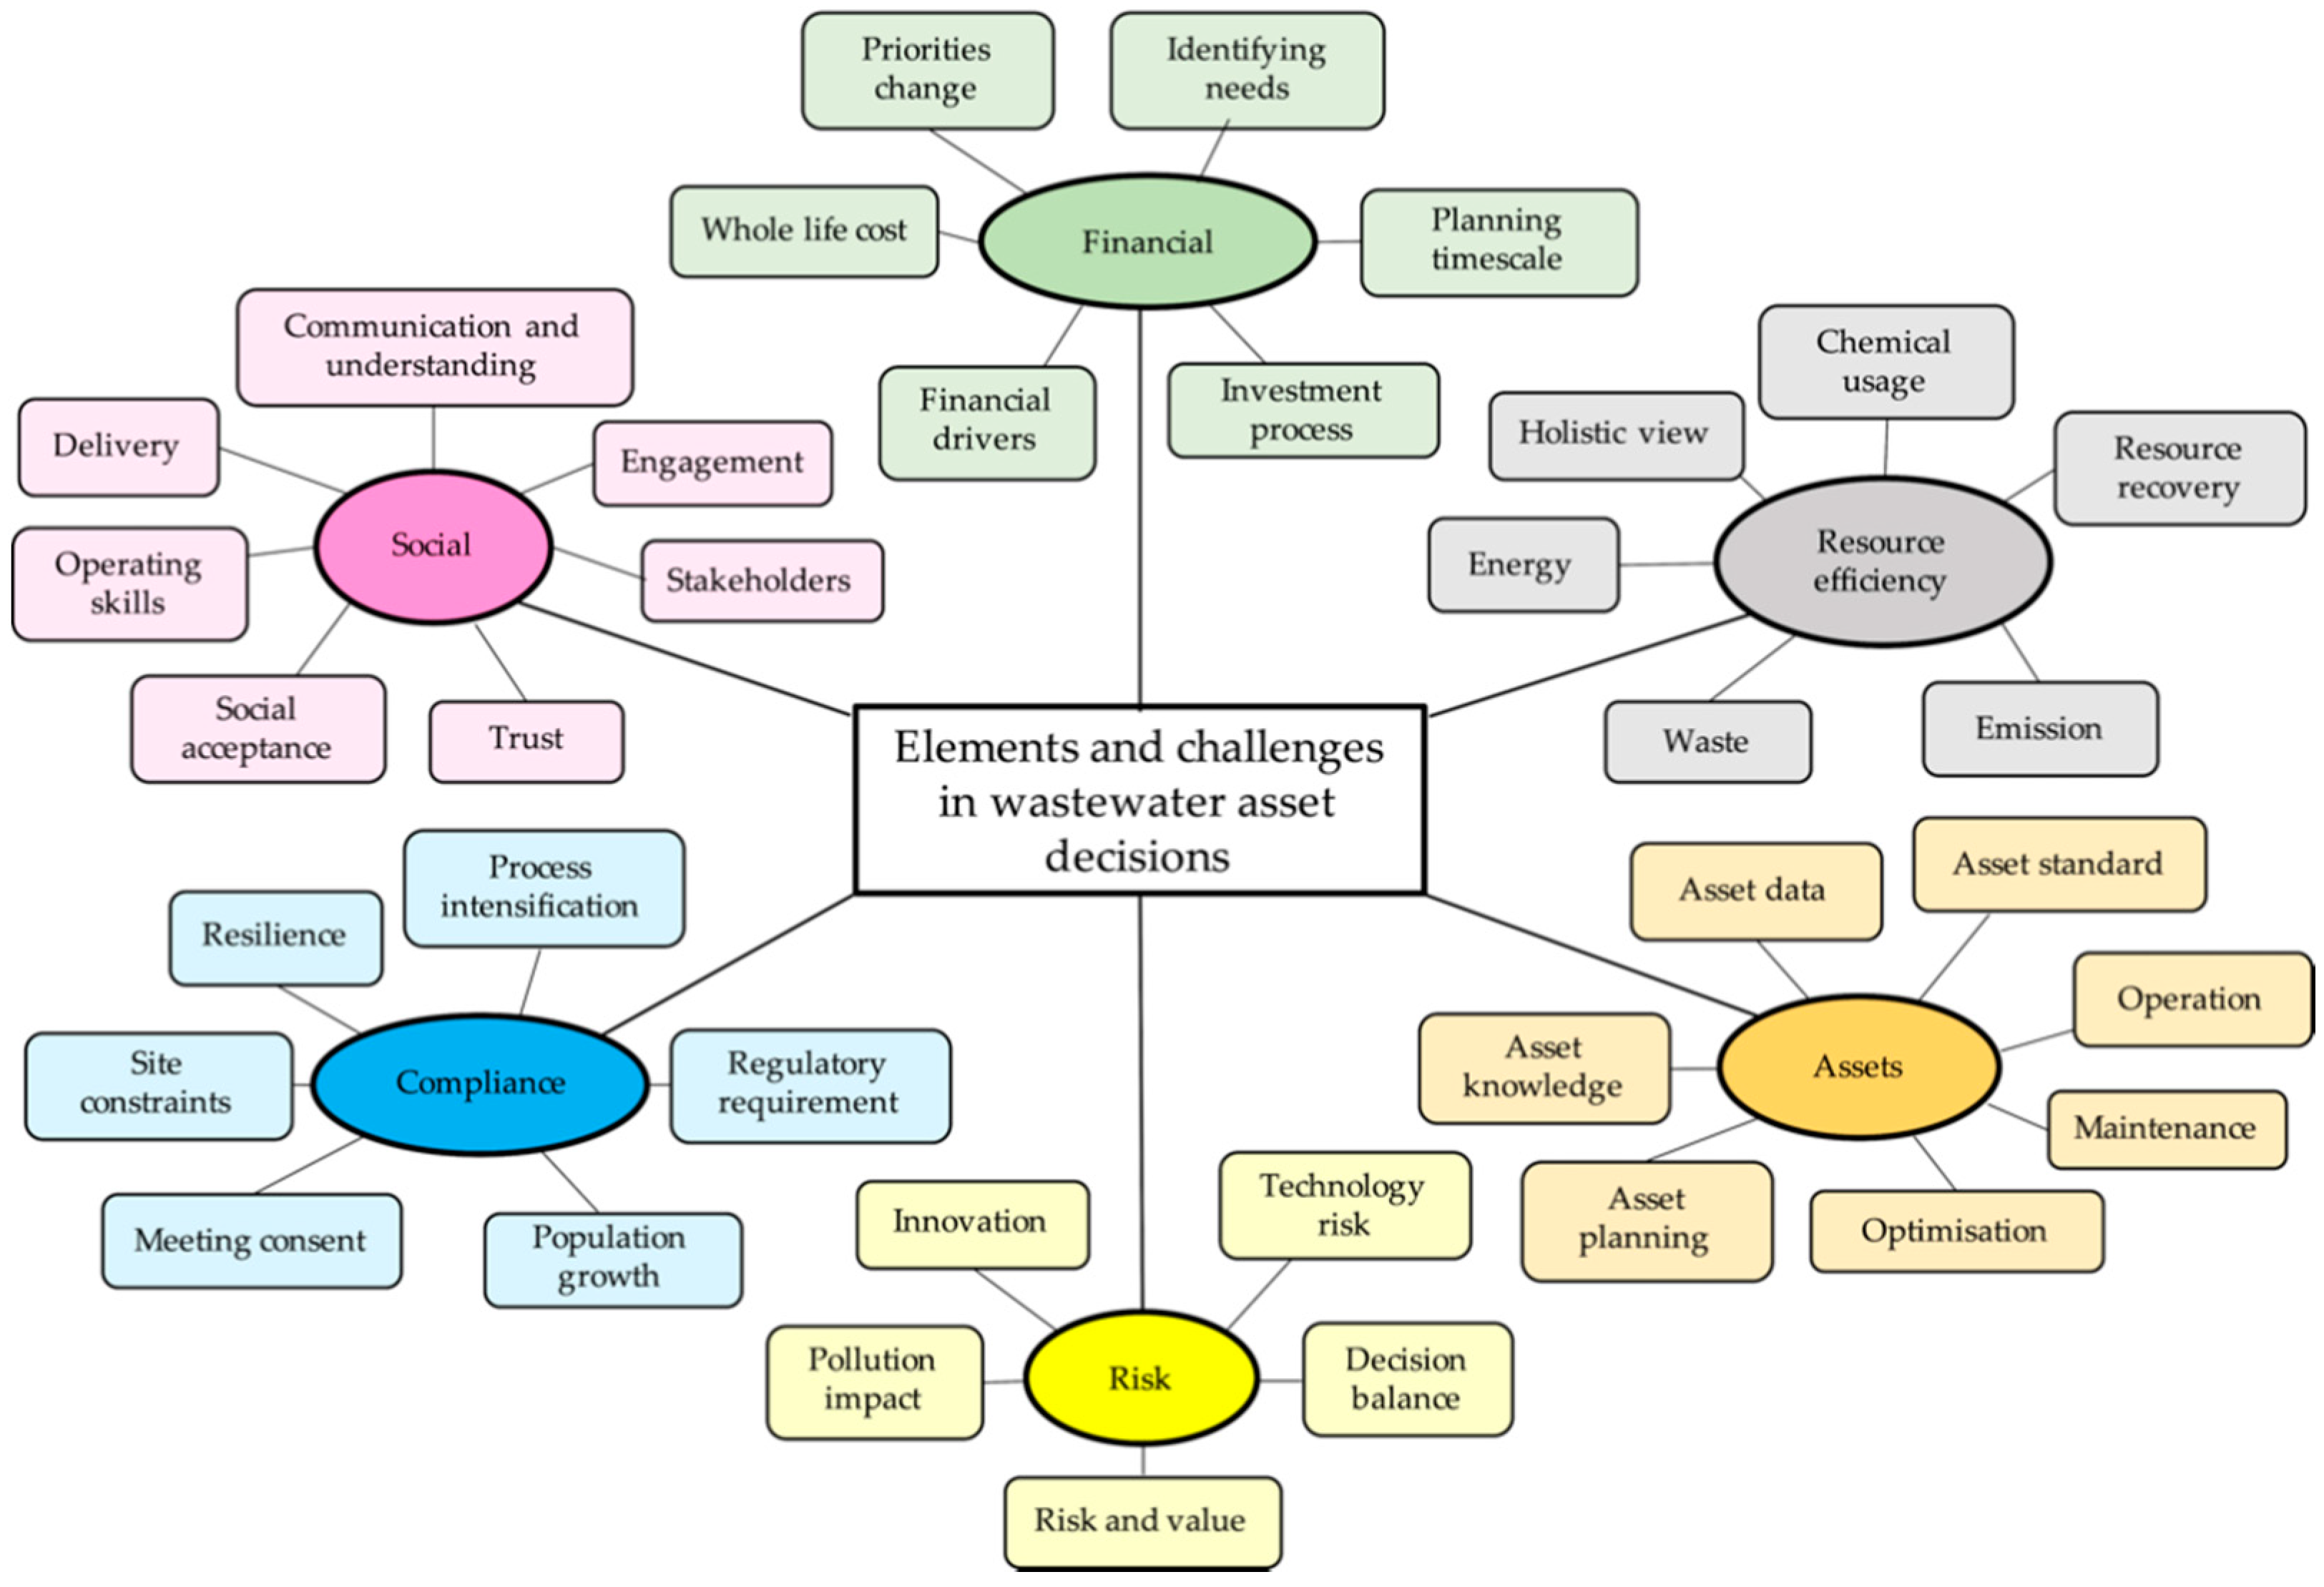
3.1. Preliminary Interviews and Thematic Analysis
- The decision-making process in wastewater asset planning is complex and faces multiple challenges. Making the right balance between different decision-making criteria is difficult in practice.
- The current investment decisions are primarily driven by the whole life cost and compliance risk whilst there is an increasing demand for an integrated system that incorporates wider dimensions of sustainability. This is similar to the results of decision mapping conducted by Ashley et al. (2008) which suggested that costs and risks are the main drivers of asset decisions in the UK water industry [21].
- Decision support tools should be understandable and communicable at a managerial level.
- They also need to be flexible to accommodate different STW programmes and adapt to new business needs and priorities.
3.2. Criteria Hierarchy
3.3. Weightings
3.4. Score Aggregation and Options Ranking
3.5. Sensitivity Analysis
3.6. Strengths and Limitations
3.6.1. Simplicity and Usability
3.6.2. Stakeholder Engagement
4. Conclusions
Author Contributions
Funding
Institutional Review Board Statement
Informed Consent Statement
Data Availability Statement
Acknowledgments
Conflicts of Interest
Research Ethical Statement
Appendix A

| Indicators | Criteria | Definitions | Type of Value Indication |
|---|---|---|---|
| Energy neutrality | Environmental impact | Net carbon consumption of the wastewater treatment process (Consumption minus recovery from sludge) | Negative |
| Total emission | Environmental impact | Total of direct and indirect carbon emission associated with the wastewater treatment process | Negative |
| Chemical consumption | Environmental impact | The total amount of chemical use in the operation of wastewater treatment (e.g., chemical dosing and polymer) | Negative |
| Opex | Economic viability | Cost related to materials (consumables), staff cost (operators), power consumption, hired and contracted services (e.g., transport; service contract for specific treatment process) | Negative |
| Capex | Economic viability | Capital cost related to the construction and commissioning of the treatment process or technology. | Negative |
| Flexibility | Resilience | The ability of technology/process to adjust or upgrade to adapt to climate change, population growth and regulatory changes. | Positive |
| Compliance | Resilience | The ability and the overall confidence of technology/process to meet the site compliance such as flow and quality consents and risks to failure. | Positive |
| Odour | Social impact | The odour impact of the treatment process and sludge storage on the community | Negative |
| Operability | Social impact | The ease to operate the process, which is associated with the manpower resource as well as the level of skills and training required for operators. | Positive |
| ASP | DAF | CAPS | G-ASP | SBR | G-ASP | De-Ammo | |
|---|---|---|---|---|---|---|---|
| Energy neutrality | 3.00 | 2.67 | 2.67 | 2.67 | 2.00 | 4.00 | 3.40 |
| Chemical consumption | 3.33 | 2.67 | 1.83 | 1.67 | 3.50 | 3.67 | 3.80 |
| Total emission | 2.00 | 2.80 | 2.80 | 2.00 | 2.20 | 3.80 | 2.60 |
| Odour | 2.67 | 3.17 | 3.33 | 2.50 | 3.17 | 3.50 | 2.40 |
| Operability | 5.00 | 2.83 | 2.67 | 2.83 | 3.33 | 2.83 | 2.80 |
| Capex | 4.41 | 5.00 | 3.17 | 3.58 | 4.30 | 1.00 | 3.58 |
| Opex | 3.70 | 2.42 | 1.00 | 2.39 | 2.76 | 5.00 | 2.39 |
| Flexibility | 1.43 | 3.00 | 2.86 | 2.57 | 2.29 | 3.71 | 2.83 |
| Compliance | 4.33 | 3.00 | 2.83 | 3.17 | 2.17 | 2.67 | 3.00 |
References
- United Nations. Sustainable Development Goals. Available online: https://sdgs.un.org/goals/goal6 (accessed on 15 March 2021).
- Department of International Trade: Water and Treated Water (Promotional Materials). Available online: https://www.gov.uk/government/publications/water-and-treated-water/water-and-treated-water (accessed on 30 November 2020).
- European Commission. The Urban Waste Water Directive 91/271/EEC; European Commission: Brussel, Belgium, 1991. Available online: https://eur-lex.europa.eu/legal-content/EN/TXT/PDF/?uri=CELEX:31991L0271&from=EN (accessed on 30 November 2020).
- TWUL. London’s Wastewater Future. London 2100: The Case for Change. Thames Water Utilities. Available online: https://www.thameswater.co.uk/media-library/home/about-us/02010-London-2100-case-for-change-MG-09-2017-v5_3.pdf (accessed on 30 November 2020).
- UK Climate Projection 2018 Report: Executive Summary Met Office Hadley Centre, Exeter. 2009. Available online: https://www.metoffice.gov.uk/binaries/content/assets/metofficegovuk/pdf/research/ukcp/ukcp-headline-findings-v2.pdf (accessed on 30 December 2020).
- Zouboulis, A.; Tolkou, A. Effect of Climate Change in Wastewater Treatment Plants: Reviewing the Problems and Solutions. In Managing Water Resources under Climate Uncertainty; Springer Science and Business Media: Berlin/Heidelberg, Germany, 2014; pp. 197–220. [Google Scholar]
- Xue, X.; Schoen, M.E.; Ma, X.; Hawkins, T.R.; Ashbolt, N.J.; Cashdollar, J.; Garland, J. Critical insights for a sustainability framework to address integrated community water services: Technical metrics and approaches. Water Res. 2015, 77, 155–169. [Google Scholar] [CrossRef]
- Bond, A.; Morrison-Saunders, A.N.; Pope, J. Sustainability assessment: The state of the art. Impact Assess. Proj. Apprais. 2012, 30, 53–62. [Google Scholar] [CrossRef]
- Waas, T.; Hugé, J.; Block, T.; Wright, T.; Benitez-Capistros, F.; Verbruggen, A. Sustainability Assessment and Indicators: Tools in a Decision-Making Strategy for Sustainable Development. Sustainability 2014, 6, 5512–5534. [Google Scholar] [CrossRef] [Green Version]
- Pope, J.; Annandale, D.; Morrison-Saunders, A. Conceptualising sustainability assessment. Environ. Impact Assess. Rev. 2004, 24, 595–616. [Google Scholar] [CrossRef] [Green Version]
- Gasparatos, A.; El-Haram, M.; Horner, M. A critical review of reductionist approaches for assessing the progress towards sustainability. Environ. Impact Assess. Rev. 2008, 28, 286–311. [Google Scholar] [CrossRef]
- Hugé, J.; Waas, T.; Eggermont, G.; Verbruggen, A. Impact assessment for a sustainable energy future—Reflections and practical experiences. Energy Policy 2011, 39, 6243–6253. [Google Scholar] [CrossRef]
- Sala, S.; Ciuffo, B.; Nijkamp, P. A systemic framework for sustainability assessment. Ecol. Econ. 2015, 119, 314–325. [Google Scholar] [CrossRef]
- Barrett, C.B.; Grizzle, R.E. A Holistic Approach to Sustainability Based on Pluralistic Stewardship. SSRN Electron. J. 1998, 21, 23–42. [Google Scholar] [CrossRef] [Green Version]
- Bond, A.; Morrison-Saunders, A.; Howitt, R. Sustainability Assessment: Pluralism, Practice and Progress, 1st ed.; Routledge: New York, NY, USA, 2012. [Google Scholar]
- Ashley, R.; Blackwood, D.; Butler, D.; Davies, J.; Jowitt, P.; Smith, H. Sustainable decision making for the UK water industry. In Proceedings of the Institution of Civil Engineers; ICE: London, UK, 2003; Volume 156, pp. 41–49. [Google Scholar]
- Fenner, R.A.; Ainger, C.M. Sustainable Infrastructure: Principles into practice. In Sustainable Infrastructure: Principles into Practice; Thomas Telford Ltd.: London, UK, 2013; pp. 263–325. [Google Scholar]
- Gasparatos, A.; Scolobig, A. Choosing the most appropriate sustainability assessment tool. Ecol. Econ. 2012, 80, 1–7. [Google Scholar] [CrossRef]
- Niekamp, S.; Bharadwaj, U.R.; Sadhukhan, J.; Chryssanthopoulos, M.K. A multi-criteria decision support framework for sustainable asset management and challenges in its application. J. Ind. Prod. Eng. 2015, 32, 23–36. [Google Scholar] [CrossRef]
- Padilla-Rivera, A.; Morgan-Sagastume, J.M.; Güereca-Hernández, L.P. Sustainability Assessment of Wastewater Systems: An Environmental and Economic Approach. J. Environ. Prot. 2019, 10, 241–259. [Google Scholar] [CrossRef] [Green Version]
- Ashley, R.; Blackwood, D.; Butler, D.; Jowitt, P.; Davies, J.; Smith, H.; Gilmour, D.; Oltean-Dumbrava, C. Making Asset Investment Decisions for Wastewater Systems that Include Sustainability. J. Environ. Eng. 2008, 134, 200–209. [Google Scholar] [CrossRef] [Green Version]
- Belton, V.; Stewart, T.J. Multiple Criteria Decision Analysis an Integrated Approach; Springer: Berlin/Heidelberg, Germany, 2002. [Google Scholar]
- Kiker, G.A.; Bridges, T.S.; Varghese, A.; Seager, P.T.P.; Linkov, I. Application of Multicriteria Decision Analysis in Environmental Decision Making. Integr. Environ. Assess. Manag. 2005, 1, 95–108. [Google Scholar] [CrossRef] [PubMed]
- Huang, I.B.; Keisler, J.; Linkov, I. Multi-criteria decision analysis in environmental sciences: Ten years of applications and trends. Sci. Total Environ. 2011, 409, 3578–3594. [Google Scholar] [CrossRef] [PubMed]
- Pavlovskaia, E. Sustainability criteria: Their indicators, control, and monitoring (with examples from the biofuel sector). Environ. Sci. Eur. 2014, 26, 1–12. [Google Scholar] [CrossRef] [PubMed] [Green Version]
- Balkema, A.J.A.; Preisig, H.; Otterpohl, R.; Lambert, F.J. Indicators for the sustainability assessment of wastewater treatment systems. Urban Water 2002, 4, 153–161. [Google Scholar] [CrossRef]
- Muga, H.E.; Mihelcic, J.R. Sustainability of wastewater treatment technologies. J. Environ. Manag. 2008, 88, 437–447. [Google Scholar] [CrossRef]
- Ahmed, Y.; Gendy, A.; Hagger, S. Sustainability assessment of municipal wastewater treatment. Int. J. Environ. Ecol. Eng. 2017, 11, 130–134. [Google Scholar] [CrossRef]
- Molinos-Senante, M.; Gómez, T.; Garrido-Baserba, M.; Caballero, R.; Sala-Garrido, R. Assessing the sustainability of small wastewater treatment systems: A composite indicator approach. Sci. Total Environ. 2014, 497, 607–617. [Google Scholar] [CrossRef]
- Popovic, T.; Kraslawski, A.; Avramenko, Y. Applicability of Sustainability Indicators to Wastewater Treatment Processes. Comput. Aided Chem. Eng. 2013, 32, 931–936. [Google Scholar] [CrossRef]
- Finkbeiner, M.; Schau, E.M.; Lehmann, A.; Traverso, M. Towards Life Cycle Sustainability Assessment. Sustainability 2010, 2, 3309–3322. [Google Scholar] [CrossRef] [Green Version]
- Gherghel, A.; Teodosiu, C.; Notarnicola, M.; De Gisi, S. Sustainable design of large wastewater treatment plants considering multi-criteria decision analysis and stakeholder’s involvement. J. Environ. Manag. 2020, 261, 110158. [Google Scholar] [CrossRef] [PubMed]
- Plakas, K.V.; Georgiadis, A.A.; Karabelas, A.J. Sustainability assessment of tertiary wastewater treatment technologies: A multi-criteria analysis. Water Sci. Technol. 2015, 73, 1532–1540. [Google Scholar] [CrossRef] [PubMed]
- Schuwirth, N.; Honti, M.; Logar, I.; Stamm, C. Multi-criteria decision analysis for integrated water quality assessment and management support. Water Res. 2018, 1, 100010. [Google Scholar] [CrossRef] [PubMed]
- Amorocho-Daza, H.; Cabrales, S.; Santos, R.; Saldarriaga, J. A New Multi-Criteria Decision Analysis Methodology for the Selection of New Water Supply Infrastructure. Water 2019, 11, 805. [Google Scholar] [CrossRef] [Green Version]
- Mustapha, M.A.; Manan, Z.A.; Alwi, S.R.W. A new quantitative overall environmental performance indicator for a wastewater treatment plant. J. Clean. Prod. 2017, 167, 815–823. [Google Scholar] [CrossRef]
- Kalbar, P.P.; Karmakar, S.; Asolekar, S.R. Life cycle-based decision support tool for selection of wastewater treatment alternatives. J. Clean. Prod. 2016, 117, 64–72. [Google Scholar] [CrossRef]
- Ren, J.; Liang, H. Multi-criteria group decision-making based sustainability measurement of wastewater treatment processes. Environ. Impact Assess. Rev. 2017, 65, 91–99. [Google Scholar] [CrossRef]
- Sabia, G.; De Gisi, S.; Farina, R. Implementing a composite indicator approach for prioritizing activated sludge-based wastewater treatment plants at large spatial scale. Ecol. Indic. 2016, 71, 1–18. [Google Scholar] [CrossRef]
- Saaty, R.M. The analytic hierarchy process—What it is and how it is used. Math. Model. 1987, 9, 161–176. [Google Scholar] [CrossRef] [Green Version]
- Sipahi, S.; Timor, M. The analytic hierarchy process and analytic network process: An overview of applications. Manag. Decis. 2010, 48, 775–808. [Google Scholar] [CrossRef]
- Ossadnik, W.; Schinke, S.; Kaspar, R.H. Group Aggregation Techniques for Analytic Hierarchy Process and Analytic Network Process: A Comparative Analysis. Group Decis. Negot. 2016, 25, 421–457. [Google Scholar] [CrossRef] [Green Version]
- Saaty, T.L. Axiomatic Foundation of the Analytic Hierarchy Process. Manag. Sci. 1986, 32, 841–855. [Google Scholar] [CrossRef]
- Bottero, M.C.; Comino, E.; Riggio, V.A. Application of the Analytic Hierarchy Process and the Analytic Network Process for the assessment of different wastewater treatment systems. Environ. Model. Softw. 2011, 26, 1211–1224. [Google Scholar] [CrossRef]
- Ivanco, M.; Hou, G.; Michaeli, J. Sensitivity analysis method to address user disparities in the analytic hierarchy process. Expert Syst. Appl. 2017, 90, 111–126. [Google Scholar] [CrossRef]
- Belton, V.; Pictet, J. A Framework for Group Decision using a MCDA Model: Sharing, Aggregating or Comparing Individual Information? J. Decis. Syst. 1997, 6, 283–303. [Google Scholar] [CrossRef]
- Triantaphyllou, E.; Sánchez, A. A Sensitivity Analysis Approach for Some Deterministic Multi-Criteria Decision-Making Methods. Decis. Sci. 1997, 28, 151–194. [Google Scholar] [CrossRef]
- Ofwat. Delivering Water 2020: Our Final Methodology for the 2019 Price Review. Available online: https://www.ofwat.gov.uk/wp-content/uploads/2017/12/Final-methodology-1.pdf (accessed on 30 November 2020).
- Prescott, C. Carbon accounting in the United Kingdom water sector: A review. Water Sci. Technol. 2009, 60, 2721–2727. [Google Scholar] [CrossRef] [PubMed]
- Karimi, A.; Mehrdadi, N.; Hashemian, S.J.; Bidhendi, G.R.N.; Moghaddam, R.T. Selection of wastewater treatment process based on the analytical hierarchy process and fuzzy analytical hierarchy process methods. Int. J. Environ. Sci. Technol. 2011, 8, 267–280. [Google Scholar] [CrossRef] [Green Version]
- Pauer, F.; Schmidt, K.; Babac, A.; Damm, K.; Frank, M.; Von Der Schulenburg, J.-M.G. Comparison of different approaches applied in Analytic Hierarchy Process—An example of information needs of patients with rare diseases. BMC Med. Inform. Decis. Mak. 2016, 16, 117. [Google Scholar] [CrossRef] [PubMed] [Green Version]
- Foxon, T.J.; McIlkenny, G.; Gilmour, D.; Oltean-Dumbrava, C.; Souter, N.; Ashley, R.; Butler, D.; Pearson, P.; Jowitt, P.; Moir, J. Sustainability Criteria for Decision Support in the UK Water Industry. J. Environ. Plan. Manag. 2002, 45, 285–301. [Google Scholar] [CrossRef]
- Saaty, T.; Ozdemir, M. Why the magic number seven plus or minus two. Math. Comput. Model. 2003, 38, 233–244. [Google Scholar] [CrossRef]
- Belton, V.; Gear, T. On a short-coming of Saaty’s method of analytic hierarchies. Omega 1983, 11, 228–230. [Google Scholar] [CrossRef]
- Domínguez, I.; Oviedo-Ocaña, E.R.; Hurtado, K.; Barón, A.; Hall, R.P. Assessing Sustainability in Rural Water Supply Systems in Developing Countries using a Novel Tool Based on Multi-Criteria Analysis. Sustainability 2019, 11, 5363. [Google Scholar] [CrossRef] [Green Version]
- Bouchart, F.J.-C.; Blackwood, D.J.; Jowitt, P.W. Decision mapping: Understanding decision making processes. Civ. Eng. Environ. Syst. 2002, 19, 187–207. [Google Scholar] [CrossRef]
| Dimension | Indicator | Unit | References |
|---|---|---|---|
| Environmental and Technical | Energy consumption | kWh/yr | [27,28,29,33,36] |
| Land required | m2/p.e. | [27,28,29,33,37,38] | |
| Pollutants removal potentials | % | [27,28,29,33,36,39] | |
| Amount of sludge produced | kg/yr | [28,29,39] | |
| Resource recovery potential | - | [28,29] | |
| Greenhouse gas emission | kgCO2 eq/yr | [36,39] | |
| Social | Public acceptance | Qualitative | [28,29,33,37,38] |
| Odour impact | Qualitative | [27,28,29,33] | |
| Noise impact | Qualitative | [28,29,33] | |
| Visual impact | Qualitative | [28,29,33] | |
| Reliability | Qualitative | [29,33,37,38] | |
| Complexity | Qualitative | [27,28,29,33,38] | |
| Economic | Capex | £k | [27,28,29,33,38] |
| Opex | £k/yr | [27,28,29,33,38] |
| Scale Intensity | Definition |
|---|---|
| 1 | Equally important |
| 3 | Moderately more important |
| 5 | Strongly more important |
| 7 | Very strongly more important |
| 9 | Extremely more important |
| 2, 4, 6, 8 | Intermediate values between two scale points |
| Reciprocals | The preference order is inversed |
| 1 | 2 | 3 | 4 | 5 | 6 | 7 | 8 | 9 | Group Weights | Rank | |
|---|---|---|---|---|---|---|---|---|---|---|---|
| Energy neutrality | 0.183 | 0.053 | 0.067 | 0.096 | 0.096 | 0.058 | 0.129 | 0.029 | 0.054 | 0.085 | 6 |
| Chemical consumption | 0.044 | 0.106 | 0.084 | 0.061 | 0.318 | 0.058 | 0.045 | 0.029 | 0.054 | 0.078 | 7 |
| Total emission | 0.063 | 0.106 | 0.106 | 0.229 | 0.175 | 0.174 | 0.031 | 0.087 | 0.108 | 0.119 | 3 |
| Odour | 0.041 | 0.058 | 0.114 | 0.028 | 0.112 | 0.022 | 0.023 | 0.096 | 0.081 | 0.061 | 9 |
| Operability | 0.047 | 0.037 | 0.114 | 0.118 | 0.049 | 0.100 | 0.057 | 0.038 | 0.031 | 0.067 | 8 |
| Opex | 0.084 | 0.133 | 0.129 | 0.090 | 0.052 | 0.259 | 0.093 | 0.082 | 0.182 | 0.126 | 2 |
| Capex | 0.084 | 0.133 | 0.129 | 0.030 | 0.052 | 0.086 | 0.278 | 0.082 | 0.182 | 0.111 | 4 |
| Flexibility | 0.113 | 0.187 | 0.043 | 0.058 | 0.049 | 0.049 | 0.069 | 0.140 | 0.077 | 0.088 | 5 |
| Compliance | 0.340 | 0.187 | 0.214 | 0.290 | 0.098 | 0.195 | 0.276 | 0.419 | 0.230 | 0.266 | 1 |
| ASP | DAF | CAPS | B-ASP | SBR | G-ASP | De-Ammo | Spearman’s Coefficient | |
|---|---|---|---|---|---|---|---|---|
| Ranking based on this assessment framework | 1 | 3 | 7 | 6 | 5 | 2 | 4 | ρ = 0.75 (p = 0.052) |
| Ranking from previous decision by stakeholders | 1 | 3 | 5 | 6 | 4 | 2 | 7 |
| ASP | DAF | CAPS | B-ASP | SBR | G-ASP | De-Ammo | |
|---|---|---|---|---|---|---|---|
| Group weightings | 1 | 3 | 7 | 6 | 5 | 2 | 4 |
| Stakeholder 1 | 1 | 3 | 6 | 5 | 7 | 2 | 4 |
| Stakeholder 2 | 2 | 3 | 7 | 6 | 5 | 1 | 4 |
| Stakeholder 3 | 1 | 3 | 7 | 6 | 5 | 2 | 4 |
| Stakeholder 4 | 1 | 4 | 6 | 5 | 7 | 2 | 3 |
| Stakeholder 5 | 2 | 4 | 6 | 7 | 5 | 1 | 3 |
| Stakeholder 6 | 2 | 3 | 7 | 6 | 5 | 1 | 4 |
| Stakeholder 7 | 1 | 2 | 7 | 4 | 5 | 6 | 3 |
| Stakeholder 8 | 1 | 3 | 6 | 5 | 7 | 2 | 4 |
| Stakeholder 9 | 1 | 2 | 7 | 6 | 5 | 3 | 4 |
| Group Weights | Absolute Changes | Relative Changes % | |
|---|---|---|---|
| Energy neutrality | 0.085 | −0.224 | 263 |
| Chemical consumption | 0.078 | −0.659 | 844 |
| Total emission | 0.119 | −0.124 | 105 |
| Odour | 0.061 | −0.270 | 442 |
| Operability | 0.067 | 0.103 | 154 |
| Opex | 0.126 | −0.172 | 137 |
| Capex | 0.111 | 0.066 | 59 |
| Flexibility | 0.088 | −0.098 | 112 |
| Compliance | 0.266 | 0.135 | 51 |
Publisher’s Note: MDPI stays neutral with regard to jurisdictional claims in published maps and institutional affiliations. |
© 2021 by the authors. Licensee MDPI, Basel, Switzerland. This article is an open access article distributed under the terms and conditions of the Creative Commons Attribution (CC BY) license (https://creativecommons.org/licenses/by/4.0/).
Share and Cite
Ling, J.; Germain, E.; Murphy, R.; Saroj, D. Designing a Sustainability Assessment Framework for Selecting Sustainable Wastewater Treatment Technologies in Corporate Asset Decisions. Sustainability 2021, 13, 3831. https://doi.org/10.3390/su13073831
Ling J, Germain E, Murphy R, Saroj D. Designing a Sustainability Assessment Framework for Selecting Sustainable Wastewater Treatment Technologies in Corporate Asset Decisions. Sustainability. 2021; 13(7):3831. https://doi.org/10.3390/su13073831
Chicago/Turabian StyleLing, Jiean, Eve Germain, Richard Murphy, and Devendra Saroj. 2021. "Designing a Sustainability Assessment Framework for Selecting Sustainable Wastewater Treatment Technologies in Corporate Asset Decisions" Sustainability 13, no. 7: 3831. https://doi.org/10.3390/su13073831