Abstract
The discrete element method (DEM) for modeling the behavior of particulate material is highly dependent on the use of appropriate and accurate parameters. In this study, a seed metering DEM simulation was used to measure, calibrate, and verify the physical and interactional parameters of rapeseed. The coefficients of restitution and static friction between rapeseeds and three common materials (aluminum alloy, acrylic, and high-density polyethylene) were measured using free drop and sliding ramp tests, respectively. The angle of repose was determined using a hollow cylinder experiment, which was duplicated using a DEM simulation, to examine the effects of static and rolling friction coefficients on the angle of repose. Response surface optimization was performed to determine the optimized model parameters using a Box–Behnken design test. A metering device was made with three materials, and rapeseed seeding was simulated at different working speeds to verify the calibrated parameters. The validation results showed that the relative errors between the seed metering model and experiments for the single qualified seeding, missed seeding, and multiple seeding rates were −0.15%, 3.29%, and 5.37%, respectively. The results suggest that the determined physical and interactional parameters of rapeseed can be used as references for future DEM simulations.
1. Introduction
Rapeseed is one of the most important sources of vegetable oil in the world [1]. As a discrete particle material, rapeseed processing which includes seeding, harvesting, handling, processing, and storage involves complex forces that have been studied over the decades, but are still extensively investigated, because the result from traditional theoretical analysis of these complex forces often disagree with experimental results. The use of numerical simulation methods can bridge the gap between theoretical analysis and experimental studies, and therefore provide insight into particle interactions, which is beneficial for the design and development of different types of machinery such as seeders, harvesters, conveyors, and dryers at modern agricultural and industrial scales.
In recent years, with the rapid development of modern mechanics, numerical methods, and computer technology, the discrete element method (DEM) has been widely used by engineers and researchers to study interactions between particles and equipment [2,3,4,5]. As a numerical modeling technique, the DEM mainly addresses problems in engineering and applied sciences that show significant discontinuity behavior [6,7,8]. The DEM for a numerical analysis of a simulation involves constructing a discrete element model and determining the simulation parameters. Furthermore, determination of the DEM input parameters and construction of the model are also crucial prerequisites for an effective simulation [9,10]. Z. Zhan et al. [11] established an ellipsoidal discrete element model of rice based on the physical parameters of seeds and simulated the translational and rotational motions of seeds after impact. Ucgul et al. [12] calibrated the parameters required for soil tillage using the angle of repose and penetration tests, which effectively simulated soil–tool interactions for force. F. Liu et al. [13] obtained the angles of repose of wheat through a cylinder-lifting test and a rotating drum test, respectively, and studied the differences between wheat micro-parameters qualitatively and quantitatively. The results showed that both calibration methods had effects on wheat micro-parameters. T. Xu et al. [14] measured and analyzed the physical parameters of soybean seeds and proposed a multi-sphere method to establish a DEM model for the particles. Rozbroj et al. [15] constructed a DEM model of cylindrical pellets made from black bent. The vessel-discharge experiments using particle image velocimetry and DEM simulations were compared to determine the influence of the length of the pellets on the discharge speed and time. Kanakabandi and Goswami [16] constructed a DEM model of black pepper and compared and analyzed the laboratory and simulation tests of a rotating drum apparatus, which was used to study the rest angle and flow characteristics of black pepper.
Considering a DEM model for simulations with rapeseed, Raji and Favier [17] first attempted to study the compressive loading of rapeseeds using a single-sphere particle model. Then, they extended the single-sphere particle model to simulate the compression process of three oil crops including rapeseed [18]. Wojtkowski et al. [19] analyzed the free fall of rapeseed under different moisture contents and impacts against a flat surface. The validity of the two contact models of rapeseed was verified by physical tests and DEM simulations. Parafiniuk et al. [20] simulated particle discharge tests based on two contact models for rapeseed as a single-sphere model. The simulation results showed that the contact model with low moisture content could effectively reproduce the experimental results of slow particle flow. Tamás et al. [21] constructed simulation models of the mechanical properties of rapeseed as a set of granular masses and verified them using single-axis compression and shear tests. The results proved that the DEM-based models could be used to simulate the macroscopic mechanical processes of rapeseed pressing. Most of the parameters required for rapeseed DEM simulation can be measured experimentally [22], however, there is no general method to obtain the exact values for parameters (especially the physical contact parameters) that have a significant impact on the simulation results. In addition, few researchers have addressed the problem of the coefficient of rolling friction between rapeseeds and the coefficient of rolling friction between rapeseeds and contact materials.
In this study, we aimed to calibrate and measure the parameters for the DEM modeling of rapeseed. On the basis of the physical properties of rapeseed, we obtained the angle of repose of rapeseed for a hollow cylinder experiment combined with image processing techniques. Response surface optimization was performed to determine the optimized DEM simulation parameters of rapeseed using a Box–Behnken design test. Furthermore, we also determined the accuracy of inter-rapeseed simulation parameters through rapeseed metering device validation tests.
2. Materials and Methods
2.1. Materials
The rapeseed variety zhongshuang 11 was used as the research object, provided by the Wuhan Zhongyou Seed Industry Technology Co., Ltd. (Wuhan, China). Two hundred seeds were randomly selected, and their length, width, and thickness were measured using a digital vernier caliper (accuracy of 0.01 mm) (H type, Harbin Measuring & Cutting Tool Group Co., Ltd., Harbin, China). The calculations of geometric mean grain size and sphericity of rapeseed were based on triaxial dimensions [23]. The thousand seed weight was measured using an electronic balance (accuracy of 0.0001 g) (FA type, Shanghai Grows Instruments Co., Ltd., Shanghai, China). The moisture contents of the samples were determined using a moisture analyzer DHS-16 (Shanghai Grows Instruments Co., Ltd., Shanghai, China). The analyzer was heated and dried using a halogen lamp. During the drying process, the analyzer continuously measured the weight of the sample and instantly displayed the percentage moisture content lost by the sample. After drying was completed, the final measured moisture content value was fixed, and displayed. The density of rapeseed was determined following the liquid displacement method [24]. The results for the physical parameters of rapeseed are shown in Table 1.

Table 1.
Physical parameters of a rapeseed particle.
2.2. Experimental Measurements
The parameters required for a discrete element model simulation can be divide into two categories, i.e., material intrinsic parameters and contact mechanical parameters. Material intrinsic parameters are relatively easy to determine, and most of them can be measured by standardized tests, whereas contact mechanical parameters behave as microscopic parameters that are difficult to obtain by actual measurements. However, contact mechanical parameters, the coefficients of restitution and static friction, have relatively well-defined measurement methods and theories [25,26]. Therefore, in this study, the coefficients of static friction and restitution between rapeseed and each of three common materials (aluminum alloy, acrylic, and high-density polyethylene (HDPE)) were obtained by laboratory tests using a homemade test platform to provide a database for subsequent validation simulation tests.
2.2.1. Coefficient of Static Friction
The coefficient of static friction is the ratio of the maximum static friction force on an object to the normal pressure. In this study, a sliding ramp test was used to obtain the sliding friction angle between rapeseed and three contact materials. The metering device for tests is shown in Figure 1. Different material contact base plates (aluminum alloy, acrylic, and HDPE) were used for the tests. For each material contact base plate, seed(s) were placed on the base plate and by adjusting the threaded rod, one end of the base plate was lifted at a uniform speed so that the base plate was slowly tilted. When the seed(s) started to slide, the sliding friction angle of rapeseed on each of the different material contact base plates was obtained by reading the digital display angle meter. Each contact material group was tested 30 times and the average value was taken. The friction angle value for each contact material group was substituted into Equation (1) to obtain the coefficient of static friction as follows (see results in Table 2).

Figure 1.
The metering device for measuring the sliding friction angle between rapeseed and the contact materials.
Table 2.
Coefficient of static friction values between rapeseed and the contact materials.
2.2.2. Coefficient of Restitution
The coefficient of restitution is the ratio between the separation velocity and the approach velocity of two objects along the normal direction of contact, before and after the collision, and it can be expressed using Equation (2). Since the object is in free-fall motion throughout the process and the velocity of the material is always zero, it can be converted to Equation (3) to obtain the coefficient of restitution.
Convert Equation (2) to obtain:
where h is the set falling height and h0 is the bounce height of a seed.
The bounce height between rapeseed particles and each contact material was measured by a free drop test on a homemade test platform, as shown in Figure 2. For the tests, different material contact base plates (aluminum alloy, acrylic, and HDPE) were used, and rapeseed particles were dropped freely from a height of 30 cm onto the base plate. To capture the bouncing height of a rapeseed particle, a plate with a scale was set up in the background and a high-speed camera was positioned perpendicular to the background plate. As shown in the subfigure of Figure 2, the rapeseed was suspended in the initial position by a suction nozzle that was connected to the vacuum generator. When the vacuum was released by a manual air valve, a rapeseed dropped towards the material plate with zero initial velocity (without any initial rotation). The displacement and bounce of the rapeseed were recorded using a high-speed camera (frame rate of 500 frames/s). Rapeseed bounce height was viewed and obtained with the help of video playback software on a computer. Each contact material group was tested 30 times, and the average value was taken. The bounce height values were substituted into Equation (3) to obtain the coefficient of restitution between rapeseed and the different contact materials as follows (results are shown in Table 3).
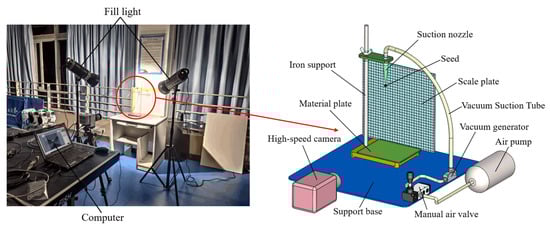
Figure 2.
The metering device for measuring bouncing height between rapeseed and the contact materials.
Table 3.
Coefficient of restitution values between rapeseed and the contact materials.
2.3. Discrete Element Method (DEM) Simulations
2.3.1. Particle Model of Rapeseed
For this study, rapeseeds were used as a granular material. As shown in Table 1, the sphericity of rapeseed is greater than 93%; therefore, in this study, we used a single sphere model for the rapeseed particle model. The model of rapeseed particles was generated using the normal distribution method in Particle Factory of EDEM Academic, 2018. The mean particle diameter was 1.96 mm with a standard deviation of 0.12 mm, as shown in Table 1. The rapeseed particle model is shown in Figure 3.

Figure 3.
Model of a rapeseed particle.
2.3.2. Contact Model Selection
The selection of the DEM contact model has a significant impact on simulation results [27]. As shown in Table 1, the moisture content of rapeseed was 4.98%, and the adhesion between seeds was negligible. Therefore, in this study, the Hertz–Mindlin (no slip) contact mechanics model in EDEM was selected for the simulation process. The model decomposes the collision between particles at the contact point as a parallel connection of a spring and a damper [28], as shown in Figure 4.
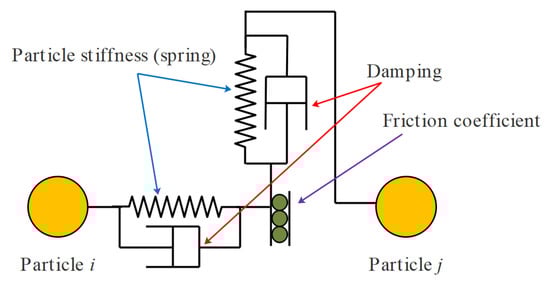
Figure 4.
The Hertz–Mindlin contact model.
2.3.3. Material Property Settings
Data for the simulations were provided by self-testing and referencing existing parameters. The discrete element parameters for the simulation of rapeseed particles and geometry were set, as shown in Table 4.
Table 4.
Discrete element method (DEM) parameters for the simulations.
2.3.4. Geometric Model of the Angle of Repose Test
The DEM parameters for the simulations of rapeseed were calibrated using a combined method of real and virtual experiments. The software EDEM was used to simulate the particle accumulation process in the hollow cylinder experiment. As shown in Figure 5a–c for the real test platform, the simulation geometry model was constructed according to a 1:1 scale, as shown in Figure 5d. The platform consisted of 2 parts, the base was 200 × 200 mm with a 5 mm thick material contact plate (aluminum alloy, acrylic, or HDPE), and the upper end was a hollow cylinder (aluminum alloy tube, acrylic tube, or HDPE tube) with an outer diameter of 25 mm, an inner diameter of 19 mm, and a height of 100 mm.
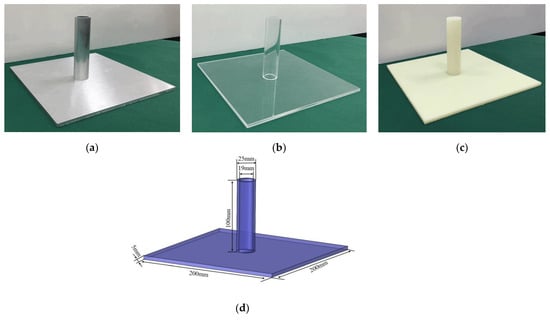
Figure 5.
The device for particle accumulation. (a) Aluminum alloy material; (b) Acrylic material; (c) High-density polyethylene (HDPE) material; (d) Simulation model.
The test process was divided into two stages. First, the hollow cylinder was placed on a horizontal plate, and then 5000 seeds were produced in the hollow cylinder. By lifting the hollow cylinder along the positive direction of the Z-axis at a speed of 0.01 m/s, the rapeseed particles formed a heap under the gravitational forces. To measure the angle of repose more accurately and reduce the error caused by human measurement, an image processing method was used, as shown in Figure 6. The boundary contours of the particle pile images were extracted by performing grayscale and binarization using MATLAB R2018a. Using the least squares method, the fitted equations were obtained by linear fit-ting and the slope of the equation k. The angle of repose was calculated using Equation (4) as follows:


Figure 6.
Contour curve extraction process. (a) Original stacking picture; (b) Binarization; (c) The left stacking image; (d) Linear fitting of bulk stacking boundary.
2.4. Calibration of Rapeseed Contact Parameters
The parameter conditions required for the EDEM software simulation of the coefficients of restitution, static friction, and rolling friction between rapeseed particles and the coefficient of rolling friction between rapeseed particles and the contact materials are un-known, as shown in Table 4. Therefore, in this study, the Box–Behnken test method was used to simulate the rapeseed stacking test with the angle of repose as the test index to obtain the optimal combination of the required parameters. Under the obtained parameter conditions, the accuracy of the parameters between rapeseed particles and the contact materials was verified by comparing the bench seeding and simulation tests.
2.4.1. The Box–Behnken Design (BBD) Tests
The range of parameters to be calibrated was obtained by a pre-test and pre-simulation, combined with the experimental design requirements, as shown in Table 5. Using the Box–Behnken design scheme in Design–Expert software, the coefficient of restitution between rapeseed X1, the coefficient of static friction between rapeseed X2, the coefficient of rolling friction between rapeseed X3, and the coefficient of rolling friction of rapeseed with contact materials (aluminum alloy, acrylic, and HDPE) X4 were designed as 4 simulation test factors. Each test factor had 3 levels, and there were 29 test points, which included 24 factorial points and 5 zero points (center of the region), and these zero points are repeated five times to estimate the test error.
Table 5.
Factors and levels of test.
2.4.2. Validation Tests
To further validate the accuracy of the obtained rapeseed DEM simulation parameters, the validation tests were completed by seeding and simulation tests of the rapeseed metering device. Figure 7a shows the bench of the rapeseed metering device, and Figure 7b shows the simulation model. The rapeseed metering device includes a hopper, seed-wheel, and seed protection board. They are made of aluminum alloy, acrylic, and HDPE, respectively. The measured and simulated values of each test index were compared and analyzed at different working speeds, using the single qualified seeding rate, missing seeding rate, and multiple seeding rate as the test evaluation index. For the tests, the seed-wheel was filled with 1 seed for qualified seeding, no seed for missed seeding, and 2 or more seeds for multiple seeding. One hundred holes were measured continuously in each group, each test was repeated 3 times, and the average value was taken.
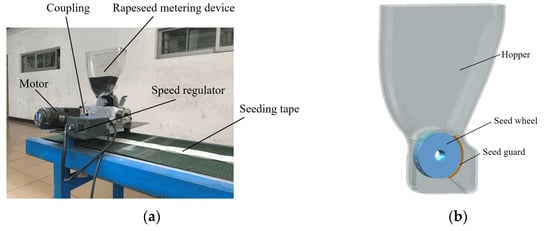
Figure 7.
The metering device for validation tests. (a) Bench of the rapeseed metering device; (b) The simulation model.
3. Results
3.1. Results of the Box–Behnken Design (BBD) Simulations
The scheme of the Box–Behnken design test and the simulation results are shown in Table 6. According to the data in Table 6, we used the Design-Expert software to perform multiple regression analysis on the simulation results and established quadratic regression models for the angles of repose α1, α2, and α3 and test variables, respectively, given as:
Table 6.
Scheme of the Box–Behnken design test and the simulation results.
From Equation (5), the angles of repose, i.e., α1, α2, and α3, have a quadratic function with the coefficient of static friction between rapeseed X2, indicating that an optimal combination of parameters for the coefficient of restitution, static friction, and rolling friction between rapeseed and the coefficient of rolling friction exists between rapeseed and the contact materials, such that angles of repose α1, α2, and α3 reach their maximum values. The coefficient of rolling friction between rapeseed X3 and the coefficient of rolling friction between rapeseed and the contact material X4 showed a positive linear correlation on the angles of repose α1, α2, and α3, indicating that the angles of repose α1, α2, and α3 will increase as the coefficient of rolling friction between rapeseed and the coefficient of rolling friction between rapeseed and the contact materials increase.
From Equation (5), the angle of reposes α1, α2, and α3 have a quadratic function with the coefficient of static friction between rapeseed X2, indicating that there exists an optimal combination of parameters for the coefficient of restitution, static friction, and rolling friction between rapeseed and coefficient of rolling friction between rapeseed and contact material, such that angle of reposes α1, α2, and α3 reach their maximum values. The coefficient of rolling friction between rapeseed X3 and coefficient of rolling friction between rapeseed and contact material X4 showed a positive linear correlation on the angle of reposes α1, α2, and α3. It indicates that the angle of reposes α1, α2, and α3 will increase as the coefficient of rolling friction between rapeseed and the coefficient of rolling friction between rapeseed and contact material increase.
As shown in Table 7, the p-values of all the models were less than 0.0001, indicating that the models were highly significant and could predict the angles of repose α1, α2, and α3. The larger the coefficient of determination R2 (in the range of 0 to 1), the better the fit of the model. The R2 of the model for the angles of repose α1, α2, and α3 were 0.977, 0.979, and 0.945, respectively, indicating that the predicted values of the regression equation fit well with the actual values. Generally, a higher coefficient of variation (CV) results in lower test reliability [32]. The CV values for the angles of repose α1, α2, and α3 are 4.87%, 3.97%, and 6.36%, respec-tively, indicating that the simulation test has good reliability.
Table 7.
Analysis of variance of quadratic polynomial model of the Box-Behnken design tests.
From Table 7, we can see the effect of factors. The p-value of the coefficient of restitution between rapeseed X1 was greater than 0.05, indicating that the coefficient of restitution between rapeseed was not significant and had no effect on the angle of repose. The p-values of the coefficient of static friction between rapeseed X2, the coefficient of rolling friction between rapeseed X3, and the coefficient of rolling friction of rapeseed with contact material X4 were all less than 0.0001, indicating that these three factors had highly significant effects on the angles of repose α1, α2, and α3. The p-values of the X2X3, X2X4, and X3X4 interaction models for the angle of repose α1 were all less than 0.05; the p-values of only the X3X4 interaction model for the angle of repose α2 were all less than 0.05; the p-values of only the X2X3 interaction model for the angle of repose α3 were all less than 0.05, indicating that these interaction terms had significant effects on the angles of repose α1, α2, and α3, respectively; other than that, the remaining interaction terms had no significant effects on the angles of repose α1, α2, and α3.
3.2. Interaction Effects of the Regression Model
To further explore the effect of interaction terms, the response surface for the interaction of the factors on the angle of repose was obtained by using Design-Expert software. As shown in Table 7, the coefficient of restitution between rapeseed did not have a significant effect, so it was taken to be in the middle range of the level of 0.35. Among the three factors, the coefficient of static friction between rapeseed, the coefficient of rolling friction between rapeseed, and the coefficient of rolling friction of rapeseed with contact materials, one of the factors was fixed first, and then the response surface was used to analyze the effect law of the remaining two factors on the angle of repose.
Figure 8a,c show the response surfaces of the coefficient of static friction and rolling friction between rapeseed and the coefficient of rolling friction between rapeseed and HDPE with each other, respectively. It can be seen from the plots that the interaction between the three is obvious. From Figure 8a,b, it can be seen that angle of repose α1 gradually becomes larger with an increase in the coefficient of static friction between rapeseed, while the coefficient of static friction between rapeseeds and coefficient of rolling friction between rapeseed and aluminum alloy is constant. From Figure 8b,c, it can be seen that when the coefficient of static friction and rolling friction between rapeseed and aluminum alloy are constant, the angle of repose α1 gradually increases with an increase in the coefficient of rolling friction between rapeseed particles. From Figure 8d, it can be seen that when the coefficient of rolling friction between rapeseed particles and the coefficient of rolling friction between rapeseed and HDPE are both fixed at one, the angle of repose α2 will gradually increase with an increase of the other one. From Figure 8e, it can be seen that when the coefficient of rolling friction between rapeseed and the coefficient of static friction between rapeseed particles is fixed one-by-one, the angle of repose α3 increases gradually with an increase in the other one.

Figure 8.
Response surface for interaction factor. (a) Interactive effects of rapeseed–rapeseed coefficient of rolling friction and rapeseed–rapeseed coefficient of static friction on the angle of repose α1; (b) Interactive effects of rapeseed–aluminum alloy coefficient of rolling friction and rapeseed–rapeseed coefficient of rolling friction on the angle of repose α1; (c) Interactive effects of rapeseed–HDPE of rolling friction and rapeseed–rapeseed coefficient of static friction on the angle of repose α1; (d) Interactive effects of rapeseed–HDPE of rolling friction and rapeseed–rapeseed coefficient of rolling friction on the angle of repose α2; (e) Interactive effects of rapeseed–rapeseed coefficient of rolling friction and rapeseed–rapeseed coefficient of static friction on the angle of repose α3.
In general, when any one of the parameters was fixed, the effect of the other two parameters on the angle of repose tended to increase. This is because as the coefficient of static friction between rapeseed increases, the sliding resistance of contact between rapeseeds increases. As the coefficient of rolling friction between rapeseed increases, more and more particles in the stacking, the compaction between particles keeps increasing, the resistance to rotational movement of rapeseeds increases, and the particles are not easily displaced by leveling, resulting in a high pile of particles, which is similar to the results of ZHOU, Y.C. [33]. As the coefficient of rolling friction between rapeseed and a contact material increases, the flow capacity of the bottom particles during the stacking process decreases, which facilitates the formation of particle piles, therefore, the angle of repose on different materials increases with an increase in these three parameters.
3.3. Determination of Optimal Parameter Combination
The particle stacks of rapeseed particles on aluminum alloy, acrylic, and HDPE plates were obtained using the devices shown in Figure 2a–c, respectively, as shown in Figure 9a–c. The angles of repose were obtained at 20.41°, 19.86°, and 21.61°, respectively, according to the image processing technique above.

Figure 9.
Comparison of simulation results with real test results, (a) Accumulation of rapeseed on aluminum alloy plate; (b) Accumulation of rapeseed on acrylic plate; (c) Accumulation of rapeseed on high-density polyethylene plate.
First, the actual angle of repose of rapeseed on the aluminum alloy plate was used as the response value, and then the optimization module of Design-Expert software was used to optimize the solution for this objective. The following optimal combinations of the influencing factors were obtained: a coefficient of static friction between rapeseed particles of 0.377, coefficient of rolling friction between rapeseed particles of 0.017, and coefficient of rolling friction between rapeseed particles and aluminum alloy of 0.016. After that, the angles of repose of rapeseed particles on the acrylic and HDPE plates were used as the response values, and the constraints were the coefficient of static friction between rapeseed particles and the coefficient of rolling friction between rapeseed particles obtained in the previous step, respectively. The coefficients of rolling friction between rapeseed particles and acrylic, and rapeseed particles and HDPE were obtained as 0.011, and 0.019, respectively.
3.4. Sensitivity of Simulation Parameters
We have clarified the sensitivity of the coefficient of rolling friction between rapeseed particles and different materials on the angle of repose. The coefficients of static friction and rolling friction between rapeseed particles were chosen to be 0.377 and 0.017, respectively. The effect of the rolling friction coefficients between particles and materials on simulation results was determined by bottomless cylinder simulation tests. As shown in Figure 10, the coefficients of rolling friction between rapeseed particles and different materials had a significant effect on the simulation results. As the rolling friction coefficients between rapeseed particles and the three materials increased, the angles of repose all showed a nonlinear increase, which was similar to the conclusion of Li [34]. Therefore, the coefficients of rolling friction between rapeseed particles and different materials largely determines the result of particle stacking.
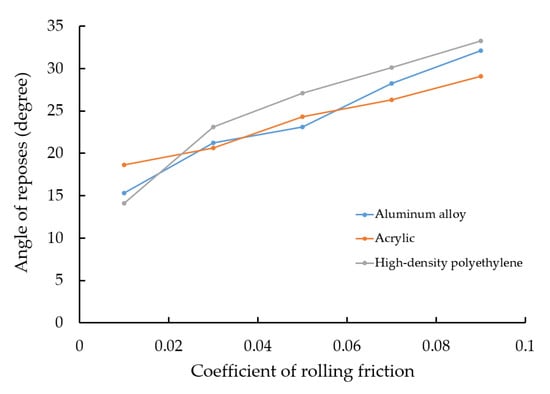
Figure 10.
Effect of the coefficient of rolling friction between rapeseed particles and different materials on the angle of repose.
3.5. Results of the Validation Tests
Taking the optimal combination of parameters as simulation input parameters, we simulated the seeding test under different working speeds; at the same time, the actual tests were carried out, as shown in Figure 11. We obtained the numerical difference of the seeding results between the simulation and the real test, as shown in Table 8. The simulation test results were better than the real test results. This is because, in this study, the simulation model of rapeseed particles is simplified to round spherical particles, and this model does not compensate for the bias arising from the differences in particle shapes. While spherical particles would reduce the computational difficulty, rapeseed particles are only constrained by the friction generated by contact with neighboring particles. Therefore, the constructed model flow characteristics of rapeseed particles are better than the flow characteristics of actual rapeseed particles. However, the average values of the relative errors of single qualified seeding, missed seeding, and multiple seeding rates were −0.15%, 3.29%, and 5.37%, respectively. The simulation and actual test results were consistent, indicating that the obtained discrete element model and contact parameters of rapeseed could be used in the DEM simulation test.
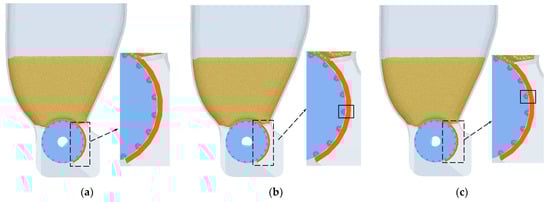

Figure 11.
Comparison of simulation results with real test results. (a) Seeding qualification of simulation; (b) Miss seeding of simulation; (c) Multiple seeding of simulation; (d) Actual seeding situation of the metering device.
Table 8.
Results of the validation tests.
4. Conclusions
In this study, a rapeseed model was developed using EDEM, and physical and inter-action parameters of rapeseed were measured, calibrated, validated, and applied on a metering device. The following conclusions were drawn:
(1) The coefficients of restitution of 0.35, 0.39, and 0.55 and static friction factors of 0.38, 0.36, and 0.43 were determined between rapeseed and aluminum alloy, acrylic, and high-density polyethylene, respectively, using the free drop and sliding ramp test.
(2) According to the results of the Box–Behnken design test, the regression model of test factors and repose angles were established and optimized. The calibrated coefficients of the static and rolling friction of rapeseed were 0.357 and 0.012, respectively. The coefficients of rolling friction between rapeseed and aluminum alloy, acrylic, and high-density polyethylene were 0.023, 0.021, 0.028, respectively.
(3) The angle of repose of rapeseed particles increases as the coefficient of rolling friction between rapeseed, and the coefficient of rolling friction between rapeseed and contact materials increase.
(4) By the validation test, the average values of relative errors of single qualified seeding rate, missed seeding rate, and multiple seeding rate for the simulated and real tests under different working speed conditions of seeding were −0.15%, 3.29%, and 5.37%, respectively. The results showed that it was feasible to apply the response surface parameter optimization method to analyze the calibrated discrete element parameters of rapeseed particles. The method can improve the reliability and accuracy of the parameter calibration results. Thus, it provides a theoretical basis for the design and optimization of rapeseed-related operation implements.
It should be noticed that the above conclusions were drawn for a specific variety of rapeseed in the given moisture content. For different conditions, further research is required.
Author Contributions
Conceptualization, X.M. and X.C.; methodology, X.C., X.M., X.W. and Z.L.; software, X.C. and X.W.; validation, X.C., Z.L. and H.L.; formal analysis, X.C., Z.L., X.W. and H.L.; investigation, X.C.; resources, X.C. and X.M.; data curation, X.C.; writing—original draft preparation, X.C.; writing—review and editing, X.C., X.M., Z.L. and H.L.; supervision, X.C.; project administration, X.C., Z.L. and X.M.; funding acquisition, Z.L. and X.M. All authors have read and agreed to the published version of the manuscript.
Funding
This work was supported by the National Key Research and Development Program of China (grant number 2018YFD0700703) and the China Postdoctoral Science Foundation (grant number 2020M682724).
Conflicts of Interest
The authors declare no conflict of interest.
References
- USDA Economic Research Service. Oil Crops Yearbook; U.S. Department of Agriculture Economic Research Service: Washington, DC, USA, 2021. Available online: https://www.ers.usda.gov/data-products/oil-crops-yearbook.aspx#.UupiItJdUS4 (accessed on 19 February 2021).
- Grima, A.P.; Wypych, P.W. Investigation into Calibration of Discrete Element Model Parameters for Scale-up and Validation of Particle–Structure Interactions under Impact Conditions. Powder Technol. 2011, 212, 198–209. [Google Scholar] [CrossRef]
- Delaney, G.W.; Cleary, P.W.; Hilden, M.; Morrison, R.D. Testing the Validity of the Spherical DEM Model in Simulating Real Granular Screening Processes. Chem. Eng. Sci. 2012, 68, 215–226. [Google Scholar] [CrossRef]
- Pasha, M.; Hare, C.; Ghadiri, M.; Gunadi, A.; Piccione, P.M. Effect of Particle Shape on Flow in Discrete Element Method Simulation of a Rotary Batch Seed Coater. Powder Technol. 2016, 296, 29–36. [Google Scholar] [CrossRef]
- Romuli, S.; Karaj, S.; Müller, J. Discrete Element Method Simulation of the Hulling Process of Jatropha Curcas L. Fruits. Biosyst. Eng. 2017, 155, 55–67. [Google Scholar] [CrossRef]
- Dong, K.J.; Yu, A.B.; Brake, I. DEM Simulation of Particle Flow on a Multi-Deck Banana Screen. Miner. Eng. 2009, 22, 910–920. [Google Scholar] [CrossRef]
- Marigo, M.; Cairns, D.L.; Davies, M.; Ingram, A.; Stitt, E.H. Developing Mechanistic Understanding of Granular Behaviour in Complex Moving Geometry Using the Discrete Element Method. Powder Technol. 2011, 212, 17–24. [Google Scholar] [CrossRef]
- Kobyłka, R.; Molenda, M. DEM Simulations of Loads on Obstruction Attached to the Wall of a Model Grain Silo and of Flow Disturbance around the Obstruction. Powder Technol. 2014, 256, 210–216. [Google Scholar] [CrossRef]
- Grima, A.P.; Wypych, P.W. Development and Validation of Calibration Methods for Discrete Element Modelling. Granul. Matter 2011, 13, 127–132. [Google Scholar] [CrossRef]
- Rackl, M.; Hanley, K.J. A Methodical Calibration Procedure for Discrete Element Models. Powder Technol. 2017, 307, 73–83. [Google Scholar] [CrossRef]
- Zhan, Z.; Yaoming, L.; Zhenwei, L.; Zhiqiang, G. DEM Simulation and Physical Testing of Rice Seed Impact against a Grain Loss Sensor. Biosyst. Eng. 2013, 116, 410–419. [Google Scholar] [CrossRef]
- Ucgul, M.; Fielke, J.M.; Saunders, C. Three-Dimensional Discrete Element Modelling of Tillage: Determination of a Suitable Contact Model and Parameters for a Cohesionless Soil. Biosyst. Eng. 2014, 121, 105–117. [Google Scholar] [CrossRef]
- Liu, F.; Chen, J. Effect of Calibration Experiments on the Micro-Parameters of Wheat Required in Discrete Element Simulations. In Proceedings of the 2017 Spokane, Washington, DC, USA, 16–19 July 2017; American Society of Agricultural and Biological Engineers: St. Joseph, MI, USA, 2017. [Google Scholar]
- Xu, T.; Yu, J.; Yu, Y.; Wang, Y. A Modelling and Verification Approach for Soybean Seed Particles Using the Discrete Element Method. Adv. Powder Technol. 2018, 29, 3274–3290. [Google Scholar] [CrossRef]
- Rozbroj, J.; Zegzulka, J.; Necas, J.; Jezerska, L. Discrete Element Method Model Optimization of Cylindrical Pellet Size. Processes 2019, 7, 101. [Google Scholar] [CrossRef]
- Kanakabandi, C.K.; Goswami, T.K. Determination of Properties of Black Pepper to Use in Discrete Element Modeling. J. Food Eng. 2019, 246, 111–118. [Google Scholar] [CrossRef]
- Raji, A.O.; Favier, J.F. Model for the Deformation in Agricultural and Food Particulate Materials under Bulk Compressive Loading Using Discrete Element Method. I: Theory, Model Development and Validation. J. Food Eng. 2004, 64, 359–371. [Google Scholar] [CrossRef]
- Raji, A.O.; Favier, J.F. Model for the Deformation in Agricultural and Food Particulate Materials under Bulk Compressive Loading Using Discrete Element Method. II: Compression of Oilseeds. J. Food Eng. 2004, 64, 373–380. [Google Scholar] [CrossRef]
- Wojtkowski, M.; Pecen, J.; Horabik, J.; Molenda, M. Rapeseed Impact against a Flat Surface: Physical Testing and DEM Simulation with Two Contact Models. Powder Technol. 2010, 198, 61–68. [Google Scholar] [CrossRef]
- Parafiniuk, P.; Molenda, M.; Horabik, J. Discharge of Rapeseeds from a Model Silo: Physical Testing and Discrete Element Method Simulations. Comput. Electron. Agric. 2013, 97, 40–46. [Google Scholar] [CrossRef]
- Tamás, K.; Földesi, B.; Rádics, J.P.; Jóri, I.J.; Fenyvesi, L. A Simulation Model for Determining the Mechanical Properties of Rapeseed Using the Discrete Element Method. Period. Polytech. Civ. Eng. 2015, 59, 575–582. [Google Scholar] [CrossRef]
- Çalışır, S.; Marakoğlu, T.; Öğüt, H.; Öztürk, Ö. Physical Properties of Rapeseed (Brassica Napus Oleifera L.). J. Food Eng. 2005, 69, 61–66. [Google Scholar] [CrossRef]
- Ghodki, B.M.; Patel, M.; Namdeo, R.; Carpenter, G. Calibration of Discrete Element Model Parameters: Soybeans. Comput. Part. Mech. 2019, 6, 3–10. [Google Scholar] [CrossRef]
- Singh, K.K.; Goswami, T.K. Physical Properties of Cumin Seed. J. Agric. Eng. Res. 1996, 64, 93–98. [Google Scholar] [CrossRef]
- Castiglioni, C.A.; Drei, A.; Carydis, P.; Mouzakis, H. Experimental Assessment of Static Friction between Pallet and Beams in Racking Systems. J. Build. Eng. 2016, 6, 203–214. [Google Scholar] [CrossRef]
- Alizadeh, E.; Bertrand, F.; Chaouki, J. Development of a Granular Normal Contact Force Model Based on a Non-Newtonian Liquid Filled Dashpot. Powder Technol. 2013, 237, 202–212. [Google Scholar] [CrossRef]
- Horabik, J.; Molenda, M. Parameters and Contact Models for DEM Simulations of Agricultural Granular Materials: A Review. Biosyst. Eng. 2016, 147, 206–225. [Google Scholar] [CrossRef]
- Boac, J.M.; Ambrose, R.P.K.; Casada, M.E.; Maghirang, R.G.; Maier, D.E. Applications of Discrete Element Method in Modeling of Grain Postharvest Operations. Food Eng. Rev. 2014, 6, 128–149. [Google Scholar] [CrossRef]
- Xu, L.; Wei, C.; Liang, Z.; Chai, X.; Li, Y.; Liu, Q. Development of Rapeseed Cleaning Loss Monitoring System and Experiments in a Combine Harvester. Biosyst. Eng. 2019, 178, 118–130. [Google Scholar] [CrossRef]
- Azimian, M.; Bart, H.-J. Numerical Investigation of Particle Rebound Characteristics with Finite Element Method. OJFD 2017, 7, 310–329. [Google Scholar] [CrossRef][Green Version]
- Moysey, P.A.; Thompson, M.R. Determining the Collision Properties of Semi-Crystalline and Amorphous Thermoplastics for DEM Simulations of Solids Transport in an Extruder. Chem. Eng. Sci. 2007, 62, 3699–3709. [Google Scholar] [CrossRef]
- Xia, R.; Li, B.; Wang, X.; Li, T.; Yang, Z. Measurement and Calibration of the Discrete Element Parameters of Wet Bulk Coal. Measurement 2019, 142, 84–95. [Google Scholar] [CrossRef]
- Zhou, Y.C.; Xu, B.H.; Yu, A.B.; Zulli, P. An Experimental and Numerical Study of the Angle of Repose of Coarse Spheres. Powder Technol. 2002, 125, 45–54. [Google Scholar] [CrossRef]
- Li, Q.; Feng, M.; Zou, Z. Validation and Calibration Approach for Discrete Element Simulation of Burden Charging in Pre-Reduction Shaft Furnace of COREX Process. ISIJ Int. 2013, 53, 1365–1371. [Google Scholar] [CrossRef][Green Version]


Publisher’s Note: MDPI stays neutral with regard to jurisdictional claims in published maps and institutional affiliations. |
© 2021 by the authors. Licensee MDPI, Basel, Switzerland. This article is an open access article distributed under the terms and conditions of the Creative Commons Attribution (CC BY) license (https://creativecommons.org/licenses/by/4.0/).