Abstract
The Danube is the second-longest river in Europe that is subjected to various man-made alterations, including those related to hydro-power plants. We surveyed and analyzed the presence and abundance of macrophytes in the main channel from 2582 river kilometers (rkm) to 171 rkm. We also assessed selected habitat parameters in the sampled river stretches. Sixty-eight different plant species were recorded along the entire course. Among neophytes, we found Elodea nuttallii, E. canadensis, Vallisneria spiralis and Azolla filiculoides. Based on similarity analysis, we distinguished 15 plant communities, most of which were defined as associations, which were classified into 5 alliances and represented three vegetation classes, namely vegetation of rooted hydrophytes Potamogetonetea, the vegetation of pleustophytes Lemnetea and vegetation of marshes Phragmitetea. The number and abundance of plant species, as well as plant communities recorded in single stretches, varied along the course. Canonical correspondence analysis (CCA) revealed that environmental parameters explained 21% of plant species composition. CCA runs with neophytes explained 41% of the variance, and current velocity, water transparency, species number and bank structure were significant variables. The present study revealed that the free-running sections of the river are poor in number and abundance of plant species, whereas impounded reaches mainly show an opposite result.
1. Introduction
The Danube is the second-longest river in Europe, forming the second largest river basin on the continent. The river basin, covering an area of 807.827 square kilometers [1], is recognized as a hotspot of European freshwater biodiversity [2]. The Danube River connects the territories and interests of at least 18 different countries. It flows through Germany, Austria, the Slovak Republic, Hungary, Croatia, Serbia, Romania, Bulgaria and Ukraine and gathers the water draining from catchments in Switzerland, Italy, the Czech Republic, Poland, Slovenia, Bosnia and Herzegovina, Montenegro, Albania and Moldova. As any other river, the Danube defines the quality of the landscapes and their ecological systems [3,4] and, at the same time, is influenced by their quality and human activities [5].
Lotic ecosystems change in time and space. The modern characterization of rivers has a history going back to about 1960, starting with Odum [6], Illies and Botoseanu [7], as well as with Hawkes [8]. An important step was taken by Vannote et al. [9], who described a continuous gradient of discharge, current velocity, flow pattern, bed and bank structure, dependent on hydrological and hydraulic replacements, showing adjustments in biota and their populations along the river course, named as the river continuum concept (RCC). Soon thereafter, Ward and Stanford [10] published the serial discontinuity concept, which extends the scope of the RCC, focusing on man-made alterations in rivers, especially hydro-power plants (HPP) and other structural modifications. A decade later, Ward and Stanford [11] extended the discontinuity model to rivers with floodplains. This relates well with large rivers like the Danube (e.g., [12]). Moog and co-workers [13] defined ten Danube section types along its course that based on the Danube River typologies regarding the catchment geology, slope [14], geomorphological landscape features and anthropogenic impacts, as well as geomorphological regions and the ecoregions of Illies [15].
The Danube River had been a crucial pathway of Central Europe regarding invasions, settlement, trade and navigation in the Danube basin for more than 2500 years [16]. These multiple socio-economic impacts exerted various pressures to the river [1] that resulted in increased pollution [17,18] and is a significant loss of habitats and species [19], which rank the Danube among the world’s top 10 rivers at risk [1]. The main pressures are pollution by industrial and urban wastewater and runoff from agricultural landscapes, overfishing, urban development, dams and bank erosion [16]. In spite of these pressures, the river still shows a high ecological potential [19], harboring a variety of different groups of organisms, including aquatic macrophytes [20].
Aquatic macrophytes comprise a variety of taxonomic groups, from macroscopic algae (e.g., stoneworts), to bryophytes, pteridophytes and angiosperms [21]. They are variable regarding their anatomical and physiological traits, life-history and their tolerance to different physical, chemical and biotic stressors [22]. Macrophytes play a fundamental role in the structure and functioning of river ecosystems that is also the case in large rivers [23]. Macrophytes are involved in energy flow, nutrient cycling and also provide habitats for a large variety of organisms [24,25,26,27]. Macrophytes function as “biological engineers”, causing significant morphological and ecological modifications of the river [28] by significantly altering sedimentation processes and flow patterns in streams [22,29,30]. They also absorb nutrients and other substances from water and sediment and thus affect its quality [31]. The function of macrophytes strongly depends on their growth form and abundance [32]. The presence and abundance of macrophytes in the river bed depend on water and sediment chemistry, water depth, flow velocity, and substrate characteristics [24,33,34,35,36], but less on water temperature [37]. Macrophytes are valuable indicators of water and sediment quality [38,39,40,41]. Since they respond to the changes in nutrient concentration, they can contribute significantly to the assessment of the river ecosystems [42]. Variability of macrophyte communities can, therefore, be explained by a variety of environmental parameters, mainly by altitude, flow, riverbed substrate, conductivity and alkalinity, but these communities do not necessarily reflect specific ecoregional distribution [35,43].
The knowledge of macrophyte diversity, their geographic distribution, their structural properties and habitat preferences is of crucial importance for science and enables the definition of the reference conditions for the assessment of the ecological status according to the Water Framework Directive [40]. These data may also enable the prediction of future changes in species composition due to human impacts. Various parameters that shape macrophyte communities may have synergistic and antagonistic effects [44]. For instance, Demars and Edwards [45] claim that one cannot separate the effect of nutrients from other environmental variables, especially along a steep environmental gradient, and they suggested that the response of macrophytes to nutrient enrichment should be studied in homogeneous groups defined by factors, such as alkalinity and slope.
The estimation of biotic communities in large rivers is very hard due to the complexity and spatial and temporal heterogeneity along the river [23,46], as well as due to its depth and width. This is also the case in the Danube River that varies significantly in slope [14], discharge [47], substrate, current velocity, bank structure and water transparency [48]. River regulation included straightening of the river channel by transforming meanders into oxbows, mostly with reduced connection to the main river channel. Artificial bank reinforcements guaranteed secure and technically stable navigation channels, and river bed incision was reduced where run-of-river hydro-power plants (HPP) were installed. Thus, the present status of the Danube is, unambiguously, far from being natural. However, according to Ward and Stanford [10], the most extensive technical interference with the river course and its biota are dams and impoundments of the HPPs. Besides significantly changing habitats, HPPs can have strong edge effects both upstream and downstream [49]. In addition, almost the entire length of the Danube suffers from substantially trimmed floodplain areas.
In this contribution, we analyze the presence and abundance of macrophytes, including neophytes, in the main channel of the Danube River from 2582 river kilometers (rkm) in Baden-Württemberg (SW Germany) to 171 rkm in the delta in Romania. Regarding various alternations along the river, we hypothesized that the distribution, diversity and abundance of macrophytes and their communities along the course will not be in accordance with the river continuum concept and regionality but will more likely reveal serial discontinuity. Regarding our research questions, we presume that these communities will be influenced by habitat parameters in the sampled river stretches.
2. Materials and Methods
2.1. Site Description
The locations of towns, HPPs and backlogs of reservoirs expressed as the river kilometers (rkm) are defined by Linz Rowing Club (ISTER) [50], HPP-Bavaria [51], and the Danube Commission [52]. The river section in Baden-Württemberg (Germany) is interrupted by 24 HPPs, and another 21 HPPs in the Bavarian section. The only Bavarian reach in “near-natural” conditions is between rkm 2328 and 2225 upstream HPP Passau. Then the Danube enters Austria, where 10 HPPs break the continuum in the main channel. However, one of Austria’s river sections with no HPPs is the constrained Wachau Valley, a natural reserve. This river part with free-running conditions is located between HPP Melk (rkm 2038) and the backlog (rkm 2002) of the reservoir of HPP Altenwörth (rkm 1981). Passing the Danube downstream to Vienna through several impoundments, the HPP Freudenau at rkm 1921 is the last one in the Austrian section. The following free-running section ends where the backlog of the Čunovo Reservoir (in Slovakia) is clearly detectable at rkm 1859, downstream of Bratislava. Close to the head of Čunovo Reservoir, water is diverted to the Old Danube (former main channel), which represents the Slovak/Hungarian state border. The whole area is part of the large inland delta, with floodplain water bodies in both countries. The Čunovo Reservoir also feeds the diversion of water to the HPP Gabčikovo at rkm 1820. The next “free-running” river section starts close to Gönjü (rkm 1791), already in Hungary and continues for about 625 km to a point 15 rkm downstream Belgrade in Serbia. At this point in the river, the backlog of the Iron Gate I impoundment (length: 211 rkm) begins at mean discharge. The dam of Iron Gate I is located at rkm 943. The Iron Gate II HPP is located at rkm 864, as the very last obstacle in the Danube, enabling a free run towards the delta, close to the city of Galaţi (Galatz).
2.2. Macrophyte Survey
The survey was performed in the main channel of the Danube River from 2582 rkm in Baden-Württemberg (SW Germany) to 171 rkm in Romania in survey units of one-km length. Survey units are matched with the indications of the river kilometers of 1000 m length along the river. In the Danube channel, aquatic plants usually do not colonize river parts much deeper than about 1.5 m [20], where the river has a high potential for macrophyte colonization, even covering the whole river width in some locations. Downstream from the city of Ulm, the river widens, and the left and right bank were surveyed separately, all the way to the delta. The width of the vegetated belt depends on morphological parameters of the riverbed and banks, including human interventions. The field surveys were conducted by boat using the rake and grapnel and/or aqua-scope in deeper water during the peak vegetation period in summer in years from 2002 to 2004. The whole river was surveyed by moving the boat(s) in a zig-zag pattern in narrow reaches upstream of Ulm, whereas the near-bank areas were surveyed by slowly moving along the banks. While proceeding downstream, the observed species were recorded in the species list. At the end of each rkm, benchmarked by the navigation signs, the final estimate of abundance was noted down.
The presence and abundance of aquatic macrophytes and macrophyte assemblages, respectively, were assessed in survey units of one-km length in the main channel of the Danube. The relative abundance was evaluated using a five-degree scale as proposed by Kohler and Janauer [53] using 5-level scale, namely 1 = very rare; 2 = rare; 3 = common; 4 = frequent; 5 = abundant/predominant. Plants that were sampled in the phenological phase, preventing identification to the species level, were recorded as a genus. Species names were unified according to Flora Europaea [54].
2.3. Assessment of Habitat Parameters
During regular surveys habitat, the parameters listed below were assessed along with a survey of the macrophyte vegetation. Bank structure, sediment type, flow class and land use type in the areas adjacent to the river are described according to CORINE System [55] with some adaptations regarding the spatial aspects of the river surveys. We used a 1–5 or 1–6 scale to describe specific environmental gradients of environmental parameters. The categories for the selected parameters were the following: (a) bank structure—refers to the upper littoral, extending over the water level during mean discharges (1—concrete or other artificial embankment material, 2—large rocks used for bank stabilization and river regulation, 3—gravel, 4—sand, 5—fine inorganic material, 6—floating mats), (b) sediment type (1—artificial material, e.g., concrete, asphalt, etc., 2—solid rock, 3—gravel, 4—sand, 5—fine inorganic material, 6—detritus or other organic material), (c) flow class (1—no flow/stagnant, 2—low flow, just visible to ca. 30 cm·s−1; 3—medium flow, 35 to 65 cm·s−1; 4—high flow, >70 cm·s−1), (d) land use type (1—artificial surfaces, 2—agricultural areas, 3—open spaces with little or no vegetation (gravel bars, sands, riverbanks, bare rock), 4—scrubs, 5—forests, 6—wetlands). In addition, (e) water transparency (transparency ratio, the relationship between total water depth and Secchi depth) was determined.
2.4. Data Treatment
The relative abundance values [53] were transformed by function x3 [42], which describes best the relationship between the five degrees of estimation and the actual quantity of the macrophytes [53]. The ordinal values of abundances were transformed into quantitative values (“quantities”), which provided a set of species-data suitable for statistical analyses [56]. It was shown that transformed values highly correlate with average values of percentage cover-abundance classes of plant species according to Braun-Blanquet [57], and were even used as substitutes of these percentage cover-abundance values (e.g., [58,59]). Thus, we also used the transformed values as percentage cover-abundance values according to Braun-Blanquet [57] to examine if the clusters obtained by cluster analysis meet the definitions of specific associations, which are mostly defined by the presence and/or abundance of diagnostic species. These “adjusted” values for dominant species are presented in Table 1.

Table 1.
The description of different clusters regarding the number of stretches/plant assemblages (N) mean Secchi depth, mean number of species, dominant species, adjusted mean abundance of dominant species, species frequency and the type of association.
2.5. Similarity of Macrophyte Communities
The similarity of the macrophyte assemblages between the stretches was calculated with PAST, version 2.17c [60]. Ward’s method was used as linkage method, and Euclidean distance was used as similarity index [61], which have been used by others with macrophyte data [62,63] and which provided the clustering with the lowest level of chaining [64]. The aim of the clustering method was a comparison of similarity between the records and help in their classification to the defined plant communities. We used an approach based on the dominant species, which are also diagnostic species of the associations and is the most frequently used approach for aquatic vegetation [65]. Dominance-based classification for species-poor plant communities is most similar to the approaches in traditional phytosociology [66]. For the classification of the individual clusters to the described aquatic plant communities, we used the definitions found in [67].
2.6. The Influence of Environmental Factors on the Composition of the Macrophyte Community
First, a detrended correspondence analysis (DCA) was performed, which helped us to reveal whether the gradients in the matrix of macrophyte species data are linear or unimodal and which direct gradient analysis to choose for further analyses. When the eigenvalue for the first axis in DCA was <0.4 and/or gradient length was <3 standard deviations, Redundancy analysis (RDA) was applied, while in the case when these values were higher, we applied Canonical correspondence analysis (CCA) [68]. The results of these analyses enabled us to assess the relationship between environmental parameters and the composition and abundance of macrophytes. The influence of the environmental factors on the distribution of neophyte species was tested with canonical correspondence analysis. We used forward selection, where 999 permutations were performed in every round to rank the relative importance of explanatory variables and to avoid co-linearity [69]. Only parameters with p <0.05 were considered in further analyses. In the first run, the multivariate analysis was performed for all recorded species, while in the second run, we selected only species having total abundances >1%. In addition, we performed multivariate analysis to explore the relationship between the neophyte species and environmental parameters. All analyses were performed using CANOCO for Windows 4.5 program package (Microcomputer Power: Ithaca, NY, USA) [68].
3. Results
3.1. Species Presence and Abundance
We recorded 68 different plant species along the entire studied length. The most common and abundant taxon was Potamogeton pectinatus with 14.5%, followed by P. perfoliatus with 11.6% and Myriophyllum spicatum with 10.1% (Figure 1). Among the most abundant species presenting more than 2% of total abundance were seven species of the genus Potamogeton. On the whole, we recorded 11 species of this genus, namely P. pectinatus, P. coloratus, P. pussilus, P. trichophyllus, P. lucens, P. nodosus, P. natans, P. gramineus, P. crispus, P. perfoliatus and P. acutus. The majority of abundant species appearing in the Danube are submerged hydrophytes, and only a few of them develop natant leaves. The most abundant among amphiphytes is Butomus umbellatus that mainly appears as f. aquatica. We also detected few free-floating species, namely spermatophytes Wolffia arrhyza, Lemna minor and L. gibba, Spirodela polyrhiza and ferns Salvinia natans and Azolla filiculoides. In spite of a high number of recorded species, we did not find any species from the EU Red list.
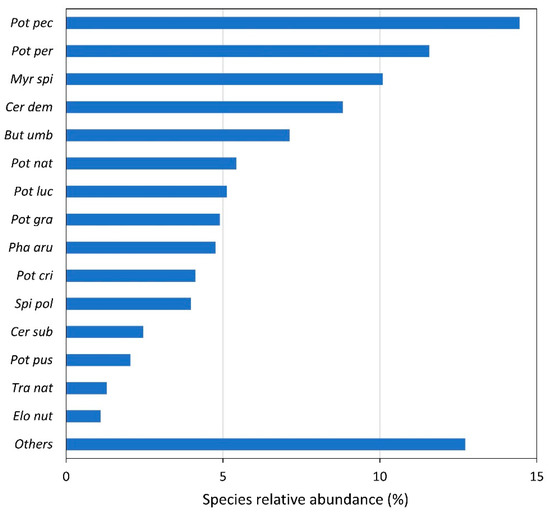
Figure 1.
Relative values of total abundance of different species occurring in the Danube River. “Others” indicates the abundance of the remaining species. Species abbreviations: Pot pec—Potamogeton pectinatus, Pot per—Potamogeton perfoliatus, Myr spi—Myriophyllum spicatum, Cer dem—Ceratophyllum demersum, But umb—Butomus umbellatus, Pot nat—Potamogeton natans, Pot luc—Potamogeton lucens, Pot gra—Potamogeton gramineus, Pha aru—Phalaris arundinacea, Pot cri—Potamogeton crispus, Spi pol—Spirodela polyrhiza, Cer sub—Ceratophyllum submersum, Pot pus—Potamogeton pusillus, Tra nat—Trapa natans, Elo nut—Elodea nuttallii.
The occurrence and relative abundance of these most abundant native species along the flow is presented in Figure 2. The majority of species, with the exception of T. natans and Ceratophyllum submersum, were found at different parts of the river course. T. natans was found mainly in the section from 1150 to 850 rkm, where also several other species occurred with the highest abundance.
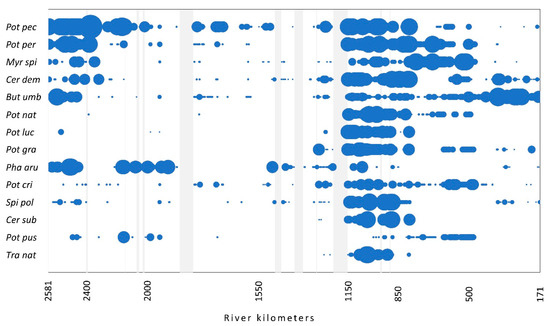
Figure 2.
The occurrence of the most abundant native species (>1%) along the flow. The size of the circles shows the relative abundance of each species. Light gray vertical bars represent the sections with no data. For species abbreviations, see Figure 1.
The number of species recorded in a single stretch varied along the flow, and this holds true also for species abundance. The pattern of values of both parameters along the flow reveals a similar picture showing two peaks. The first appears at the beginning of the upper section, then it gradually decreases, reaching the second peak at the end of the middle section and at the beginning of the lower section of the river (Figure 3). Both parameters were the highest in the second part of the middle section, while the lowest values were detected at the first part of this section.
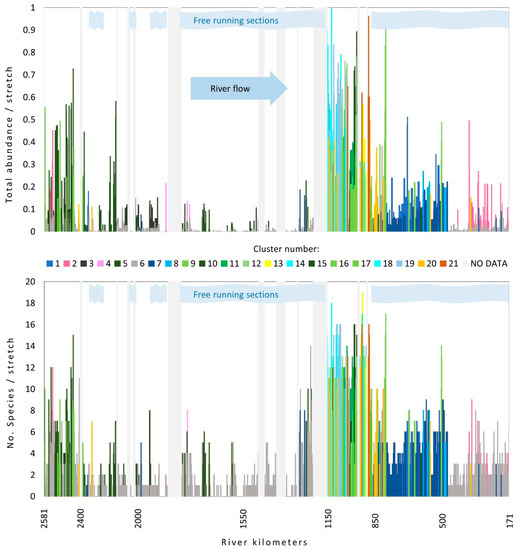
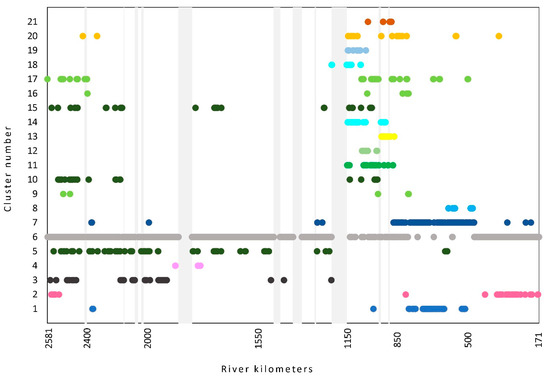
Figure 3.
Changes in total species number (lower graph) and relative species abundance along the Danube River flow. Different colors indicate different clusters. Light grey vertical bars represent the sections with no data. Light blue stripes indicate sections where no influence of dams on the flow was detected. For cluster number information, see Table 1.
3.2. Neophyte Species Presence and Abundance
The presence and abundance of four species from the EU neophyte list were analyzed: Elodea nuttallii, E. canadensis, Vallisneria spiralis and Azolla filiculoides. Regarding the surveyed flow, E. nuttallii was only the 15th with 1.1% of total abundance, V. spiralis with 0.7% on the 23rd, E. canadensis on the 26th with 0.6%, and A. filiculoides with only 0.1% of total abundance the 40th. (Figure 1). E. nuttallii was found in 110 stretches and mainly occurred with low abundance together with more abundant species like P. perfoliatum, C. demersum, B. umbellatus and S. polyrhiza, and just in one case with E. canadensis. The latter species was found in 52 stretches and mainly occurred in species-rich plant communities in combination with the majority of species recorded. V. spiralis was found at 58 locations in a community with P. natans, B. umbellatus, C. demersum, M. spicatum, P. perfoliatus and P. pectinatus. However, regarding distribution along the flow, it is still limited to its native range. A. filiculoides was found at 51 stretches but with very low abundance in a company with a variety of species (Figure 4).
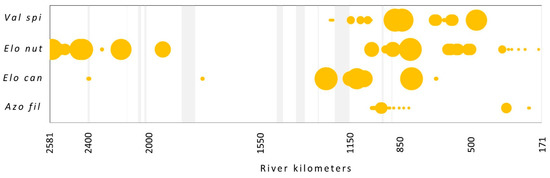
Figure 4.
The occurrence of neophyte species (according to EU list) along the flow. The size of the circles shows the relative abundance of each species. Light gray vertical bars represent the sections with no data. Species abbreviations: Val spi—Vallisneria spiralis, Elo nut—Elodea nuttallii, Elo can—E. canadensis, Azo fil—Azolla filiculoides.
3.3. Plant Communities along the Course
Then we examined a similarity of macrophyte communities along the river course and obtained 2 main clusters subdivided into 9 and 12 clusters (Figure 5). The sample locations within the clusters did not show the river continuum but are scattered in different groups (Figure 6). Cluster 6, which comprises more than half of the stretches (1344), is marked by very scarce vegetation, mainly consisting of amphiphytes.
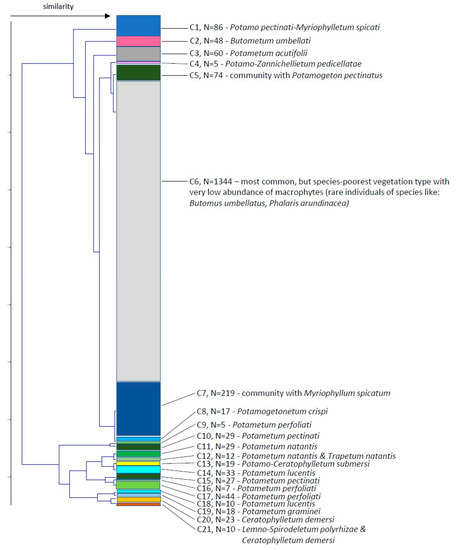
Figure 5.
Similarity of the macrophyte communities comparing different stretches along the River Danube using Ward’s linkage method and Euclidean distance similarity index. C—cluster, N—number of stretches in the cluster.
The description of different clusters regarding mean Secchi depth, mean number of species, mean total relative abundance, dominant species, dominant species mean relative abundance, species frequency and the type of association is presented in Table 1.
Based on the analyses of records and definitions of vegetation units, three orders and five alliances encompassing 15 associations were distinguished, which at the same time represented vegetation of three classes, namely vegetation of rooted hydrophytes Potamogetonetea, the vegetation of free-floating hydrophytes Lemnetea and vegetation of marshes of the class Phragmitetea.
3.3.1. Order Potamogetonetalia Koch 1926
The majority of the plants in different stretches were classified into plant communities of this order, which was also the most diverse and common order of the class Potamogetonetea Klika et Novak 1941, encompassing the rooted vegetation thriving in lentic or lotic ecosystems, which could be entirely submerged or with floating leaves.
- Alliance Potamogetonion Libbert 1931
Association Potamo pectinati-Myriophylletum spicati Rivas Goday 1964(cluster 1, 86 stretches)
The far most abundant (33%) and frequent (100%) macrophyte in this plant community (cluster 1) was Myriophyllum spicatum, which represented about two-thirds within total abundance. Consequently, this association is species-poor (on average 4.5), despite the high transparency measured in these stretches (118 ± 25 cm). It was found in the lower part of the Danube (Figure 6).
Plant community with Myriophyllum spicatum(cluster 7, 219 stretches)
We classified this second largest group of stretches (cluster 7, Figure 5) into the suboptimal form of the above-described association since the characteristic species did not reach high abundance nor dominance. However, it was twice more frequent than the second most abundant species, Ceratophyllum demersum. This plant community also has the same pattern of distribution (Figure 6) along the course as the better-developed association Potamo pectinati-Myriophylletum spicati also occurs in the middle and upper part of the Danube.
Association Potametum acutifolii Segal ex Šumberová et Hrivnák in Chytrý 2011(cluster 3, 60 stretches)
The most outstanding characteristics of this association are its lowest species richness (average 1.8) and total abundance. The characteristic and dominant species Potamogeton acutifolius is the most common (100%) and also the most abundant species. It is mainly found in turbid water of the upper part of the Danube (Figure 6), with some occurrence in the middle part.
Association Parvo-Potamo-Zannichellietum pedicellatae Soó 1947(cluster 4, 5 stretches)
This is the rarest plant association in this study, found only in five stretches, where the characteristic and dominant species. Zanichellia palustris represents the vast majority of plant biomass, which tolerates low transparency (average 66 cm). Consequently, few other species thrive in these species-poor stands (average 3.8). These stretches are found in Slovakia within the Čunovo Reservoir.
Association Potametum crispi Soo 1927(cluster 8, 17 stretches)
The species composition of this association is most similar to the plant community with Myriophyllum spicatum (Figure 5), but the dominant species here is Potamogeton crispus, which is present in all these stretches and is about three times more abundant than Myriophyllum. The abundance of this vegetation cover type also appears twice in the dendrogram, mostly on account of Potamogeton crispus. This association is found only in the lower part of the Danube.
Association Potametum pectinati Carstensen ex Hilbig 1971(cluster 10, 29 stretches; cluster 15, 27 stretches)
This plant association occurs in two forms that are found in clusters 10 and 15 (Figure 5). The stretches found in cluster 10 are better defined by stretches of the dominant characteristic species P. pectinatus (Potamogeton pectinatus) (average 65%), so we considered it as the typical form of association. The species richness is moderate (average 8.1). The average water transparency is 78 cm. The majority of stretches are found in the upper part of the Danube, some in the middle (Figure 6).
The stretches in cluster 15 are poorer in species (average 5.9) as well as in their abundance (average 68%). The abundance of the dominant species P. pectinatus is two times lower than in typical form. One of the possible reasons is also lower transparency (69 cm) as compared with the typical form. These stretches are more widely distributed in the upper and middle parts of the Danube (Figure 6).
Plant community with Potamogeton pectinatus(cluster 5, 74 stretches)
The stretches found in this cluster were classified as the plant community with P. pectinatus, which is in a suboptimal stage in the development of the above-listed association Potametum pectinati. Although the characteristic species P. pectinatus is present in almost any stretch (97%) with at least some individuals and is also the most abundant species, its abundance is too low to define the association (avg. 8.2%). This vegetation type is species-poor (avg. 3.3) and low in abundance (18%). The characteristic condition for this type is the lowest water transparency in the entire Danube (63 cm). This vegetation type has an even wider distribution range than the above association and could be found throughout the upper and middle part of the Danube, as well as in some of the stretches in the lower part (Figure 6).
Association Potametum perfoliati Miljan 1933(cluster 9, 5 stretches; cluster 16, 7 stretches; cluster 17, 44 stretches)
This plant association occurs in three forms that are found in three separate clusters: 9, 16 and 17 (Figure 5). The stretches in cluster 16 are best defined by the most outstanding dominance of the characteristic species P. perfoliatus (average 62%), which represented half of the total abundance, so we considered it as the typical form of association. The second most abundant species was Ceratophyllum demersum (average abundance 21%, present in 86% of stretches). The species richness was moderate (average 9.6). The average water transparency was 123 cm.
A higher similarity was found with the stretches in the biggest cluster 17 (Figure 5), where P. perfoliatus retained its dominance despite a much lower abundance (26%). The second most abundant species in these stretches was Potamogeton pectinatus. These stretches were poorer in species (average 7.2). A possible reason is lower water transparency (avg.109 cm).
In the smallest cluster 9 (5 stretches), the characteristic species P. perfoliatus is codominant with Potamogeton pectinatus, which reached the same average abundances (63%). The third most abundant species was Ceratophyllum demersum (average 16%). These stretches are most species-rich (avg. 12) and very abundant with macrophytes. Despite the division of this association into three clusters, their distribution pattern is the same (Figure 5)—one group of stretches is in the uppermost part of the Danube in Bavaria, while the other is in the transition between the middle and lower part and also in the lower part of the Danube. The majority of stretches are found in the upper part of the Danube, some in the middle (Figure 6).
The stretches in cluster 15 are poorer in species (average 5.9). The abundance of the dominant species Potamogeton pectinatus is two times lower than in typical form. One of the possible reasons is also lower transparency (69 cm) than in the typical form. These stretches are more widely distributed in the upper and middle parts of the Danube (Figure 6).
Association Potametum natantis Hild 1959(cluster 11, 29 stretches; cluster 12, 4 of 12 stretches)
This plant association occurs in two forms that are found in clusters 11 and 12 (Figure 5). The stretches in cluster 11 are more uniform than in the second cluster 12, but in both clusters, the characteristic species with floating leaves, P. natans, is most abundant and present in every stretch. In the first group, three species are subdominant (P. perfoliatus, P. graminoides, P. pectinatus), the species richness and total abundance are moderate. The second cluster is joined with the association Trapetum natantis in the same cluster and is richer in species (avg. 11.5) as well as in their abundance. The subdominant species there is P. pectinatus. This association is found in both Iron Gate Reservoirs.
Association Potametum lucentis Hueck 1931(cluster 14, 33 stretches; cluster 18, 10 stretches)
This plant association occurs in two forms that are found in clusters 14 and 18 (Figure 5). The stretches in smaller cluster 18 are better defined due to the higher abundance of characteristic species P. lucens (avg. 47%). The codominant species here is P. pectinatus (avg. 42%), while C. demersum is subdominant (avg. 23%). These stretches are moderately species-rich (12.4) despite the highest total abundance within the studied stretches and low water transparency (68 cm). The larger cluster encompasses stretches with significantly lower total abundance (avg. 36%), while the number of species is almost the same (11.8). Although with lower abundances, the three most abundant species are the same as in the first cluster. The characteristic species P. lucens is most abundant here (avg. 24%). The distribution pattern of both clusters is the same, which is downstream the inflow of the river Sava and Iron Gate I Reservoir.
Association Potametum graminei Lang 1967(cluster 19, 18 stretches)
The stretches in this cluster are classified into association Potametum graminei due to the high abundance of the characteristic species P. gramineus (avg. 29.6%), despite the fact that codominant species P. pectinatus and Ceratophyllum demersum have a bit higher abundance. However, for the definition of other associations, their abundances are not sufficient. The species-richness is moderate (12.9). The distribution pattern is very similar to the pattern of Potametum lucentis, which is recorded downstream the inflow of the river Sava and the Iron Gate Reservoir.
Species-poorest vegetation type in sections with the lowest abundance of macrophytes.(cluster 6, 1345 stretches)
This was by far the largest group (cluster 6, Figure 5) and the most common vegetation type, which encompassed more than half of the recorded stretches (1345). At the same time, it was also the species-poorest group with only 1.5 macrophytes species on average (min–max 0–6) per stretch, which had a very low abundance value, which is 4% on average. The most common species in this type were actually marsh species (helophytes) Butomus umbellatus found within one-fifth of these stretches, Phalaris arundinacea within 15% of stretches. This type is scattered along the entire course of the Danube, from the source to the delta (Figure 6), with the exception of the stretches where communities with the dominant species Myriophyllum spicatum (clusters 1 and 7) are found.
- Alliance Nymphaeion albae Oberdorfer 1957
Association Trapetum natantis Kárpáti 1963(cluster 12, 8 of 12 stretches)
This plant association is defined within cluster 12 (Figure 5), which also contains 4 stretches with dominant species P. natans, which were classified into the association Potametum natantis. The species richness of the entire cluster is moderate (avg. 11.5) but with high total abundance. The dominant or codominant species in these stretches is Trapa natans; subdominant species there is P. pectinatus. This plant association is found only in the Iron Gate I Reservoir.
3.3.2. Order Lemnetalia minoris O. de Bolòs et Masclans 1955
- Alliance Stratiotion Den Hartog et Segal 1964
Association Potamo-Ceratophylletum submersi Pop 1962(cluster 13, 19 stretches)
This plant association is defined within cluster 13 (Figure 5) and is defined by the characteristic species Ceratophyllum submersum, which has the highest abundance (avg. 21%). Specific for this community is the high abundance and constancy of the pleustophyte Spirodela polyrhiza (avg. 18%) and also Lemna minor. The highest water transparency was measured in these stretches (130 cm). This association is found only in the Iron Gate II Reservoir, downstream the stretches with Trapetum natantis.
Association Ceratophylletum demersi Corillion 1957(cluster 20, 23 stretches)
This pleustophyte association is defined with characteristic species Ceratophyllum demersum, which has the highest abundance (avg. 31%) and is accompanied by Spirodela polyrhiza (avg. 13%). The species-richness was lower (8.8) as in the previous association. The most significant difference was much lower water transparency (70 cm). The distribution of this association is wide since it is found in all three parts of the Danube (Figure 6).
- Alliance Lemnion minoris O. de Bolòs et Masclans 1955
Association Lemno-Spirodeletum polyrhizae Koch 1954(cluster 21, 8 of 10 stretches)
This most typical pleustophyte association is dominated by the characteristic species Spirodela polyrhiza (avg. 56%), which is accompanied by other pleustophytes like Lemna minor, Salvinia natans and Wolffia arrhiza. The most abundant submerged species were Ceratophyllum demersum (avg. 30%), which dominated in two assemblages (→ Ceratophylletum demersi) and C. submersum (avg. 20%). This association was the richest in species (avg. 13.2), while the average water transparency was the second-highest (125 cm). This association is found only in the Iron Gate Reservoirs (Figure 6).
3.3.3. Order Phragmitetalia
Association Butometum umbellati Philippi 1973(cluster 2, 48 stretches)
This is the only association that represents the vegetation of marshes, which consists of different species of helophytes. In these stretches, the characteristic and dominant species B. umbellatus was found with the highest abundance (average 29%), mostly as f. aquatica. The second most abundant plant taxa were Agrostis stolonifera and Sparganium erectum, but with significantly lower abundances. This plant-community is species-poor (average 3.6) and has specific distribution since it was found in the section close to the source of the Danube and in the last section downstream to the rkm 400. Considering the most abundant plant taxa, this community is well adapted to the oscillation of the water level.
3.4. The Influence of Environmental Factors on the Composition of Macrophyte Communities
Using CCA and RDA, we tried to explain species presence and abundance with selected environmental parameters detected at species locations. When effects of single variables were examined (marginal effects), the specific variable at right (R) and left (L) bank explained similar levels of species variation. However, when all variables were taken together (conditional effects), in the majority of cases, only variables for one bank were revealed to be significant due to co-linearity. In the first run, the RDA was performed for the whole flow, but the variance explained by environmental factors was 8% in whole. When only species with relative abundance more than 1% were considered, the explained variance was somewhat higher (21%) (Table 2); water transparency is the most important by explaining 6% of species variability.
Table 2.
Summary of multivariate analyses aimed to explain the species presence and abundance with environmental selected environmental parameters. RDA—Redundancy analysis, CCA—Canonical correspondence analysis, DCA—Detrended correspondence analysis.
In the following run, we applied CCA to explore the relation between neophyte species and environmental parameters and explained as much as 41% of the variability of neophyte presence and abundance. The most influential parameters were a current velocity that explained 17% (L) and an additional 1% (R), followed by Secchi depth with 12%, number of species with 5% and bank structure with an additional 3% (Table 2).
CCA plot reveals different positions of four neophyte species with respect to the vectors of significant environmental variables (Figure 7). E. canadensis occurs at locations with a higher number of plant species, higher current velocity and finer sediment, while E. nuttallii occurs at the opposite side of these vectors, which reveals a much different habitat type characterized by lower current velocity, coarser sediment and lower number of species in the community. The presence and abundance of V. spiralis seem to be related to stretches with higher water transparency and banks rich in a finer substrate. A. filiculoides is a natant fern, which occurred close to the middle values of examined parameters.
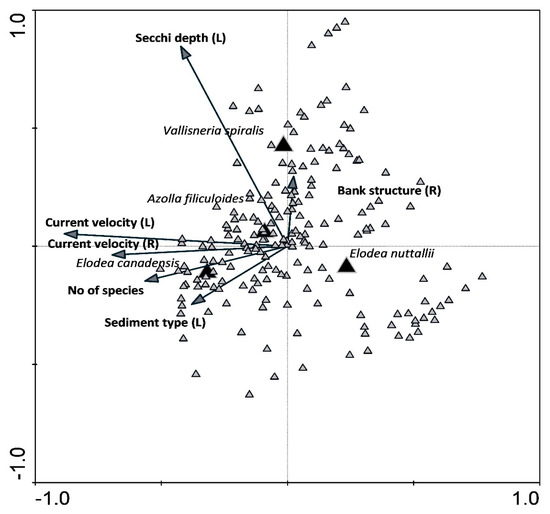
Figure 7.
Canonical correspondence analysis (CCA) plot showing the relation between neophyte species presence and abundance and significant environmental parameters and a total number of species in the stretch detected in neophyte species habitats.
4. Discussion
4.1. Species Distribution and Abundance
In large rivers, helophytes and free-floating taxa are found in the shallow parts near the banks, while the deeper parts with possible macrophyte growth are characterized by a reduced number of submerged spermatophytes, which are resistant to high current velocity [23]. We recorded only a few helophyte species; the only species with a high total abundance (about 5%) was P. arundinacea, which appeared along the whole river course. This was the case for the majority of species that have a total relative abundance of more than 1%. The exception was floating leaved T. natans, which was present in abundance after the confluence of the Sava River, where also the total species number and abundance were the highest. Dense T. natans stands can offer valuable habitats to invertebrates and fish and increase their biodiversity and production, while they may also cause hypoxic or even anoxic conditions [70]. Skliar and Skliar [71] report that the decrease of water level negatively affected the growth of T. natans and increased the number of representatives of Nymphaeaceae. Among abundant species, we also detected two other species with leaves floating on the water surface, one with natant leaves, namely P. natans and one pleustophyte S. polyrhiza, that were also more abundant in the lower part of the river. The position of leaves/fronds on the water surface enables successful competition for space and light due to efficient shading of other species [72], which was also evident in our study. Within the group of more abundant species (total abundance was ˃2%) were 7 species of the genus Potamogeton, altogether 10 species. The representatives of this widespread genus may thrive in a variety of habitats, from running to stagnant waters [73] with different water regimes and nutrient enrichment [74]. The species of this genus are usually subjected to interspecific hybridization [75]; however, no hybrids were found in this survey. The most abundant species detected in our survey was P. pectinatus that occurred along the whole river course. The survey of Case and Madsen [76] revealed that the distribution of this species was negatively affected by water depth, wave action and water transparency and positively by the ratio of silt in the sediment. This species occurs nearly worldwide at locations with water velocity <1 m/s and water depth <2.5 m [77]. This holds true for other species found in great abundance. CCA runs with abundant species only explained a relatively low share in their presence and abundance, revealing the importance of water transparency and current velocity. Current velocity is an important factor affecting macrophyte production in rivers, and even a moderate increase reduces their abundance [78]. Most of these species have a broad ecological valence and are widely distributed around Europe, showing no specific regionality [38,39,54]. Even more, some of them, like P. pectinatus and M. spicatum, also became an invasive nuisance weed in different parts of the world. When we used the whole list of species for RDA, a very low proportion of the variability was explained, even though the majority of environmental parameters were significant.
4.2. Neophytes in the Danube Main Channel
E. canadensis is the most widespread invasive alien aquatic plant in Europe, A. filiculoides the second, followed by V. spiralis and E. nuttallii [79]. E. canadensis and E. nuttallii are native to most of North America [80]. A. filiculoides are native to the Americas and spread widely around the world by a variety of mechanisms, of which man has become the most significant [79]. V. spiralis is native to southern Europe, northern Africa, the Middle East and southwest Asia [79]. According to Hérault et al. [81], E. canadensis and E. nuttallii share similar ecological niches and biological traits; however, in the present study, they thrived in different environmental conditions. The presence and abundance of both species were best correlated to vectors that indicated species number, current velocity and sediment type, however in the CCA plot, the species are positioned in opposite sides of vectors, E. nuttallii being related to species-poorer community, coarser sediment and lower current velocity, while E. canadensis was found in species-richer assemblages. In Slovenian watercourses, E. canadensis usually thrived in relatively species-rich communities, frequently together with the species P. natans, P. nodosus, P. perfoliatus, P. crispus and P. pectinatus and in the company of E. nuttallii [82]. The coexistence of both Elodea species was not detected in the Danube River. E. canadensis can be outcompeted by other more invasive species, especially in the case of nutrient enrichment [83,84]. This was also the case in Great Britain, where E. nuttallii substituted E. canadensis [85], and in France, where it was dominated by Egeria densa and E. nuttallii [86]. Barrat-Segretain and Lemoine [87] also report that E. nuttallii was more competitive than E. canadensis and also more palatable to herbivores. For both species, it was shown that they have allelopathic potential [88]. In addition, E. nuttallii also showed higher survival rates under the influence of artificial disturbances due to its high regeneration potential from vegetative fragments [89], and it is likely to become a successful alternative of E. canadensis [86]. A. filiculoides was found in low abundance in the lower course of the Danube. It thrives in eutrophic waters where it forms dense mats up to 10 cm thick [90,91]. It was shown that in favorable habitats, the representatives of the genus Azolla grow quickly with a doubling time of only 2–5 days [92]. Their competitive advantage is the symbiosis with the nitrogen-fixing cyanobacteria of the genus Anabaena that enable the fern’s high productivity [93]. In Poland, A. filiculoides occurred in different water habitats, where they substituted Lemna minor [91]. The same effect was confirmed by Paolacci et al. [94], where A. filiculoides exerted a negative influence on growth rates of L. minor and L. minuta. The fourth species in the EU neophyte list is V. spiralis. It is an obligate lowland macrophyte with an altitudinal range up to 300 m thriving in meso- to eutrophic aquatic habitats [95], as was the case in the Danube River. There it occurs mainly within the native range of distribution despite the report of Anačkov et al. [96], showing that in Serbia, V. spiralis occupied high-quality natural habitats along with some other alien species that show high potential for these habitats alternation.
4.3. The Distribution of Macrophyte Communities along the Course
Our study revealed that the distribution of macrophyte species and their communities reflect neither the river continuum concept described by Vannote et al. [9] nor a specific regionality as proposed by Illies [97] (see Figure 2, Figure 3 and Figure 6). Connell [98] showed that maximum species richness occurs under intermediate disturbance frequency and/or intensity (intermediate disturbance hypothesis) because only a few species tolerate either intense disturbance regime or habitats with little or no disturbances due to competitive exclusion [99]. Different parts of the Danube channel are subjected to different intensities of disturbance caused by large commercial navigation and also maintenance activities in the main channel [47], as well as higher current velocities at peak discharges. The most important effect is exerted by hydro-power plants [49]. According to the serial discontinuity concept, such barriers significantly alter habitat conditions and thus community structure, depending on dam position along the river continuum [11]. In addition, disturbances may also affect species presence and abundance directly by changing habitats or by disturbing longitudinal linkages within a river continuum preventing downstream transport of matter, including particulate organic carbon that is usually metabolized a considerable distance downstream from where it enters the stream [100]. According to Remmert [101] there is a significant relation between diversity of the environmental conditions and the number of species, while extreme conditions result in a lower number of species favoring those habitats with wider ecological range, as it is the case in our study.
However, we found a general pattern of low species richness and abundance of macrophytes (see Figure 3) as well as the presence of optimally developed plant-communities (see Figure 6) within the section between rkm 2400 at Kehlheim and rkm 1170 at Belgrade. The Danube River becomes navigable at rkm 2400 [47], which could be the reason for a general decrease in abundance of macrophyte abundance. Heavy traffic and frequent maintenance of the river channel cause habitat disturbances and decrease water transparency [49]. Within this over 1200 km long section of the Danube, only four plant-communities were found (see Table 1), namely Potametum pectinati, Potametum acutifolii, suboptimally, developed community with Potamogeton pectinatus. The far most frequent were the species-poorest and abundance lowest stretches where vegetation was too sparse to be classified into a certain vegetation type, habitats with different plant assemblages were found within the 628 km long Hungarian section [102]. All of these were species-poor and abundance-low, while average water transparency was also among the lowest (<70 cm). Other plant-communities occurred only sporadically within some of the stretches, which is negligible regarding the length of this section encompassing almost half of the Danube River. Specific for this section is the plant association with Zannichelia palustris, which was found only in the Čunovo Reservoir in Slovakia, although Z. palustris was recorded in numerous other stretches in this part of the Danube [102,103].
Upstream, within the headwater section reaching from the source to the beginning of the navigable river section, which is only 180 km long, we found 6 plant communities (Figure 6) despite its shortness and the fact that headwaters are mostly poorer in the number of macrophytes and their communities [9]. The possible reason could be the absence of disturbances influenced by ship traffic. It is also interesting that three of those plant communities were also found in the lowest section of the Danube, apart from the most poorly developed vegetation type.
On the downstream end of the longest section, we can notice a proliferation of macrophyte communities (Figure 6) as well as species richness and abundances (Figure 3). Conditions there change significantly due to various factors. The confluence with the river Sava brings water rich in calcium and other basic cations [104] since it drains the catchment, which predominantly consists of carbonate bedrock. Besides, the river Sava is also the tributary with the largest discharge [47]. Secondly, the metropolitan area of Belgrade city has no wastewater treatment plant and contributes a great number of nutrients to the Danube [18]. In addition, only 15 km downstream of Belgrade, the Danube reduces flow speed creating more “lentic” habitats since the huge impoundment of the Iron Gate I HPP already begins there. The mentioned factors create conditions with fewer disturbances and higher concentrations of calcium and other nutrients, which are much more favorable for the development of several macrophyte communities [105]. The dam of the Iron Gate II HPP prolongs these conditions further to rkm 843. Consequently, 12 different plant communities were recorded within this section, 5 of them exclusively here, e.g., Potametum natantis, Trapetum natantis, Potametum graminei, Lemno-Spirodeletum polyrhizae and Potamo-Ceratophylletum submersi. First two associations are characterized by floating-leaved dominant species, while the last two with pleustophytes, which explains their preference for lentic habitats.
The last section of the Danube is characterized by its lowest slope [14] but highest discharge [47]. In general, the conditions seem to also be favorable in this section since the plant species richness and abundances are considerably high (Figure 3); in some sections, they can reach the same values as in the previous section with impoundments. This is evident also in Figure 6, which displays the distribution of plant communities, and eight of them are found in this section of the Danube, the plant association Potametum crispi exclusively here. Several researchers connect the spreading of this association with the eutrophication of the water [67,106].
5. Conclusions
The Danube is far from being a natural river, but some free-running sections have reasonably low human interference. Still, the study on species distribution and abundance showed that the free-running sections of the river are poor in number and abundance of species, whereas impounded reaches mainly show the opposite result. According to the distribution of aquatic macrophytes and the communities, they are forming, four different sections of the Danube can be distinguished. However, we should be aware that the main reason driving this distribution pattern is human activities generating disturbances (navigation, hydropower-plants, pollution, etc.).
Author Contributions
Conceptualization, G.A.J., A.G., I.Z. and M.H.; methodology, G.A.J., N.E., A.G. and I.Z.; validation, G.A.J., N.E., G.A., V.B., Á.B., P.B., M.D., V.G., R.H., R.I., S.O., A.S., B.S., U.S.-M., W.S., K.S., E.S., J.T., S.T., M.V., V.V., D.V.; formal analysis, N.E., M.H., I.Z., and A.G.; investigation, G.A.J., N.E., G.A., V.B., Á.B., P.B., M.D., M.G., V.G., R.H., R.I., S.O., A.S., B.S., U.S.-M., W.S., K.S., E.S., J.T., S.T., M.V., V.V., D.V; data curation, N.E., M.H., A.G. and I.Z.; writing—original draft preparation, A.G., I.Z. and G.A.J.; writing—review and editing, A.G., I.Z., G.A.J., M.H. and R.H.; visualization, M.H., A.G. and I.Z.; supervision, G.A.J. and A.G.; project administration, G.A.J., N.E., A.G. and I.Z.; funding acquisition, G.A.J. All authors have read and agreed to the published version of the manuscript.
Funding
This research was part of the MIDCC Project supported by the Austrian Federal Ministry of Education, Sciences and Culture (Austria) and by the Austrian Committee of the International Association for the Danube Research (AC-IAD), Vienna. The financial supports of national foundations are also acknowledged: the Landesanstalt für Umweltschutz Baden-Württemberg and the Regierungspräsidium Tübingen, the Government of the Free State of Bavaria (Germany), Agency for Water Management, VERBUND Hydro Power AG (Austria), Grant Agency of the Slovak Academy of Sciences (Project No. 1/0004/11, Slovakia), Hungarian Scientific Research Grant—OTKA K106177 (Hungary), Ministry of Higher Education, Science and Technology—Research Program P1-0212, Biology of plants (Slovenia) and Ministry of Education, Science and Technological Development—project No III 43002 (Serbia).
Institutional Review Board Statement
Not applicable.
Informed Consent Statement
Not applicable.
Data Availability Statement
Data are stored within the documentation of outcomes of MIDCC project. Data are available on special request.
Conflicts of Interest
The authors declare no conflict of interest. The funders had no role in the design of the study, in the collection, analyses, or interpretation of data, in the writing of the manuscript, or in the decision to publish the results.
References
- Sommerwerk, N.; Hein, T.; Schneider-Jacoby, M.; Baumgartner, C.; Ostojić, A.; Siber, R.; Bloesch, J.; Paunović, M.; Tockner, K. The Danube River Basin. In Rivers of Europe; Elsevier: Amsterdam, The Netherlands, 2009; pp. 59–112. [Google Scholar]
- Lenhardt, M.; Smederevac-Lalić, M.; Hegediš, A.; Skorić, S.; Cvijanović, G.; Višnjić-Jeftić, Ž.; Djikanović, V.; Jovičić, K.; Jaćimović, M.; Jarić, I. Human Impacts on Fish Fauna in the Danube River in Serbia: Current Status and Ecological Implications. In Geobotany Studies; Springer: Berlin/Heidelberg, Germany, 2020; pp. 257–279. [Google Scholar]
- Haslam, S.M. The Historic River: Rovers and Cultures Down the Ages; Cobden of Cambridge Press: Cambridge, UK, 1999; p. 324. [Google Scholar]
- Winiwarter, V.; Schmid, M.; Hohensinner, S.; Haidvogl, G. The Environmental History of the Danube River Basin as an Issue of Long-Term Socio-ecological Research. In Long Term Socio-Ecological Research; Springer: Dordrecht, The Netherlands, 2013; pp. 103–122. [Google Scholar]
- Hynes, H.B.N. The Ecology of Running Waters; University of Toronto Press: Toronto, ON, Canada, 1970; p. 555. [Google Scholar]
- Odum, H.T. Trophic Structure and Productivity of Silver Springs, Florida. Ecol. Monogr. 1957, 27, 55–112. [Google Scholar] [CrossRef]
- Illies, J.; Botosaneanu, L. Problèmes et méthodes de la classification et de la zonation écologique des eaux courantes, considerées surtout du point de vue faunistique. Int. Ver. Theor. Angew. Limnol. Mitt. 1963, 12, 1–57. [Google Scholar] [CrossRef]
- Hawkes, H.A. River zonation and classification. In River Ecology; Whitton, B.A., Ed.; Blackwell Scientific Publishing: Oxford, UK, 1975; pp. 312–374. [Google Scholar]
- Vannote, R.L.; Minshall, G.W.; Cummins, K.W.; Sedell, J.R.; Cushing, C.E. The River Continuum Concept. Can. J. Fish. Aquat. Sci. 1980, 37, 130–137. [Google Scholar] [CrossRef]
- Ward, J.V.; Stanford, J. The serial discontinuity concept of lotic ecosystems. In Dynamics of Lotic Ecosystems; Fontane, T.D., Bartell, S.M., Eds.; Ann Arbor Scientific Publications: Ann Arbor, MI, USA, 1983; pp. 29–42. [Google Scholar]
- Ward, J.V.; Stanford, J.A. The serial discontinuity concept: Extending the model to floodplain rivers. Regul. Rivers Res. Manag. 1995, 10, 159–168. [Google Scholar] [CrossRef]
- Bornette, G.; Amoros, C.; Lamouroux, N. Aquatic plant diversity in riverine wetlands: The role of connectivity. Freshw. Biol. 1998, 39, 267–283. [Google Scholar] [CrossRef]
- Moog, O.; Sommerhäuser, M.; Robert, S.; Battisti, T.; Birk, S.; Hering, D.; Ofenböck, T.; Schmedtje, U.; Schmidt-Kloiber, A.; Vogel, B. Typology of the Danube River based on “top-down” and “bottom-up” approaches. In Proceedings of the Proceedings 36th International Conference of IAD. Austrian Committee DanubeResearch/IAD, Vienna, Austria, 4–8 September 2006; pp. 260–264. [Google Scholar]
- Laszloffy, W. Die Hydrographie der Donau. Der Fluss als Lebensraum. In Limnologie der Donau—Eine Monographische Darstellung, Kapitel II; Liepolt, R., Ed.; Schweizerbart: Stuttgart, Germany, 1965; pp. 16–57. [Google Scholar]
- Illies, J. Limnofauna Europaea: Eine Zusammenstellung aller die Europäischen Binnengewässer Bewohnenden Mehrzelligen Tierarten mit Angaben über ihre Verbreitung und Ökologie; Fischer: Stuttgart, Germany, 1978. [Google Scholar]
- Olson, K.R.; Krug, E. The Danube, an Empire Boundary River: Settlements, Invasions, Navigation, and Trade Pathway. J. Water Resour. Prot. 2020, 12, 884–897. [Google Scholar] [CrossRef]
- Stoica, C.; Camejo, J.; Banciu, A.; Nita-Lazar, M.; Paun, I.; Cristofor, S.; Pacheco, O.R.; Guevara, M. Water quality of Danube Delta systems: Ecological status and prediction using machine-learning algorithms. Water Sci. Technol. 2016, 73, 2413–2421. [Google Scholar] [CrossRef]
- Takić, L.; Mladenović-Ranisavljević, I.; Vasović, D.; Đorđević, L. The Assessment of the Danube River Water Pollution in Serbia. Water Air Soil Pollut. 2017, 228, 380. [Google Scholar] [CrossRef]
- Hein, T.; Funk, A.; Pletterbauer, F.; Graf, W.; Zsuffa, I.; Haidvogl, G.; Schinegger, R.; Weigelhofer, G. Management challenges related to long-term ecological impacts, complex stressor interactions, and different assessment approaches in the Danube River Basin. River Res. Appl. 2019, 35, 500–509. [Google Scholar] [CrossRef]
- Janauer, G.A.; Gaberščik, A.; Květ, J.; Germ, M.; Exler, N. Macrophytes of the River Danube Basin; Academia: Praha, Czech Republic, 2018; p. 408. ISBN 978-80-200-2743-6. [Google Scholar]
- Wilzbach, M.A.; Cummins, K.W. Rivers and Streams: Physical Setting and Adapted Biota. In Encyclopedia of Ecology; Elsevier: Amsterdam, The Netherlands, 2019; pp. 594–606. [Google Scholar]
- Neuhold, B.; Janauer, J.D.; Janauer, G.A. Within-weed bed architectural adaptation of branching pattern in Myriophyllum spicatum L. Acta Biol. Slov. 2018, 61, 55–63. [Google Scholar]
- Breugnot, E.; Dutartre, A.; Laplace-Treyture, C.; Haury, J. Local distribution of macrophytes and consequences for sampling methods in large rivers. Hydrobiologia 2008, 610, 13–23. [Google Scholar] [CrossRef]
- Baattrup-Pedersen, A.; Riis, T. Macrophyte diversity and composition in relation to substratum characteristics in regulated and unregulated Danish streams. Freshw. Biol. 1999, 42, 375–385. [Google Scholar] [CrossRef]
- Clarke, S.J. Vegetation growth in rivers: Influences upon sediment and nutrient dynamics. Prog. Phys. Geogr. Earth Environ. 2002, 26, 159–172. [Google Scholar] [CrossRef]
- Chambers, P.A.; Lacoul, P.; Murphy, K.J.; Thomaz, S.M. Global diversity of aquatic macrophytes in freshwater. Hydrobiologia 2008, 595, 9–26. [Google Scholar] [CrossRef]
- Preiner, S.; Dai, Y.; Pucher, M.; Reitsema, R.E.; Schoelynck, J.; Meire, P.; Hein, T. Effects of macrophytes on ecosystem metabolism and net nutrient uptake in a groundwater fed lowland river. Sci. Total Environ. 2020, 721, 137620. [Google Scholar] [CrossRef]
- Gibbs, H.; Gurnell, A.; Heppell, K.; Spencer, K. Macrophytes: Ecosystem engineers in UK urban rivers. Geophys. Res. Abstr. 2012, 14, 490. [Google Scholar]
- Sand-Jensen, K. Macrophytes as biological engineers in the ecology of Danish streams. In Freshwater Biology. Priorities and Development in Danish Research; Gad: København, Denmark, 1997; pp. 74–101. [Google Scholar]
- Rolland, D.C.; Haury, J.; Marmonier, P.; Lagadeuc, Y. Effect of Macrophytes on Flow Conditions and Deposition of Suspended Particles in Small Streams: An Experimental Study Using Artificial Vegetation. Rev. Sci. l’eau/J. Water Sci. 2015, 28, 231–245. [Google Scholar] [CrossRef]
- Mechora, Š.; Germ, M.; Stibilj, V. Selenium compounds in selenium-enriched cabbage. Pure Appl. Chem. 2012, 84, 259–268. [Google Scholar] [CrossRef]
- Rejmankova, E. The role of macrophytes in wetland ecosystems. J. Ecol. Environ. 2011, 34, 333–345. [Google Scholar] [CrossRef]
- Bornette, G.; Amoros, C.; Chessel, D. Effect of allogenic processes on successional rates in former river channels. J. Veg. Sci. 1994, 5, 237–246. [Google Scholar] [CrossRef]
- Šraj-Kržič, N.; Germ, M.; Urbanc-Berčič, O.; Kuhar, U.; Janauer, G.A.; Gaberščik, A. The quality of the aquatic environment and macrophytes of karstic watercourses. Plant Ecol. 2007, 192, 107–118. [Google Scholar] [CrossRef]
- Jusik, S.; Szoszkiewicz, K.; Kupiec, J.M.; Lewin, I.; Samecka-Cymerman, A. Development of comprehensive river typology based on macrophytes in the mountain-lowland gradient of different Central European ecoregions. Hydrobiologia 2015, 745, 241–262. [Google Scholar] [CrossRef]
- Graham, S.E.; O’Brien, J.M.; Burrell, T.K.; McIntosh, A.R. Aquatic macrophytes alter productivity-richness relationships in eutrophic stream food webs. Ecosphere 2015, 6, 1–18. [Google Scholar] [CrossRef]
- Pip, E. Water temperature and freshwater macrophyte distribution. Aquat. Bot. 1989, 34, 367–373. [Google Scholar] [CrossRef]
- Haslam, S.M. River plants of Western Europe: The Macrophytic Vegetation of Watercourses of the European Economic Community; Cambridge University Press: Cambridge, UK, 1987; p. 512. [Google Scholar]
- Haslam, S.M. River Plants: The Macrophytic Vegetation of Watercourses; Forrest Text: Ceredigion, UK, 2006; p. 450. [Google Scholar]
- Kuhar, U.; Germ, M.; Gaberščik, A.; Urbanič, G. Development of a River Macrophyte Index (RMI) for assessing river ecological status. Limnologica 2011, 41, 235–243. [Google Scholar] [CrossRef]
- Mechora, Š.; Germ, M.; Stibilj, V. Monitoring of selenium in macrophytes—The case of Slovenia. Chemosphere 2014, 111, 464–470. [Google Scholar] [CrossRef]
- Kohler, A.; Schneider, S. Macrophytes as bioindicators. River Syst. 2003, 14, 17–31. [Google Scholar] [CrossRef]
- Kuhar, U.; Germ, M.; Gaberščik, A. Macrophytes of watercourses in the Slovenian Danube Basin. In Macrophytes of Watercourses in the Slovenian Danube Basin; Academia: Praha, Czech Republic, 2018; pp. 234–251. [Google Scholar]
- Kuhar, U.; Gregorc, T.; Renčelj, M.; Šraj-Kržič, N.; Gaberščik, A. Distribution of macrophytes and condition of the physical environment of streams flowing through agricultural landscape in north-eastern Slovenia. Limnologica 2007, 37, 146–154. [Google Scholar] [CrossRef]
- Demars, B.O.L.; Edwards, A.C. Distribution of aquatic macrophytes in contrasting river systems: A critique of compositional-based assessment of water quality. Sci. Total Environ. 2009, 407, 975–990. [Google Scholar] [CrossRef]
- Sedell, J.R.; Richey, J.E.; Swanson, F.J. The river continuum concept: A basis for the expected ecosystem behavior of very large rivers? In Proceedings of the International Large River Symposium, Honey Harbour, ON, Canada, 14–19 September 1986. [Google Scholar]
- Hasenbichler, H.-P. Manual on Danube Navigation; Thomas, H., Vera, H., Eds.; via donau–Österreichische Wasserstraßen-Gesellschaft mbH: Vienna, Austria, 2013; p. 218. [Google Scholar]
- Vukov, D.; Ilic, M.; Cuk, M.; Igic, R.; Janauer, G. The relationship between habitat factors and aquatic macrophyte assemblages in the Danube river in Serbia. Arch. Biol. Sci. 2017, 69, 427–437. [Google Scholar] [CrossRef]
- Fuller, M.R.; Doyle, M.W.; Strayer, D.L. Causes and consequences of habitat fragmentation in river networks. Ann. N. Y. Acad. Sci. 2015, 1355, 31–51. [Google Scholar] [CrossRef]
- ISTER. Donau-Stromkilometer-Stromauf-Stromab.pdf. Available online: http://www.ister.at/Ister1/wp-content/uploads/2019/06 (accessed on 8 January 2021).
- HPP-Bavaria. Available online: http://www.bew-augsburg.de/CBP/Wasserkraft/Daten/ODK.asp (accessed on 7 January 2021).
- Danube Commission. List of Locks. Available online: https://de.wikipedia.org/wiki/Liste_der_Schleusen_in_der_Donau (accessed on 7 January 2021).
- Kohler, A.; Janauer, G.A. Zur Methodik der Untersuchung von aquatischen Makrophyten in Fließgewässern. Handb. Angew. Limnol. Ecomed-Verlag 1995, VIII, 1–22. [Google Scholar] [CrossRef]
- Atlas Florae Europaeae (AFE)—Distribution of Vascular Plants in Europe. Available online: https://www.luomus.fi/en/atlas-florae-europaeae-afe-distribution-vascular-plants-europe (accessed on 23 December 2020).
- Corine Land Cover. Copernicus Land Monitoring Service—High Resolution Layer Water and Wetness; European Environment Agency: Copenhagen, Denmark, 2018; Available online: http://land.copernicus.eu (accessed on 22 December 2020).
- Schaumburg, J.; Schranz, C.; Foerster, J.; Gutowski, A.; Hofmann, G.; Meilinger, P.; Schneider, S.; Schmedtje, U. Ecological classification of macrophytes and phytobenthos for rivers in Germany according to the Water Framework Directive. Limnologica 2004, 34, 283–301. [Google Scholar] [CrossRef]
- Braun-Blanquet, J. Pflanzensoziologie, Grundzüge der Vegetationskunde, 3rd ed.; Springer: Berlin/Heidelberg, Germany, 1964; p. 631. [Google Scholar]
- Lukács, B.A.; Tóthmérész, B.; Borics, G.; Várbíró, G.; Juhász, P.; Kiss, B.; Müller, Z.; G-Tóth, L.; Eros, T. Macrophyte diversity of lakes in the Pannon Ecoregion (Hungary). Limnologica 2015, 53, 74–83. [Google Scholar] [CrossRef]
- Pall, K.; Gecheva, G.; Soaru-Minea, A.; Lukacs, B.S.P. Intercalibration of the National Classifications of Ecological Status for Eastern Continental Lakes; Publications Office of the European Union: Luxembourg, 2018; p. 81. [Google Scholar]
- Hammer, Ø.; Harper, D.A.T.; Ryan, P.D. PAST: Paleontological Statistics Software Package for Education and Data Analysis. Palaeontol. Electron. 2001, 4, 1–9. [Google Scholar]
- Murtagh, F.; Legendre, P. Ward’s Hierarchical Agglomerative Clustering Method: Which Algorithms Implement Ward’s Criterion? J. Classif. 2014, 31, 274–295. [Google Scholar] [CrossRef]
- Swaine, M.D.; Adomako, J.; Ameka, G.; de Graft-Johnston, K.A.A.; Cheek, M. Forest river plants and water quality in Ghana. Aquat. Bot. 2006, 85, 299–308. [Google Scholar] [CrossRef]
- Wiegleb, G.; Bröring, U.; Filetti, M.; Brux, H.; Herr, W. Long-term dynamics of macrophyte dominance and growth-form types in two north-west German lowland streams. Freshw. Biol. 2014, 59, 1012–1025. [Google Scholar] [CrossRef]
- Zelnik, I. Vegetation of the Meadows from the Order Molinietalia W. Koch 1926 and Contact Sites in Slovenia. Ph.D. Thesis, University of Ljubljana (Slovenia), Ljubljana, Slovenia, 2005; p. 196. [Google Scholar]
- Hrivnák, R.; Bubíková, K.; Oťaheľová, H.; Šumberová, K. Formalised classification of aquatic vegetation in Slovakia. Phytocoenologia 2019, 49, 107–133. [Google Scholar] [CrossRef]
- Landucci, F.; Tichý, L.; Šumberová, K.; Chytrý, M. Formalized classification of species-poor vegetation: A proposal of a consistent protocol for aquatic vegetation. J. Veg. Sci. 2015, 26, 791–803. [Google Scholar] [CrossRef]
- Chytrý, M. Vegetation of the Czech Republic 3. Aquatic and wetland vegetation; Academia: Praha, Czech Republic, 2011; p. 828. [Google Scholar]
- Ter Braak, C.J.F.; Šmilauer, P. CANOCO Reference Manual and CanoDraw for Windows User’s Guide: Software for Canonical Community Ordination (Version 4.5); www.canoco.com: Ithaca, NY, USA, 2002. [Google Scholar]
- Hudon, C.; Gagnon, P.; Amyot, J.P.; Létourneau, G.; Jean, M.; Plante, C.; Rioux, D.; Deschênes, M. Historical changes in herbaceous wetland distribution induced by hydrological conditions in Lake Saint-Pierre (St. Lawrence River, Quebec, Canada). In Proceedings of the Hydrobiologia; Springer: Berlin/Heidelberg, Germany, 2005; Volume 539, pp. 205–224. [Google Scholar]
- Kornijów, R.; Strayer, D.L.; Caraco, N.F. Macroinvertebrate communities of hypoxic habitats created by an invasive plant (Trapa natans) in the freshwater tidal Hudson River. Fundam. Appl. Limnol. 2010, 176, 199–207. [Google Scholar] [CrossRef]
- Skliar, I.L.; Skliar, V.H. Trapa natans L. s.l. growth features in Desna River basin. Ukr. J. Ecol. 2017, 7, 239–245. [Google Scholar] [CrossRef]
- Wetzel, R.G. Land–water interfaces: Larger plants. In Limnology; Elsevier: Amsterdam, The Netherlands, 2001; pp. 527–575. [Google Scholar]
- Preston, C. Pondweeds of Great Britain and Ireland; Botanical Society of the British Isles: London, UK, 1995; p. 352. [Google Scholar]
- Germ, M.; Kuhar, U.; Gaberščik, A. Abundance and Diversity of Taxa Within the Genus Potamogeton in Slovenian Watercourses. In Natural and Constructed Wetlands; Vymazal, J., Ed.; Springer International Publishing: Cham, Switzerland, 2016; pp. 283–291. [Google Scholar]
- Kaplan, Z.; Jarolímová, V.; Fehrer, J. Revision of Chromosome Numbers of Potamogetonaceae: A New Basis for Taxonomic and Evolutionary Implications. Preslia 2013, 85, 421–482. [Google Scholar]
- Case, M.L.; Madsen, J.D. Factors limiting the growth of Stuckenia pectinata (sago pondweed) in heron lake, minnesota. J. Freshw. Ecol. 2004, 19, 17–23. [Google Scholar] [CrossRef]
- Kantrud, H.A. Sago Pondweed (Potamogeton pectinatus L.): A Literature Review; U.S. Fish and Wildlife Service: Washington, DC, USA, 1990; p. 89. [Google Scholar]
- Chambers, P.A.; Prepas, E.E.; Hamilton, H.R.; Bothwell, M.L. Current Velocity and Its Effect on Aquatic Macrophytes in Flowing Waters. Ecol. Appl. 1991, 1, 249–257. [Google Scholar] [CrossRef] [PubMed]
- Hussner, A. Alien aquatic plant species in European countries. Weed Res. 2012, 52, 297–306. [Google Scholar] [CrossRef]
- Zehnsdorf, A.; Hussner, A.; Eismann, F.; Rönicke, H.; Melzer, A. Management options of invasive Elodea nuttallii and Elodea canadensis. Limnologica 2015, 51, 110–117. [Google Scholar] [CrossRef]
- Hérault, B.; Bornet, A.; Trémolières, M. Redundancy and niche differentiation among the European invasive Elodea species. Biol. Invasions 2008, 10, 1099–1107. [Google Scholar] [CrossRef]
- Kuhar, U.; Germ, M.; Gaberščik, A. Habitat characteristics of an alien species Elodea canadensis in Slovenian watercourses. Hydrobiologia 2010, 656, 205–212. [Google Scholar] [CrossRef]
- Thiébaut, G. Does competition for phosphate supply explain the invasion pattern of Elodea species? Water Res. 2005, 39, 3385–3393. [Google Scholar] [CrossRef] [PubMed]
- Grudnik, Z.M.; Jelenko, I.; Germ, M. Influence of abiotic factors on invasive behaviour of alien species Elodea nuttallii in the Drava River (Slovenia). Ann. Limnol. Int. J. Limnol. 2014, 50, 1–8. [Google Scholar] [CrossRef]
- Simpson, D.A. Displacement of Elodea canadensis Michx by Elodea nuttallii (Planch.) H. St John in the British Isles. Watsonia 1990, 18, 173–177. [Google Scholar]
- Thiébaut, G. Invasion success of non-indigenous aquatic and semi-aquatic plants in their native and introduced ranges. A comparison between their invasiveness in North America and in France. Biol. Invasions 2006, 9, 1–12. [Google Scholar] [CrossRef]
- Barrat-Segretain, M.H.; Lemoine, D.G. Can snail herbivory influence the outcome of competition between Elodea species? Aquat. Bot. 2007, 86, 157–162. [Google Scholar] [CrossRef]
- Erhard, D.; Gross, E.M. Allelopathic activity of Elodea canadensis and Elodea nuttallii against epiphytes and phytoplankton. Aquat. Bot. 2006, 85, 203–211. [Google Scholar] [CrossRef]
- Barrat-Segretain, M.H.; Cellot, B. Response of invasive macrophyte species to drawdown: The case of Elodea sp. Aquat. Bot. 2007, 87, 255–261. [Google Scholar] [CrossRef]
- Lumpkin, T.A.; Plucknett, D.L. Azolla: Botany, physiology, and use as a green manure. Econ. Bot. 1980, 34, 111–153. [Google Scholar] [CrossRef]
- Szczęśniak, E.; Błachuta, J.; Krukowski, M.; Picińska-Fałtynowicz, J. Distribution of Azolla filiculoides Lam. (Azollaceae) in Poland. Acta Soc. Bot. Pol. 2011, 78, 241–246. [Google Scholar] [CrossRef]
- Sabetraftar, K.; Zarkami, R.; Sadeghi, R.; Van Damme, P. A review of some ecological factors affecting the growth of Azolla spp. Casp. J. Environ. Sci. 2013, 11, 65–76. [Google Scholar]
- Wagner, G.M. Azolla: A Review of Its Biology and Utilization. Bot. Rev. 1997, 63, 1–26. [Google Scholar] [CrossRef]
- Paolacci, S.; Jansen, M.A.K.; Harrison, S. Competition Between Lemna minuta, Lemna minor, and Azolla filiculoides. Growing Fast or Being Steadfast? Front. Chem. 2018, 6, 207. [Google Scholar] [CrossRef] [PubMed]
- Bolpagni, R.; Laini, A.; Soana, E.; Tomaselli, M.; Nascimbene, J. Growth performance of Vallisneria spiralis under oligotrophic conditions supports its potential invasiveness in mid-elevation freshwaters. Weed Res. 2015, 55, 185–194. [Google Scholar] [CrossRef]
- Anačkov, G.T.; Rat, M.M.; Radak, B.D.; Igić, R.S.; Vukov, D.M.; Rućando, M.M.; Krstivojević, M.M.; Radulović, S.B.; Cvijanović, D.L.; Milić, D.M.; et al. Alien invasive neophytes of the Southeastern part of the Pannonian Plain. Cent. Eur. J. Biol. 2013, 8, 1032–1043. [Google Scholar] [CrossRef]
- Illies, J. Versuch einer allgemeinen biozönotischen Gliederung der Fließgewässer. Int. Rev. Gesamten Hydrobiol. Hydrogr. 1961, 46, 205–213. [Google Scholar] [CrossRef]
- Connell, J.H. Diversity in Tropical Rain Forests and Coral Reefs. Science 1978, 199, 1302–1310. [Google Scholar] [CrossRef] [PubMed]
- Grime, J.P. Competitive Exclusion in Herbaceous Vegetation. Nature 1973, 242, 344–347. [Google Scholar] [CrossRef]
- Webster, J.R. Spiraling down the river continuum: Stream ecology and the U-shaped curve. J. N. Am. Benthol. Soc. 2007, 26, 375–389. [Google Scholar] [CrossRef]
- The Mosaic-Cycle Concept of Ecosystems; Remmert, H., Ed.; Ecological Studies; Springer: Berlin/Heidelberg, Germany, 1991; Volume 85, p. 168. [Google Scholar]
- Engloner, A.; Szalma, E.; Sipos, K.; Dinka, M. Occurrence and habitat preference of aquatic macrophytes in a large river channel. Community Ecol. 2013, 14, 243–248. [Google Scholar] [CrossRef]
- Oťaheľová, H.; Valachovic˘, M.; Hrivnák, R. The impact of environmental factors on the distribution pattern of aquatic plants along the Danube River corridor (Slovakia). Limnologica 2007, 37, 290–302. [Google Scholar] [CrossRef]
- Markovics, R.; Kanduč, T.; Szramek, K.; Golobočanin, D.; Milačič, R.; Ogrinc, N. Chemical dynamics of the Sava riverine system—A stable isotopic approach. J. Environ. Monit. 2010, 12, 2165–2176. [Google Scholar] [CrossRef] [PubMed]
- Chmara, R.; Banaś, K.; Szmeja, J. Changes in the structural and functional diversity of macrophyte communities along an acidity gradient in softwater lakes. Flora-Morphol. Distrib. Funct. Ecol. Plants 2015, 216, 57–64. [Google Scholar] [CrossRef]
- Riis, T.; Sand-Jensen, K. Historical changes in species composition and richness accompanying perturbation and eutrophication of Danish lowland streams over 100 years. Freshw. Biol. 2001, 46, 269–280. [Google Scholar] [CrossRef]


Publisher’s Note: MDPI stays neutral with regard to jurisdictional claims in published maps and institutional affiliations. |
© 2021 by the authors. Licensee MDPI, Basel, Switzerland. This article is an open access article distributed under the terms and conditions of the Creative Commons Attribution (CC BY) license (http://creativecommons.org/licenses/by/4.0/).