Spatiotemporal Characteristics and Influencing Factors of Tourism Revenue in the Yangtze River Delta Urban Agglomeration Region during 2001–2019
Abstract
1. Introduction
2. Materials and Methods
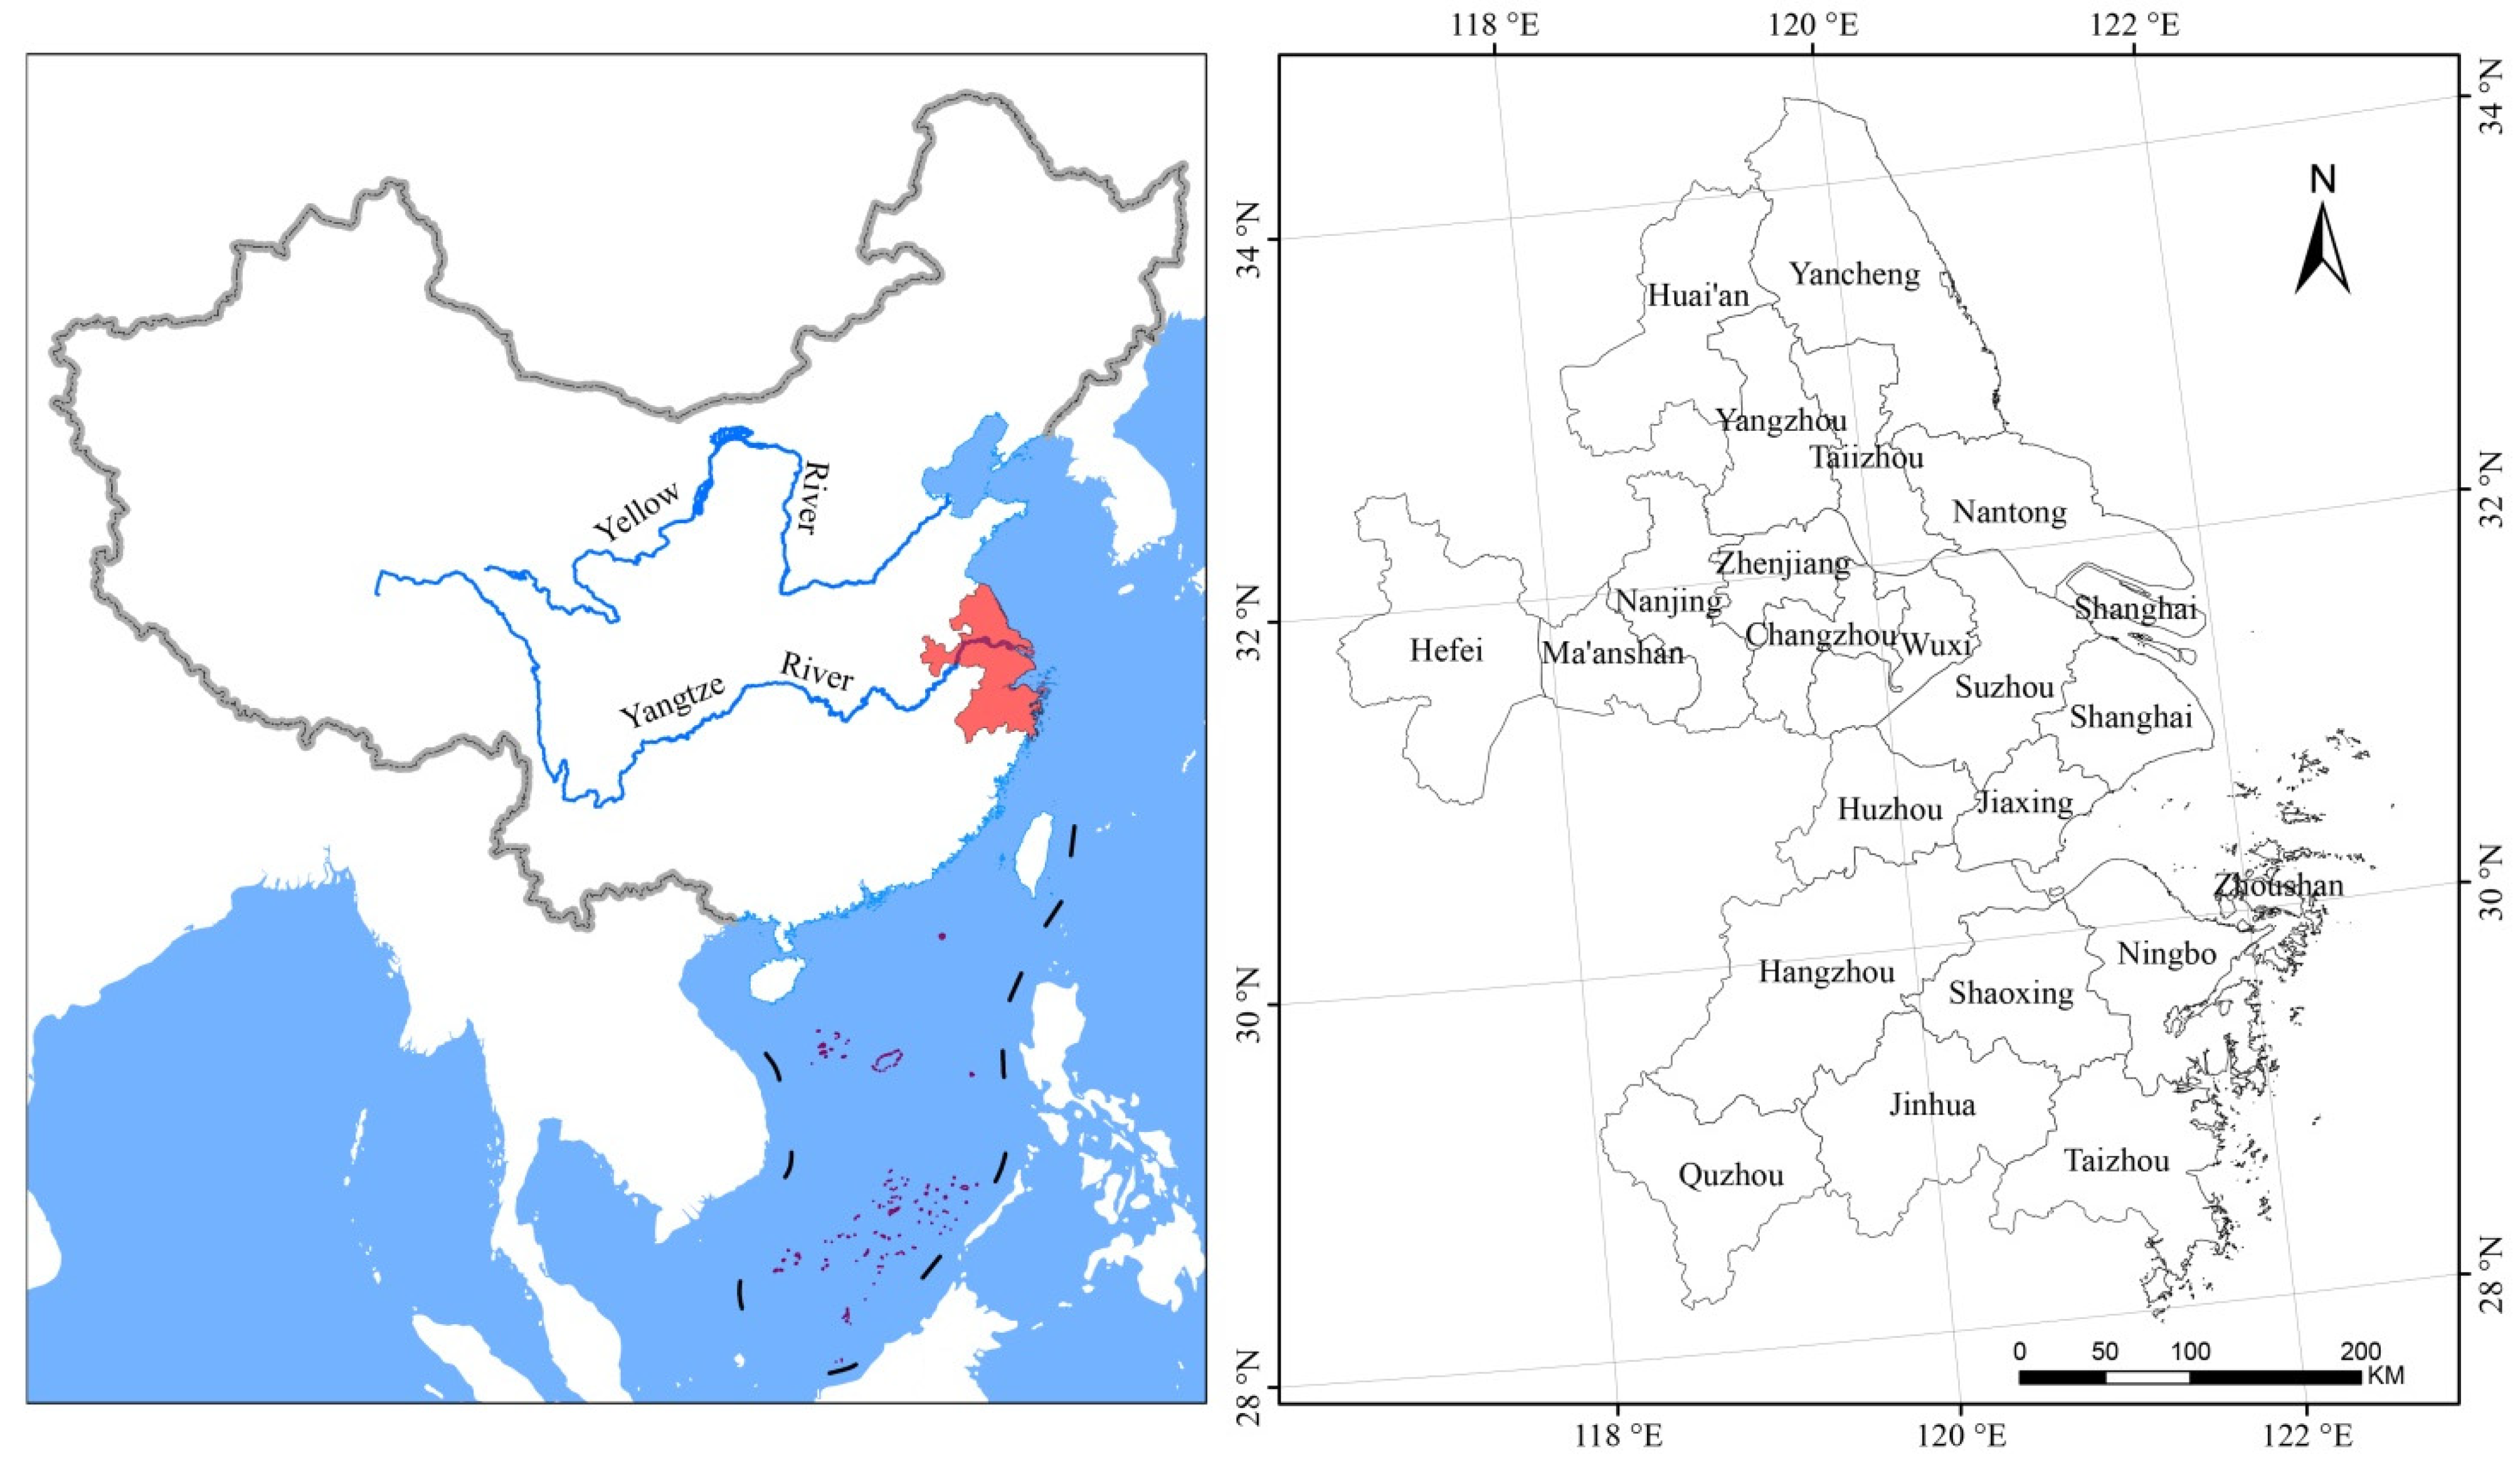
2.1. Study Area
2.2. Data Sources
2.2.1. Data for Tourism Scenic Spots
2.2.2. Tourism Revenue and Related Data
2.2.3. Establishments of Regression Models between Tourism Revenue and Socioeconomic Factors
2.3. Statistical Analysis
3. Results
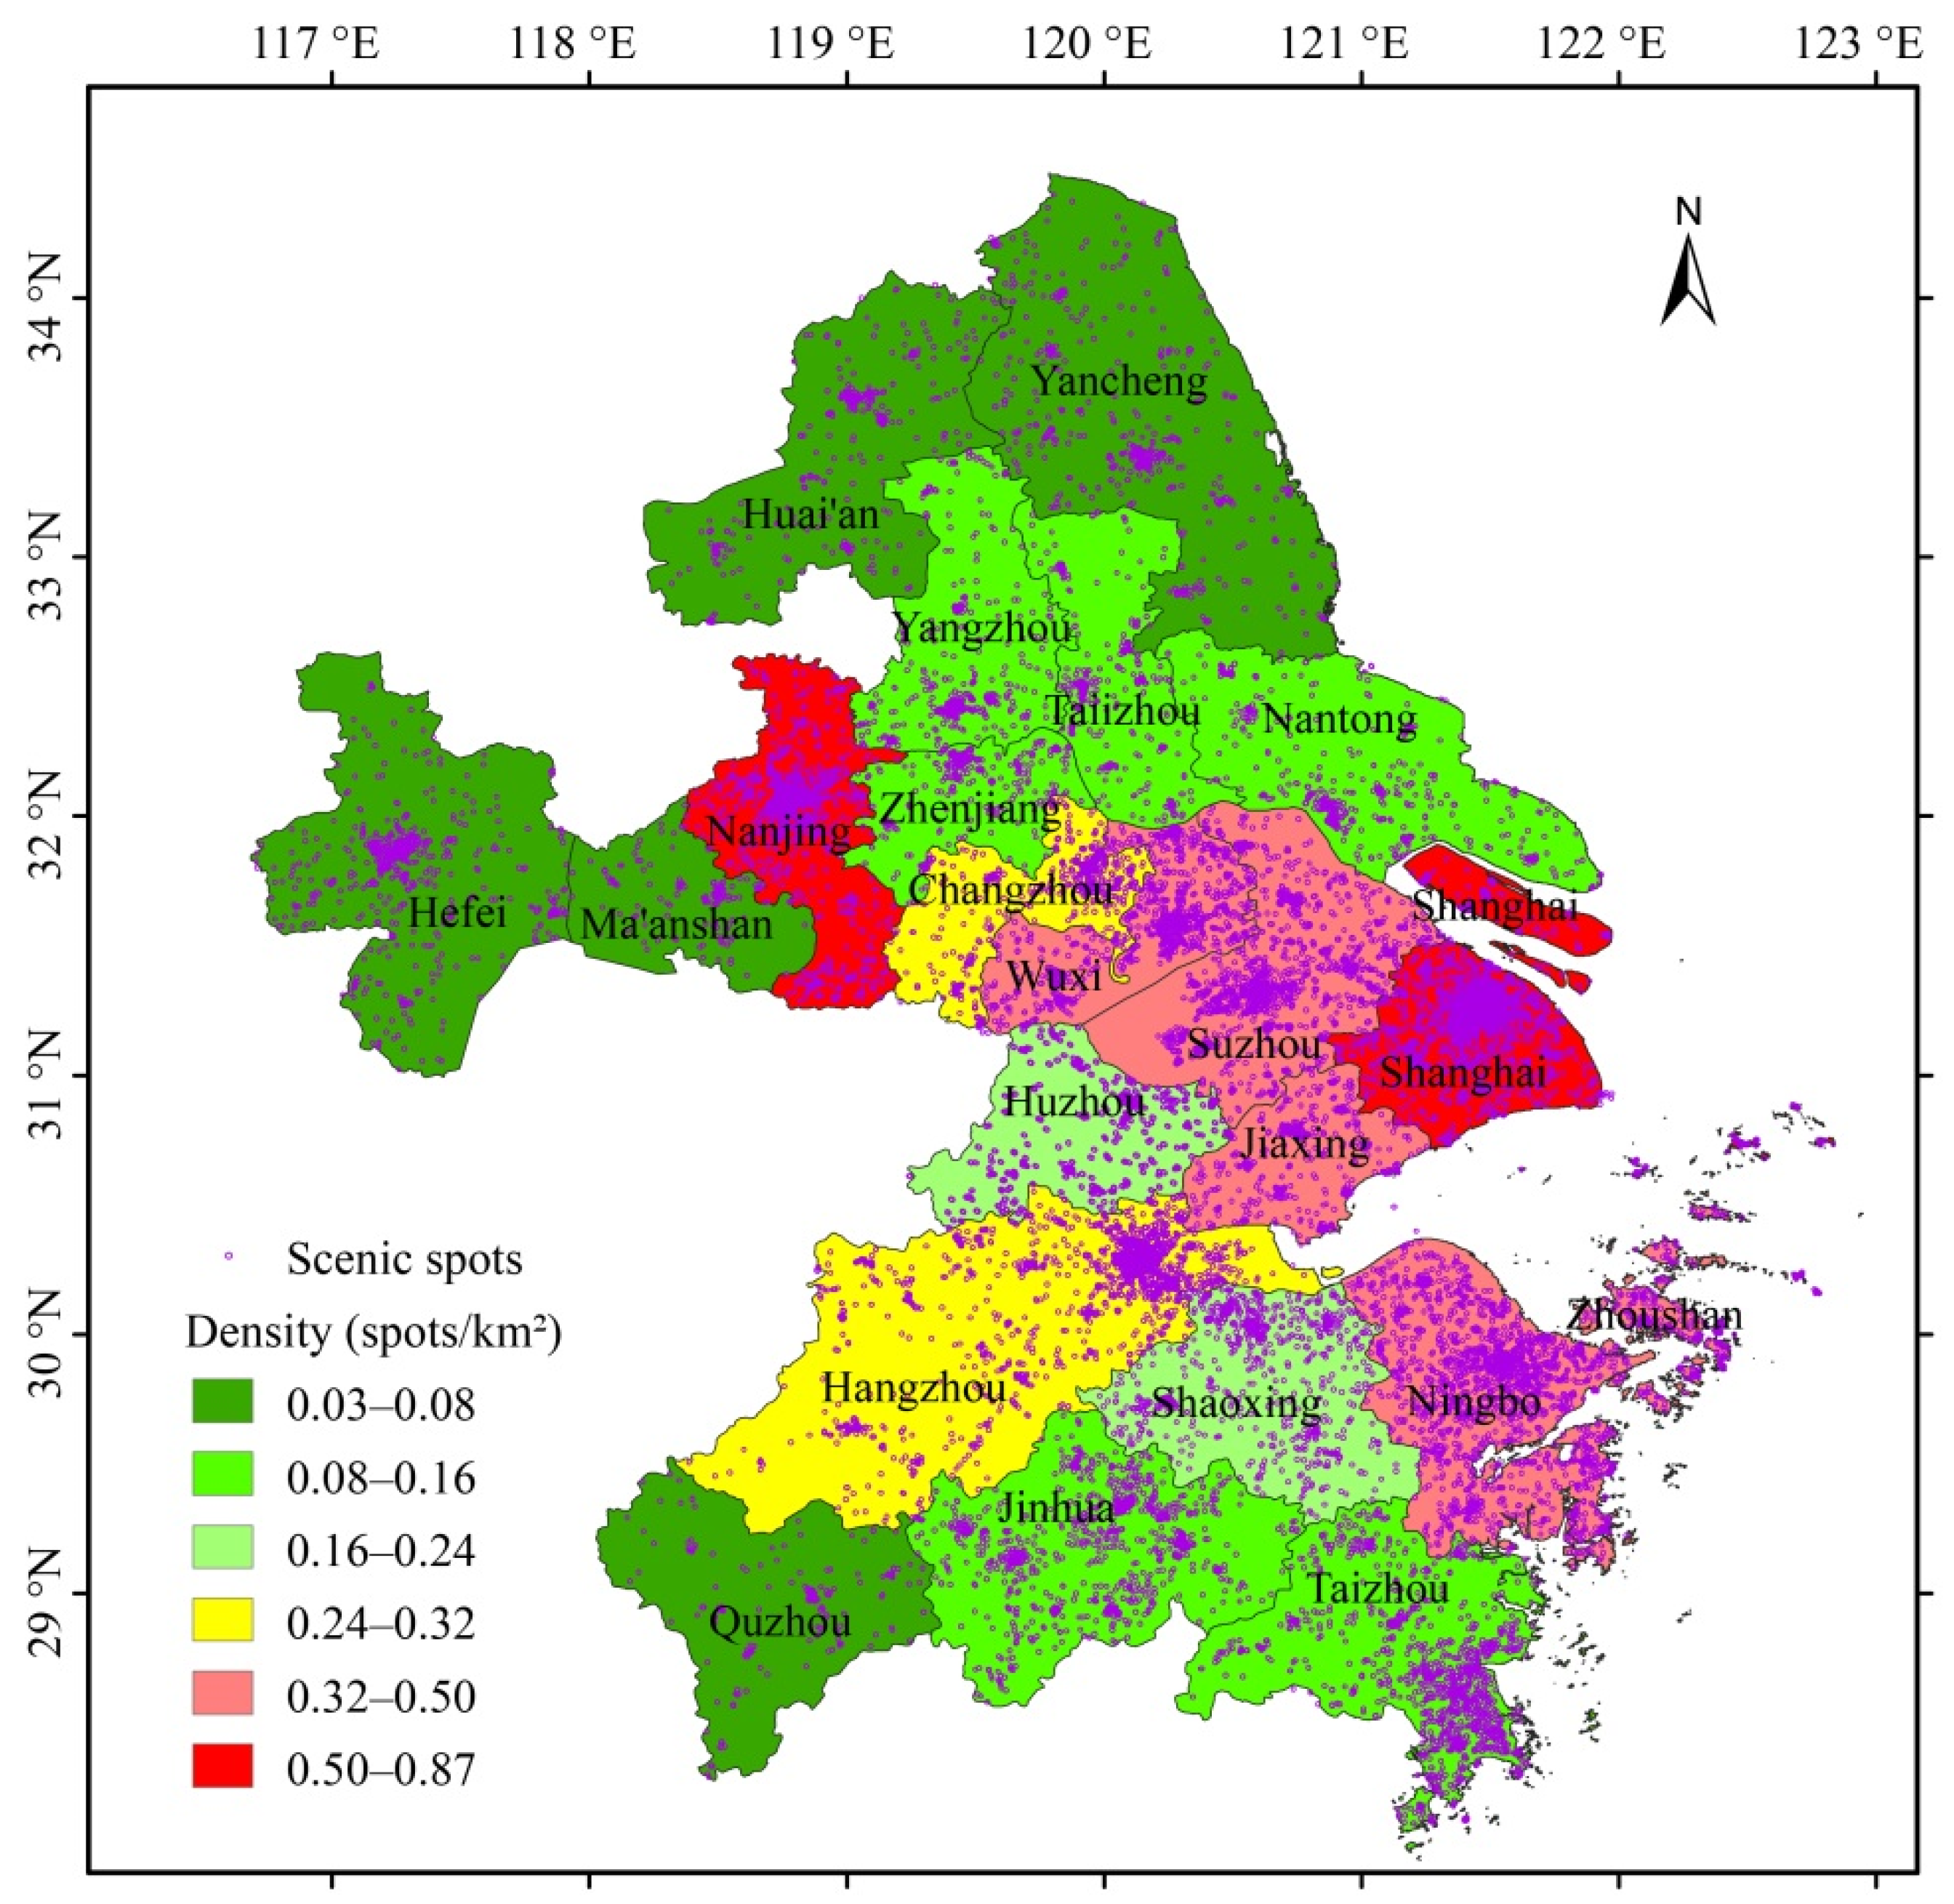
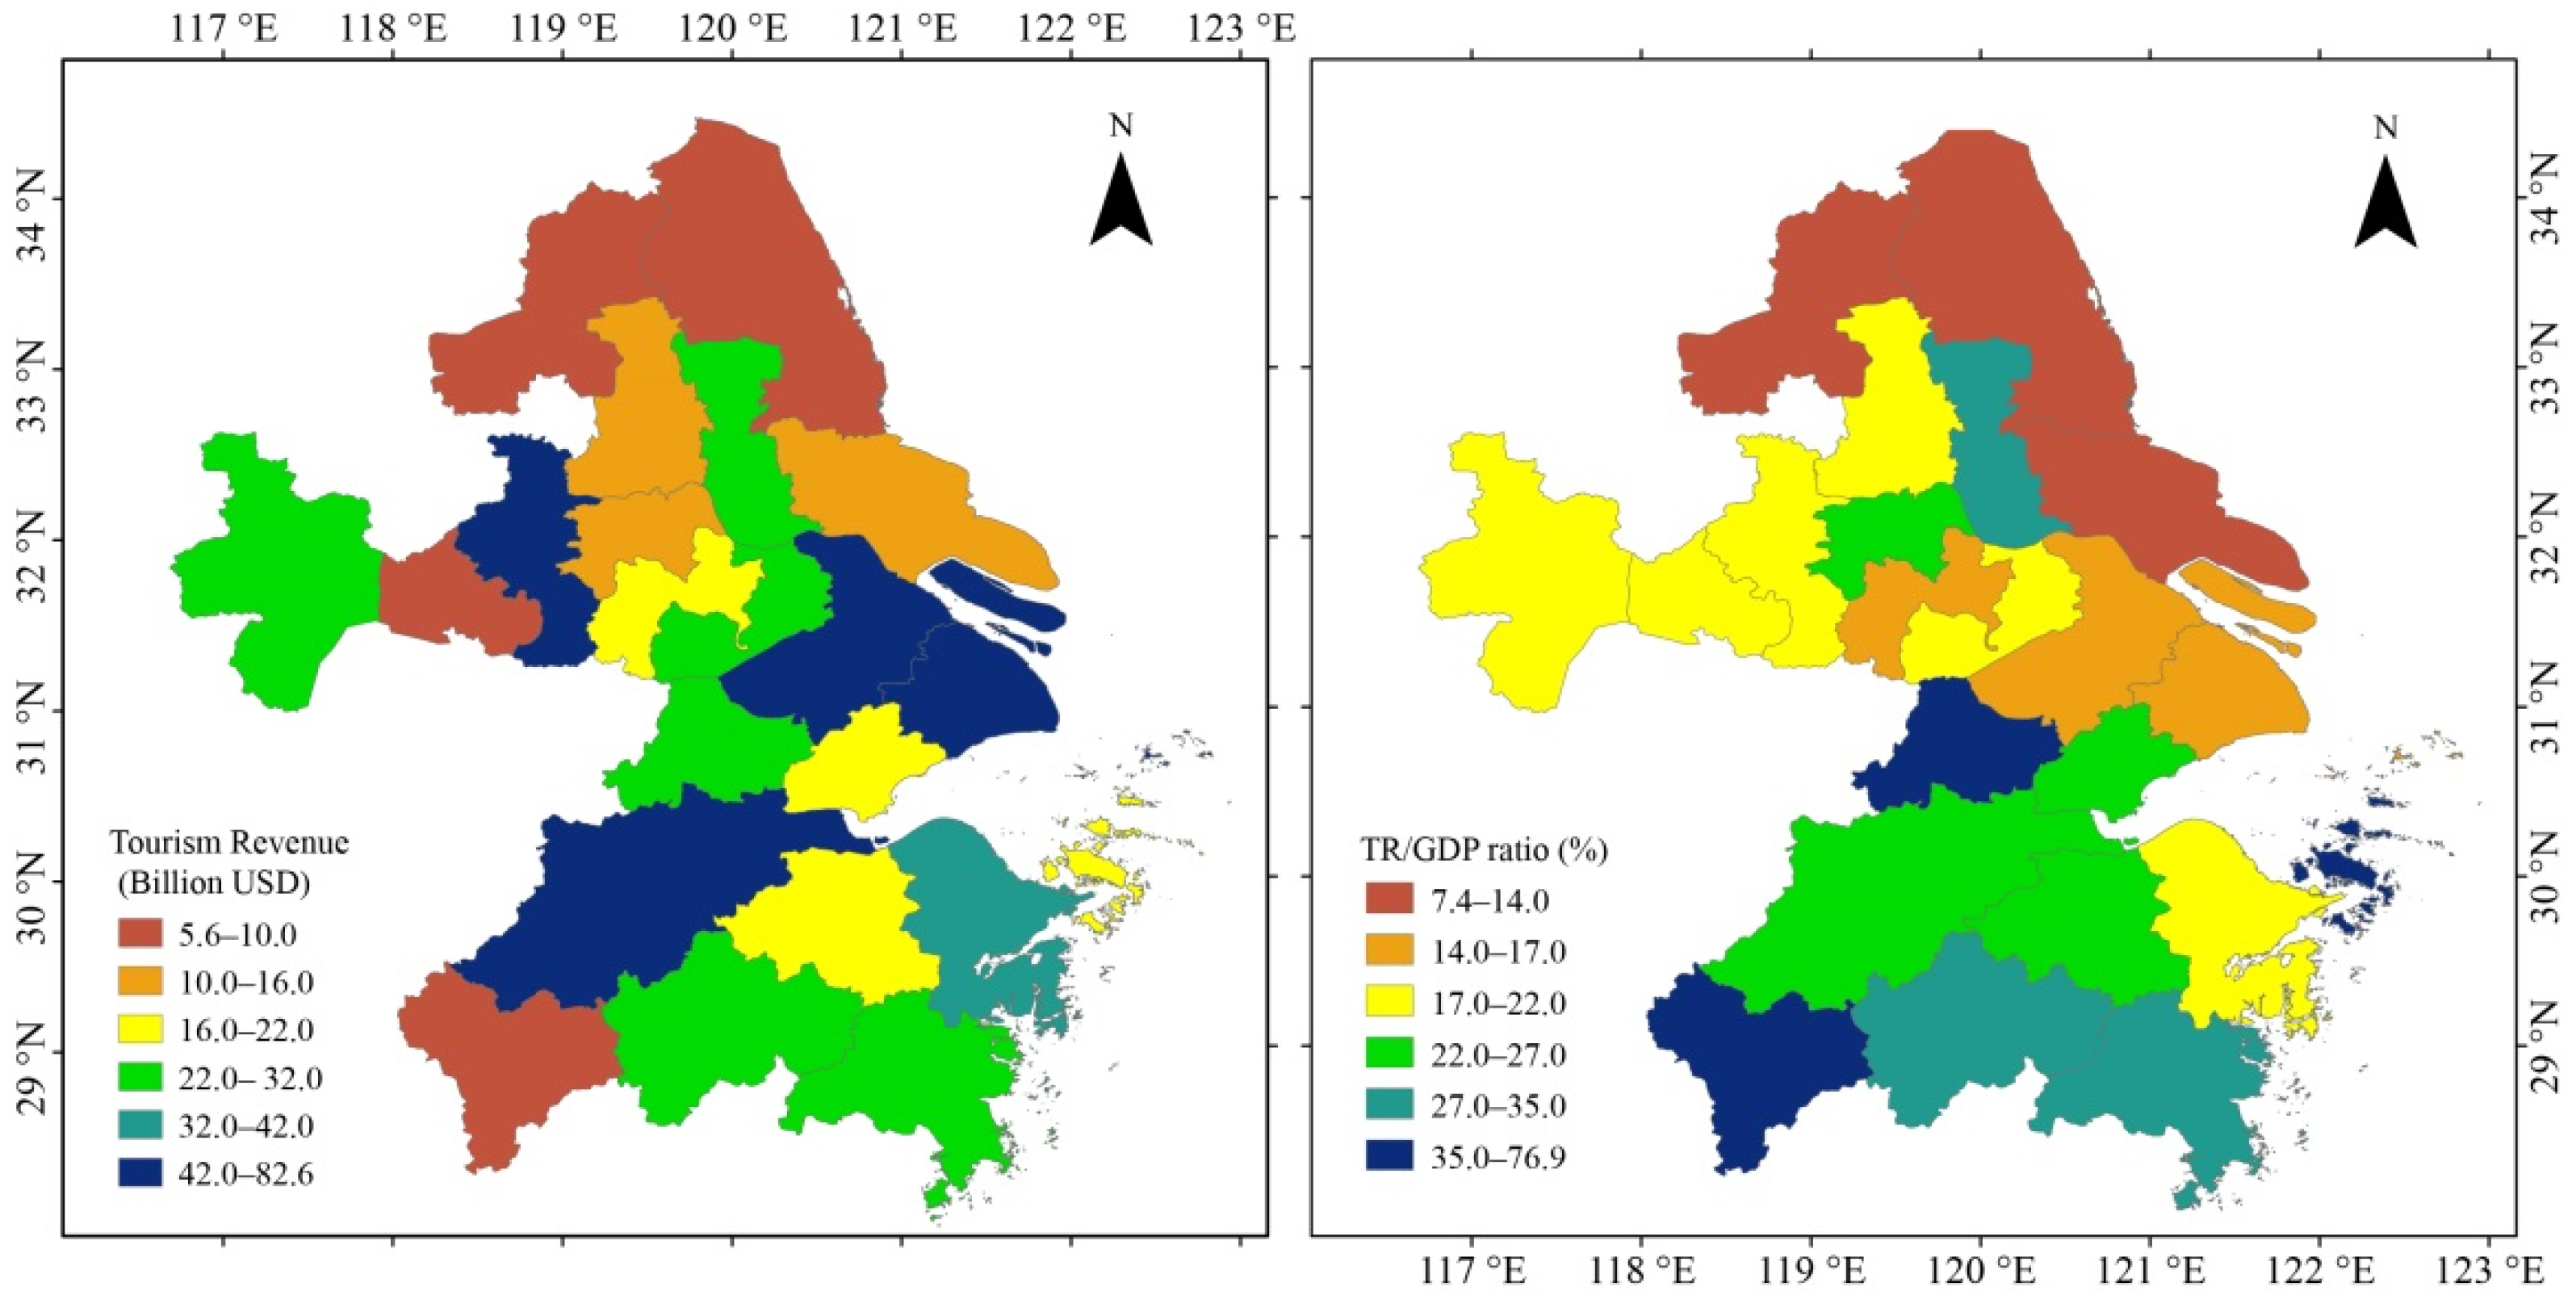
3.1. Contemporary Tourism Scenic Spots and Tourism Revenue Patterns
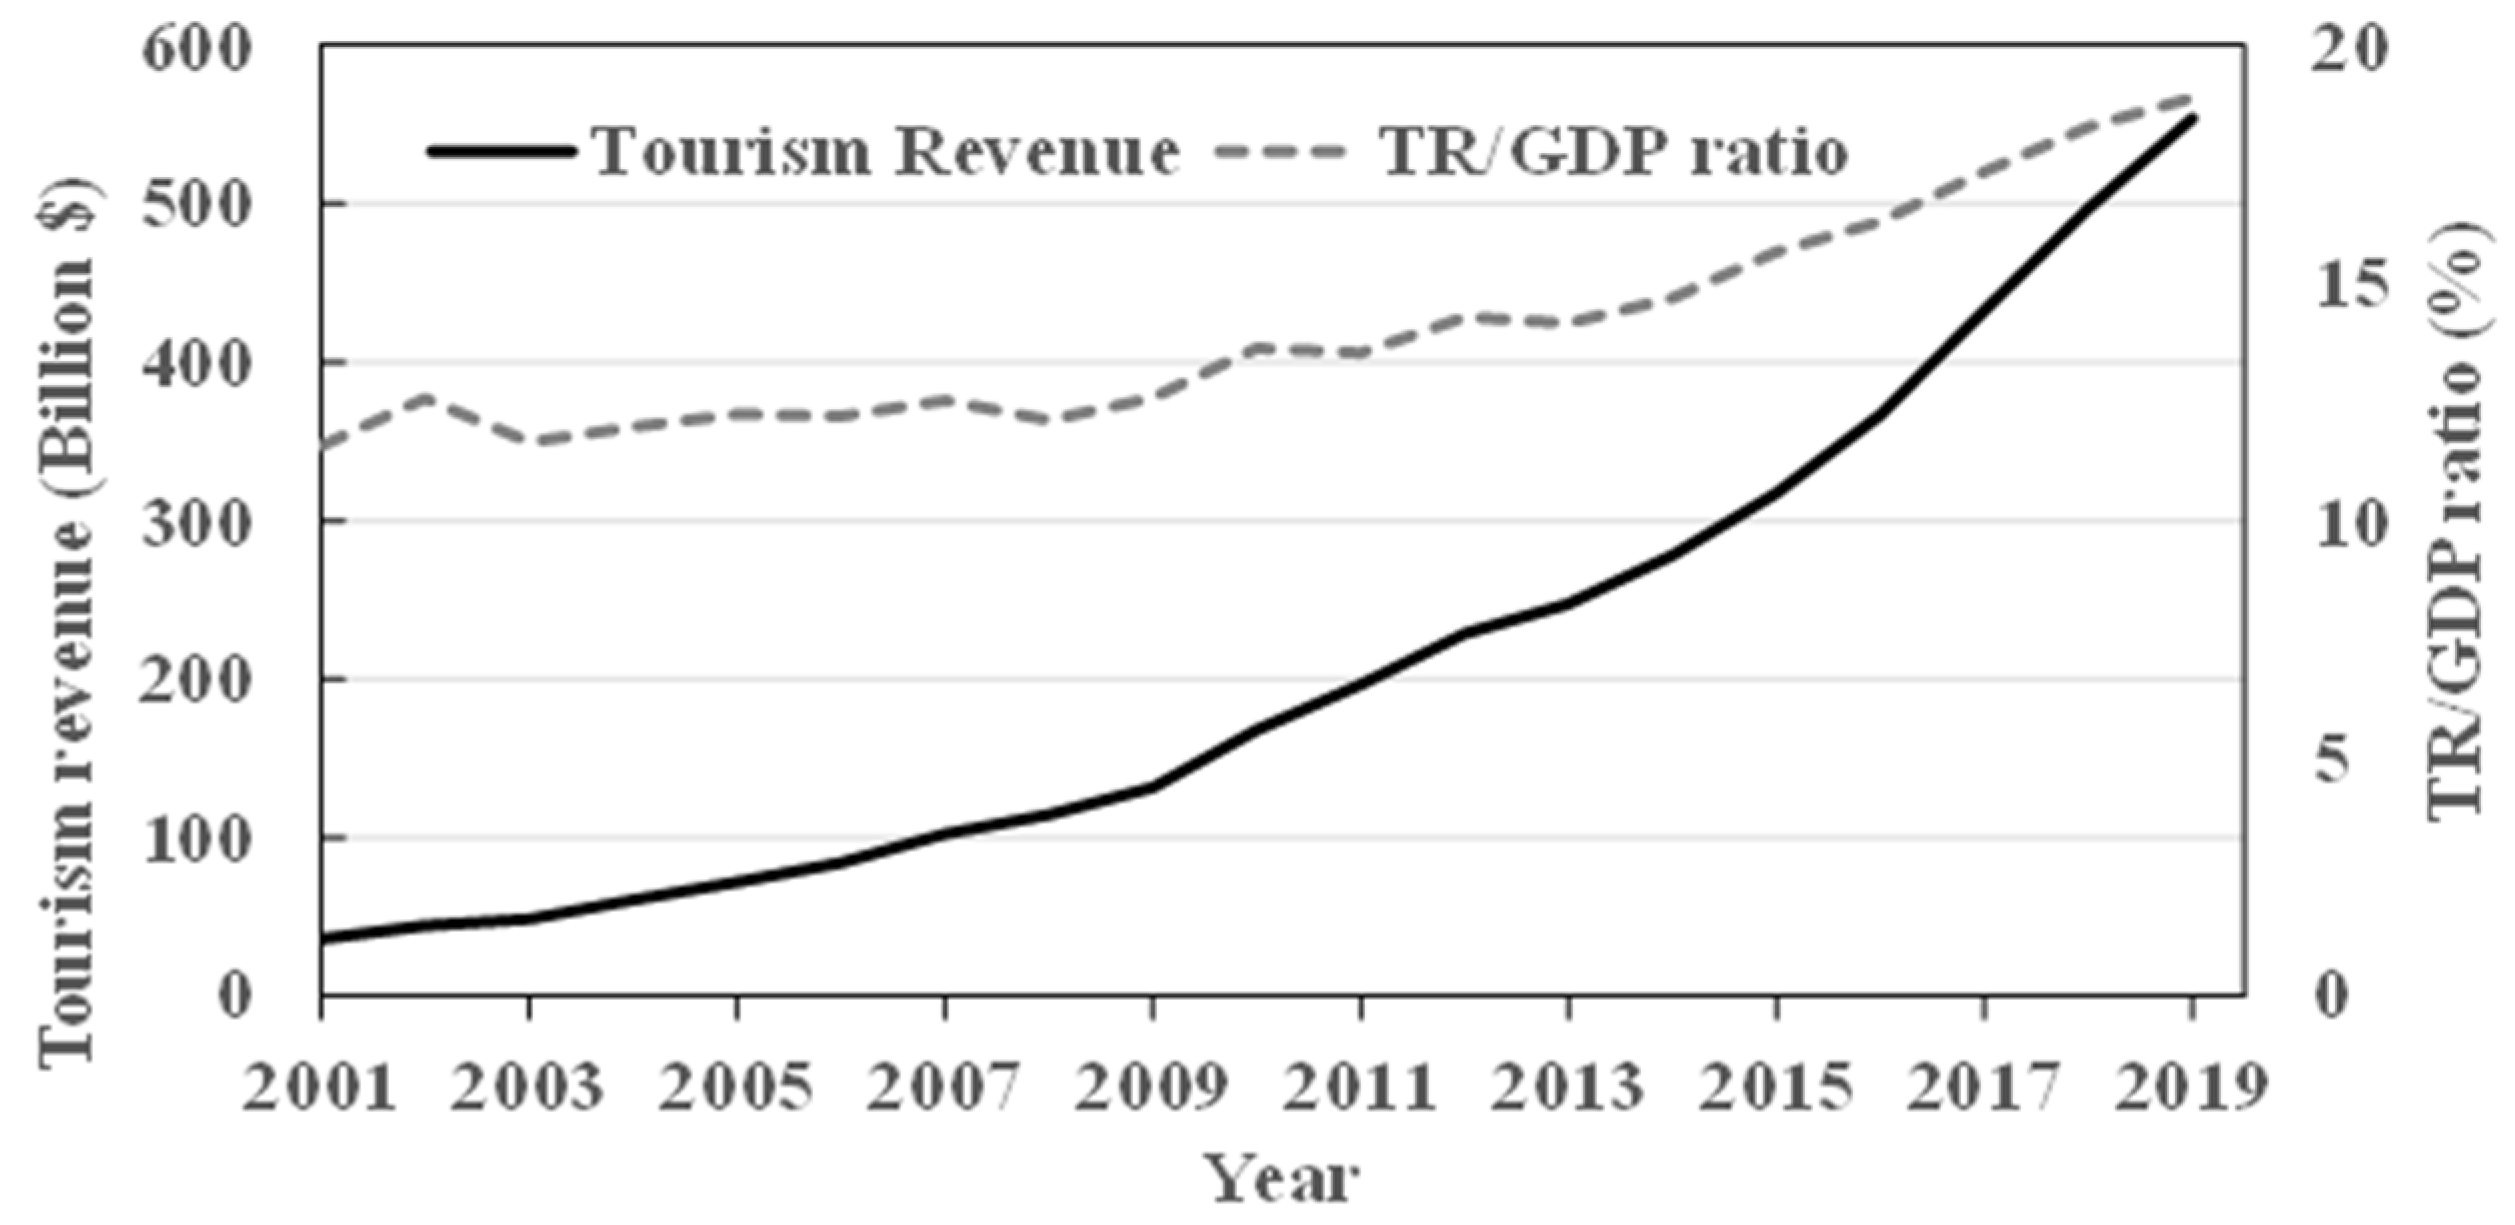
3.2. Temporal Variations in Tourism Revenue
3.3. Influencing Factors for the Variations in Tourism Revenue
4. Discussion
4.1. Industry Adjustment Patterns in the YRDUA Region
4.2. Socio-Economic Predictors of Tourism Development in the YRDUA Region
4.3. Implications and Future Outlooks
5. Conclusions
Author Contributions
Funding
Institutional Review Board Statement
Informed Consent Statement
Data Availability Statement
Conflicts of Interest
References
- Lima, J.M.; Valle, D.; Moretto, E.M.; Pulice, S.M.; Zuca, N.L.; Roquetti, D.R.; Beduschi, L.E.; Praia, A.S.; Okamoto, C.P.; da Silva Carvalhaes, V.L.; et al. A social-ecological database to advance research on infrastructure development impacts in the Brazilian Amazon. Sci. Data 2016, 3, 160071. [Google Scholar] [CrossRef]
- United Nation World Tourism Organization. Tourism Statistics Data. Available online: https://www.unwto.org/tourism-statistics-data (accessed on 10 February 2021).
- Milne, S.; Ateljevic, I. Tourism, economic development and the global-local nexus: Theory embracing complexity. Tour. Geogr. 2001, 3, 369–393. [Google Scholar] [CrossRef]
- Jin, J.C. The Effects of Tourism on Economic Growth in Hong Kong. Cornell Hosp. Q. 2011, 52, 333–340. [Google Scholar] [CrossRef]
- Zeng, G.; Cai, J. Study on the contribution of China’s tourism industry to national economy. Tour. Trib. 2012, 27, 23–31. [Google Scholar]
- Wang, W.; Xu, Y. Econometric analysis of Chinese tourism’s contribution to national economy. Math. Pract. Theory 2009, 39, 1–8. [Google Scholar]
- Zhuo, X. Research on Development of Urban Agglomeration in Yangtze River Delta; Xuelin Publishing House: Shanghai, China, 2006. [Google Scholar]
- Zhan, J.; Zhang, Q.; Liu, L. Research on disparity of tourism economy and rank-size system for Yangtze River Deleta. J. Anhui Agric. Sci. 2017, 45, 154–158. [Google Scholar]
- Smeral, E. Tourism Demand, Economic Theory and Econometrics: An Integrated Approach. J. Travel Res. 1988, 26, 38–43. [Google Scholar] [CrossRef]
- Huang, S.S.; Wei, X. Chinese outbound travel: Understanding the socioeconomic drivers. Int. J. Tour. Res. 2018, 20, 25–37. [Google Scholar] [CrossRef]
- Jayaraman, K.; Lin, S.K.; Haron, H.; Ong, W.L. Macroeconomic factors influencing Malaysian tourism revenue, 2002–2008. Tour. Econ. 2011, 17, 1347–1363. [Google Scholar] [CrossRef]
- Zhu, F.; Lu, L.; Yu, R.; Bao, J. Tourism Spatial Structure Evolution of Metropolitan Area: A Case Study of Changjiang River Delta Metropolitan Area. Sci. Geogr. Sin. 2012, 32, 570–576. [Google Scholar]
- Zhou, L.; Jiang, J. Comprehensive Evaluation of Urban Tourism Competitiveness in the Yangtze River Delta and Its Spatial Patterns Analysis. Econ. Geogr. 2015, 35, 173–179. [Google Scholar]
- Fang, Y.; Huang, Z.; Tu, W. Spatial Differences of Tourism Economy in Yangtze River Delta from the Perspective of Social Network. Trop. Geogr. 2013, 33, 212–218. [Google Scholar]
- Liang, M.; Shi, C. Core-periphery spatial structure and its evolution of tourism cities in the Yangtze River Delta Area. Tour. Forum 2009, 2, 229–233. [Google Scholar]
- Bian, X. Analysis of the forming mechansim of urban tourism core-periphery spatial structure in Yangtze River Delta. Commer. Res. 2010, 395, 62–66. [Google Scholar]
- Huang, T. Evolution characteristics and factors affecting tourist flow potential in the Yangtze River Delta Urban Agglomerations. Resour. Sci. 2016, 38, 120–126. [Google Scholar]
- Pan, J.; Li, J. Spatial distribution characteristics and accessibility of A-grade tourist attractions in China. J. Nat. Resour. 2014, 29, 55–66. [Google Scholar]
- Peking University Open Research Data Platform. Map Poi (Point of Interest) Data. Available online: https://opendata.pku.edu.cn/dataset.xhtml?persistentId=doi:10.18170/DVN/WSXCNM (accessed on 10 February 2021).
- National Bureau of Statistics of China. National data. Available online: https://data.stats.gov.cn/easyquery.htm?cn=C01 (accessed on 10 February 2021).
- China Statistical Information Network. Statistical Yearbook of China. Available online: http://www.tjcn.org/ (accessed on 10 February 2021).
- Lu, L.; Yu, F. A study on the spatial characteristic of provincial difference of tourism economy. Econ. Geogr. 2005, 25, 406–410. [Google Scholar]
- Beer, G. The Cobb-Douglas Production Function. Math. Mag. 1980, 53, 44–48. [Google Scholar] [CrossRef]
- R Program. R-3.5.3 for Windows. Available online: https://cran.r-project.org/bin/windows/base/old/3.5.3/ (accessed on 10 February 2021).
- He, Y.; Chen, H.; Tang, L. Economic development levels of provincial scale in China based on DMSP/OLS data. Geospat. Inf. 2014, 12, 79–82. [Google Scholar]
- Xu, Z. Economic benefit analysis of government investment and financing on tourism industry of the Yangtze River Delta Region. J. Hangzhou Norm. Univ. Nat. Sci. Ed. 2012, 11, 572–576. [Google Scholar]
- Li, Z. The economic analysis on the output contribution of tourism—The output contribution and the multiplier effect of tourism in Shanghai. Shanghai J. Econ. 2001, 12, 66–69. [Google Scholar]
- Wu, G. The correlation analysis on tourism development and economic development in China. J. Shanghai Coll. Appl. Technol. 2003, 3, 238–241. [Google Scholar]
- National Tourism Administration Data Centre. China Tourism Statistics Bulletin (2015). Available online: http://www.gov.cn/xinwen/2016-10/19/content_5121432.htm (accessed on 10 February 2021).
- World Tourism Cities Federation. Report on World Tourism Economy Trends (2018). Available online: https://www.wtcf.org.cn/uploadfile/2017/1114/20171114051111772.pdf (accessed on 10 February 2021).
- Li, Y. Research on factors of tourism economic growth based on grey correlation model. J. Southwest China Norm. Univ. 2017, 42, 97–102. [Google Scholar]
- Wang, D. Comparative study of 16 cities tourism competitive power in Changjiang Delta. Resour. Dev. Mark. 2007, 23, 414–418. [Google Scholar]
- Wang, B.; Xia, M. A Study on the Relationship between Tourism Industry and Regional Economic Growth: A Case Study of Jiangsu Gaochun District. Mod. Econ. 2013, 2013, 482–488. [Google Scholar] [CrossRef]
- Caglayan, E.; Sak, N.; Karymshakov, K. Relationship between Tourism and Economic Growth: A Panel Granger Causality Approach. Asian Econ. Financ. Rev. 2012, 2, 591–602. [Google Scholar]
- Dritsakis, N. Tourism as a long-run economic growth factor: An empirical investigation for Greece using causality analysis. Tour. Econ. 2004, 10, 305–316. [Google Scholar] [CrossRef]
- Tang, C.; Jang, S. The tourism–economy causality in the United States: A sub-industry level examination. Tour. Manag. 2009, 30, 553–558. [Google Scholar] [CrossRef]
- Jang, S.; Bai, B.; Hong, G.; Oleary, J.T. Understanding travel expenditure patterns: A study of Japanese pleasure travelers to the United States by income level. Tour. Manag. 2004, 25, 331–341. [Google Scholar] [CrossRef]
- Croes, R.; Vanegas, M. An econometric study of tourist arrivals in Aruba and its implications. Tour. Manag. 2005, 26, 879–890. [Google Scholar] [CrossRef]
- Wang, Y. The impact of crisis events and macroeconomic activity on Taiwan’s international inbound tourism demand. Tour. Manag. 2009, 30, 75–82. [Google Scholar] [CrossRef] [PubMed]
- Bi, J.; Lehto, X.Y. Impact of cultural distance on international destination choices: The case of Chinese outbound travelers. Int. J. Tour. Res. 2018, 20, 50–59. [Google Scholar] [CrossRef]
- Statista. Global Tourism Industry-Statistics & Facts. Available online: https://www.statista.com/topics/962/global-tourism/ (accessed on 10 February 2021).
- Milne, S. Tourism and sustainable development: Exploring the global-local nexus. In Sustainable Tourism: A Geographical Perspective; Hall, C.M., Lew, A.A., Eds.; Addison Wesley Longman Ltd.: Harlow, UK, 1998; pp. 35–48. [Google Scholar]
- Zhou, X.; Tian, D.; Zhang, T. Literature Review on Domestic Pan-Regional Tourism in China. J. Kunming Metall. Coll. 2020, 36, 99–104. [Google Scholar]
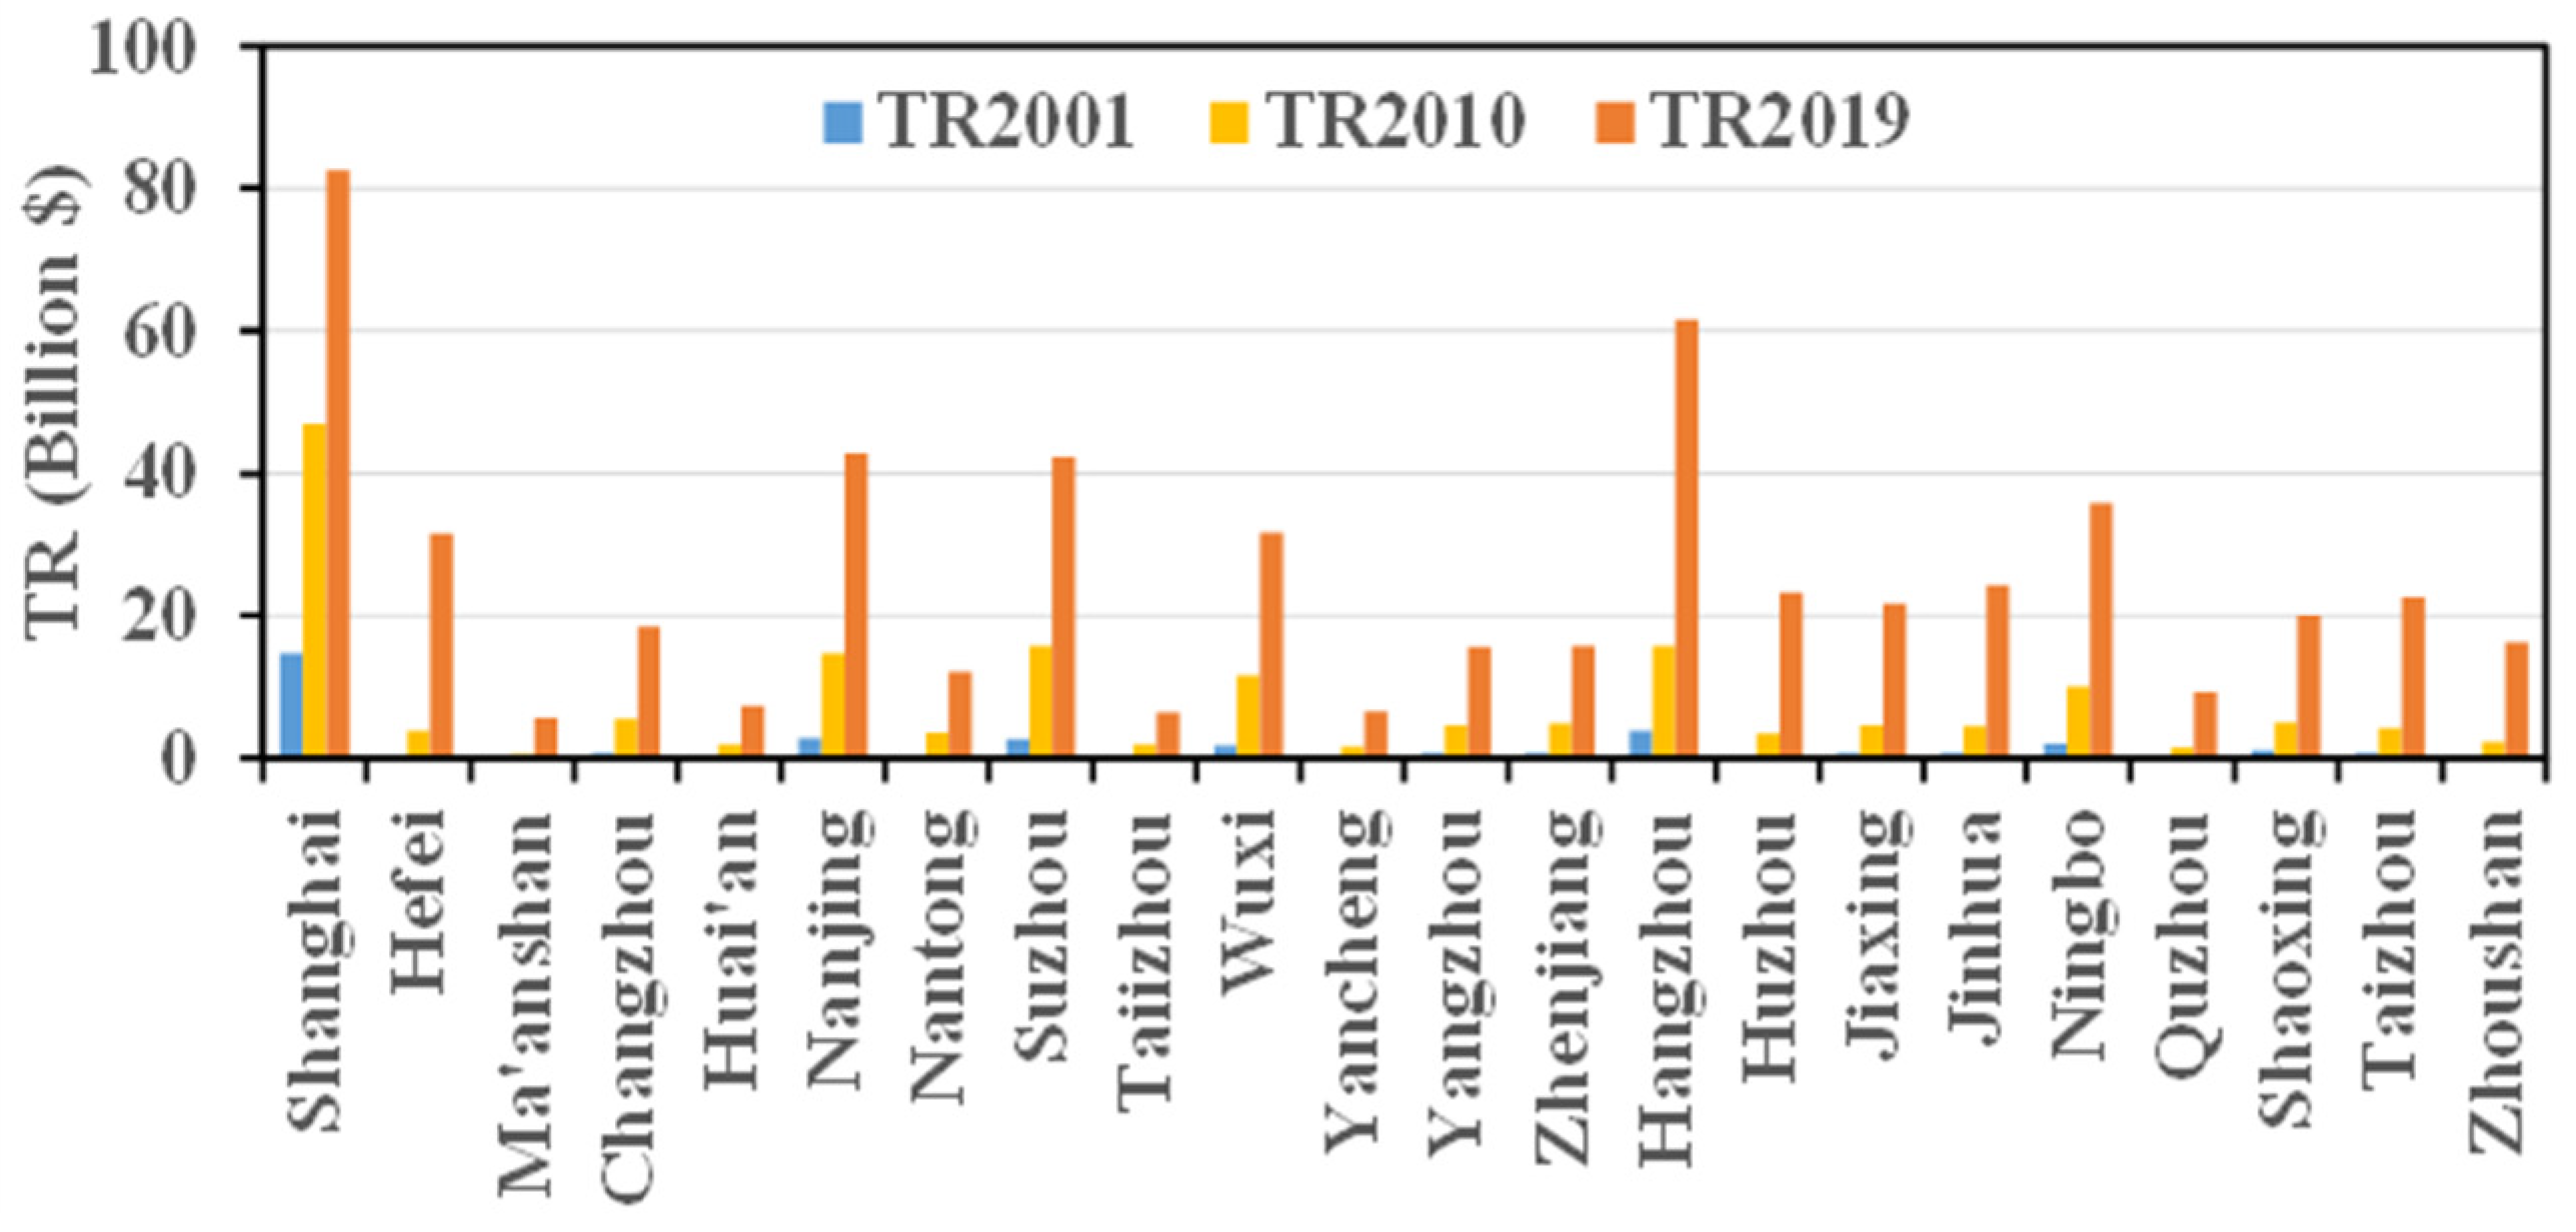
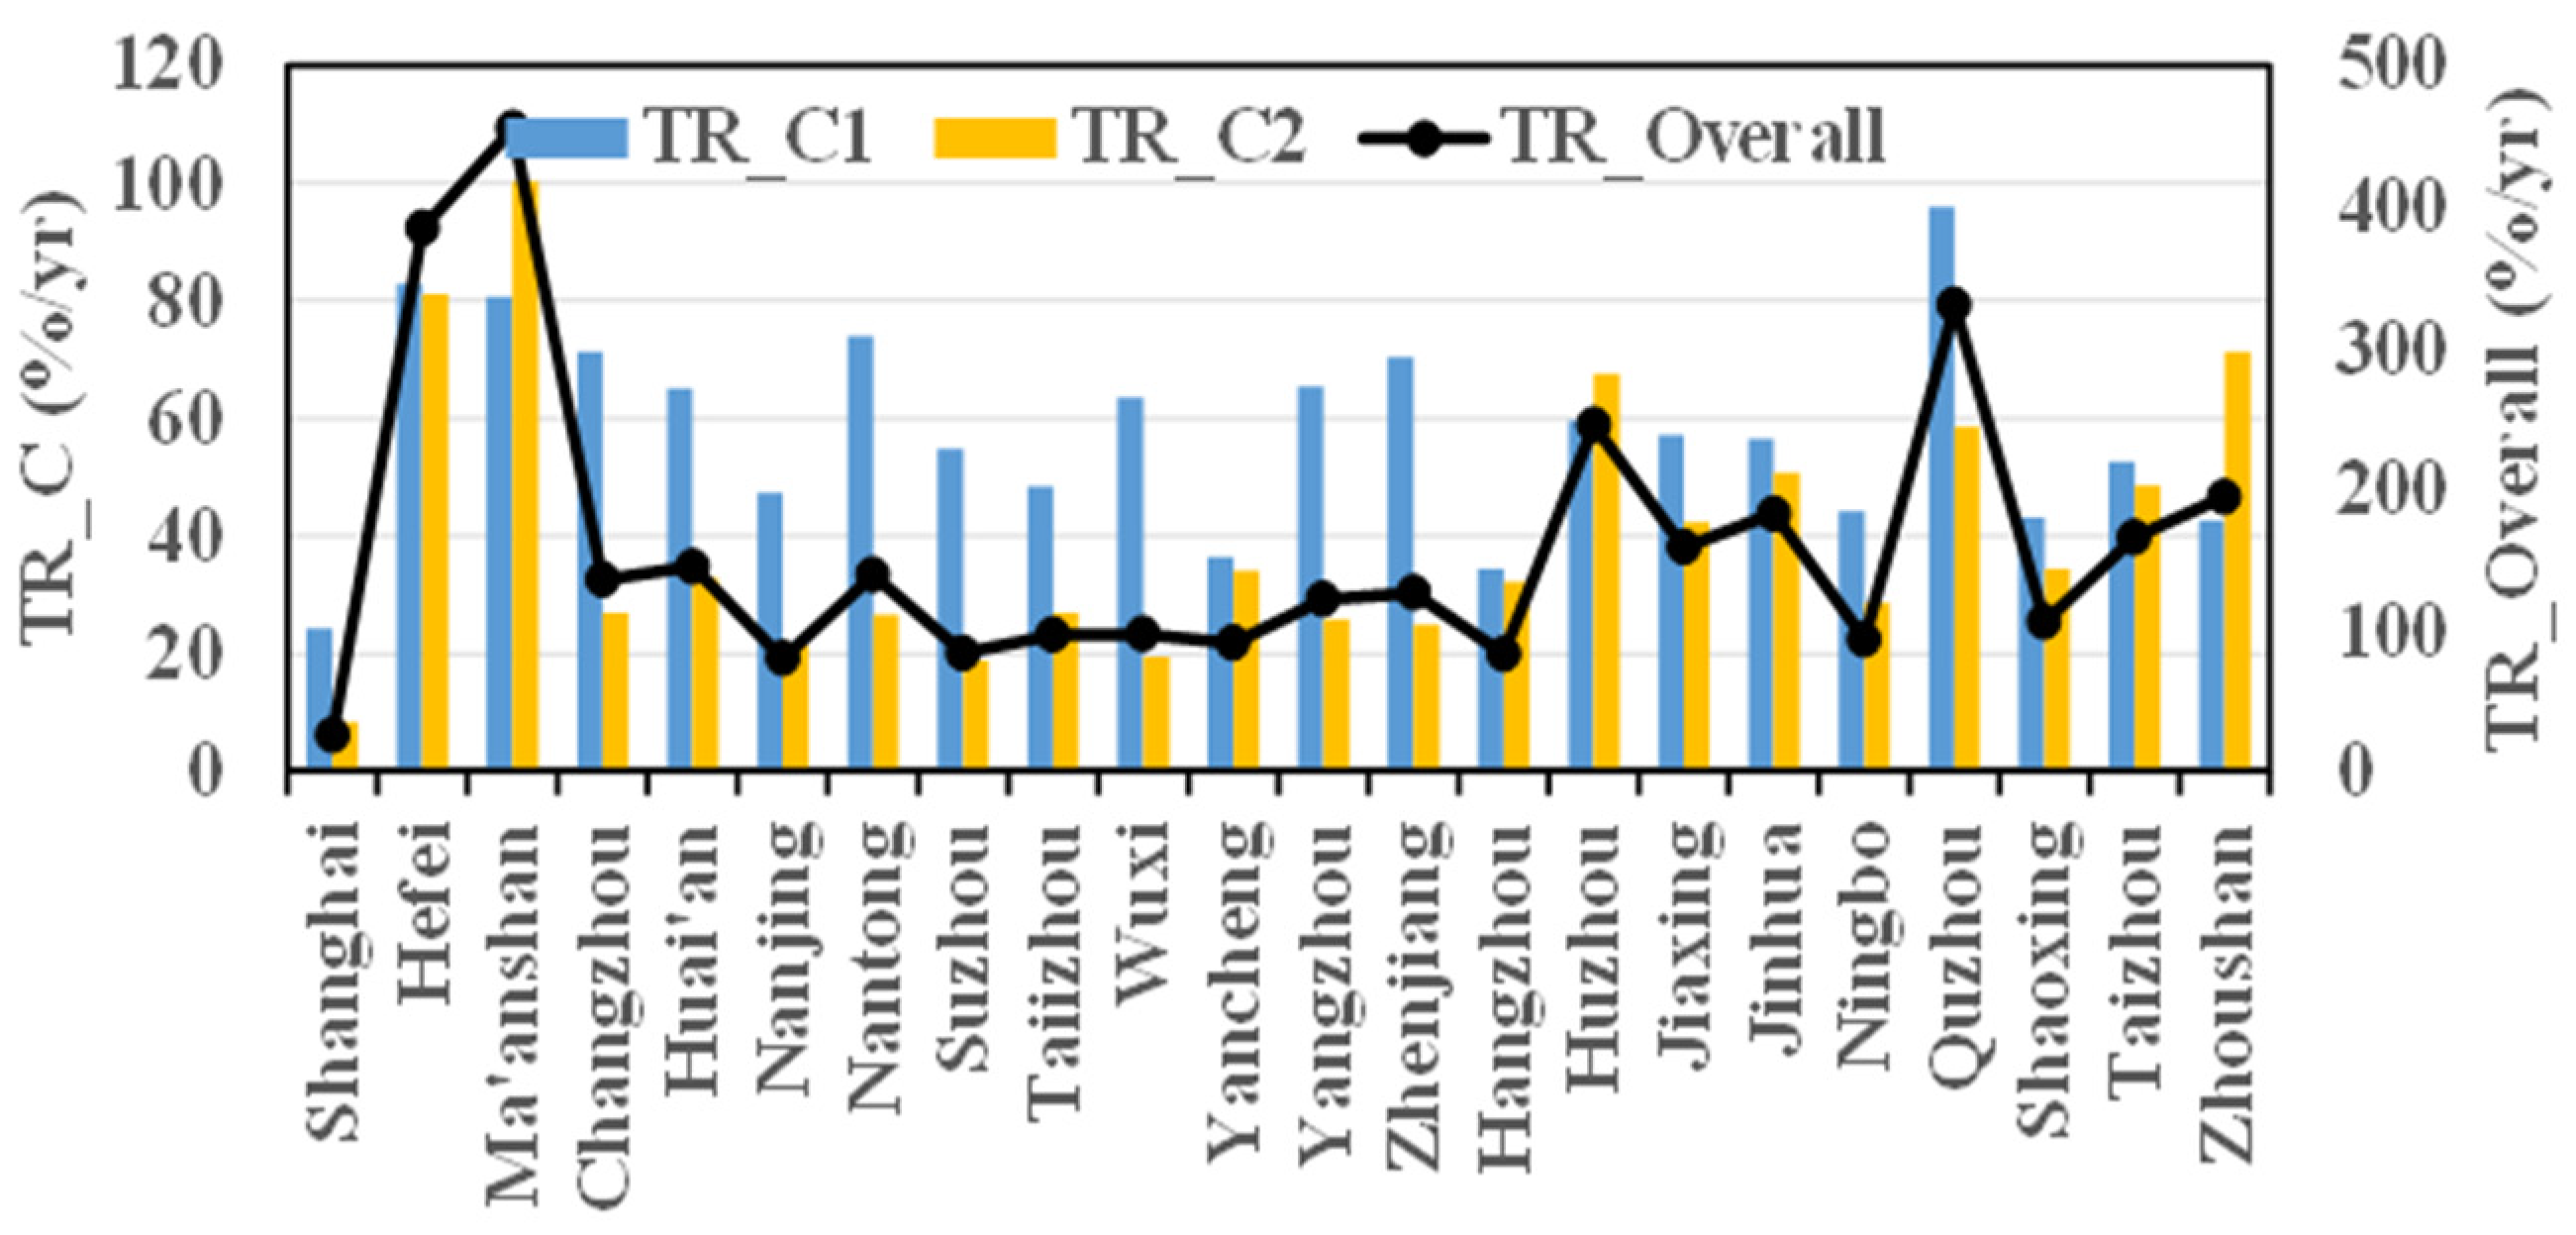
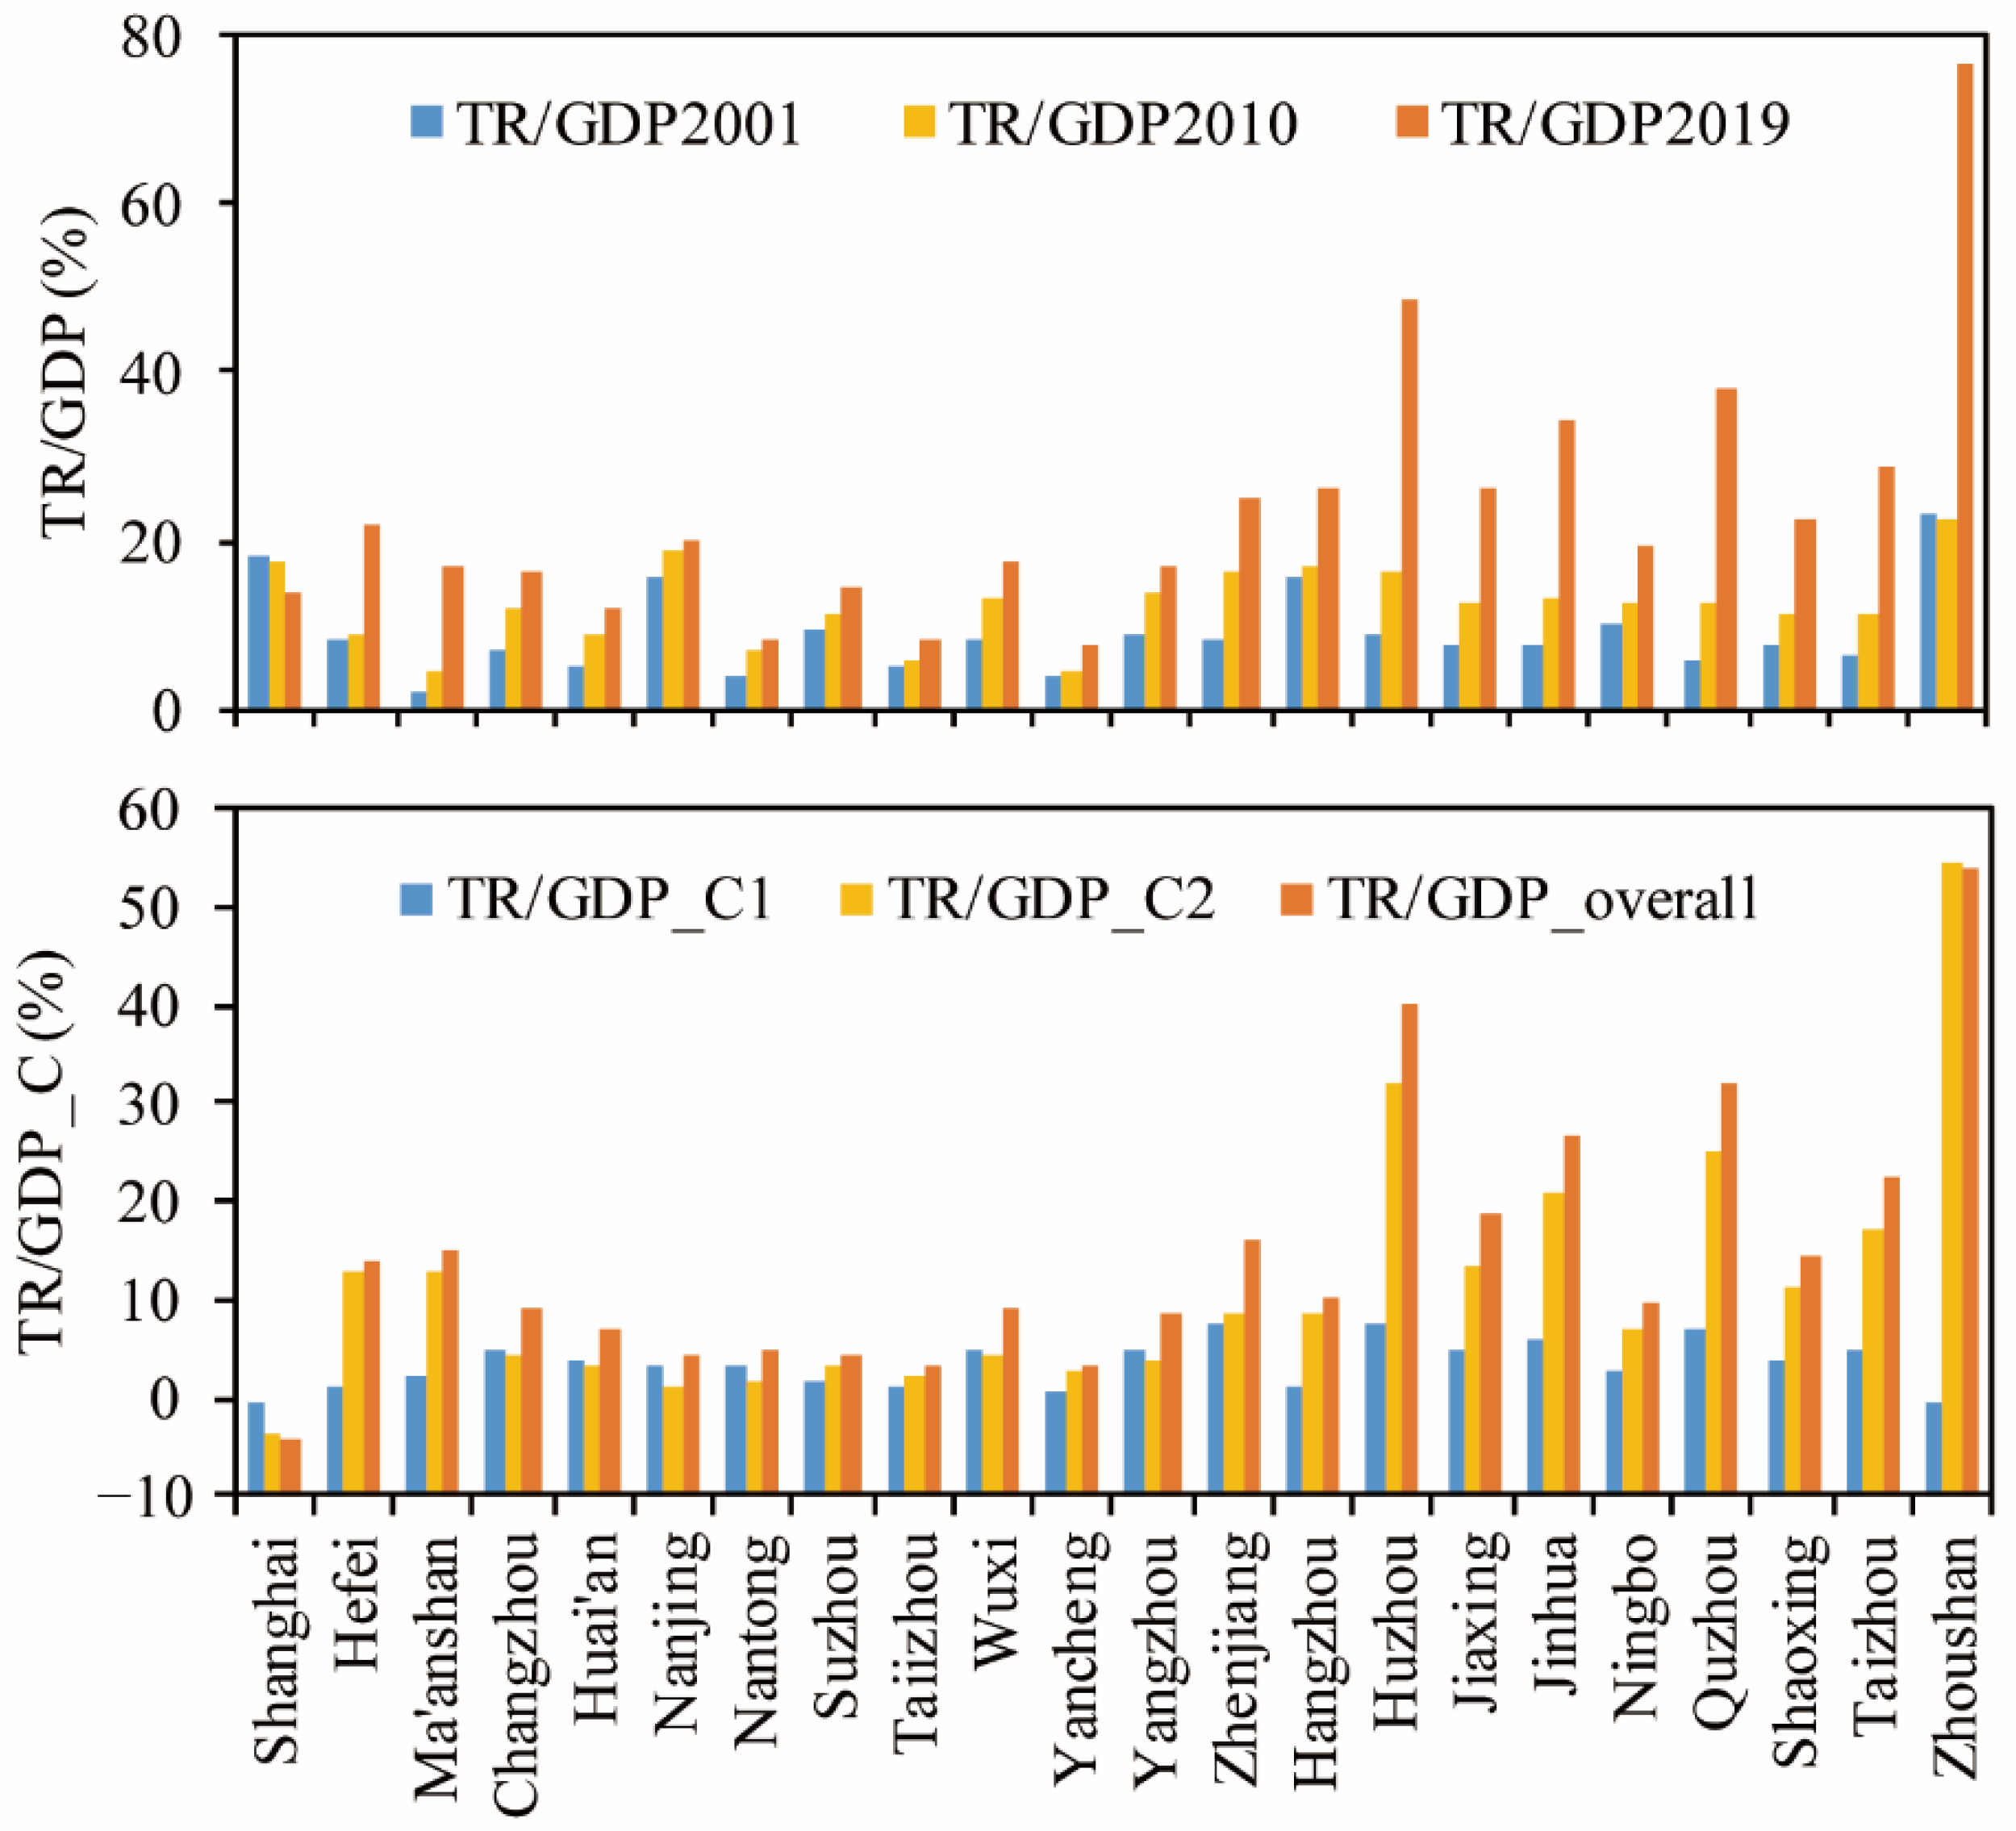
| City | Stepwise Regression Models |
|---|---|
| Shanghai | LN(TR) = 6.43 + 0.21GDP *** − 0.20TIR *** |
| Hefei | LN(TR) = 2.69 + 1.36DPI *** |
| Ma’anshan | LN(TR) = 1.01 +1.18DPI *** |
| Changzhou | LN(TR) = 2.76 + 0.35NSS ** + 0.36DPI *** + 1.14NPE *** |
| Huai’an | LN(TR) = 1.73 + 0.15NSS ** + 0.75HM *** + 0.45NPE *** + 0.63DPI *** |
| Nanjing | LN(TR) = 4.57 + 0.37NSS *** + 0.18DPI *** |
| Nantong | LN(TR) = 1.00 + 7.274UR *** + 0.17DPI * |
| Suzhou | LN(TR) = 3.24+0.19NSS***+3.00UR***+0.35NPE*** |
| Taiizhou | LN(TR) = 1.80 + 0.62DPI * − 2.09TIR *** + 1.12NPE *** + 1.06GDP ** |
| Wuxi | LN(TR) = 3.34 + 1.06NPE *** + 0.29GDP *** + 1.29UR *** |
| Yancheng | LN(TR) = 1.86 + 0.27NSS *** + 3.74UR *** |
| Yangzhou | LN(TR) = 3.46 + 0.45NSS *** + 1.58NSH *** |
| Zhenjiang | LN(TR) = 2.31 + 0.47DPI *** + 1.41HM *** + 2.01UR * |
| Hangzhou | LN(TR) = 3.48 + 0.57DPI *** + 0.52NSH *** − 0.52HM ** + 1.75UR * |
| Huzhou | LN(TR) = 0.54 + 8.04NPE *** + 0.16NSS * |
| Jiaxing | LN(TR) = 1.30 + 3.07NPE *** + 3.09UR * |
| Jinhua | LN(TR) = 0.16 + 0.50GDP *** + 7.40UR *** |
| Ningbo | LN(TR) = 3.78 + 0.29NSS *** + 0.53NPE ** + 0.79HM ** |
| Quzhou | LN(TR) = 0.78 + 1.04DPI *** + 1.78NSH *** + 1.79NPE * |
| Shaoxing | LN(TR) = 1.87 + 0.89NPE *** + 0.44GDP *** + 0.19HM * |
| Taizhou | LN(TR) = 1.31 + 6.04UR *** + 0.38DPI *** |
| Zhoushan | LN(TR) = 3.02 + 1.68GDP *** + 0.97NSS * |
Publisher’s Note: MDPI stays neutral with regard to jurisdictional claims in published maps and institutional affiliations. |
© 2021 by the authors. Licensee MDPI, Basel, Switzerland. This article is an open access article distributed under the terms and conditions of the Creative Commons Attribution (CC BY) license (http://creativecommons.org/licenses/by/4.0/).
Share and Cite
Jiao, G.; Lu, L.; Chen, G.; Huang, Z.; Cirella, G.T.; Yang, X. Spatiotemporal Characteristics and Influencing Factors of Tourism Revenue in the Yangtze River Delta Urban Agglomeration Region during 2001–2019. Sustainability 2021, 13, 3658. https://doi.org/10.3390/su13073658
Jiao G, Lu L, Chen G, Huang Z, Cirella GT, Yang X. Spatiotemporal Characteristics and Influencing Factors of Tourism Revenue in the Yangtze River Delta Urban Agglomeration Region during 2001–2019. Sustainability. 2021; 13(7):3658. https://doi.org/10.3390/su13073658
Chicago/Turabian StyleJiao, Gengying, Lin Lu, Guangsheng Chen, Zhiqiang Huang, Giuseppe T. Cirella, and Xiaozhong Yang. 2021. "Spatiotemporal Characteristics and Influencing Factors of Tourism Revenue in the Yangtze River Delta Urban Agglomeration Region during 2001–2019" Sustainability 13, no. 7: 3658. https://doi.org/10.3390/su13073658
APA StyleJiao, G., Lu, L., Chen, G., Huang, Z., Cirella, G. T., & Yang, X. (2021). Spatiotemporal Characteristics and Influencing Factors of Tourism Revenue in the Yangtze River Delta Urban Agglomeration Region during 2001–2019. Sustainability, 13(7), 3658. https://doi.org/10.3390/su13073658


