
Multiscale Characterization of E-Glass/Epoxy Composite Exposed to Extreme Environmental Conditions


Experimental Mechanics Laboratory, Mechanical Engineering Department, San Diego State University, 5500 Campanile Drive, San Diego, CA 92182, USA
*
Author to whom correspondence should be addressed.
J. Compos. Sci. 2021, 5(3), 80; https://doi.org/10.3390/jcs5030080
Submission received: 16 February 2021
/
Revised: 6 March 2021
/
Accepted: 10 March 2021
/
Published: 12 March 2021
(This article belongs to the Special Issue Characterization and Modelling of Composites, Volume II)
Abstract
:Fiber-reinforced polymer matrix composites continue to attract scientific and industrial interest since they offer superior strength-, stiffness-, and toughness-to-weight ratios. The research herein characterizes two sets of E-Glass/Epoxy composite skins: stressed and unstressed. The stressed samples were previously installed in an underground power distribution vault and were exposed to fire while the unstressed composite skins were newly fabricated and never-deployed samples. The mechanical, morphological, and elemental composition of the samples were methodically studied using a dynamic mechanical analyzer, a scanning electron microscope (SEM), and an x-ray diffractometer, respectively. Sandwich composite panels consisting of E-glass/Epoxy skin and balsa wood core were originally received, and the balsa wood was removed before any further investigations. Skin-only specimens with dimensions of ~12.5 mm wide, ~70 mm long, and ~6 mm thick were tested in a Dynamic Mechanical Analyzer in a dual-cantilever beam configuration at 5 Hz and 10 Hz from room temperature to 210 °C. Micrographic analysis using the SEM indicated a slight change in morphology due to the fire event but confirmed the effectiveness of the fire-retardant agents in quickly suppressing the fire. Accompanying Fourier transform infrared and energy dispersive X-ray spectroscopy studies corroborated the mechanical and morphological results. Finally, X-ray diffraction showed that the fire event consumed the surface level fire-retardant and the structural attributes of the E-Glass/Epoxy remained mainly intact. The results suggest the panels can continue field deployment, even after short fire incident.
1. Introduction and Background
The general class of composite materials offers a multitude of desirable attributes that can be readily tuned on-demand during the design analysis phase by adjusting the type and ratio of the constituents. Composite materials encompass a wide range of material types, including ceramics, metals, and polymers. Polymers can be used interchangeably as the reinforcement and the matrix phases, resulting in polymer-, ceramic-, and metal- matrix subclasses of materials. Such broadness of choices and the ability to develop novel subclasses based on characteristically different design requirements have motivated the integration into a plethora of applications spanning from aerospace and automotive to biomedical and construction industries. From a mechanical behavior perspective, the specific strength (strength-to-weight-ratio) and specific stiffness (modulus-to-weight ratio) are eagerly sought for many practical applications, including the positive influence on survivability and longevity of composite-based parts, components, and structures.
Without discounting the advances in other subclasses of composite materials, fiber-reinforced polymer matrix composite (PMCs) is the most prolific subclass of these types of materials. PMCs consist of a reinforcement phase made of continuous or discontinuous fibers (e.g., carbon, glass, Kevlar®, or natural materials) and a polymer matrix (e.g., thermosets, thermoplastic, or even biodegradable). Analogous to the major class of composite materials, PMCs offer superior strength-to-weight, stiffness-to-weight, and toughness-to-weight ratios, compared to their single-phase constituents. The construction industry, among others, found refuge in composite materials to combat several challenges, such as (1) installation time and cost since composite technologies could produce near-net-shape parts [1] and (2) the deterioration of infrastructures due to its potential field life longevity [2,3,4,5]. Infrastructures and structures are continually enduring harsh and demanding loading, operating, and environmental conditions that are somewhat distinctive from other industries [6]. Due to the cost and access constraints, glass fibers are common used in construction applications, including installation and drywall tapes, to name a few examples. In addition, reinforcement using natural materials continues to take center stage in scientific and engineering communities. However, most composite-based deployed infrastructures are made using glass fibers, which exhibit remarkable strength in simple tension but suffer under shear and bending loading scenarios [5,7,8]. Therefore, the polymer matrix plays a significant role in load-bearing and non-bearing applications, protecting the brittle glass fibers in non-axial loading scenarios against shearing stresses that may result in catastrophic failure. Researchers, e.g., [9,10], investigated different polymer matrix materials to encase glass fibers, noting that vinyl-ester trumps polyester in mechanical and thermal performances. Hence, the focus of this study is on glass fiber in a modified vinyl-ester polymer matrix. The latter was modified by adding a fire-retardant agent, given the potential of fire in the specific application domain, as discussed next.
A novel application of PMCs in the construction industry is replacing aging underground power distribution vaults made of reinforced concrete with vaults made of modular composite panels constructed of glass fibers and vinyl-ester polymer matrix. The modular composite panels facilitate an easy and quick installation resulting in reduced traffic interruptions, making them practically adventurous. On the other hand, the replacement of reinforced concrete vaults requires excavating aged structures and surrounding roads, rerouting incoming traffic and interrupting the local community [11]. In addition to the apparent harsh loading and operating conditions, e.g., humidity, temperature, and static and dynamic loading, the vaults may experience fire events due to power line explosions from arcing faults or power surges. The fire hazard, in turn, results in a localized increase in the surface temperature of the materials, and if the fire is not quickly extinguished, the severity of this loading condition may lead to a catastrophic failure of the vault structure irrespective of the construction material [11,12,13,14]. In the case of composite-based vaults, the good thermal insulation of polymers and the fusion of the matrix with fire-retardant reagents offer clear advantages compared to the traditional reinforced concrete technology.
The discussion above alludes to two crucial and potential loading scenarios threatening the performance of the composite panels used in modular replacement of underground power distribution vaults, namely, long-term static loading and hazardous fire events. Recently, the dynamic properties of field-deployed E-Glass/Epoxy composite panels were investigated and reported compared to as-fabricated panels [11]. The dynamic mechanical properties were quantified using a dynamic mechanical analyzer given its broad capability in elucidating the interdependence of properties of polymers and composites on the individual or combined effect of temperature, frequency, environmental conditions [15,16,17] as well as reporting several thermomechanical transitions [15,17,18]. It also allows the characterization of bulk properties that directly affect the material performance. It was reported that the storage modulus of the fire-exposed E-Glass/Epoxy panels was lower than their unloaded, as-fabricated panels, while the complex modulus was shown to be unchanged within the experimental error [11]. Most of the reported changes in the dynamic properties after the fire event were attributed to change in the molecular relaxation mechanisms of the polymer matrix phase, leaving the reinforcement phase unaffected by these operating conditions. The effectiveness of the fire-retardant properties of the composite panels was demonstrated by mitigating the impact of fire in the absence of dust and oil surface contamination. Additionally, the flexural creep response of the same composite skins was characterized and elucidated as a function of high static stress, orders of magnitude higher than those experienced by the panels in deployment, and different strain rates [5]. The mechanical properties of the E-Glass/Epoxy used in the production of modular composite panels for underground vault application were found to be generally insensitive to loading rate but resulted in permanent damage at a relatively low strain level. Alternatively, E-Glass/Vinyl-ester PMCs were reported to be mildly sensitive to the creep strain [5]. A major shortcoming of these previous investigations is the lack of analytical chemistry and morphological characterizations to substantiate and corroborate the reported results, especially in fire events.
Compared to its predecessors, the distinguishing aspect of the current study is the multiscale investigation of composite panels previously deployed in real-life, harsh operating, and environmental conditions, including a fire event stemming from a power line explosion. The objective of the research leading to this paper was to characterize E-Glass/Epoxy composite skins previously installed in an underground power distribution vault after a fire incident. The mechanical, morphological, and elemental compositions of the samples were methodically studied using a dynamic mechanical analyzer, scanning electron microscope, and x-ray diffractometer, respectively. The novelty of the current study lies in the comprehensive chemical analysis to supplement the mechanical characterization to pinpoint the source of performance degradation.
2. Materials and Methods
The samples used in this experimental investigation were extracted from sandwich composite panels consisting of E-Glass/Epoxy skin and balsa wood cores received from Armorcast Products Company, used for refitting underground utility vaults. The panels were manufactured using a hand layup process and cured under high pressure in a heated hydraulic press. The sandwich panels consisted of two 6.35 mm thick skin layers made of E-Glass/Epoxy and 140 mm thick balsa wood core. The E-Glass/Epoxy skins are quadriaxial (0°/45°/90°/−45°) stitched E-glass fabric (VectorPly, E-QXM 3705, Phenix City, AL, USA) soaked with an epoxy resin of brominated bisphenol A Epoxy vinyl-ester resin dissolved in styrene (AOC, Vipel K022, Collierville, TN, USA) with the addition of Alumina Trihydrate (R.J. Marshall Company, Southfield, MI, USA) as a fire-retardant agent.
Some of the received panels were previously exposed to harsh operating conditions, including oil and dust contamination and fire since they were in underground vault deployment before laboratory testing. The oil contamination is due to the cooling oil used in power distribution electrical transformers, while the dust is associated with the outdoor underground operating environment. The fire was associated with a power-line explosion, causing superficial burns [11]. The conditions surrounding the fire accident were not monitored by the utility provider given the lack of data logging capabilities in the vaults. Nonetheless, the extracted samples provide a unique scientific opportunity to examine the effect of real-life operating conditions on the performance of E-Glass/Epoxy PMCs. Virgin panels were also received from the same manufacturer, newly fabricated, and have never been exposed to any loading or operating conditions. The skin of the field-deployed panels and of virgin (never deployed) panels were extracted by carefully grinding the balsa wood cores. The skins were then polished using 100-grit sandpaper to eliminate any traces of the balsa wood. Skin-only specimens with dimensions of ~12.5 mm wide, ~70 mm long, and ~6 mm thick were extracted and tested in the Dynamic Mechanical Analyzer (DMA, TA Instruments: Q800, New Castle, DE, USA). DMA testing was done in a dual-cantilever beam configuration at 5 Hz and 10 Hz to measure the dynamic properties of the E-Glass/Epoxy skin materials as a function of temperature ranging from room temperature to 210 °C with temperature steps of 10 °C. The DMA testing protocol is discussed in detail in [11]. It is worth noting that the core was discarded and not included in this study since it has shown before to be indifferent to the aforementioned deployment conditions [11]. Table 1 summarizes the sample identification scheme and the corresponding extraction and testing conditions, which will be used throughout the article thereafter.
In addition to the mechanical testing, microscopy (SEM) and spectroscopy (XRD) characterizations were done on the virgin and burnt skin specimens before and after DMA testing. The X-ray diffraction (XRD) spectra were collected using a Philips XPert XRD (Amsterdam, The Netherlands) with a copper light source with a wavelength (λ) of 0.15405 nm at operating conditions of 45 kV and 40 mA. After cleaning and positioning each specimen individually on an amorphous glass substrate for measurement, the XRD spectral data were obtained from 2θ = 2° to 70° at a scanning rate of 2° min−1 to observe the structural changes in the E-Glass/Epoxy composite as a function of operating (virgin vs. deployed) and testing (before and after DMA testing) conditions. The wide range was chosen based on [19]. Additionally, scanning electron microscopy (SEM, FEI Quanta 450, Hillsboro, OR, USA) was used to elucidate the morphological and chemical changes on the specimens due to the aggressive operating and testing conditions. The non-conductive composite samples were coated with 6 nm of platinum to prevent the accumulation of electron charges on the surface before microscopy. SEM micrographs were captured at an accelerated voltage of 30 kV under a high vacuum, where the effective focal distance was approximately 10 mm. Simultaneously, backscattered electrons allowed the identification of the surface chemical composition of the micrographs using energy dispersive X-ray (EDS) analysis. The X-rays emitted as the beam of electrons interacted with the surface of each composite panel were collected using a backscattered electron, high contrast detector. The signals are then measured and interpreted using the Oxford INCA EDS (Abingdon, United Kingdom) analysis software to generate an elemental mapping of the scanned area. Finally, the samples were characterized using Attenuated Total Reflection Fourier-transform infrared (ATR-FTIR) spectroscopy (Fisher Scientific Nicolet IS5, Waltham, MA, USA) to elucidate the effect of fire event on the chemical structure of the polymer/fiber composite.
3. Results and Discussion
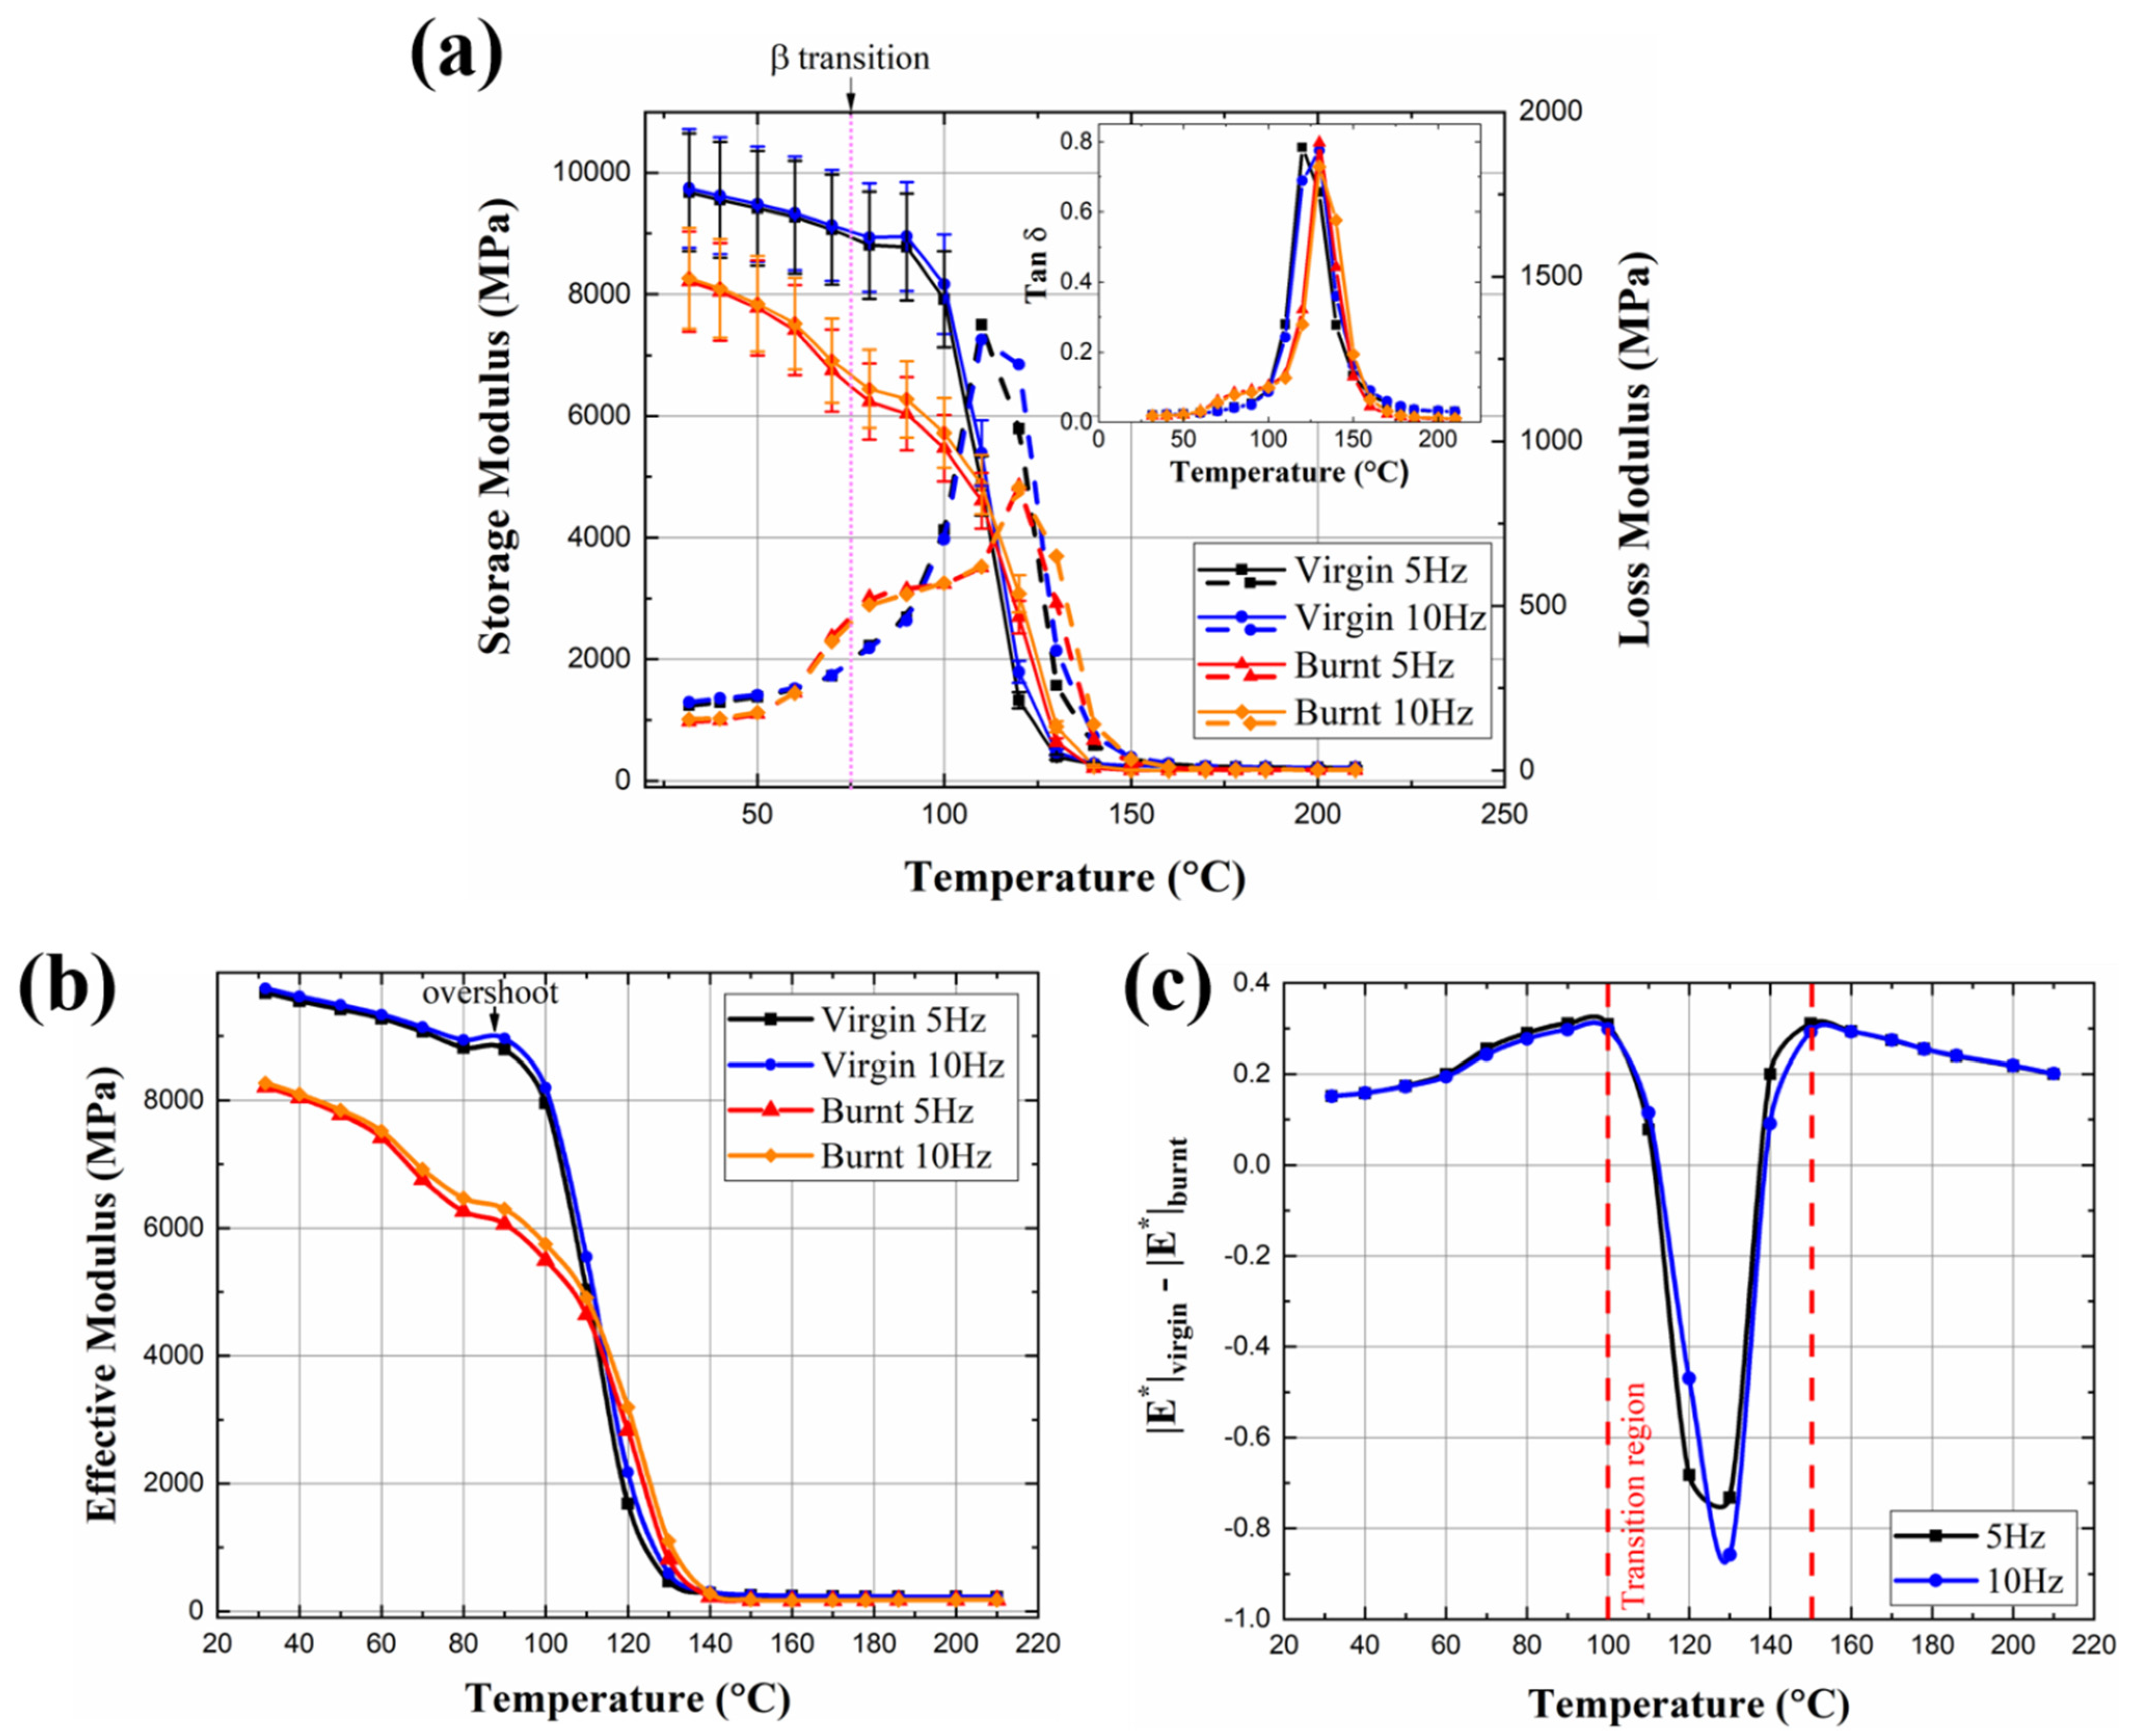
Figure 1a shows the dynamic mechanical analyzer (DMA) results, where the thermomechanical spectra of the virgin and burnt samples are plotted at two characteristic frequencies, namely, 5 Hz and 10 Hz, comparable to urban loading scenarios due to vehicular traffic. Each thermomechanical spectrum is a plot of the storage (E’) and loss (E”) moduli as a function of temperature, ranging between 32 °C and 210 °C. The storage modulus is a measure of the material stiffness or its resistance to deformation, while the loss modulus quantifies the damping or energy dissipation in the composite material. The storage and loss moduli are the components of the complex modulus of polymers. The tangent delta (tanδ) is also plotted in the inset seen in Figure 1a. Therefore, the magnitude of the complex modulus (E* = E’ + iE”) is also plotted in Figure 1b to demonstrate the overall effect of deployment conditions on the dynamic mechanical behavior of E-Glass/Epoxy composite skins. The complex modulus magnitude is plotted to capture the changes in both the storage and the loss moduli simultaneously. The magnitude of the complex modulus is referred to as the effective modulus. Finally, the percent difference between the effective moduli is shown in Figure 1c, demonstrating the quantitative effect of the exposure to power-line fire explosion.
The thermomechanical spectra shown in Figure 1a are based on the average response of four virgin samples and five burnt samples. The spectra can be naturally divided into three regions. First is the glassy region, below the glass transition temperature (Tg), followed by the leathery region, where the material transitions from the glassy regime to the third and final region, the rubbery regime. As shown in Figure 1b, the storage modulus remains nearly constant in the glassy regime, followed by a sudden and significant drop in the leathery regime, and subsequently approaches another constant value in the rubbery regime. The glass transition temperature marks the thermal transition between the glassy and leathery regimes, calculated here based on the peak of the loss modulus [11]. The glass transition temperature (Tg) was found to be 112 °C for the virgin composite specimens, shifting to 120 °C for the specimens extracted from the burnt panels. Due to the low range of investigated frequencies, Tg appeared to be insensitive to the change in the testing frequency but was shown to be a frequency-dependent property if testing was done at a broader range [19]. A notable dip is observed in the storage moduli of the virgin and burnt panels before Tg, which were assigned to be the beta transition (Tβ), delineating the evolution in chain mobility due to increased thermal energy from increasing temperature. The beta transition is a secondary-order transition, commonly present below the primary Tg transition, where the chains in the epoxy matrix start to slide with higher degrees of freedom than below Tβ. In the latter condition, the chain motions are limited to bending and stretching mechanisms [15]. The dip in Tβ is manifested in the loss modulus as a peak proceeding the Tg peak. The dip at Tβ in the storage modulus corresponds to an increase in the loss modulus, indicating an uptick in the energy dissipation; therefore, a change in Tβ is related to a change in toughness [11,15]. This can be clearly seen in the plot of tanδ. The burnt samples show a more pronounced peak in the loss-modulus at Tβ since this transition point is associated with chain mobility due to the thermal energy, as discussed above. It is believed that the fire event had loosened the chain and alleviated some of the processing residual stresses and, hence, provided a high degree of mobility to the chains at Tβ and throughout the thermomechanical spectrum. Here, Tβ was found to be insensitive to the harsh deployment operating conditions since it remained constant at 75 °C for virgin and burnt panels, suggesting the overall chemical structure of the composite remained unaffected by the deployment conditions since the secondary thermal transitions are linked to different activation energies based on the microstructure [15,20].
Table 2 summarizes and collates the DMA testing results, including Tg and Tβ, and the average storage and loss moduli at the two different testing frequencies (5 Hz and 10 Hz). In the following discussion, the reported flexural storage and loss moduli in the glassy and rubbery regimes are based on the average and standard deviation in the moduli values below 100 °C and above 150 °C, respectively. The effect of deployment conditions on the mechanical behavior within the leathery regime is discussed next in the context of the difference in the effective moduli. The flexural storage modulus was measured to be 9.06 ± 0.56 GPa and 6.99 ± 1.02 GPa for the virgin and burnt samples, respectively, at temperatures ≤100 °C at 5 Hz. Within the same range of temperatures, the corresponding loss moduli were 0.342 ± 0.182 GPa and 0.344 ± 0.188 GPa. Comparing these values at 5 Hz, the storage modulus exhibited a ~23% decrease while the loss modulus remained nearly unchanged, indicating a reduction in deformation resistance while maintaining toughness. The reduction in the storage modulus in the burnt samples is attributed to the localized change in temperature during the fire event, resulting in permanent loosening of the chains in the epoxy matrix or an increase in the amorphous phase. In the rubbery regime (≥150 °C), the average storage and loss moduli were found to be 0.231 ± 0.008 GPa and 0.013 ± 0.009 GPa, respectively, for the virgin panels and 0.172 ± 0.004 GPa and 0.006 ± 0.007 GPa, respectively, for the burnt samples at 5 Hz. The reduction in the moduli in the rubbery region for the burnt specimen confirms the increase in the amorphous phase of the epoxy matrix.
The moduli result for the virgin and burnt specimens at 10 Hz are also listed in Table 2, showing an increase in the average moduli. For example, the average storage modulus in the glassy region for virgin samples increased to 9.17 ± 0.50 GPa when tested at 10 Hz, compared to 9.06 ± 0.56 GPa at 5 Hz. For the burnt sample, the storage modulus changed from 6.99 ± 1.02 GPa at 5 Hz to 7.13 ± 0.93 GPa at 10 Hz. Similar behavior was also reported for the loss modulus. The slight uptick in the moduli as a function of testing frequency is consistent with the expected response of the polymer matrix, where an increase in frequency corresponds to the domination of the elastic, solid-like behavior [15]. Moreover, the rubbery modulus of the burnt samples was lower than the virgin, suggesting a disruption to the network structure, as discussed before about the increase in the amorphous nature of the epoxy matrix. A closing note is warranted at this point concerning the apparent jump (“overshoot”) in the storage modulus of the virgin specimens, regardless of the testing frequency. Menard postulated that this hump in the storage modulus before the onset of the leathery regime (i.e., the drop at Tg) corresponds to relief of residual stresses from the processing method [15]. As discussed above, the panels were fabricated using hand layup and hot press processes, inducing high residual stresses, and limiting the chain mobility below Tg. As the temperature increases during the DMA testing, the chain mobility increases to allow the chains to move to a lower energy state and, in turn, releasing the residual stresses. Thus, the localized increase in the temperature during the fire event and the subsequent free convection cooling resulted in the annealing of the deployed panels, relieving the residual stresses, and eliminating the pre-Tg hump. Notably, the fire-induced annealing process reduced the dynamic mechanical properties in the glassy and rubbery regimes, as discussed above.
The difference in the magnitude of the effective moduli (|E*|virgin − |E*|burnt) was calculated for each dataset collected at different testing frequencies and plotted in Figure 1c based on |E* | = √ (E’2 + E”2), where the effective modulus (|E* |) is a function of both the storage (E’) and loss (E”) moduli. Excluding the leathery regime, 100 °C < T < 150 °C, the change in the effective modulus was 24 ± 5% on average, with the moduli of the specimens extracted from the burnt samples lagging from their virgin counterparts. This is in good agreement with the results discussed above and consistent with our previous investigations of the same composite panels [11]. There was a significant difference between the virgin and burnt samples in the leathery regime, reaching up to an 80% difference. The dichotomy of the moduli in the leathery regime favored the burnt specimens over their virgin counterparts, such that the moduli of the latter was consistently inferior to the former between 120 and 140 °C. That is to say, the fire-induced annealing of the composite skins was believed to result in an apparent plasticization of the polymer matrix, hence, increasing the effective modulus of the burnt samples within the leathery regime. Such behavior is also consistent with attributes of thermosets, such as intolerance to heating due to the interlocking of the chains, as will be shown later in the FTIR spectra.
Figure 2 is a collage of SEM micrographs of the exposed surface of the virgin specimen (Figure 2a), virgin specimen after DMA testing (Figure 2b), oil-contaminated area of the burnt specimen after DMA testing (Figure 2c), and a contamination-free area of the same burnt specimen also after DMA testing (Figure 2d). Before embarking on the SEM results, two clarifying notes are due. First, an emphasis is given to comparing the surface morphology after the DMA testing to delineate the effect of the gradual increase in temperature due to the flexural testing protocol in the DMA and a sudden, localized rise in temperature corresponding to the fire-event in deployment on the morphology. Second, two adjacent areas on the surface of the burnt specimen were observed under the SEM to substantiate the localized effect of the power explosion fire-event on the performance of these composite panels in field deployment, whereas the micrograph in Figure 2c was taken a few millimeters away from Figure 2d, showing a vastly different morphology. The morphology of the micrograph in Figure 2d is characteristically analogous to the micrograph in Figure 2b, where the former is of the burnt specimen while the latter is of the virgin specimen, both acquired after DMA testing. The SEM micrograph of the virgin and untested specimen, Figure 2a, explicates the rough morphology of the surface due to the curing using the heated press. Figure 2a also demonstrates the intermixing of the continuous and chopped fibers on the surface; the latter appear to have been added to the epoxy matrix during manufacturing as an additional reinforcement. Figure 2b shows an SEM micrograph of one of the DMA tested virgin specimen, subjected to a gradual increase in temperature up to 210 °C. Figure 2b reveals the continuous fibers extending across the surface and comparatively smoother morphology than the micrograph in Figure 2a. The morphology change is associated with the increase in temperature and the corresponding relief of process-induced stresses.
The micrographs in Figure 2c,d explicate the combined effect of the power line explosion fire-event and gradual increase in temperature during DMA testing on the surface morphology. Here, one area (Figure 2c) exhibited notable oil contamination during deployment, resulting in visually noticeable burn marks on the surface. In contrast, a contamination-free area of the same sample (Figure 2d) is characteristically similar to the micrograph in Figure 2b of the virgin sample. The micrograph in Figure 2c depicts a higher presence of chopped fibers and absence of continuous fibers, which may have receded into the skin due to the significant, localized increase in temperature during the fire event before the activation of the fire-retardant agent that extinguished the fire and limited further potential damage. Notably, the covered underground vault also limited the supply of oxygen and helped in the quick extinction of the fire due to the power line explosion. Figure 2c also portrays some of the bubbles due to the oil-contamination burst because of the increase in temperature while other bubbles in the same vicinity remained intact, signifying the limited lingering time of the fire event. On the other hand, Figure 2d shows a residue of the fire-retardant agent added during the manufacturing process, which was believed to help suppress the spread of the fire and limit its effect to small regions. The manufacturing voids shown in Figure 2d were observed before using optical microscopy as reported in [11], due to the entrapped air bubble and the volatiles that escaped during the manufacturing process from the epoxy curing. The sharpness of the void edges demonstrates the limited effect of the fire since the edges resemble the character of the as-manufactured panels. Notably, these voids were also present in the virgin panels and, hence, their association with the matrix curing process. Lastly, Figure 2d shows the continuous fibers extending across the surface similar to the virgin samples, indicating that the fire event did not result in excessive sagging of the matrix and prevented fiber fracture. The continuity of the fiber and lack of evidence of delamination or interface issues corroborate the results from our previous studies [11].
Figure 3 shows the EDS results, corresponding to specific areas from the SEM micrographs shown in Figure 2, respectively, ascertaining the elemental composition of the different composite specimens studied herein. A compilation of the elemental composition of each specimen is included in Appendix A. At the onset of this section, it is important to note that the EDS results are used qualitatively to delineate the effect of the fire event while providing supporting evidence to the results from other methods. Evident from the EDS compositional spectra shown in Figure 3 and listed in Table A1 is the amorphous nature of the composite samples given the broad diversity of reported chemical elements, including aluminum, bromine, and silicon, to name a few. Generally, each spectrum, irrespective of the specimen conditions, contained all expected elements based on the constituents used in the fabrication of the composites, as discussed in the previous section. The EDS spectra reported here are also in excellent agreement with those reported in [21,22,23]. Since alumina trihydrate was added as a fire-retardant agent, the appearance of aluminum and oxygen traces in the EDS spectra is justified. It is important to note that despite the exposure of the burnt samples to the fire event, aluminum persisted in their corresponding EDS spectra, corroborating the previous conclusion that the fire was quickly extinguished. Similarly, bromine, used as a fire-retardant agent formulated into the epoxy resin, in all the spectra shown in Figure 3, adds additional evidence to the short lifetime of the fire event, reducing the damage potential, as discussed before. It is worth noting that the existence of aluminum and bromine even in the burnt specimen with oil-contamination after DMA testing at high temperature indicates the suitability of these composite panels for extended deployment since the fire-retardant reagents are at comparable levels as their counterparts, which were unexposed to the fire-event. The EDS characterization was performed over multiple regions on the samples, and the results were in good accordance with those reported herein.
The EDS spectra also revealed additional elemental compositions in all the investigated sample conditions, including C, Na, Mg, Si, and Ca. The average weight percentages of some of these elements exhibited a substantial (in some cases) change, as quantitatively reported in Table A1. For example, the weight percentage of carbon increased from 50.63 ± 9.00% in the virgin specimen after DMA testing to 62.13 ± 2.17% in the burnt specimens with oil contamination. An increase in the carbon is expected due to the exposure to the fire event, where locations with oil-contamination reporting higher percentage of carbon than elsewhere (see Table A1). The weight percentage of silicon also changed slightly from 5.9 ± 3.81% in the virgin specimen to 3.76 ± 1.02% and 4.31 ± 0.46% for the burnt specimen, indicating that the glass fibers may have experienced orientation change during the fire event due to the localized increase in temperature. The change in glass fiber orientation has been postulated above by assuming the receding of the fibers into the matrix given the relatively high temperature during the fire [24]. Hence, the EDS results confirm the potential change in orientation, corroborating with the mechanical data. In all, the study of the EDS spectra and the SEM micrographs show that the operating conditions did not significantly dismember the elemental structure of the composite panels; hence, their deployment may be extended given no other damages incurred that may compromise the structural integrity of the panels [5,25].
The chemical degradation of the epoxy matrix was also investigated using FTIR spectroscopy. Figure 4 plots the transmission of infrared light through virgin and burnt specimens. The spectra in Figure 4 are in good agreement with those reported before in the literature of similar composite material [26,27]. Most of the peaks found in the virgin sample were also present in the burnt samples except for a strong peak at 1010 cm−1 and a moderate peak at 1720 cm−1, corresponding to the ester carboxyl group. Additionally, a few small peaks from 3620 to 3500 and from 795 to 740 cm−1, corresponding to the Al(Al)OH bonds of the flame retardant, were absent in the burnt specimen, but present in the virgin samples [28,29] The FTIR spectra reveals loss of the flame retardant and some chemical degradation of the vinyl ester due to combustion. Any cleavage of the ester backbone polymer is a likely contributor to the mechanical softening observed in Figure 1.
Finally, the characteristics of the glass fibers in the epoxy resin matrix were further analyzed using X-ray diffraction. Figure 5 is a plot of the XRD spectra of the same four composite skins samples studied above. There is an additional (010) alumina trihydrate peak at 2θ = 18.4°, which was truncated since it has a much higher intensity than the existing peak; hence, its inclusion would have dwarfed the remaining peaks. The broad underlying peak centered around 2θ ≈ 20° is characteristic of the E-Glass/Epoxy composite and is in good agreement with other XRD analyses reported in the literature [30,31,32,33]. This broad peak indicates the uniform distribution of the glass fibers within the epoxy matrix and highlights the amorphous nature of the composite [21,30]. Generally, all the major sharp peaks in the virgin specimen are due to the Gibbsite phase of the fire-retardant agent, alumina trihydrate [34]. Contrary to the EDS results, the peaks associated with alumina trihydrate disappeared from the burnt specimen XRD spectra irrespective of the presence or absence of oil contamination, suggesting the fire may have consumed the surface-level fire-retardant agent. The discrepancy in the results is associated with the difference in the penetration depth of the XRD and EDS approaches. Nonetheless, E-Glass fibers and the epoxy matrix structure appear to be mostly unaffected by the fire event since the amorphous peak persisted in all of the XRD spectra, further substantiating the results discussed above.
4. Conclusions
The results of multiscale characterization of E-Glass/Epoxy composite panels were reported herein. In doing so, the dynamic mechanical properties, surface morphology, and elemental compositions of previously deployed panels in a fire incident and as-fabricated panels were measured and compared. Deployed samples exhibited a ~23% decrease of the storage modulus (in the glassy regime at ≤100 °C), while the loss modulus remained nearly unchanged when tested at 5 Hz. This reduction is attributed to the localized increase in temperature during the fire event, resulting in permanent loosening of the epoxy matrix chains or an increase in the amorphous phase. These mechanical results were found to be consistent at different testing frequencies as well as in the rubbery regime at temperatures ≥150 °C. SEM micrographs and associated EDS spectra explicate the morphology of the surface due to the fabrication processes, deployment conditions, and the effect of DMA testing. The results exemplify the effectiveness of the fire-retardant agent additives in quickly extinguishing the fire, given the persistent presence of bromine and aluminum in the EDS spectra on burnt samples. The EDS results also showed an increase in carbon content on burnt samples with oil contamination. The chemical structural analysis using XRD confirmed the amorphous nature of the composite and the activation of the fire-retardant agent during the fire incident. In summary, the operating conditions did not significantly compromise the mechanical integrity of the E-Glass/Epoxy composite, thus, demonstrating the viability of an extended deployable lifetime of the fire-exposed composite panels. Future research will focus on the combined effect of humidity (due to the heavy raining seasons), long-term static loading, and significant change in temperature on these composite panels’ long-term performance.
Author Contributions
Conceptualization, G.Y.; methodology, G.Y.; formal analysis, G.Y., S.N., N.U.H. and C.G.; investigation, G.Y., S.N. and N.U.H.; data curation, G.Y., S.N. and N.U.H.; analysis validation and verification, S.N., N.U.H. and C.G.; writing—original draft preparation, G.Y. and C.G.; writing—review and editing, S.N., N.U.H. and C.G.; visualization, S.N. and N.U.H.; supervision, G.Y.; project administration, G.Y.; funding acquisition, G.Y. All authors have read and agreed to the published version of the manuscript.
Funding
The research leading to these results was supported in part by the United States Department of Defense under Grant Agreement No. W911NF-14-1-0039 and internal funds from San Diego State University.
Institutional Review Board Statement
Not applicable.
Informed Consent Statement
Not applicable.
Data Availability Statement
The data presented in this study are available on request from the corresponding author. The data are not publicly available due to privacy.
Acknowledgments
The authors are grateful for the previous support from Armorcast Products Inc. for supplying the prefabricated panels as well as their previous financial support. The guidance and discussion with Wally Sunnaa, P.E. and Vahe Karamardian are greatly appreciated. The authors finally acknowledge the use of equipment at the San Diego State University Electron Microscopy Facility acquired by NSF instrumentation grant DBI-0959908 and the use of the X-ray diffractometer at San Diego State University funded by the Department of Geological Sciences.
Conflicts of Interest
The authors declare no conflict of interest.
Appendix A

Table A1.
Elemental Compositions extracted from the EDS spectra of virgin and deployed E-Glass/Epoxy composite samples.
Table A1.
Elemental Compositions extracted from the EDS spectra of virgin and deployed E-Glass/Epoxy composite samples.
| Element | Weight % | Atomic % | ||||
|---|---|---|---|---|---|---|
| Virgin-DMA | Burnt-No-Oil | Burnt-Oil | Virgin-DMA | Burnt-No-Oil | Burnt-Oil | |
| C K | 50.63 ± 9 | 46.99 ± 7.97 | 62.13 ± 2.17 | 65.21 ± 9.53 | 62.14 ± 7.8 | 72.7 ± 1.6 |
| O K | 27.27 ± 5.21 | 29.14 ± 5.79 | 26.12 ± 1.09 | 26.56 ± 5.77 | 29.23 ± 6.84 | 22.96 ± 1.23 |
| Na K | 0.22 ± 0.19 | 0.38 ± 0.14 | 0.16 ± 0.14 | 0.15 ± 0.13 | 0.27 ± 0.11 | 0.09 ± 0.08 |
| Mg K | 0.11 ± 0.19 | - | - | 0.07 ± 0.13 | - | - |
| Al K | 3.1 ± 2.69 | 1.68 ± 0.3 | 1.75 ± 0.23 | 1.81 ± 1.57 | 0.99 ± 0.14 | 0.92 ± 0.14 |
| Si K | 5.9 ± 3.81 | 3.76 ± 1.02 | 4.31 ± 0.46 | 3.31 ± 2.21 | 2.12 ± 0.48 | 2.16 ± 0.26 |
| S K | - | 0.25 ± 0.12 | - | - | 0.12 ± 0.06 | - |
| Cl K | 0.16 ± 0.02 | 0.28 ± 0.06 | 0.15 ± 0.03 | 0.07 ± 0.01 | 0.13 ± 0.03 | 0.06 ± 0.01 |
| K K | 0.11 ± 0.09 | 0.15 ± 0.05 | 0.08 ± 0.07 | 0.04 ± 0.04 | 0.06 ± 0.02 | 0.03 ± 0.03 |
| Ca K | 2.62 ± 1.78 | 7.75 ± 2.68 | 1.36 ± 0.19 | 1.03 ± 0.72 | 3.11 ± 1.17 | 0.48 ± 0.07 |
| Ti K | 0.32 ± 0.1 | 0.5 ± 0.18 | 0.13 ± 0.02 | 0.1 ± 0.02 | 0.17 ± 0.06 | 0.04 ± 0.01 |
| Fe K | 0.06 ± 0.1 | 0.5 ± 0.19 | 0.36 ± 0.09 | 0.02 ± 0.03 | 0.14 ± 0.06 | 0.09 ± 0.02 |
| Cu K | - | 0.21 ± 0.18 | 0.19 ± 0.09 | - | 0.05 ± 0.05 | 0.04 ± 0.02 |
| Br K | 7.66 ± 4.06 | 6.51 ± 1.06 | 1.94 ± 0.46 | 1.47 ± 0.74 | 1.3 ± 0.23 | 0.34 ± 0.09 |
| Pt L | 1.83 ± 0.36 | 1.9 ± 0.07 | 1.33 ± 0.15 | 0.14 ± 0.03 | 0.16 ± 0.02 | 0.1 ± 0.01 |
References
- Wang, R.M.; Zheng, S.R.; Zheng, Y.P. Polymer Matrix Composites and Technology; Woodhead Publishing: Cambridge, UK, 2011; ISBN 9780857092212. [Google Scholar]
- Bank, L.C. Composites for Construction: Structural Design with FRP Materials; John Wiley & Sons, Inc.: Hoboken, NJ, USA, 2006; ISBN 0471681261. [Google Scholar]
- Guedes, R.M. Durability of polymer matrix composites: Viscoelastic effect on static and fatigue loading. Compos. Sci. Technol. 2007, 67, 2574–2583. [Google Scholar] [CrossRef]
- Guedes, R.M. Lifetime predictions of polymer matrix composites under constant or monotonic load. Compos. Part A Appl. Sci. Manuf. 2006, 37, 703–715. [Google Scholar] [CrossRef]
- Youssef, G. Creep analysis of E-glass/vinyl-ester laminated composites for underground vault structures. Polym. Compos. 2020, 41, 3564–3574. [Google Scholar] [CrossRef]
- Correia, J.R.; Branco, F.; Gonilha, J.; Silva, N.; Camotim, D. Glass fibre reinforced polymer pultruded flexural members: Assessment of existing design methods. Struct. Eng. Int. J. Int. Assoc. Bridg. Struct. Eng. 2010, 20, 362–369. [Google Scholar] [CrossRef]
- Sa, M.F.; Gomes, A.M.; Correia, J.R.; Silvestre, N. Creep behavior of pultruded GRFP elements-Part 1: Literature review and experimental study. Compos. Struct. 2011, 93, 2450–2459. [Google Scholar] [CrossRef]
- Karataş, M.A.; Gökkaya, H. A review on machinability of carbon fiber reinforced polymer (CFRP) and glass fiber reinforced polymer (GFRP) composite materials. Def. Technol. 2018, 14, 318–326. [Google Scholar] [CrossRef]
- Gopinath, A.; Senthilkumar, M.; Babu, A. Evaluation of Mechanical Properties and Microstructure of Polyester and Epoxy Resin Matrices Reinforced with Jute, E-glass and coconut Fiber. Mater. Today Proc. 2018, 5, 20092–20103. [Google Scholar] [CrossRef]
- Sharada Prabhakar, C.; Ramesh Babu, P. Characterization of mechanical and thermal properties of high strength glass epoxy and rayon carbon phenolic composites. Mater. Today Proc. 2018, 5, 26898–26903. [Google Scholar] [CrossRef]
- Youssef, G.; Pessoa, G.; Nacy, S. Effect of elevated operating temperature on the dynamic mechanical performance of E-glass/epoxy composite. Compos. Part B Eng. 2019, 173, 106937. [Google Scholar] [CrossRef]
- Im, K.-H.; Cha, C.-S.; Park, J.-W.; Cha, Y.-H.; Jung, I.-Y.Y.-A. Effect of temperatures on impact damage and residual strength of CFRP composite laminates. In AIP Conference Proceedings; American Institute of Physics: College Park, MD, USA, 2000; pp. 1247–1254. [Google Scholar]
- Idicula, M.; Boudenne, A.; Umadevi, L.; Ibos, L.; Candau, Y.; Thomas, S. Thermophysical properties of natural fibre reinforced polyester composites. Compos. Sci. Technol. 2006, 66, 2719–2725. [Google Scholar] [CrossRef]
- Choy, C.L. Thermal Conductivity of Polymers. Polymer 1977, 18, 984–1004. [Google Scholar] [CrossRef]
- Menard, K.P. Dynamic Mechanical Analysis: A Practical Introduction; CRC Press: Boca Raton, FL, USA, 1999; ISBN 0849386888. [Google Scholar]
- Youssef, G.; Whitten, I. Dynamic properties of ultraviolet-exposed polyurea. Mech. Time-Depend. Mater. 2017, 21, 351–363. [Google Scholar] [CrossRef]
- Menczel, J.D.; Prime, R.B. (Eds.) Thermal Analysis of Polymers: Fundamentals and Applications; John Wiley & Sons, Inc.: Hoboken, NJ, USA, 2009; ISBN 9781787284395. [Google Scholar]
- Turi, E.A. (Ed.) Thermal Characterization of Polymeric Materials; Academic Press: New York, NY, USA, 1981. [Google Scholar]
- Feng, J.; Guo, Z. Effects of temperature and frequency on dynamic mechanical properties of glass/epoxy composites. J. Mater. Sci. 2016, 51, 2747–2758. [Google Scholar] [CrossRef]
- Bershtein, V.A.; Egorov, V.M.; Kemp, T.J. Differential Scanning Calorimetry of Polymers: Physics, Chemistry, Analysis, Technology; Ellis Horwood Ltd.: New York, NY, USA, 1994. [Google Scholar]
- Adekomaya, O.; Adediran, A.A.; Adama, K. Characterization and morphological properties of glass fiber reinforced epoxy composites fabricated under varying degrees of hand lay-up techniques. J. Appl. Sci. Environ. Manag. 2018, 22, 110–114. [Google Scholar] [CrossRef] [Green Version]
- Laura, D.M.; Keskkula, H.; Barlow, J.W.; Paul, D.R. Effect of glass fiber surface chemistry on the mechanical properties of glass fiber reinforced, rubber-toughened nylon 6. Polymer 2002, 43, 4673–4687. [Google Scholar] [CrossRef]
- Swetha, C.; Kumar, R. Quasi-static uni-axial compression behaviour of hollow glass microspheres/epoxy based syntactic foams. Mater. Des. 2011, 32, 4152–4163. [Google Scholar] [CrossRef]
- Allred, R.E.; Wesson, S.P.; Shin, E.E.; Inghram, L.; McCorkle, L.; Papadopoulos, D.; Wheeler, D.; Sutter, J.K. The influence of sizings on the durability of high-temperature polymer composites. High Perform. Polym. 2003, 15, 395–419. [Google Scholar] [CrossRef] [Green Version]
- Bledzki, A.K.; Mamun, A.A.; Volk, J. Physical, chemical and surface properties of wheat husk, rye husk and soft wood and their polypropylene composites. Compos. Part A Appl. Sci. Manuf. 2010, 41, 480–488. [Google Scholar] [CrossRef]
- Prabhakar, M.N.; Song, J.I. Influence of chitosan-centered additives on flammable properties of vinyl ester matrix composites. Cellulose 2020, 27, 8087–8103. [Google Scholar] [CrossRef]
- Wu, Z.; Li, S.; Liu, M.; Wang, Z.; Liu, X. Liquid oxygen compatible epoxy resin: Modification and characterization. RSC Adv. 2015, 5, 11325–11333. [Google Scholar] [CrossRef]
- Mittal, G.; Dhand, V.; Ryu, J.I.; Rhee, K.Y.; Kim, H.J.; Jung, D.H. Fabrication of modified MMT/Glass/Vinylester multiscale composites and their mechanical properties. J. Nanomater. 2015, 2015. [Google Scholar] [CrossRef] [Green Version]
- Schroeder, P. Infrared spectroscopy in clay science. Teach. Clay Sci. 2002, 11, 181–206. [Google Scholar]
- Hao, Y.; Liu, F.; Shi, H.; Han, E.; Wang, Z. The influence of ultra-fine glass fibers on the mechanical and anticorrosion properties of epoxy coatings. Prog. Org. Coat. 2011, 71, 188–197. [Google Scholar] [CrossRef]
- Kanny, K.; Mohan, T.P. Resin infusion analysis of nanoclay filled glass fiber laminates. Compos. Part B Eng. 2014, 58, 328–334. [Google Scholar] [CrossRef]
- Quaresimin, M.; Salviato, M.; Zappalorto, M. Fracture and interlaminar properties of clay-modified epoxies and their glass reinforced laminates. Eng. Fract. Mech. 2012, 81, 80–93. [Google Scholar] [CrossRef]
- Tjong, S.C. Structural and mechanical properties of polymer nanocomposites. Mater. Sci. Eng. R Rep. 2006, 53, 73–197. [Google Scholar] [CrossRef]
- Reddy, T.R.; Thyagarajan, K.; Montero, O.A.; Reddy, S.R.L.; Endo, T. X-Ray Diffraction, Electron Paramagnetic Resonance and Optical Absorption Study of Bauxite. J. Miner. Mater. Charact. Eng. 2014, 2, 114–120. [Google Scholar] [CrossRef] [Green Version]
Figure 1.
(a) Thermomechanical spectra plotting the storage and loss moduli; (b) magnitude of the effective moduli, and (c) percent change in the magnitude of the effective moduli of virgin and burnt specimens as a function of temperature at 5 and 10 Hz.
Figure 1.
(a) Thermomechanical spectra plotting the storage and loss moduli; (b) magnitude of the effective moduli, and (c) percent change in the magnitude of the effective moduli of virgin and burnt specimens as a function of temperature at 5 and 10 Hz.

Figure 2.
Collage of SEM micrographs of (a) virgin E-Glass/Epoxy skin surface; (b) the surface of a virgin sample after DMA testing, and (c,d) surface of deployed specimens after DMA testing. (Micrograph c is for portion of the sample with oil contamination while micrograph d is from the same sample but from region that was contamination-free).
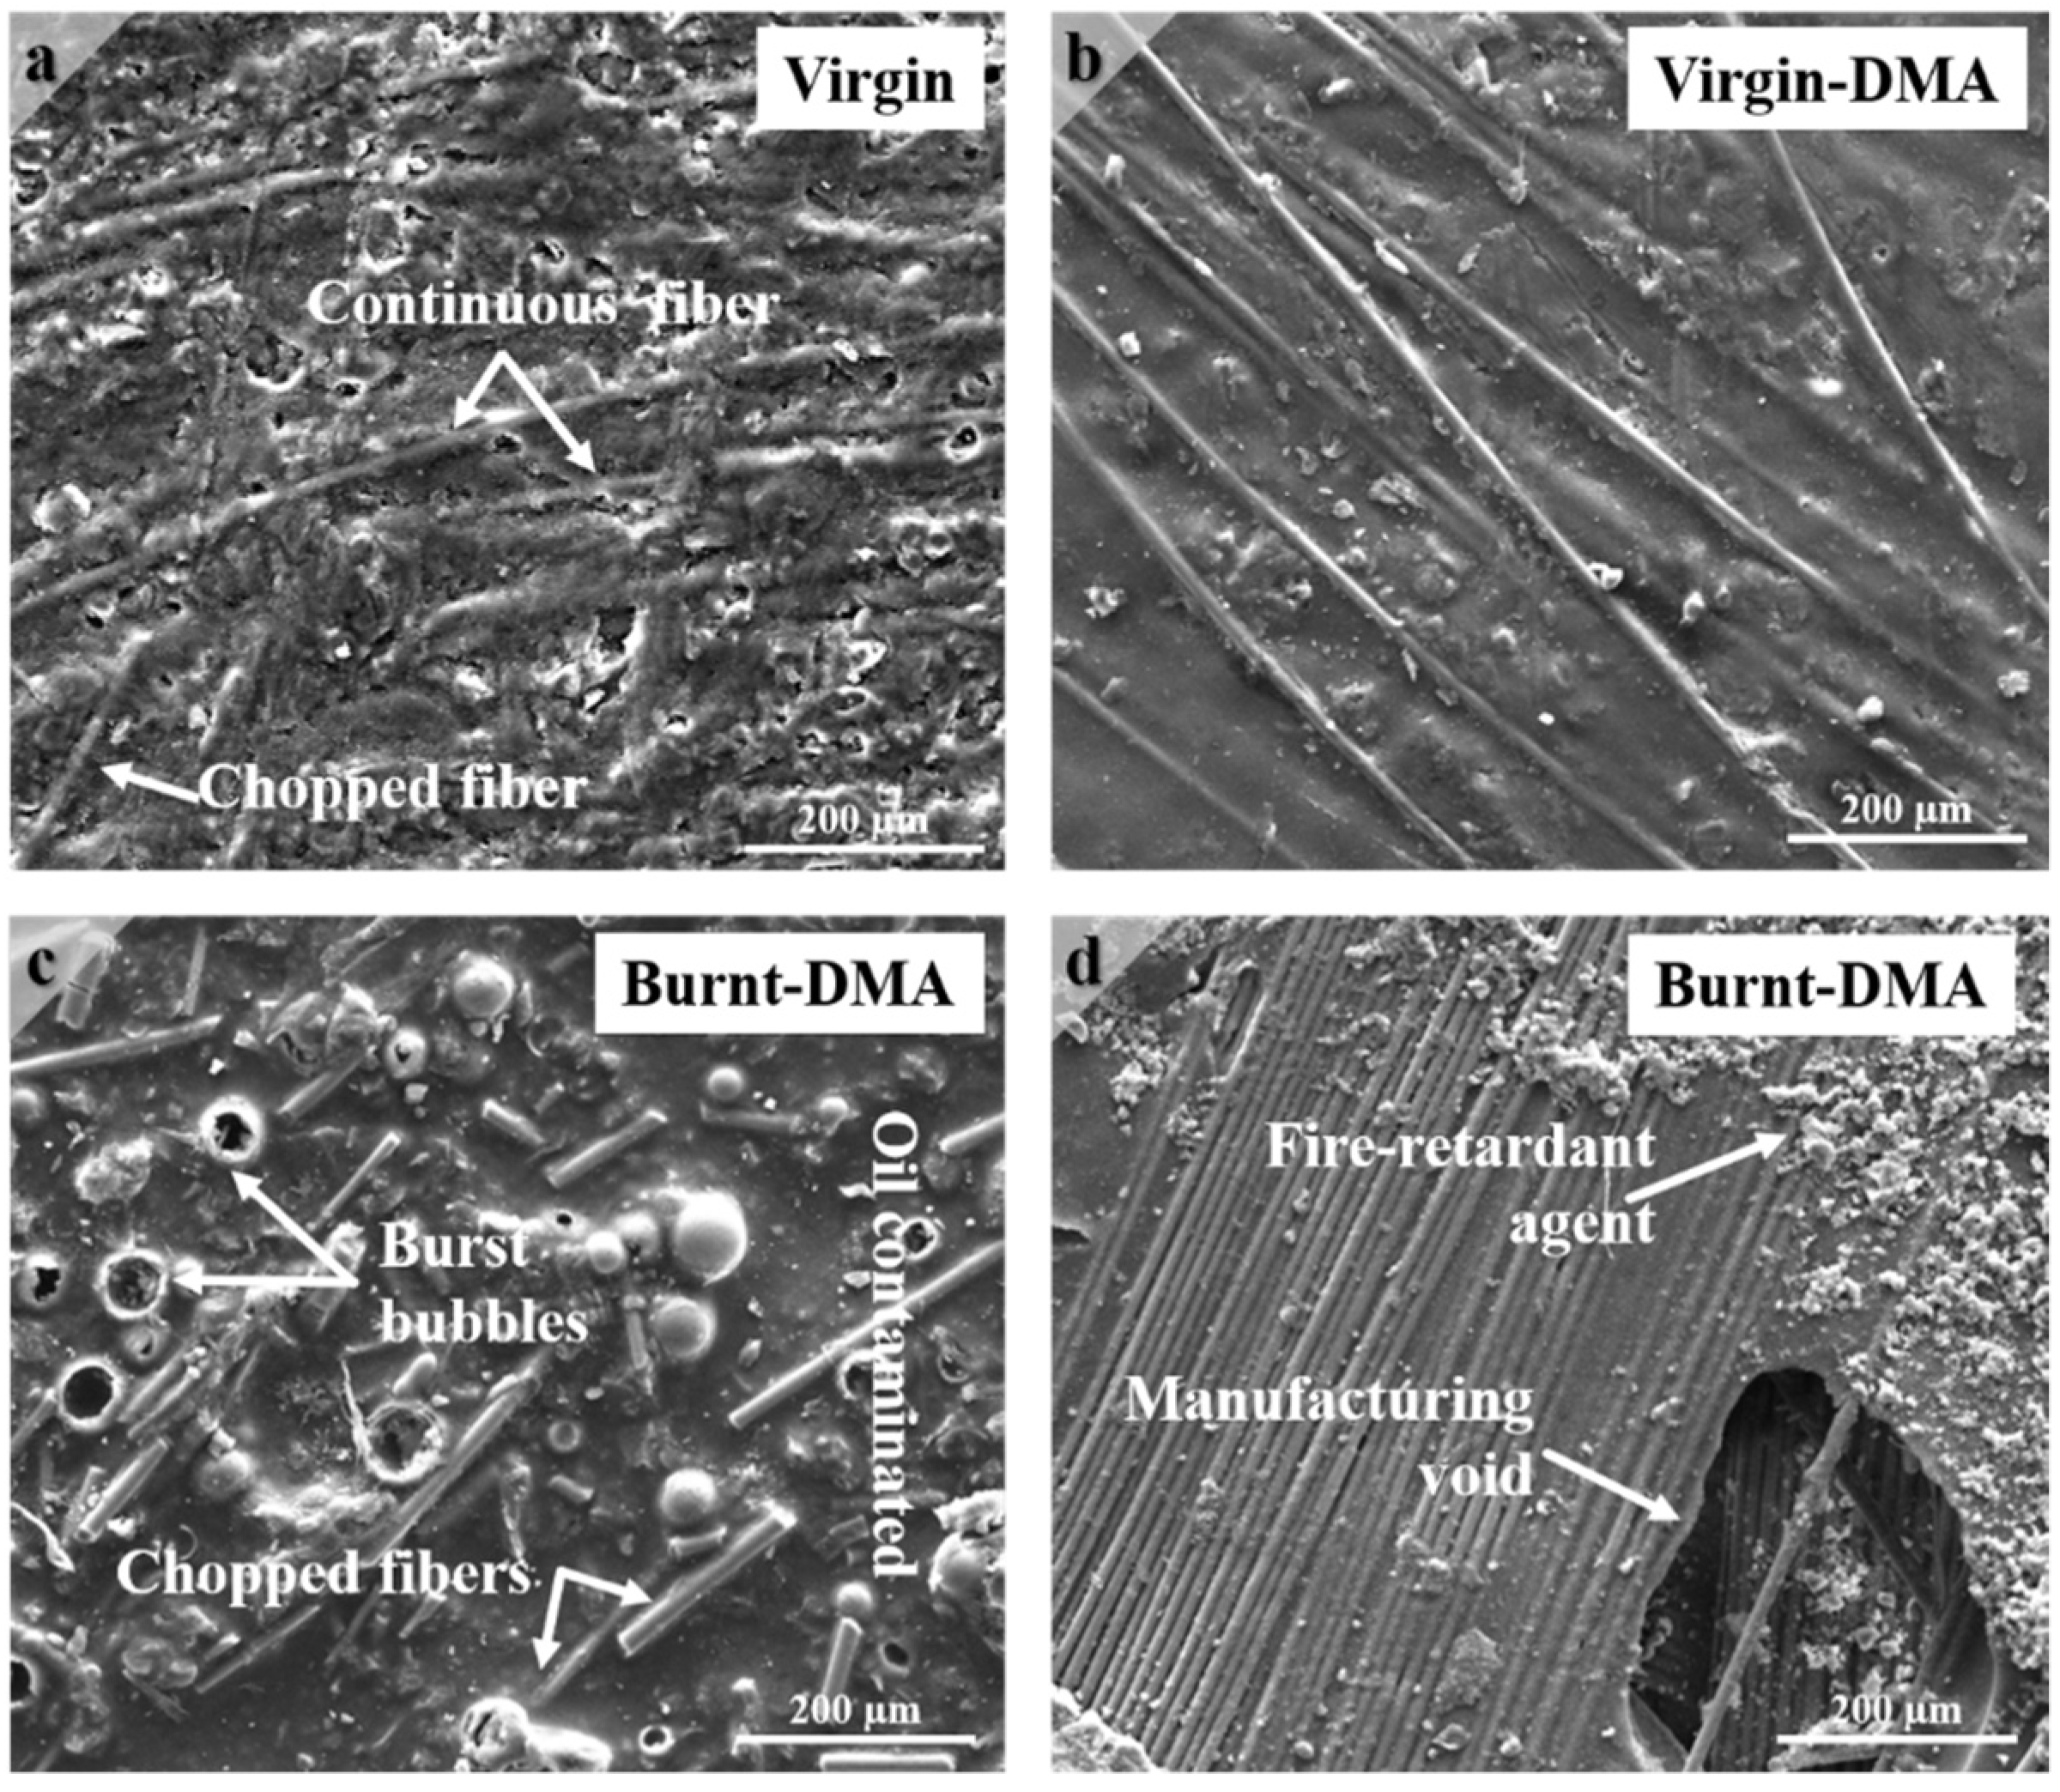
Figure 3.
SEM micrographs and the accompanying elemental composition of virgin specimen (top panel), burnt specimen contamination-free (middle panel), and burnt specimen oil-contamination (bottom panel) after DMA testing.
Figure 3.
SEM micrographs and the accompanying elemental composition of virgin specimen (top panel), burnt specimen contamination-free (middle panel), and burnt specimen oil-contamination (bottom panel) after DMA testing.
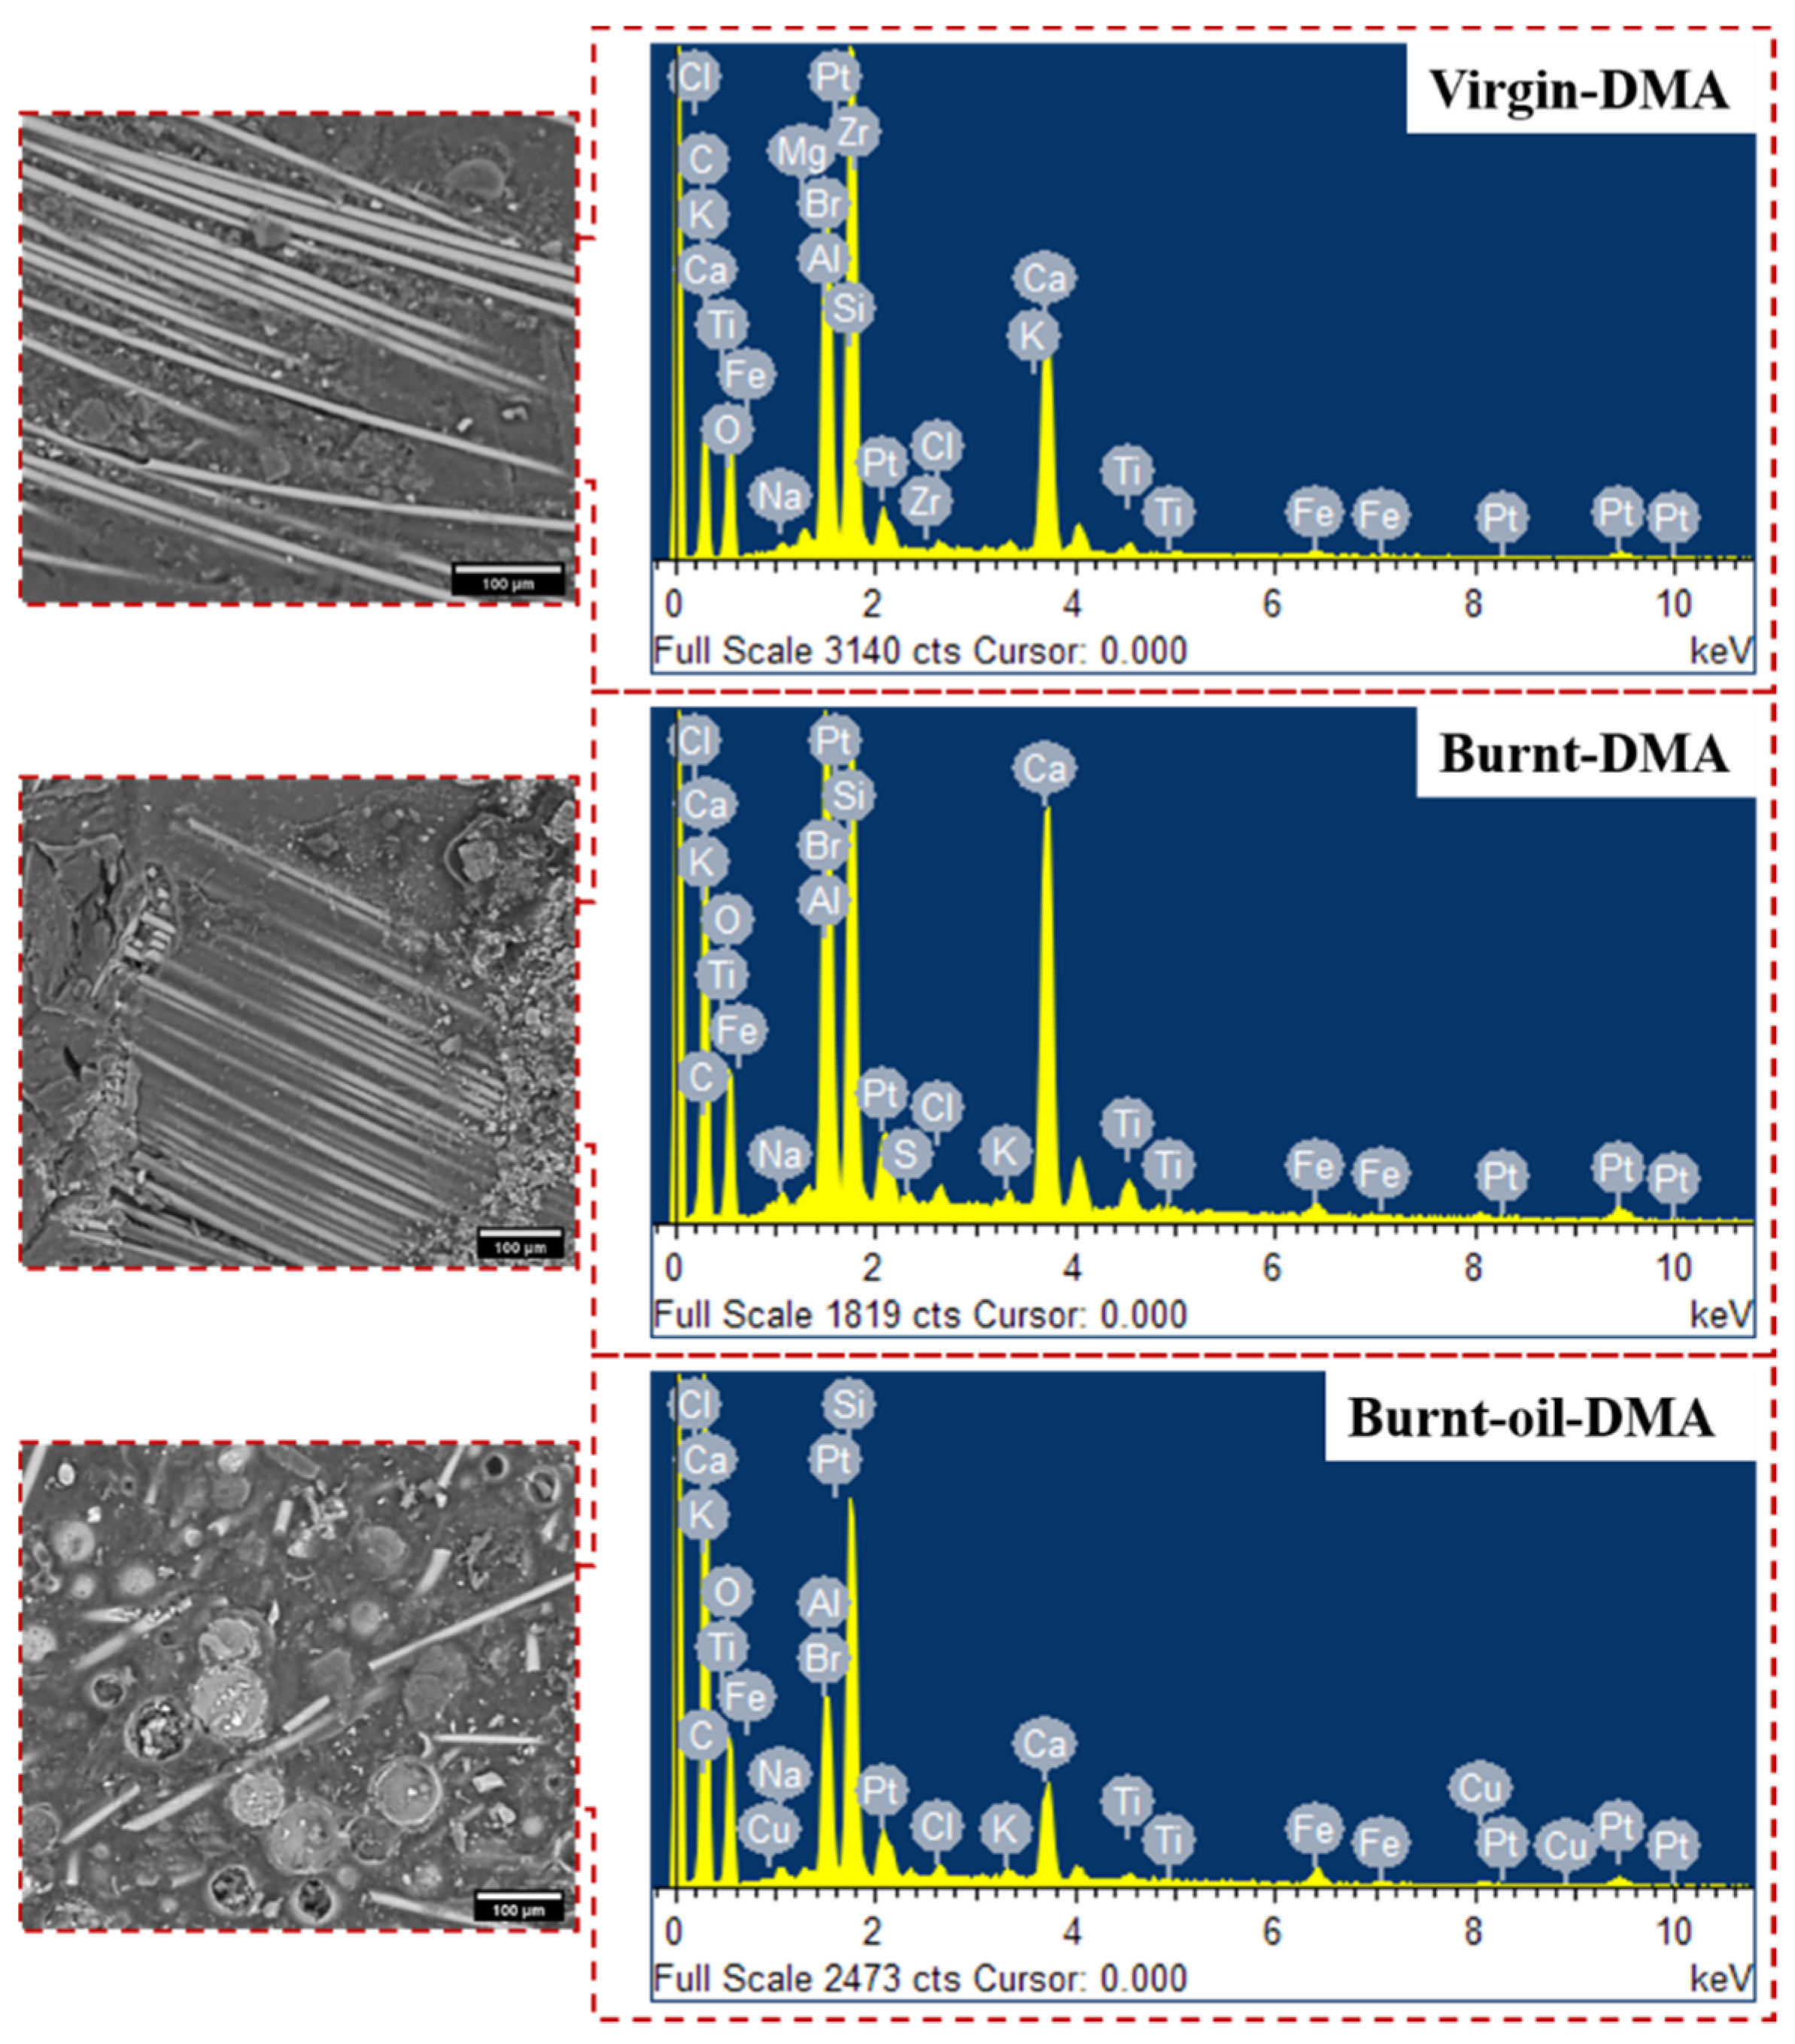
Figure 4.
FTIR transmission of virgin and burnt specimens.

Figure 5.
XRD spectral patterns of a virgin specimen and the virgin and burnt specimens after DMA testing (“Burnt” ≡ without contamination, “Burnt with oil” ≡ oil contaminated).
Figure 5.
XRD spectral patterns of a virgin specimen and the virgin and burnt specimens after DMA testing (“Burnt” ≡ without contamination, “Burnt with oil” ≡ oil contaminated).
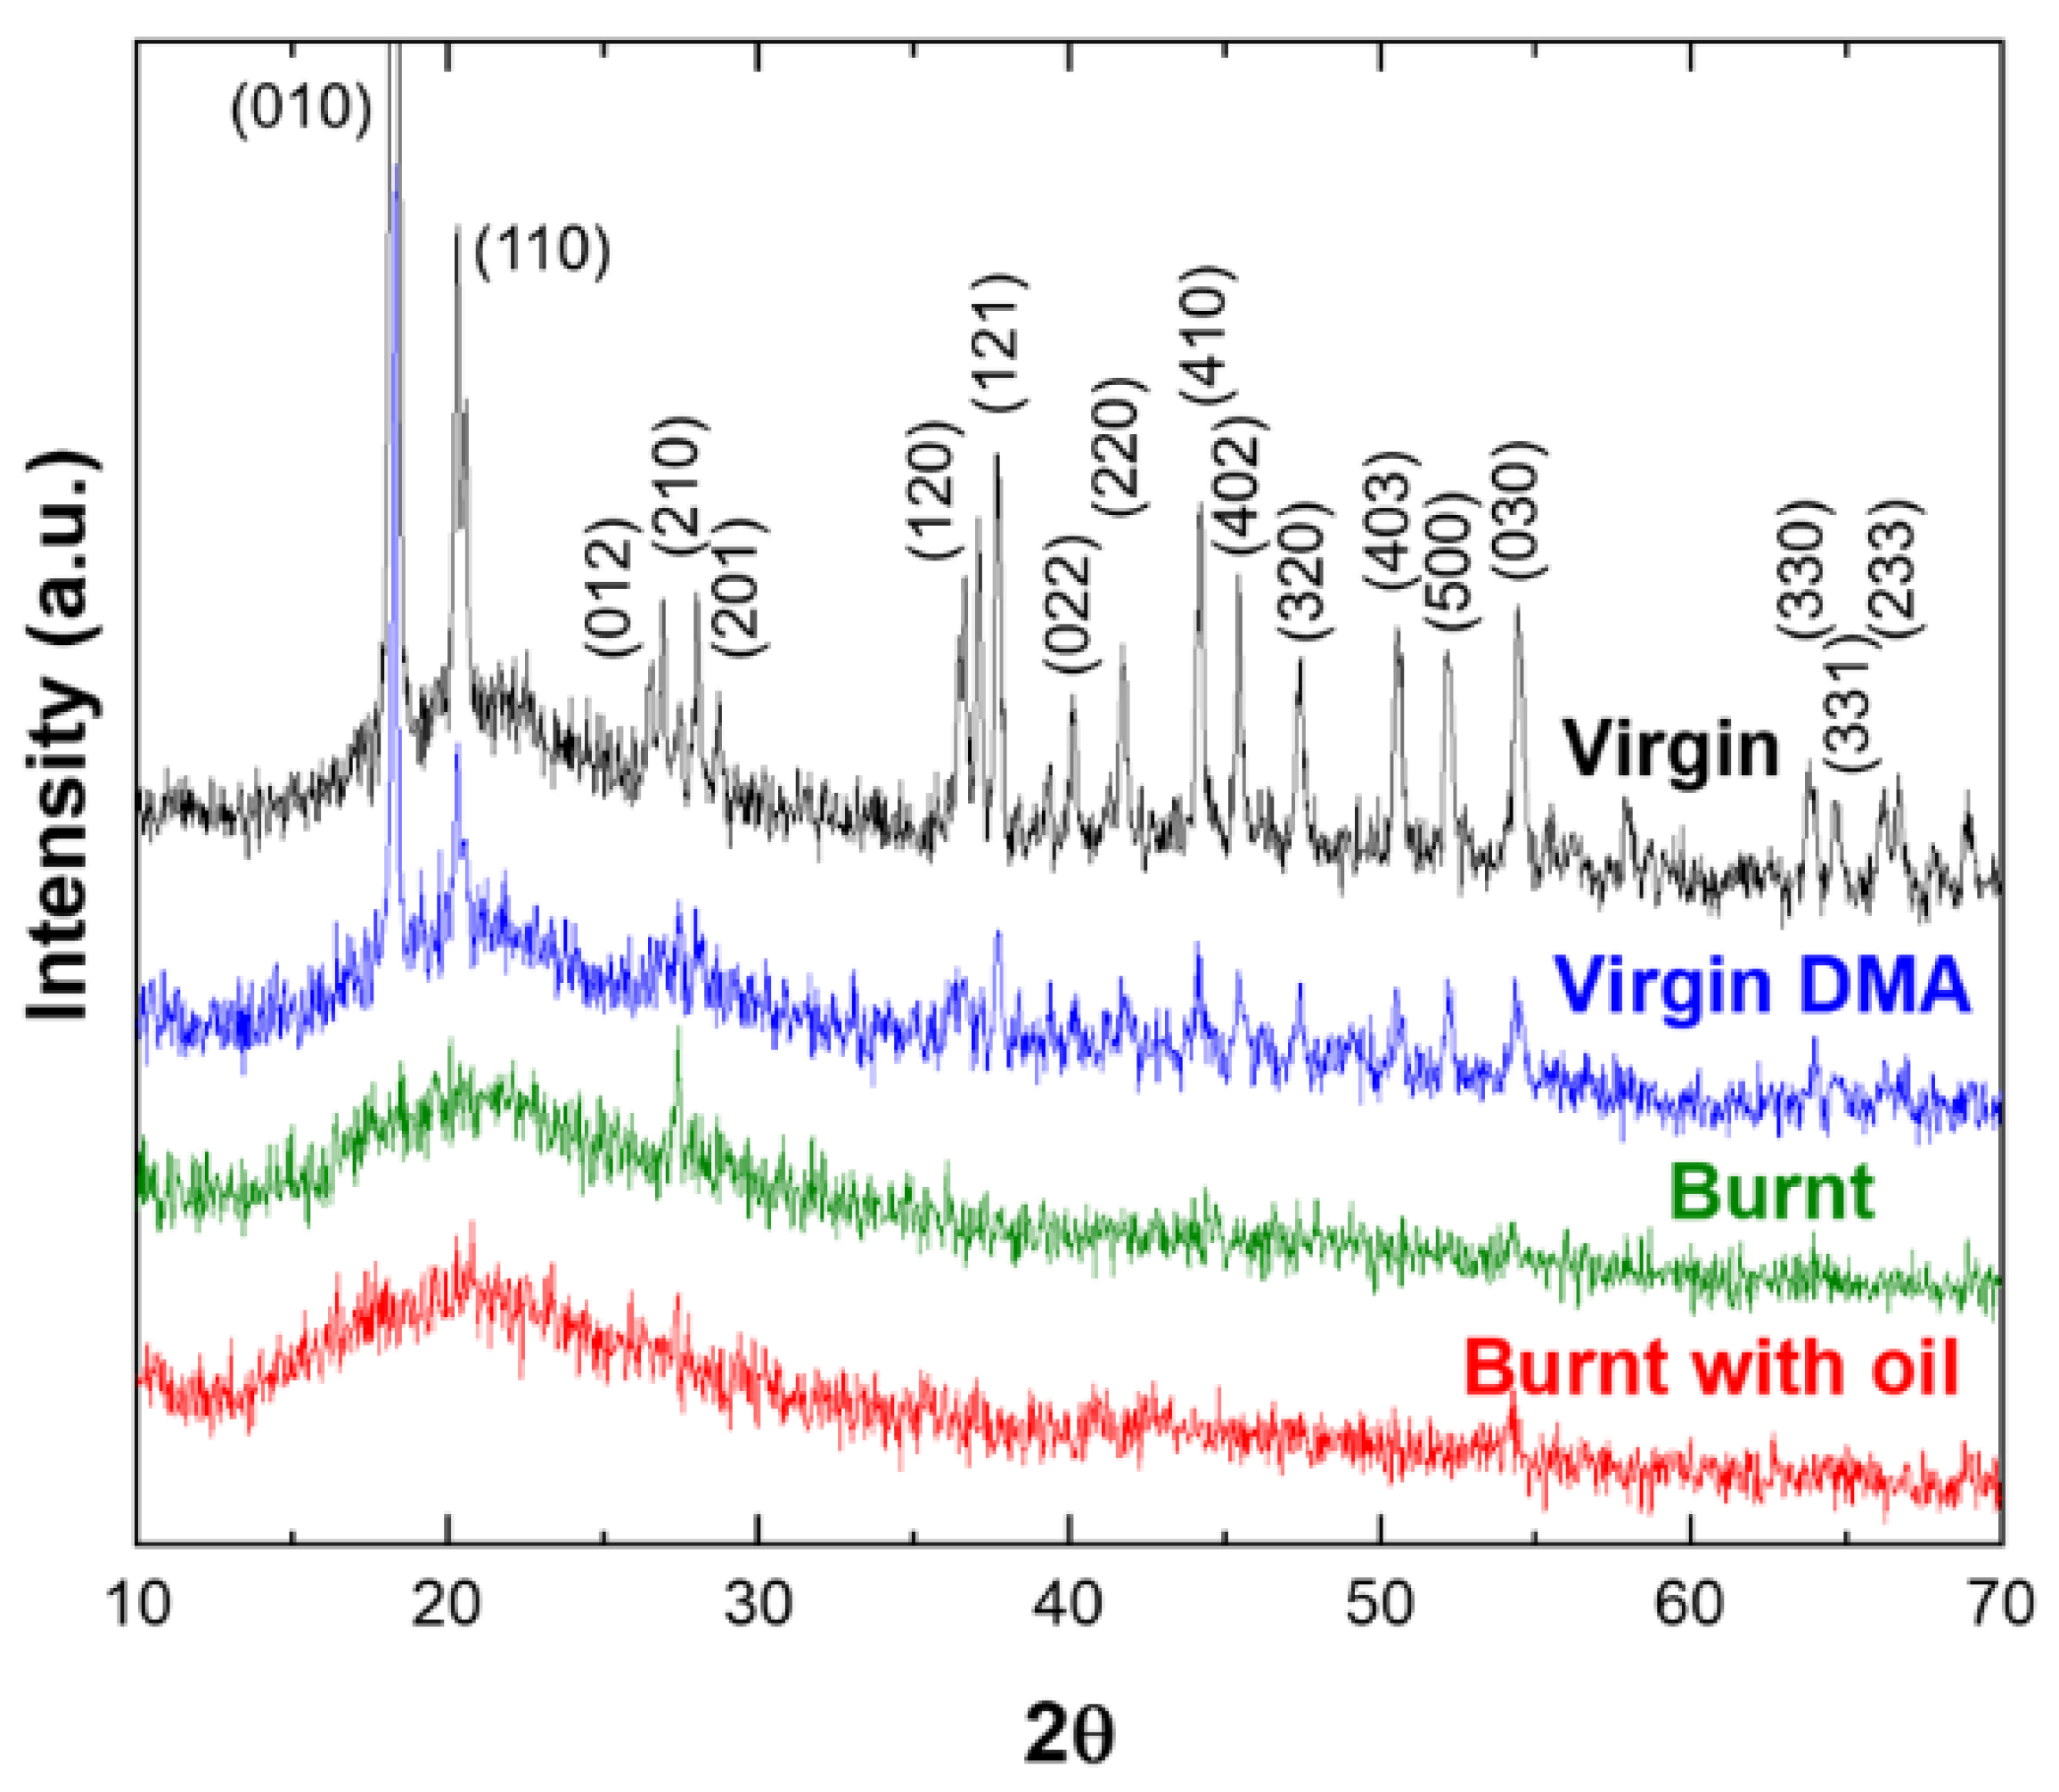
Table 1.
Samples identification code and the corresponding testing and evaluation conditions.
| Sample Label | Condition |
|---|---|
| Virgin | Specimens extracted from newly fabricated and never-deployed panels |
| Burnt | Specimens extracted for previously deployed panel in a fire event |
| DMA | Specimens (virgin or deployed) were tested in DMA from 32–210 °C |
Table 2.
Summary of the properties extracted from dynamic mechanical analyzer (DMA) testing.
| Property | Virgin | Burnt | |||
|---|---|---|---|---|---|
| Tg | 112 °C | 120 °C | |||
| Tβ | 75 °C | 75 °C | |||
| Testing Freq. | 5 Hz | 10 Hz | 5 Hz | 10 Hz | |
| E’ (≤100 °C), GPa | 9.062 ± 0.564 | 9.171 ± 0.504 | 6.992 ± 1.016 | 7.135 ± 0.935 | |
| E” (≤100 °C), GPa | 0.342 ± 0.182 | 0.340 ± 0.170 | 0.344 ± 0.188 | 0.340 ± 0.179 | |
| E’ (≥150 °C), GPa | 0.231 ± 0.008 | 0.233 ± 0.009 | 0.172 ± 0.004 | 0.174 ± 0.004 | |
| E” (≥150 °C), GPa | 0.013 ± 0.009 | 0.016 ± 0.012 | 0.006 ± 0.007 | 0.009 ± 0.012 | |
Publisher’s Note: MDPI stays neutral with regard to jurisdictional claims in published maps and institutional affiliations. |
© 2021 by the authors. Licensee MDPI, Basel, Switzerland. This article is an open access article distributed under the terms and conditions of the Creative Commons Attribution (CC BY) license (http://creativecommons.org/licenses/by/4.0/).
Share and Cite
MDPI and ACS Style
Youssef, G.; Newacheck, S.; Huynh, N.U.; Gamez, C. Multiscale Characterization of E-Glass/Epoxy Composite Exposed to Extreme Environmental Conditions. J. Compos. Sci. 2021, 5, 80. https://doi.org/10.3390/jcs5030080
AMA Style
Youssef G, Newacheck S, Huynh NU, Gamez C. Multiscale Characterization of E-Glass/Epoxy Composite Exposed to Extreme Environmental Conditions. Journal of Composites Science. 2021; 5(3):80. https://doi.org/10.3390/jcs5030080
Chicago/Turabian StyleYoussef, George, Scott Newacheck, Nha Uyen Huynh, and Carlos Gamez. 2021. "Multiscale Characterization of E-Glass/Epoxy Composite Exposed to Extreme Environmental Conditions" Journal of Composites Science 5, no. 3: 80. https://doi.org/10.3390/jcs5030080