Article

Adaptation Responses to Early Drought Stress of West Africa Sorghum Varieties

1
Centre d’Etude Régional pour l’Amélioration de l’Adaptation à la Sécheresse (CERAAS), Institut Sénégalais de Recherches Agricoles (ISRA), Route de Khombole, Thiès BP 3320, Senegal
2
Laboratoire Campus de Biotechnologies Végétales, Département de Biologie Végétale, Faculté des Sciences et Techniques, Université Cheikh Anta Diop, Dakar-Fann, Dakar BP 5005, Senegal
3
Département de Génétique et Biotechnologie, Faculté des Sciences et Techniques (FAST), Université d’Abomey-Calavi (UAC), Cotonou BP 1947, Benin
4
Institut de Recherche pour le Développement (IRD), Université de Montpellier, UMR DIADE, 911 Avenue Agropolis, BP 64501, CEDEX 5, F-34394 Montpellier, France
5
Centre de coopération Internationale en Recherche Agronomique pour le Développement (CIRAD), UMR AGAP, F-34398 Montpellier, France
*
Authors to whom correspondence should be addressed.
Agronomy 2021, 11(3), 443; https://doi.org/10.3390/agronomy11030443
Submission received: 18 December 2020 / Revised: 13 January 2021 / Accepted: 30 January 2021 / Published: 27 February 2021

Abstract

:
Sorghum is the fifth most important cereal crop world-wide and feeds millions of people in the Sahel. However, it often faces early-stage water deficit due to false onsets of rainy seasons resulting in production decrease. Therefore, developing early drought tolerant material becomes a necessity but requires a good knowledge of adaptation mechanisms, which remains to be elucidated. The present study aimed at assessing the effects of early drought stress on ten elite sorghum varieties tested over two years (2018–2019) at the National Agronomic Research Centre (CNRA) of Bambey (Senegal, West Africa). Two different water regimes (well-watered and drought stress) were applied during the dry season. Water stress was applied by withholding irrigation 25 days after sowing for one month, followed by optimal irrigation until maturity. Soil moisture measurements were performed and allowed to follow the level of stress (down to a fraction of transpirable soil water (FTSW) of 0.30 at the end of stress). An agro-physio-morphological monitoring was carried out during the experiment. Results showed highly significant effects of early drought stress in sorghum plants growth by decreasing leaf appearance, biomass, height but also yield set up. The combined analysis of variance revealed highly significant differences (p ≤ 0.01) between varieties in the different environments for most characters. Under water deficit, the variability was less strong on leaf appearance and plant height at the end of stress. The adaptation responses were related to the capacity of varieties to grow up fast and complete their cycle rather, increase the dead leaves weight, reduce photosynthesis rate, stomatal conductance, leaf transpiration and increase the roots length density. However, varieties V1, V2, V8 and V9 showed promising behavior under stress and could be suitable for further application in West Africa for sorghum breeding and farming.

1. Introduction

Plant adaptation is the key factor that will determine the severity of climate change on food production. Currently, agriculture uses 75% of total water consumption to meet the food demand and biofuel needs. Obviously, this amount will increase by 2050 due to the rising of the world population and the drought due to climate change particularly in the Sub-Saharan region [1]. Based on this projection, Ray et al. [2] suggested that the current agricultural production level must be doubled for the four key global crops that is, maize, rice, wheat and soybean as it will be done for Sorghum (Sorghum bicolor (L.) Moench), which is a staple food for millions of people in the arid and semi-arid tropical regions [3,4]. Presently, in Africa, S. bicolor is cultivated on 28.42 million hectares of land with a production estimated at 28.61 million tons [5]. This production which does not meet the demand of the population, remains unstable despite the cultural practices implemented by farmers [6,7] in the era of strong pressure on the arable land leading to soil fertility decrease explaining the low amount harvested in Senegal estimated at 291,171 tons in 2019 [8]. This low production is due to water deficit experienced by the crops which is mainly due to the irregularities in rainfall distribution exacerbated by climate change [9,10,11,12]. Drought stress can negatively affect sorghum development and yield depending on its intensity and the stage at which it occurs. Previous studies reported that drought occurring at post-flowering stage affect negatively sorghum mainly on grain yield, biomass and stem sugar accumulation [13,14,15,16]. However, very little is known about the effect of early drought stress on sorghum development and production stages. The few studies conducted in that way, reported that the occurrence of early drought stress after germination for three to four weeks duration, induced decrease in leaf appearance, transpiration and photosynthesis through leaf senescence [17,18,19]. However, the reduction of leaf area which is generally observed in plants is a drought avoidance strategy leading to reduction of water loss and inhibition of cell division [20]. Furthermore, early drought generally occurring in the transition stage to panicle initiation and structure affects negatively the flowering and production [21,22] as the first process must take place under favorable environmental conditions. In contrast, few studies have been carried out to enhance our understanding on the effect of re-watering after drought stress, especially on sorghum [23]. The ability to recover from early water deficit during re-watering can explain yield variability observed between varieties [24]. The drought recovery index (DRI) represents drought- induced recovery of the growth traits related such as biomass and height is suitable for investigating drought tolerance. According to Perrier et al. [25], the recovery capacity is an important trait for future phenotyping, genetic and breeding studies while its process and genotypic variability are poorly understood.
Root response is of prime importance to crop productivity under drought stress. This is because the root size, architecture and distribution determine the ability of plants to access and uptake the water for proper physiological functioning of shoots [26,27,28]. Thus, the sorghum ability to tolerate water shortage is also due to its roots system which can extend into the deep soil layers and its investigation through roots length density (RLD) trait measurement revealed its importance [29]. Previous studies suggested that targeting root traits is relevant for plant improvement under drought and nutrient limitation conditions leading to pay more attention to root architecture system [28,30,31] As the RLD distribution in the soil is a key factor for water and nutrient uptake [32,33]. However, its field conditions is not obvious but remain relevant to screen drought tolerant varieties based on RLD [34]. Among other methods, mapping root intersection in a soil profile by the trench profile method was identified to be more efficient and feasible to provide information on roots distribution [32,35,36]. Despite tremendous progress performed in genetic characterization of root development [37], root system architecture phenotyping remains challenging particularly in field conditions.
The severity of drought stress likely depends both on crop growth stage and its duration. Depending on the genotype, it is well documented that early maturity accessions are more sensitive to drought during vegetative stage than the late maturity genotypes due to the fact that the stress occurs before the panicle initiation phase when plants have more ability to recover after re-watering [21]. However, these late maturity genotypes no longer suit the farming systems of semi-arid regions because of a shortened rainy season. To overcome this constraint, it is relevant to identify early maturity varieties tolerant to drought stress. It is therefore of outmost importance to highlight how sorghum genotypes react to early drought stress; what are the mechanisms underlying drought tolerance in such genotypes and finally what are the efficient strategies useful to increase drought tolerance in sorghum grown under limited water conditions [38]. This requires to study sorghum behaviors under early season water stress and identify relevant selection criteria to facilitate the decision on the choice of varieties for cultivation but also for breeding programs.
The aim of this study was to assess the effect of early water deficit in sorghum, in order to determine the main adaptation mechanisms and interesting methods and criteria for the agro-physiological characterization of sorghum in water deficit conditions.

2. Materials and Methods

2.1. Plant Material

The plant material consisted of ten (10) elite varieties of sorghum from Mali, Nigeria and Senegal countries of West Africa. Table 1 shows the characteristics of the ten sorghum varieties used in this study. Theses varieties differ in terms of days to maturity (90 to 128 days for maturity), height (120 to 450 cm height), response to inputs (hybrid vs. open pollinated varieties caudatum or guinea) and yield (2 to 4.5 t ha−1). These varieties are widely cultivated by the farmers due to their adaptability and agronomic characteristics [39,40,41].

2.2. Methods

2.2.1. Experimental Conditions

The trials were conducted in the experimental field of the “Centre National de Recherches Agricoles” (CNRA) of Bambey, of the “Institut Sénégalais de Recherches Agricoles” (ISRA) (14°42′ N; 16°28′ W, 20 m above sea level). The trials were carried out on a sandy soil (Sand = 94.2%, Silt = 3.5%, Clay = 2.3%) in 2018 and 2019 during the cold dry season (October-February) in a field where cowpea was previously grown. Plants were watered using sprinkler irrigation system. The ploughing and harrowing were carried out before sowing to prepare the soil. The experimental design was a randomized alpha lattice design, with irrigation as the main factor and the varieties were randomly distributed in three replications in each main block. The two water treatments (well-watered and drought stress) were separated by 10 m to avoid unvoluntary irrigation of the stressed plots. For well-watered treatments, water was provided twice per week at the rate of 25 mm per irrigation until physiological maturity. However, for drought stress treatments, water stress was applied by withholding irrigation for one month from the 25th day after sowing (DAS) and thereafter, optimal irrigation was provided until physiological maturity. Overall, 350 mm were provided to the stress treatments vs. 550 mm to the well-watered ones. The weekly evapotranspiration assessed, varied between 26 to 44 mm with an average of 37.2 mm (Figure 1). Fertilizers application consisted of supplying NPK (Nitrogen, Phosphorus, Potassium) and urea following the ISRA standard recommendation. NPK (15-15-15) was applied at the dose of 150 kg ha−1 after sowing whereas urea was applied in two times, after thinning and during the vegetative phase at the dose of 50 kg ha−1 each.

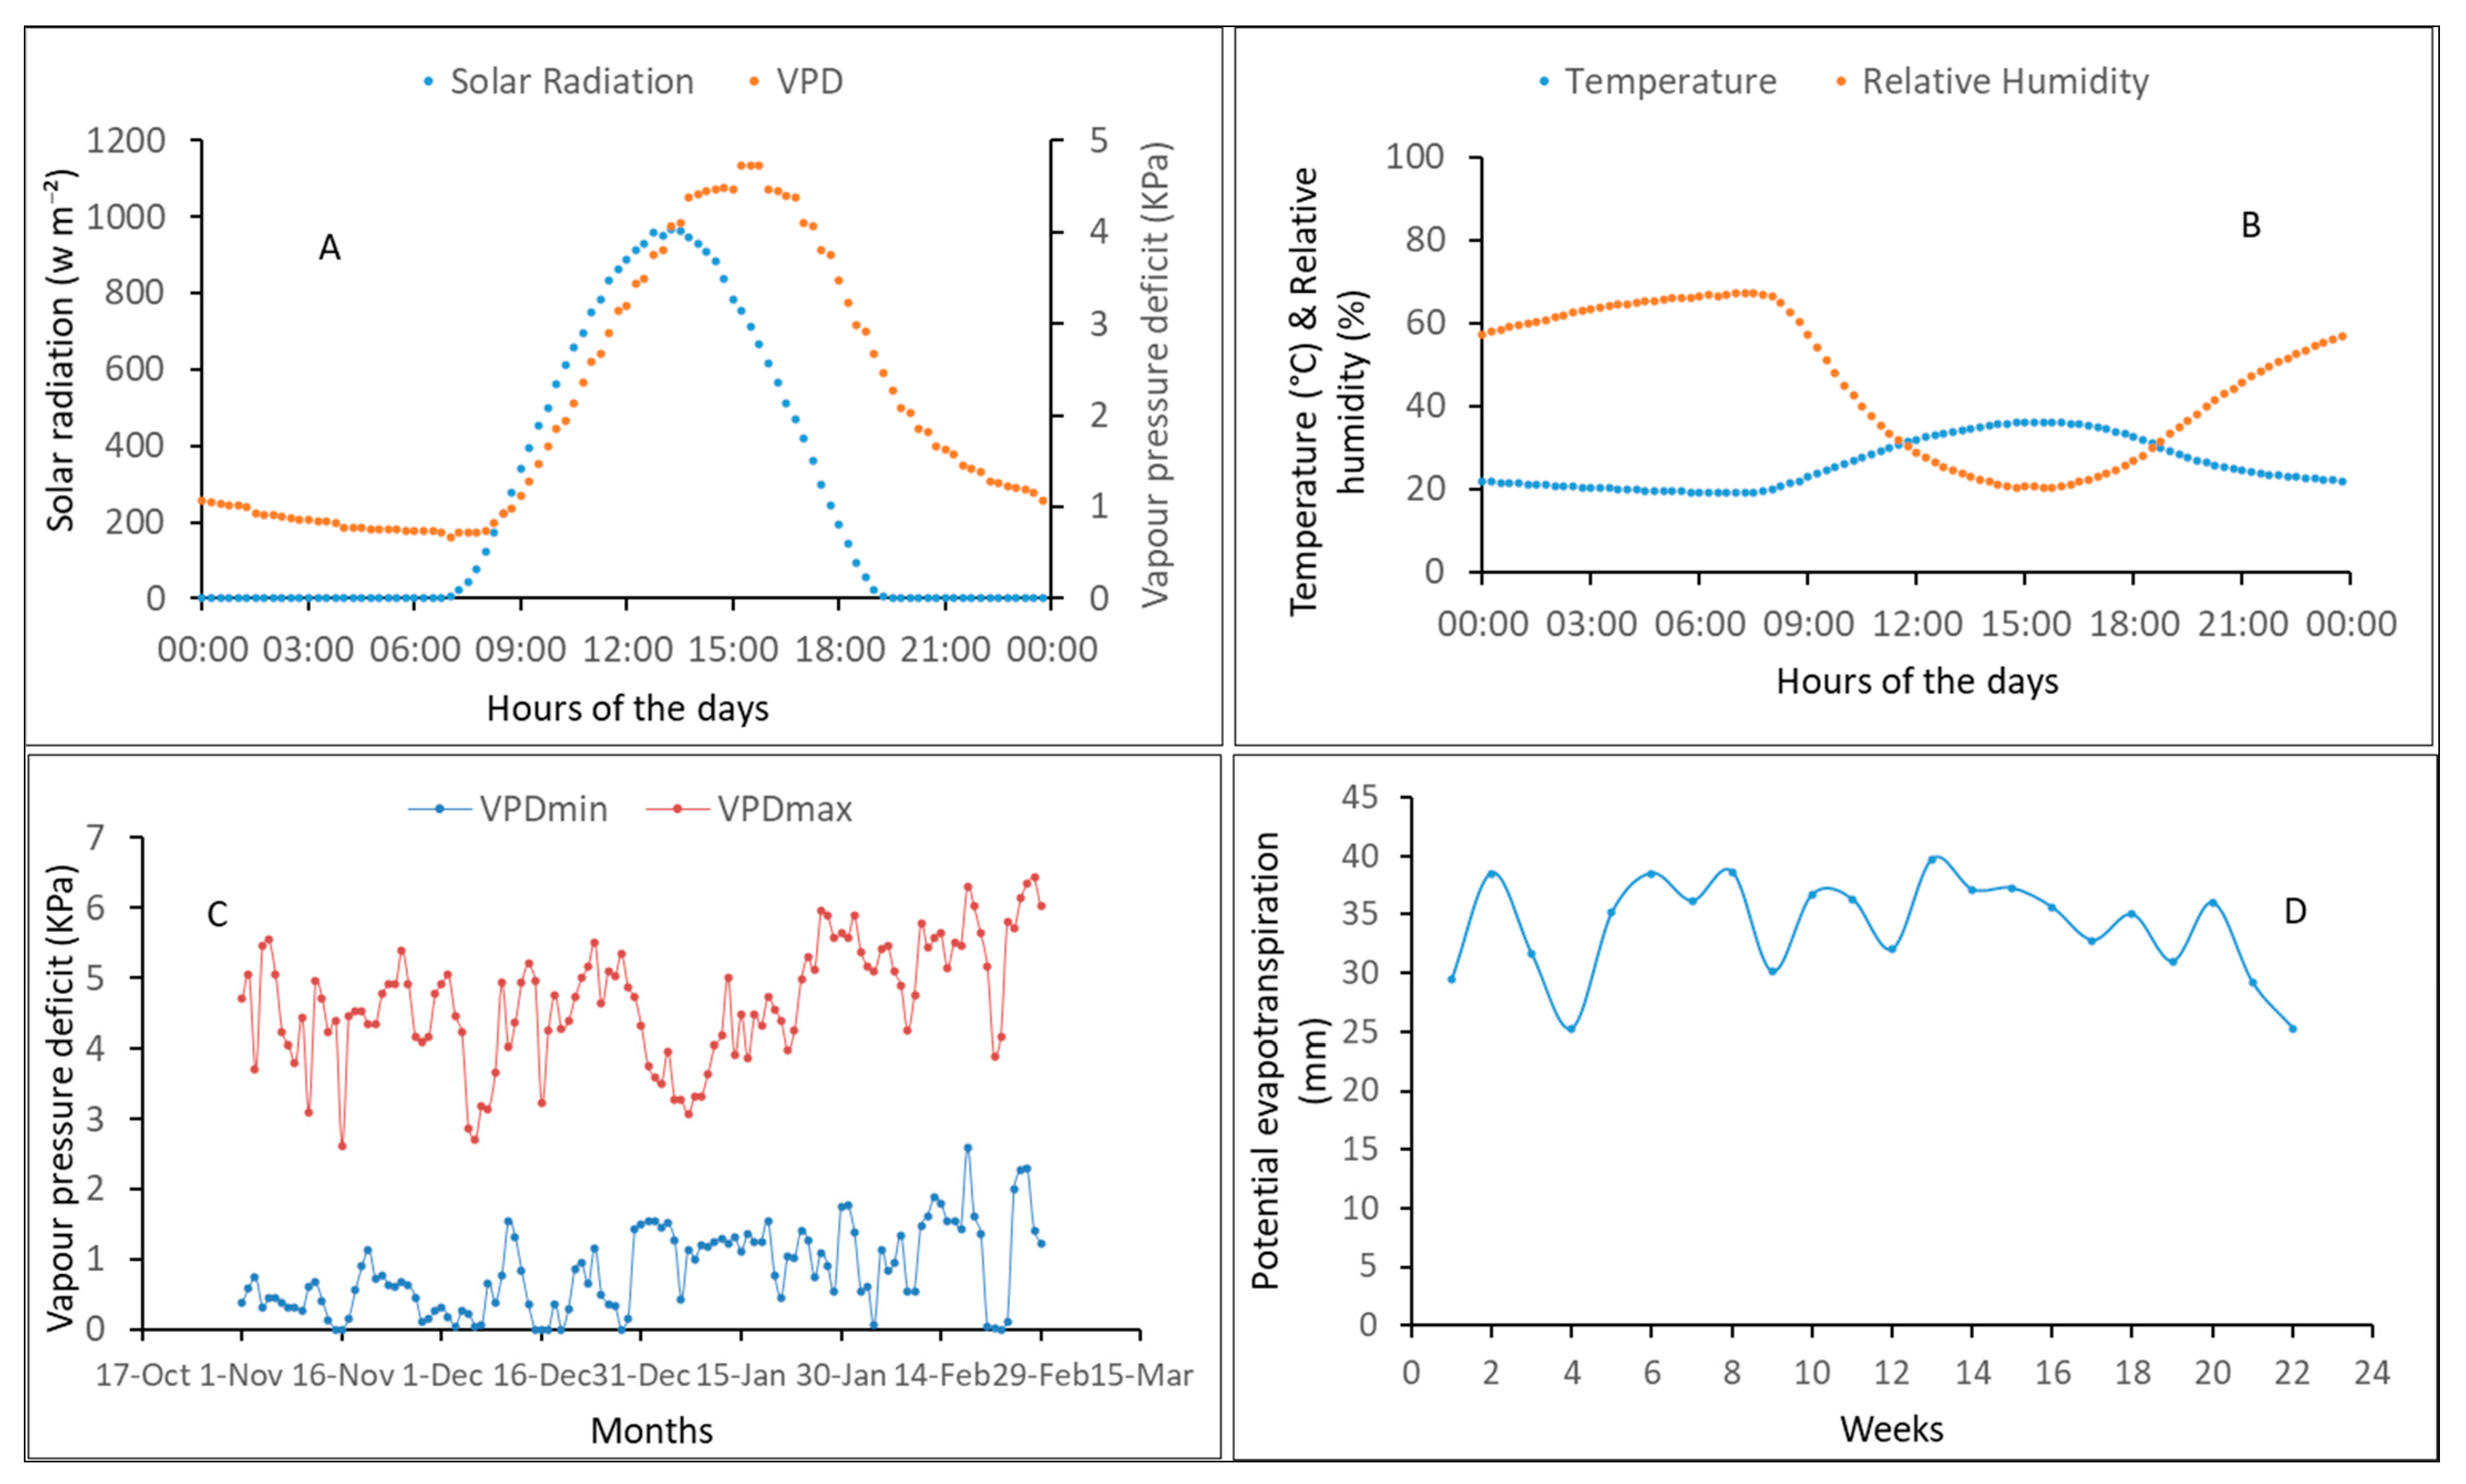
2.2.2. Weather Conditions

Solar radiation, relative humidity and temperature were measured by the weather station and allowed to compute vapor pressure deficit (VPD) and the potential evapotranspiration during both experiments periods (2018 and 2019). The dry season is characterized by high temperature (over 30 °C) and solar radiation (800 w m−2) during the day and allow having control over water supply.

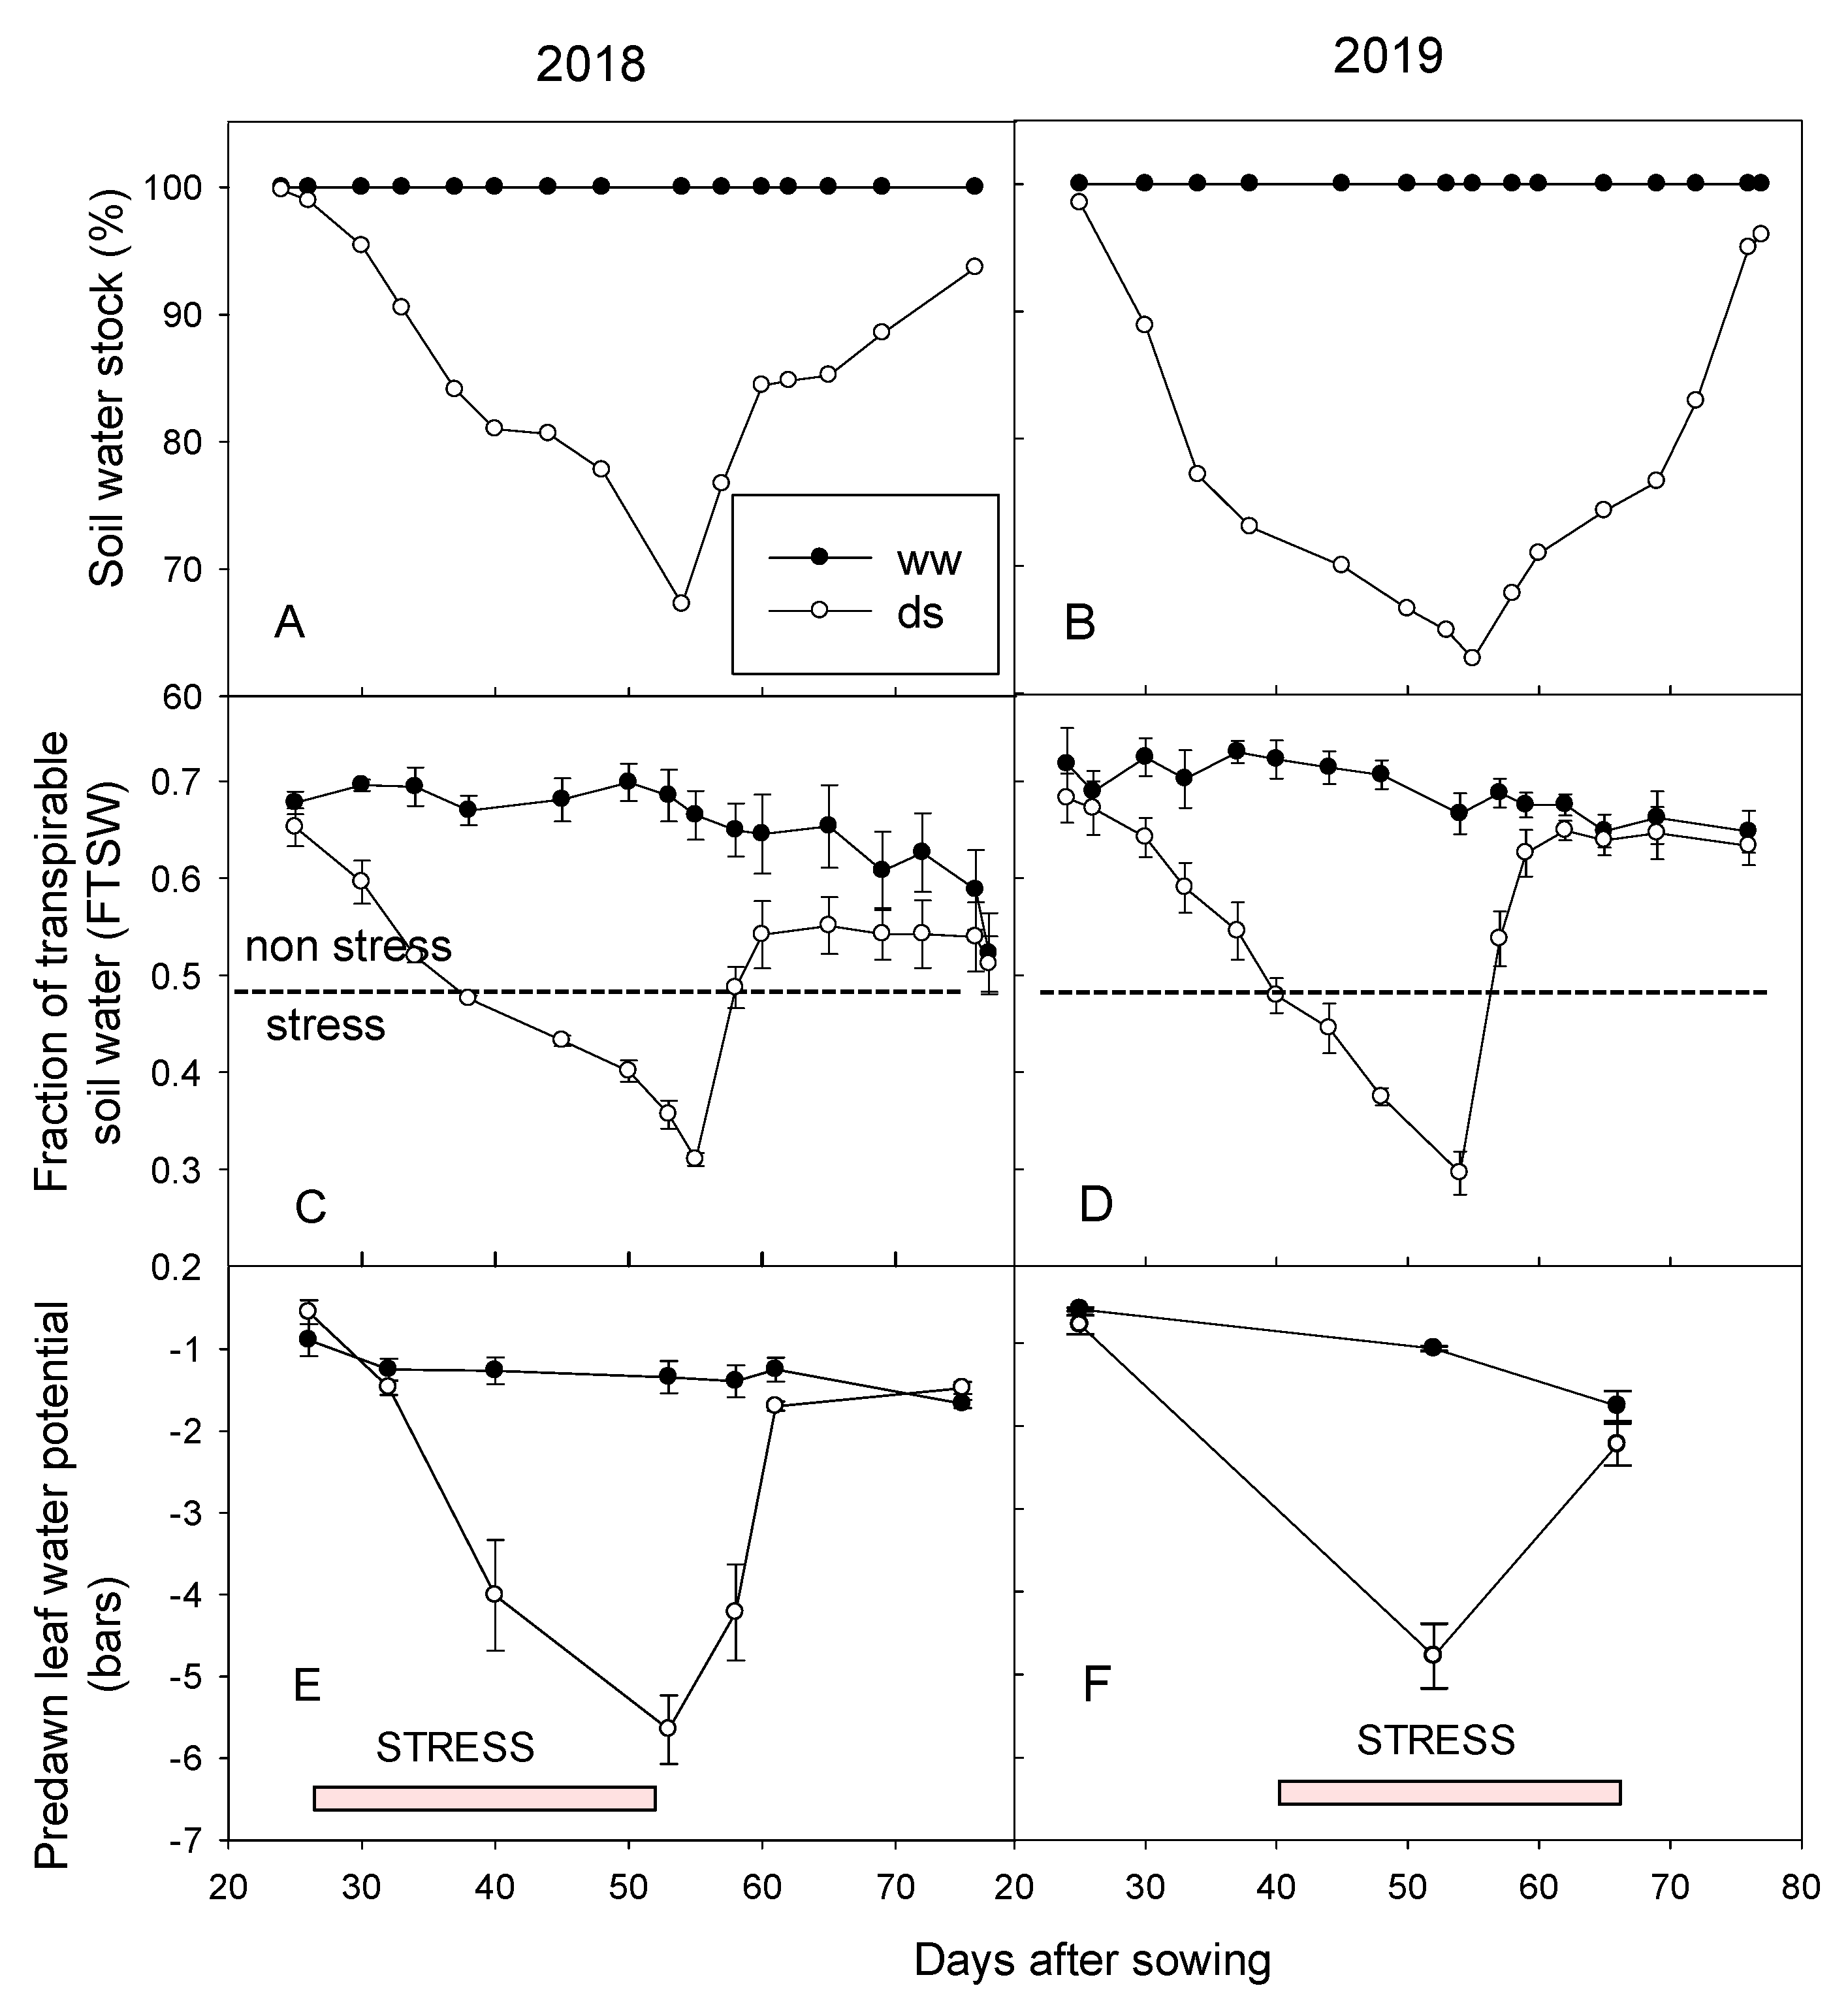
2.2.3. Characterization of the Drought Stress

Water stress in the field was monitored by measuring volumetric soil moisture using a Diviner (Diviner 2000, Sentek Pty Ltd., Stepney, South Australia) once a week during the irrigated period and twice in stress period to assess the fraction of transpirable soil water (FTSW) as previously described [42,43]. Diviner probe tubes are 1.6 m length and record water stock every 10 cm of depth. In this work, the total of 1.60 m depth water stock was considered to assess the FTSW. Soil moisture measurements allowed to follow the level of stress. The average soil water stock of the three contrasted varieties were used to evaluate the general trend. In addition, FTSW parameter was supported by the predawn leaf water potential recorded once a week using the pressure chamber (PMS Instrument Co., Corvallis, OR, USA) according to the protocol described by Peyrano et al. [44]. The predawn leaf water potential was measured before sunrise, a period during which there is a balance between plant and soil for water potential.

2.2.4. Assessment of Agro-Physiological Traits

Plant morphological traits such as the number of the appeared leaves (NLA) was counted manually and the plant height after stress (PHS) were weekly measured using a ruler (Vergez Blanchard, Romilly-sur-Andelle, France) on three tagged plants per plot. Plant photosynthesis rate (Pn), leaf temperature (Tleaf), transpiration (E) and stomatal conductance (C) were also weekly measured on the last ligulated leaf using CI340 handheld photosynthesis system (CID Bio-science, USA). Biomass production was evaluated by estimating plant dry weight (DWP) and dead leaves weight (DLW) on six plants per plot at different dates (before stress, end stress, recover). At the physiological maturity, grain yield and straw dry biomass (SDW) were measured using adventurer pro precision balance (OHAUS corporation, Pine Brook, NJ, USA).
The drought recovery index (DRI) was computed to assess the recovery performance of the studied varieties after experiencing the drought stress according to the method described by Strauss et al. [45] and Oukarroum et al. [46] on soybean and barley respectively. It was calculated for the growth traits (NLA, PHS, DWP, Pn) using the following formula:
DRI = log A+ 2 log B.
In which A is the relative trait measured at the end of the drought and B is the relative trait measured 2 weeks after re-watering. Varieties with DRI near zero have good recovery whereas those with DRI around −1 have bad recovery index [46].
The SLA was calculated as the ration between plant leaf area and biomass.

2.2.5. Roots Phenotyping

For the root traits measurement, a soil trench profile was established to estimate the number of adventitious roots and root length density as described many studies [32,34,47]. The trench profiles were dug perpendicular to the rows of seedlings and at two distances (20 then 10 cm) from the plant stem. Iron grids 60 cm length by 30 cm were used to count root impacts. Square meshes of 10 cm side length were made inside the grids to facilitate the measurement of the number of impacts. At the end, the plant was dug up for additional measurements made on the tilling tray such as the number of adventitious roots. These root measurements were done at the end of stress.

2.2.6. Statistical Analyses

An analysis of variance (ANOVA) was performed for each year (2018 and 2019) to verify statistical differences between varieties, water regimes (ww and ds) and interaction. Subsequently, a combined analysis of variance was performed to test the effect of years 2018 and 2019 and the interaction between varieties, water regime and years (varieties * water regime * years) using the method of ANOVA over combined locations suggested by Mcintosh [48]. The homogeneity between residual variances was tested using Bartlett’s test [49]. Treatment means were compared using the Least Significant Difference (LSD) at the 5% level of probability. RLD was modeled on the basis of measurements of root intersections density (RID) on a vertical perpendicular plane within a sorghum row because this method is most commonly used for studying roots in a soil profile. Relationships between RLD and RID were evaluated taking the slope, standard error of the slope (SE), intercept and regression (R2) into account. Principal components analysis (PCA) associated with a hierarchical clustering analysis were performed to obtain the behavioral groups using the packages FactoMineR [50] and Factoextra [51]. Data analysis was performed using R software version 3.6.0 [52].

3. Results

3.1. Measured Weather Conditions during the Experiments

The results presented in Figure 1 showed a high evaporative demand during these dry seasons with VPD data that reached 5 KPa and solar radiation 966 w m−2 during the day (Figure 1A,C). The maximum of air temperature and relative humidity recorded were 36 °C and 67% respectively (Figure 1B) while the minimum recorded were 19 °C and 20%. The weekly potential evapotranspiration ranged between 25 to 37 mm (Figure 1D).

3.2. Drought Stress Affected the Fraction of Transpirable Soil Water and Predawn Leaf Water Potential

During irrigation period, FTSW and predawn leaf water potential showed a very low variation and revolved around 0.7 and −1.5 bars, respectively (Figure 2). However, when the non-irrigated plots were let dry down, FTSW and predawn leaf water potential decreased progressively and reached 0.3 and −5 bars, respectively, showing an effective drought stress experience occurring between 35 and 55 DAS or between the 10th and 30th day after the onset of drought stress. Thereafter, after resuming irrigation, theses parameters increased again and stabilized around the initial values with a slight drop (0.6 and 2 for FTSW and predawn leaf water potential respectively).

3.3. Response of Sorghum Varieties to Early Water Deficit

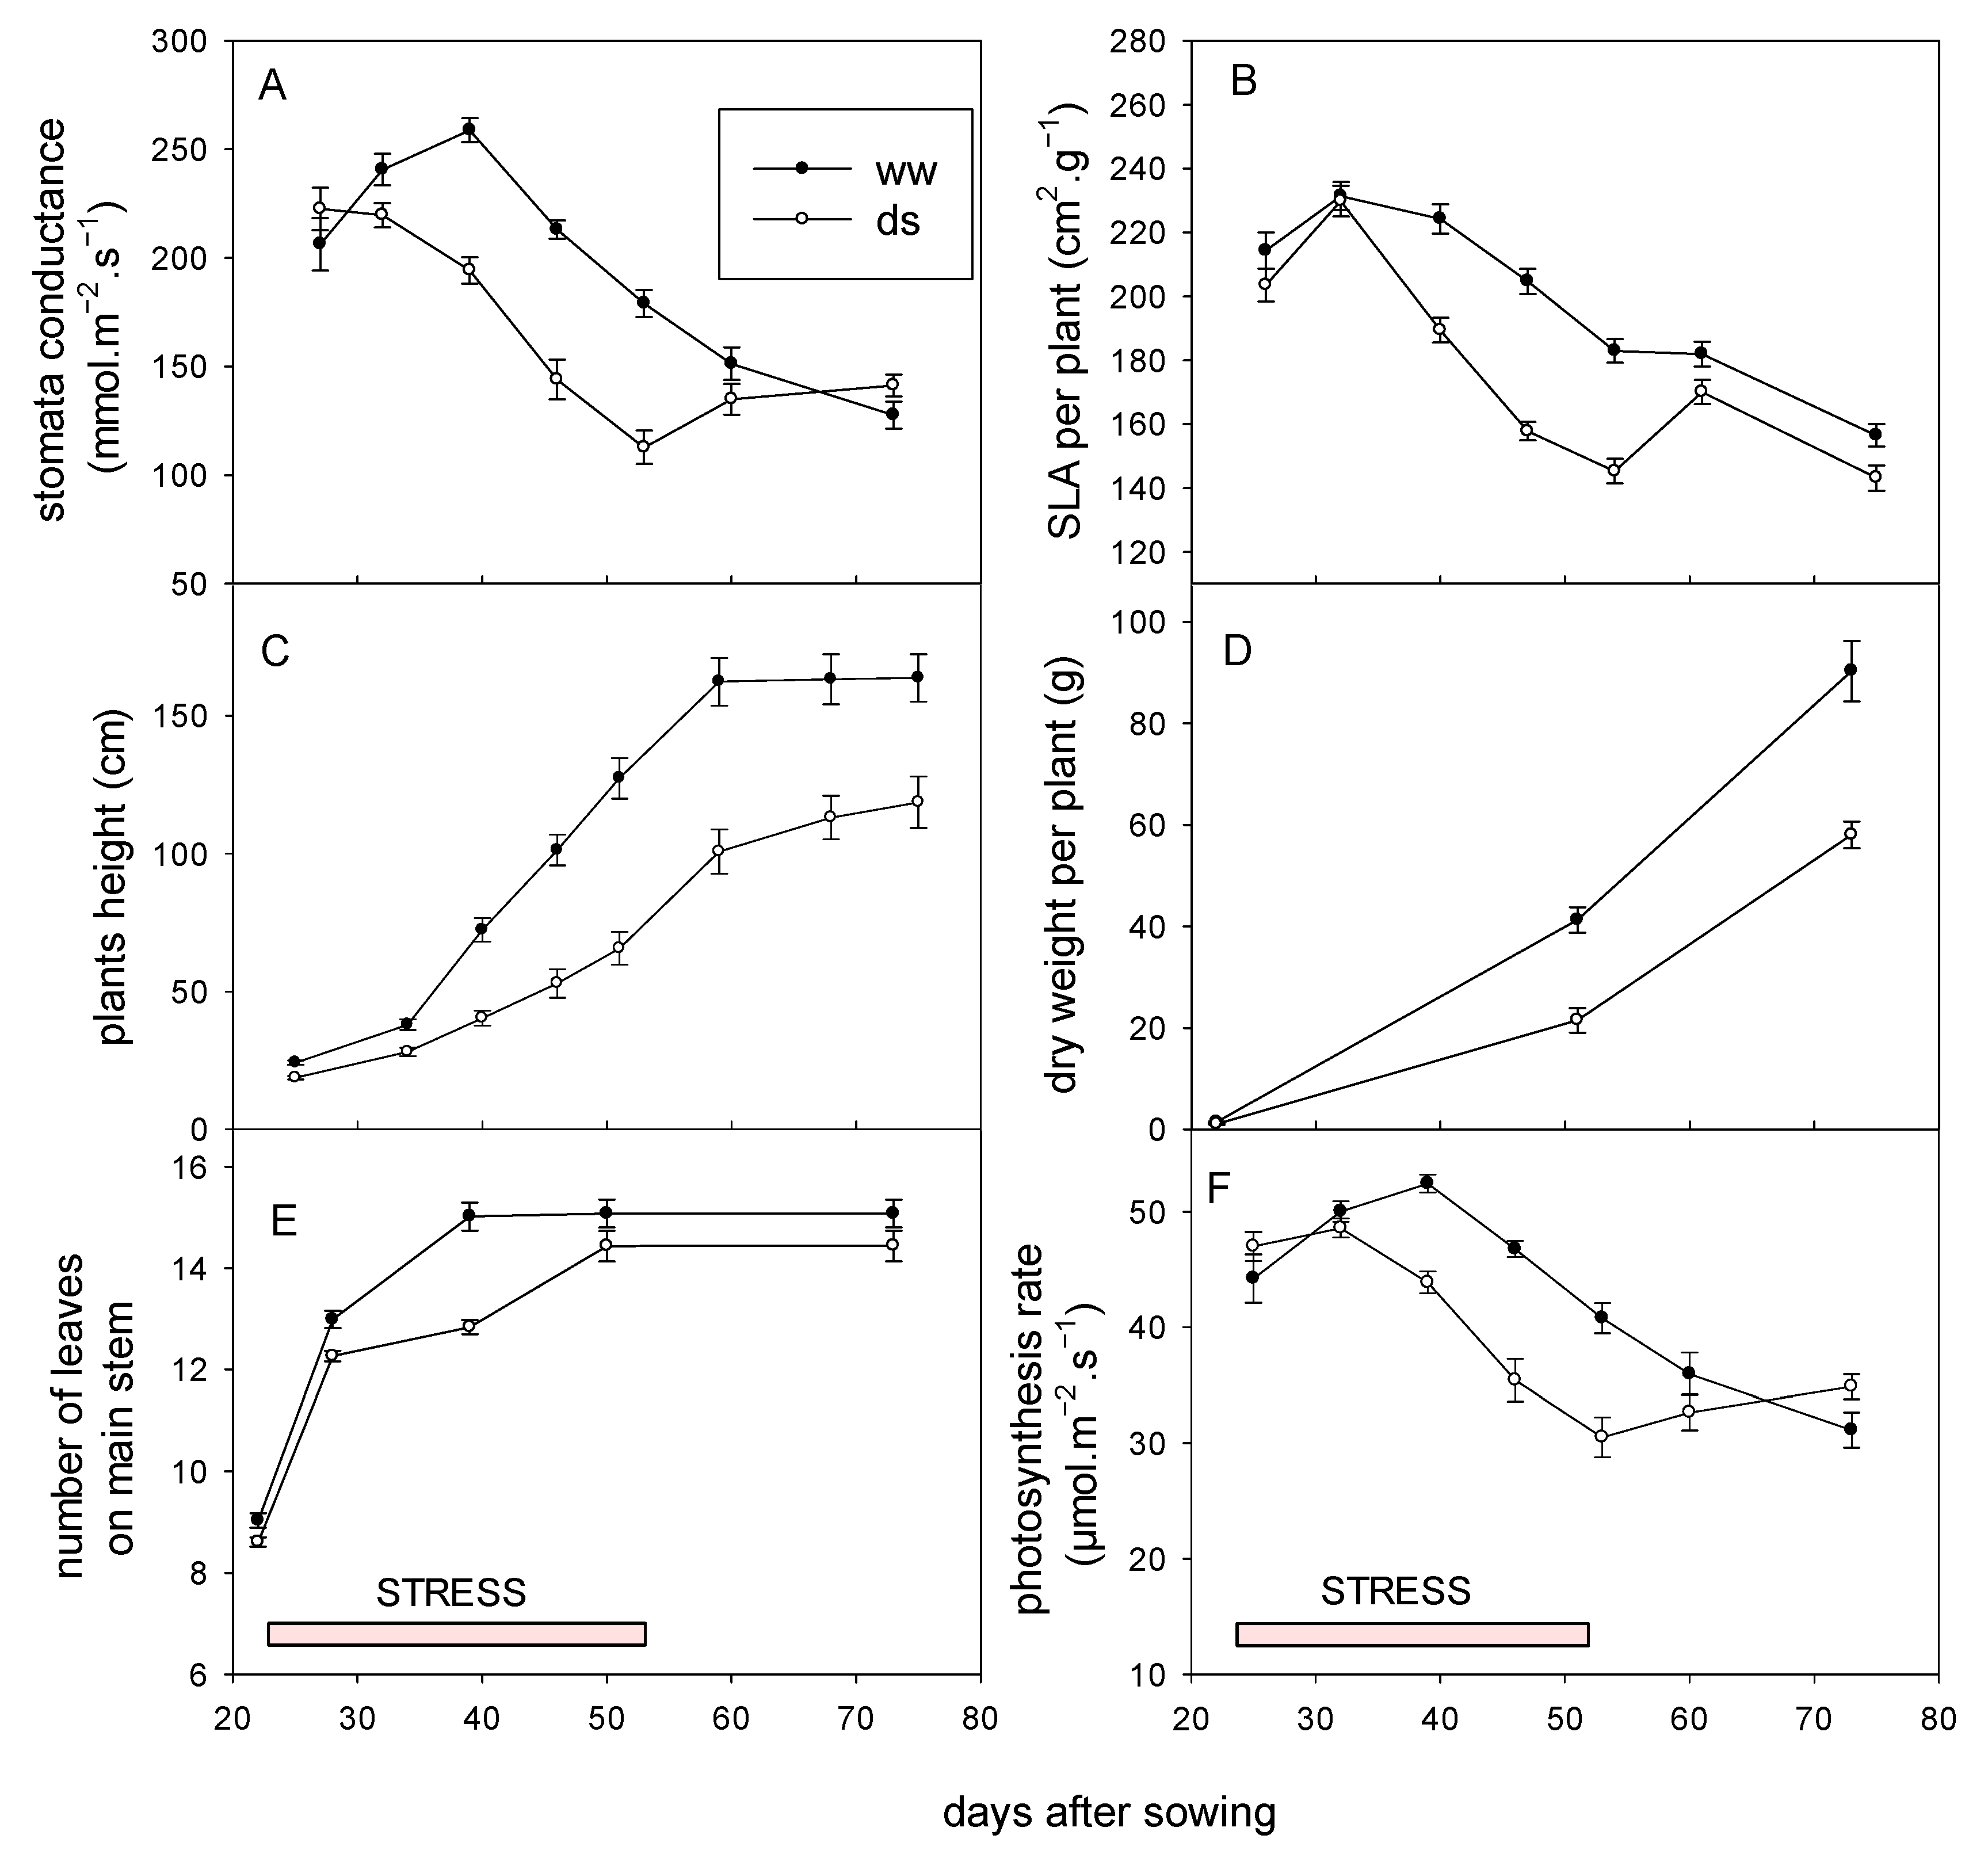
3.3.1. Effect on Growth, Recovery and Yield

Table 2 presents the effect of water regime (well-watered vs. drought stress) on agro-physiological and morphological traits assessed in 2018 and 2019. Our results showed strongly (p ≤ 0.01) significant effect of drought stress on all the studied traits in both years. Drought stress led to the reduction of the number of appeared leaves (NLA) (−6.75% and −9.18%), the plant height after stress (PHS) (−16.37% and −48.99%), the photosynthesis rate (−12.45% and −27.75%), stomatal conductance (−18.37% and −35.32%) and leaf transpiration (−26.37% and −25.92%), whereas an increase of the dead leaves weight (+43.29% and +15.10%) and leaf temperature (+1.29% and +7.64%) measured at the end of water stress application. The percentage of reduction or increase due to drought varied depending on the trait and year as mentioned in Table 2. At physiological maturity, plant height was reduced by 15.0% and 23.2%, straw dry weight by 18.3% and 27.8% and grain yield by 22.8% and 28.2% in 2018 and 2019 respectively.
Figure 3 represents the monitoring of stomatal conductance, specific leaf area (SLA) per plants, plant height after stress (PHS), the number of leaves on main stem (NLA), plants dry weight (DWP) and photosynthesis rate (Pn) of varieties under both conditions (irrigated and stressed). It showed that number of leaves on main stem, height of the last leaf and dry weight per plant gradually increase in a similar way between varieties but the advent of water stress induced a drop. These results suggested that, water stress in sorghum cause significant reduction in biomass production including shoot growth. The specific leaf area (SLA) of the plant, which reflects the thickness of the leaves, initially increased to reach its maximum at the 30th day after sowing, before gradually decreasing until maturity. In the stressed environment, the drop in SLA was greater, although WS plants’ SLA rebounded after the end of the stress period, without recovering the SLA values in the non-stressed environment. Like SLA trait described above, plant physiological functioning traits (Pn and C) increased in the beginning of cycle before reaching its maximum and decreasing progressively. The drop was higher under water deficit conditions and plants recover after re-watering. All these results (Table 2 and Figure 3) showed the importance of adaptation to early cycle water stress, which is capable of compromising plants development. In terms of height and biomass, the varieties have all lost paces despite the high plasticity found in sorghum. For some varieties, these changes can be a means of adaptation although they lead to a reduction in performance; they allow them to develop adapted mechanisms to survive in environmental conditions.
The results of the DRI of varieties are reported in the Table 3. The varieties that exhibit the smallest values of DRI have more difficulties to recovering. We noted that varieties have good recovery in number of leaves appearance (NLA) and photosynthesis rate (Pn) with a DRI of −0.11 and −0.04 respectively. However, the varieties recovery on plant height after stress (PHS) and the dry weight per plant (DWP) was more difficult with a DRI of -0.62 and −0.65, respectively (Table 3). The results indicated a best recovery on height for variety V3 (−0.33) and dry weight for varieties V1 and V10 (−0.32). In contrast, variety V4, V5 and V6 revealed the worst recovery on height and dry weight.

3.3.2. Agro Morphological Adaptation of Sorghum to Early Water Deficit

For both years, the combined analysis of variance revealed highly significant differences (p ≤ 0.01) between varieties in the different water treatment for all the studied traits except the number of appeared leaves (NLA) and the plants height after stress (PHS) in drought stress conditions in 2019 (Table 4). The interactions effects between variety (V), environment (E) and year (Y) (V × E, V × Y, E × Y and V × E × Y) were all significant on the dead leaves weight (DLW) and grain yield contrary to the number of leaves. The variety V7 showed the smallest NLA and PHS while V6 and V3 had the highest NLA and PHS respectively. Irrespective of water conditions, varieties V8 and V4 had the highest dead leaves weight in the two years while V1, V6 and V9 got the smallest values. At harvest, variety V5 exhibited the highest plant height at harvest (PHT) and straw dry biomass with the lowest grain yield whileV7 and V9 exhibited the lowest PHT and straw dry biomass. Under well-watered conditions, V1 and V10 recorded the highest grain yield while V1 and V9 were the best in drought conditions. From our results, varieties V6 and V8 which showed the best growth (NLA, PHS) at the end of stress (Table 3) did not remain the tallest varieties at maturity. They grew rapidly to complete their cycle contrary to V5 and V3 that were not the tallest at the end of stress but reached the highest PHT at harvest.

3.3.3. Physiological Adaptation of Sorghum to Early Water Deficit

Physiological plant functioning traits like photosynthesis rate, stomatal conductance, leaf transpiration and leaf temperature revealed a wide range of genetic variability among varieties under both well-watered and drought conditions (Table 5). The effects of variety, environment and their interactions (V × E) were highly significant in both years. Under well-watered conditions, variety V1 recorded the highest photosynthesis rate, stomatal conductance and leaf transpiration while V5 got the lowest values. However, the occurrence of drought stress induced various responses in these varieties. The variety V10 recorded the lowest photosynthesis rate in 2018 while the highest rate in 2019 showing variation in the behavior of this variety from year to year. The decrease of photosynthesis rate, stomatal conductance and of leaf transpiration but the increase of leaf temperature were the physiological responses of the studies varieties to early water deficit (Table 5).

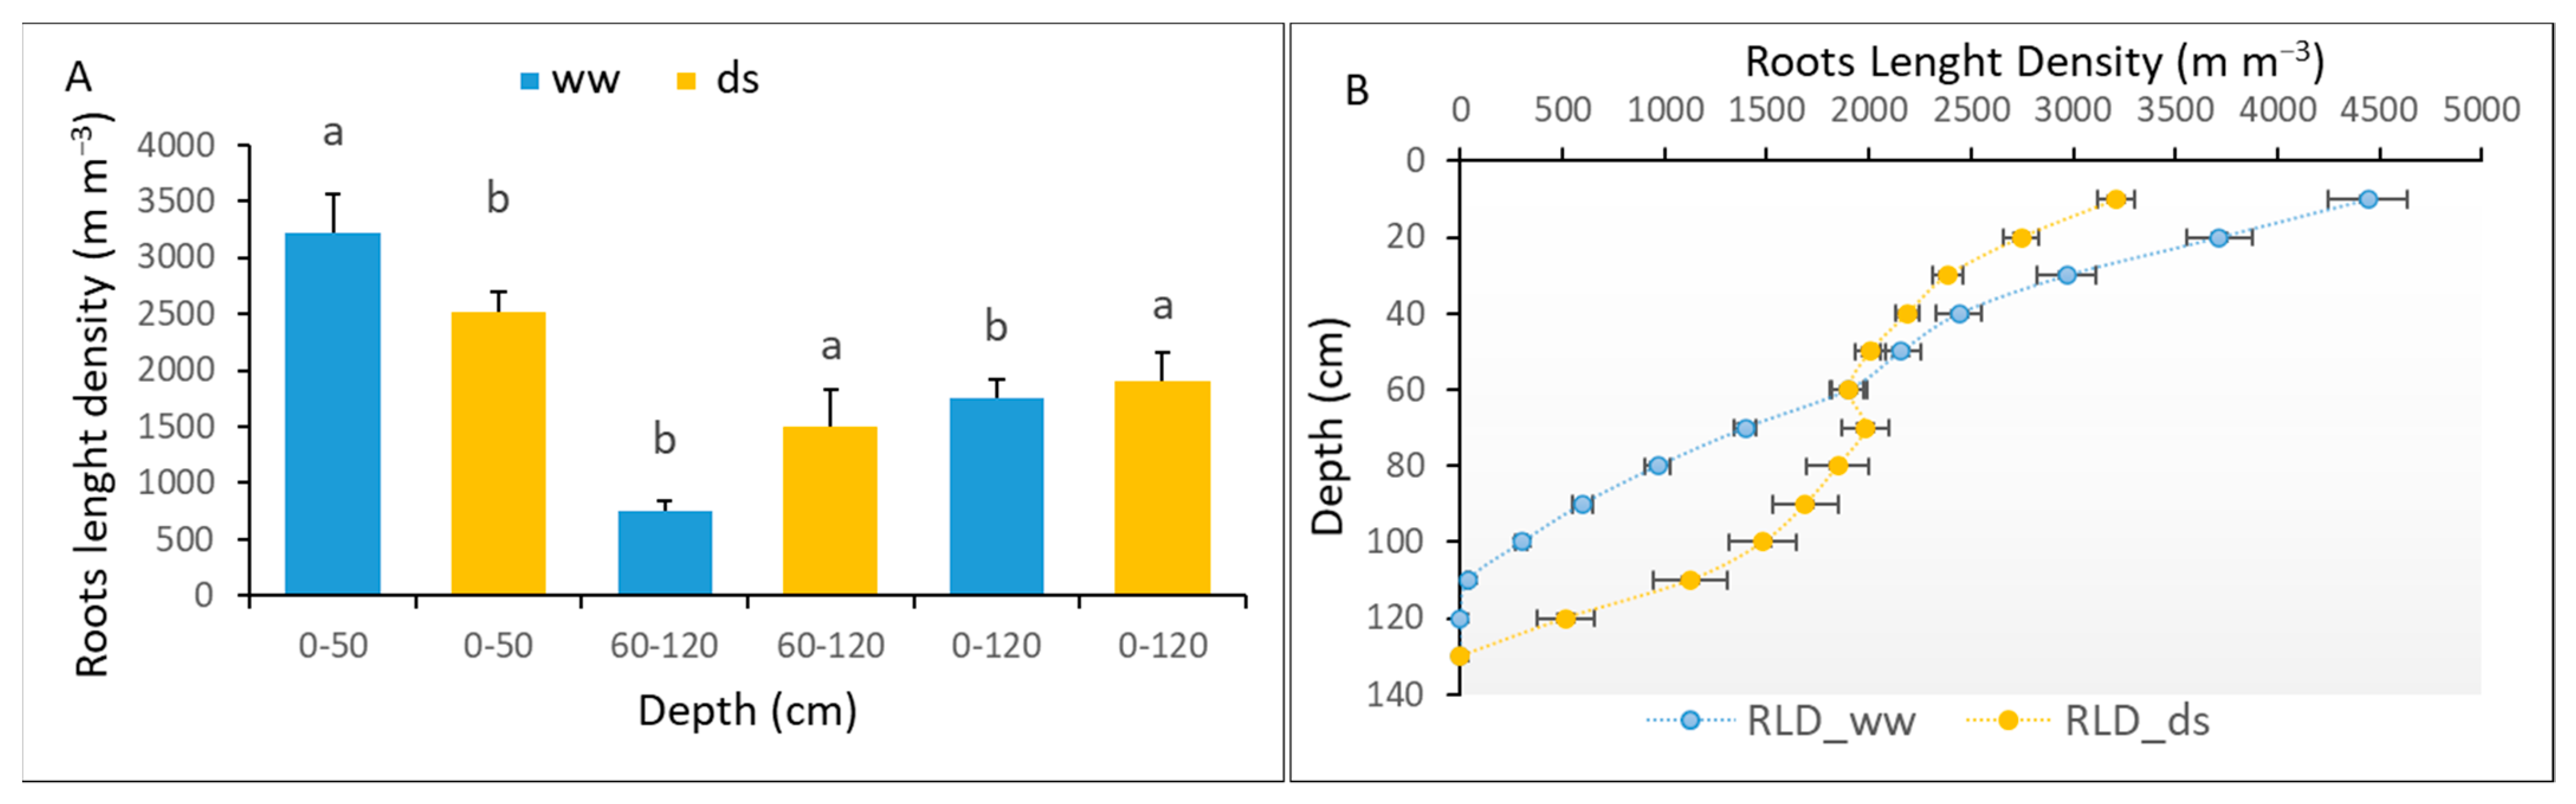
3.3.4. The Root Adaptation of Sorghum to Early Water Deficit

The roots length density (RLD) was estimated from roots intersection density (RID) along the soil profiles using the geometrical model for both well-watered (ww) and drought stress (ds) treatments at the end of the stress. Our results showed strong and significant effect of water deficit on the number of total roots (NTR) and RLD profiles (Table 6). The variety V1 and V8 exhibited the highest NTR in ww and ds conditions respectively while V7 and V10 exhibited the lowest one. Among varieties, V4 exhibited the lowest RLD for both ww and ds environment. Under drought stress, V1 recorded the strongest RLD in the shallow horizon while V8 had it in the deep horizon (Table 6). From the data presented in Table 6, the global trend of the varietal responses of the root system to early drought stress is highlighted on Figure 4. Drought stress induced significant reduction of RLD in the 0–50 cm soil horizon while an increase of this trait in the 60–120 cm deep soil layers.

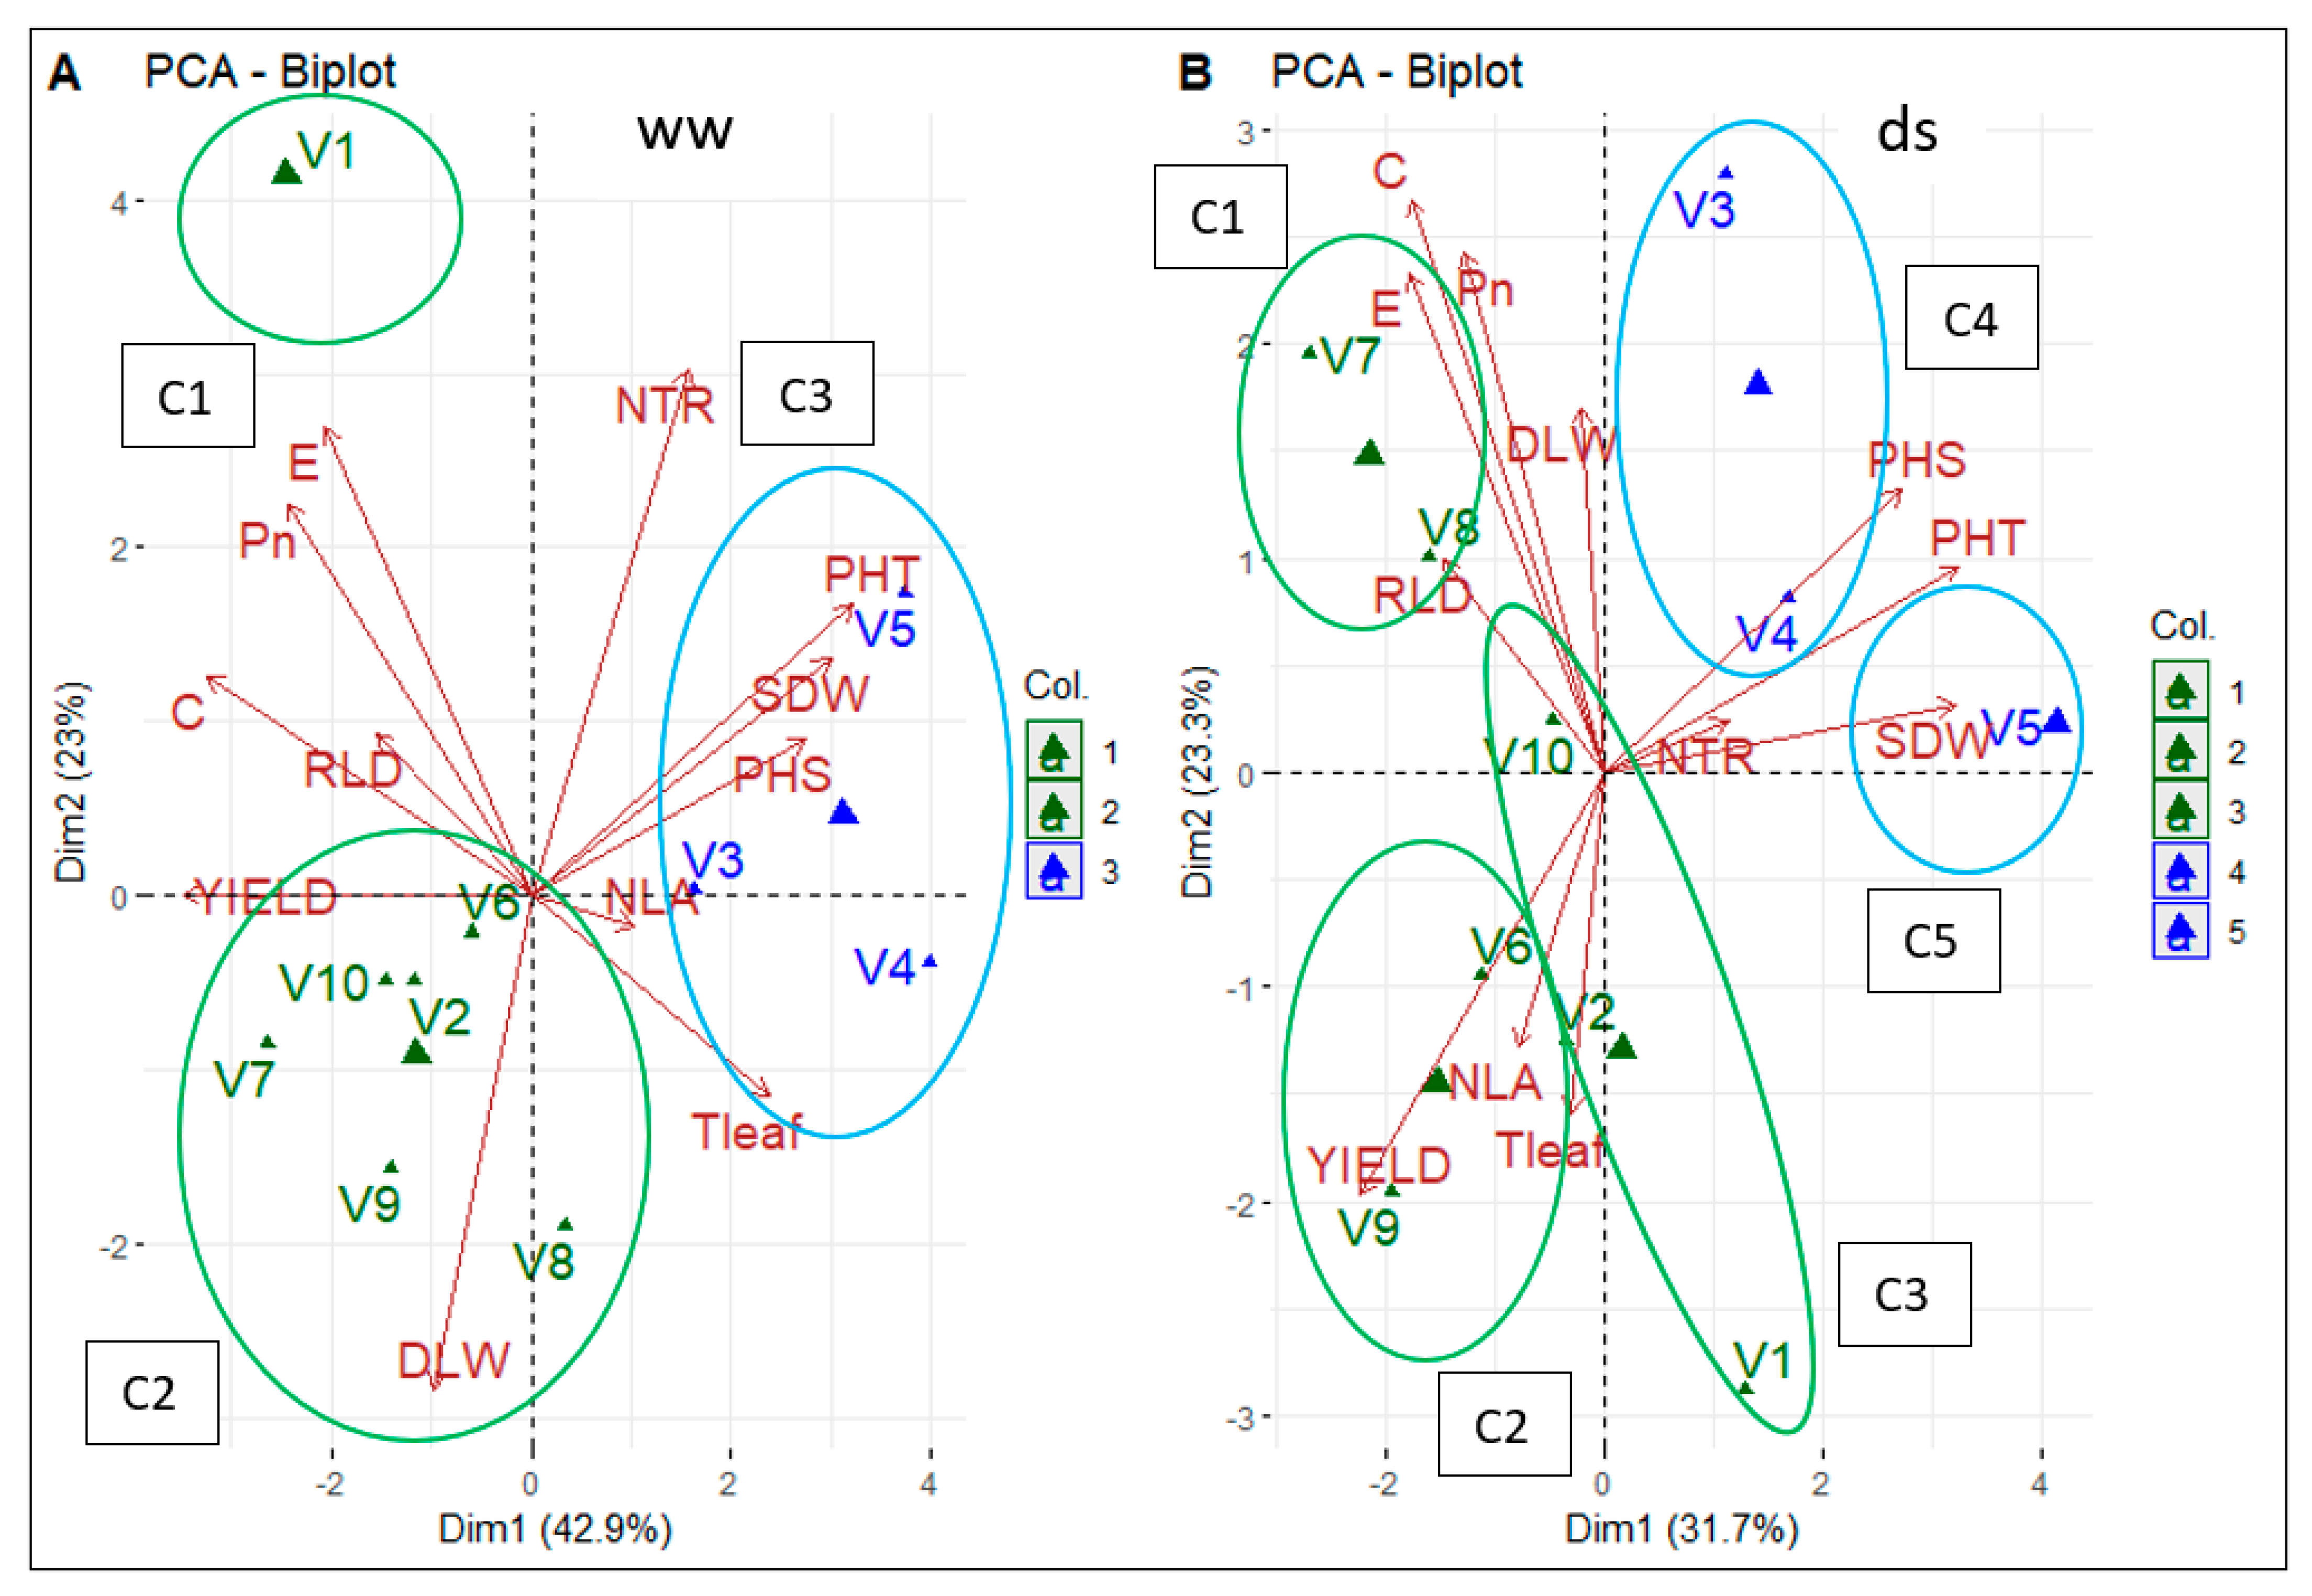
3.3.5. Traits Contribution to Early Drought Tolerance and Promising Varieties

Figure 5 presents the plots of varieties into groups of behavior under both well-watered and drought stress conditions representing the mean of the two years data (2018 and 2019). The two major principal components (PCs) were extracted and contributed to 65.9% and 55% of the total variability amongst the sorghum genotypes assessed for various morpho-physiological traits under well-watered and drought stress, respectively. The studied varieties were gathered into three clusters in the well-watered environment (Figure 5A). The variety V1, very productive (~4000 kg ha−1) with efficient photosynthesis rate (43–47 µmol m−2 s−1) was only in the first cluster (C1). The varieties V2, V6, V7, V8, V9 and V10 were gathered into the second cluster (C2). Like V1, these varieties had a good grain yield, high dead leaves weight but were less tall (127–168 cm). In contrary, V3, V4 and V5 encompassed into the third cluster (C3), had low yield (800–1800 kg ha−1) but big size (191–250 cm) and high straw dry biomass (Table 4 and Table 5). The clustering performed in drought conditions, gathers the varieties in five clusters with new arrangement (Figure 5B). The variety V1 was now in the third cluster (C3) with V2 and V10 while V7 and V8 joined the first cluster (C1) and finally, only V6 and V9 remained stable in the cluster 2 (C2). The varieties of cluster 1 were characterized by high photosynthesis rate, roots length density, stomata conductance, leaf transpiration and dead leaves weight. The cluster 2 varieties had good yield, number of leaf appeared and high leaf temperature while the cluster 3 was intermediate. The clusters 4 (V3 and V4) and 5 (V5) were characterized by varieties with big size (PHT), high biomass (SDW) and low yield. Under well-watered conditions (Figure 5A), photosynthesis rate; stomata conductance; leaf transpiration and root length density were positively linked to grain yield contrarily to plant height; straw dry biomass and leaf temperature. Whereas, in drought conditions, grain yield was more related to number of leaf appeared and leaf temperature than photosynthesis rate.

4. Discussion

4.1. The Adaptive Behavior of Varieties

The early drought stress characterized revealed a significant decrease of the predawn leaf water potential from 10th day after the onset of the stress (−1.5 bars) to the 30th day, the end of drought stress (−5 bars). This trend was confirmed by the FTSW parameter assessed and showed a severe drought stress experienced by the studied varieties [34]. This led to the reduction in drought conditions, for the number and the size of the leaves, which expansion depends on the turgor pressure and the amount of water assimilated [11]. Therefore, leaf appearance rate and globally, the plant growth was negatively affected and this resulted in low plant biomass production. Similar results were obtained by Perrier et al. [25] who showed a reduction of stem biomass production by 42% due to the occurrence of pre-anthesis drought. Previous studies also reported the decrease on sorghum growth and biomass production under the effect of early drought [53,54]. On agro-physiological traits, drought stress caused significant decrease of transpiration rate (−25.9%), photosynthetic activity (−27.7%) and stomatal conductance (−35.3%) in the 2019 trial (Table 2). The decreases were more important on the stomatal conductance and photosynthetic activity with high variability on varieties. This adaptation mechanism was also revealed in pearl millet [55,56] an cowpea [57]. Under water deficit conditions, the diffusion of CO2 to the carboxylation sites is limited due to stomatal closure and increased mesophyll resistance [58]. This inhibits the transport of electrons thus leading to an imbalance between the electron transport rate and CO2 fixation rate [31,32]. The photosynthetic performance is one of the parameters providing useful and quantitative information on plant condition and vitality [24,46,59] and appeared to be highly linked to stomatal activity despite environments changes as revealed by PCA biplot analysis (Figure 5), these two parameters control the plant adaptation strategies. Tingting et al. [60] showed that the process of photosynthesis is sensitive to the changing environmental conditions and the way in which plants adapt to their environment is propitious to photosynthesis. The recovery of photosynthesis upon re-watering indicates the capacity of the PSII systems to return to be able to deal with the absorbed light and the accumulated energy and that oxidative permanent damage did not occur at early growth stages. Among varieties, V1 seemed to have an excellent plasticity because its photosynthesis rate decreased drastically under water deficit and thereafter showed surprisingly the best recover. Oukarroum et al. [46] speculated that the effects of drought are reversible as long as the maximum quantum yield of photochemistry remains unaffected. Indeed, the decrease of the rate of plant growth due to water deficit during a given period often leads to the difficulties in ensuring its development and production in terms of plant height and biomass [54], two traits that presented a greater difference in recovery test. This behavior is not always a disastrous consequence but could be a means of adaptation allowing the plant to keep its development. For instance, variety V6 yielded well despite its low drought recovery index for plant height and biomass production. These are part of physiological mechanisms underlying drought tolerance in sorghum [4,61,62]. The plant agro-physiological performances depend on the genotype, the severity of drought and the time of application [63,64,65]. Early water stress acts differently on sorghum varieties depending on the stage of development of the variety. For some late maturity varieties of the Guinea and bicolor races (V1, V4), early cycle drought weakly affect performance. These varieties were able to recover thanks to their plasticity allowing them to catch up and stabilize their production despite the occurrence of water deficit at early stage [58]. According to Araus et al. [66], this phenomenon is due to stomatal control, which is more effective at the early stages. In fact, this was the case of variety V1, when facing the water deficit conditions, the plant responded by closing its stomata allowing it to limit exchanges with the environment till water conditions become favorable and the growth can resume and compensate the losses due to drought. Contrariwise, V4 shows the lowest DRI and a slight variation of stomatal conductance in drought stress and small performance variation on yield. A hypothesis is that variety recovered well after the two weeks allowed for recovery measurement. However, their adaptation conferred by their late maturity is not sufficient to consider them as appropriate for the future since previous studies have shown that the duration of drought episodes at the beginning of the season is likely to increase with the worsening of global climate change impacts [12,67,68,69]. However, the duration of the cycle did not play any important role in this study since the trials were conducted from October to February and this period has advantage of grouping the varieties’ maturity and do not allow expression of photoperiod-sensitivity.
In addition, roots play an important role as a support but also ensure the hydro-mineral nutrition of the plant. Numerous genes and QTLs associated with root traits under drought have been reported in the recent years [28]. Therefore, the roots represent a very effective means for characterizing sorghum adaptation to drought [31,38] as the diversification of phenotypic traits would be necessary because simulations predicted the increase of the vulnerability of sorghum production to early season drought stress [11]. Previous authors showed that the spatial distribution of root length density determines water and nutrient uptake [34,70] and revealed high variation among sorghum varieties. In the present study, varieties V1 and V8 turned out to be very interesting. They well yielded under drought conditions and their adaptation were based on root system strategies and accelerating leaf senescence respectively contrarily to V3 and V5 which showed a weak grain production. Kothari et al. [71] found that enhancing drought tolerance by increasing root density at different soil depths also resulted in a significantly higher irrigated grain sorghum yield. Therefore, V8 which is an improved variety is highly recommended for targeting root density trait than V1 a longer maturity that will likely increase the quantity of water used [71]. Moreover, interesting behaviors were highlighted by the PCA results (Figure 5). The advent of water stress led to more diversity in varieties and thus lead from three to five clusters. The varieties V1, V2, V6 and V9 could be devoted for grain yield breeding while V7 and V8 of the cluster 1 could be targeted for RLD and photosynthesis even leaf senescence rate improvement. Although the varieties V3, V4 and V5 of the clusters 4 and 5 were less productive, they could be of high interest for height or fodder breeding programs. Phenotypic evaluation of germplasm can be useful for characterization, conservation and maintenance of genetic resources [72]. This study revealed a large agro-morphological diversity of quantitative traits. Overall results showed that, plant response to early drought was genotypic dependent [73] and some varieties performed strong ability to reduce water loss by reducing leaf transpiration, leaf growth and accelerating leaf senescence. These were among the adaptation strategies used by the studied varieties to tolerate drought stress conditions in both seasons. In addition to this, some varieties have densified their root system to be able to exploit a larger surface area of soil and increase the absorption of water and mineral nutrients [28]. The high root density at depth allows them to reach moisture in the deeper soil layers and thus compensate the lack of supply.

4.2. Interest for Breeding (Criteria to Privilege)

As a major challenge for agricultural production, drought tolerance is a prime target for molecular approaches to crop improvement. To obtain significant results, these approaches must base on phenotyping protocols appropriate for all stages of plant development [74]. Although drought adaptation traits are complex and multigene, the understanding of their physiological and genetic basis is incomplete. Thus, the identification of preferred criteria remains unclear and still makes phenotyping laborious. According to Passioura et al. [75], the conceptual framework for drought phenotyping is based on the equation expressing yield as the product of water use (quantity of water used), water use efficiency (conversion of water use into dry biomass) and harvest index (the fraction of dry matter converted into grain). Therefore, it is important to design experiments to test the effects of early water stress during growth that may affect assimilations transport. By considering these components of performance individually, it is possible to target traits more effectively in relation to environmental constraints. In the case of early drought stress, a number of key phenotypic traits highlighted (Table 7) to help target and guide phenotyping. Breeders are interested to select genotypes that show identical adaptation mechanisms regardless of environmental conditions throughout the year and that are able to produce well all years. To do so, it would be important to follow the root architecture trait (RLD) that demonstrated its involvement on yield set up despite environment contrast. Furthermore, in drought stress environments, the dead leaves weight (DLW) revealed major trait involved in drought tolerance due to its high positive correlation of photosynthesis that reflect the plant efficiency to face drought. However, growth-related traits such as plant height (PHT) and dry weight rate (DWP), transpiration (E) and photosynthesis rate (Pn) seem very interesting because these traits are susceptible to environmental changes and were determining of clusters set up (Figure 5). An overview of plots subjected to drought and well-watered conditions (Figure 6), showed a great difference perceived on plants height, leaf area and biomass that testify the importance of phenotyping such growth traits for drought tolerance breeding. Drought-prone environments are diverse and the biotic and abiotic stresses that affect yield during drought periods are numerous [76]. Therefore, our objective is not to propose unique criteria for stress phenotyping. Rather, we suggest that each experiment be conducted with a specific, realistic goal and with water use efficiency and yield set up as reference traits [77]. Such reference traits will allow the relevance of new field results assessed and deposited in a public database for standardized recording and reporting of drought-related phenotypic data.

5. Conclusions

This study assessed the impact of early water deficit on sorghum growth, development and production. Our results showed that the early drought induced has mainly affected plant height, leaf development and biomass production. Even though the drought stress occurred at the beginning of the cycle, it negatively affected the final grain yield. The present study also showed that the studied varieties physiologically responded to early water deficit by closing the stomata and then reducing leaf transpiration and photosynthesis rate. Other defense mechanisms shown by the studied varieties were acceleration of their leaf senescence to reduce water loss and the increase of their roots length density to explore the deeper soil layers moisture. The genotypic dependence to early drought stress was also highlighted. The variety V1 showed the best plasticity by recovering quite well after the drought stress and reached high yield at maturity. Varieties V2 and V9 recorded among the highest yield under drought stress, while V8 showed the highest roots densification. These varieties could serve as parents in early drought tolerance breeding programs. By providing further insight on the way the studied genotypes react to early drought stress, this study helped to understand the physiological mechanisms underlying early drought tolerance in sorghum. Future investigations will focus on the finer and precise phenotyping of a larger diversity panel in different sorghum growing conditions, to take advantage of numerous genomic resources available on sorghum for efficient genomic breeding.

Author Contributions

Conceptualization, B.G., A.A., J.S.B.D.; methodology, B.G., J.S.B.D., A.A.; software, B.G., J.S.B.D.; validation, B.G., A.A., D.D., V.V.; formal analysis, B.G., J.S.B.D.; investigation, B.G., A.A, J.S.B.D.; resources, B.G., A.A., B.S.; data curation, B.G., J.S.B.D.; writing—original draft preparation, B.G.; writing—review and editing, B.G., J.S.B.D., T.K.T., V.V., B.S., D.D., A.A.; visualization, V.V., B.S., A.A., T.K.T.; supervision, A.A., D.D.; project administration, A.A., B.S.; funding acquisition, A.A. All authors have read and agreed to the published version of the manuscript.

Funding

This work constitutes part of doctoral research studies. The scholarship was funded by DAAD, the German academic exchange service. The research was conducted with the financial support of the sgt terra gates project funded by Bill and Melinda Gates foundation and benefit the facilities of the Centre d’Etude Régional pour l’Amélioration de l’Adaptation à la Sécheresse (CERAAS).

Data Availability Statement

The data presented in this study are available on request from the corresponding author.

Acknowledgments

The authors thank Seynabou Touré Seck, Bakary Vieux Diallo and Ndeye Fama Diouf for their gracious aid toward the field data collection during their master training period.

Conflicts of Interest

The authors declare no conflict of interest. The funders had no role in the design of the study; in the collection, analyses, or interpretation of data; in the writing of the manuscript, or in the decision to publish the results.

References

  1. Molden, D. Comprehensive assessment of water management in agriculture. In Water for Food Water for Life: A Comprehensive Assessment of Water Management in Agriculture; Earthscan: London, UK, 2007; pp. 1–40. ISBN 9781849773799. [Google Scholar]
  2. Ray, D.K.; Gerber, J.S.; Macdonald, G.K.; West, P.C. Climate variation explains a third of global crop yield variability. Nat. Commun. 2015, 6, 5989. [Google Scholar] [CrossRef] [Green Version]
  3. Agrama, H.A.; Tuinstra, M.R. Phylogenetic diversity and relationships among sorghum accessions using SSRs and RAPDs. Afr. J. Biotechnol. 2003, 2, 334–340. [Google Scholar] [CrossRef] [Green Version]
  4. Hadebe, S.T.; Modi, A.T.; Mabhaudhi, T. Drought Tolerance and Water Use of Cereal Crops: A Focus on Sorghum as a Food Security Crop in Sub-Saharan Africa. J. Agron. Crop. Sci. 2017, 203, 177–191. [Google Scholar] [CrossRef]
  5. FAOSTAT. Production/Yield Quantities of Sorghum in World (Rome). 2019. Available online: http://www.fao.org/faostat/en/#data/QC/visualize (accessed on 9 January 2021).
  6. Chaléard, J.-L. Les réponses de l’agriculture aux défis démo-économiques (The responses of agriculture to demo-economic challenges). Bull. Assoc. Geogr. Fr. 2010, 87, 40–55. [Google Scholar] [CrossRef]
  7. Sanchez, A.; Subudhi, P.; Rosenow, D.; Nguyen, H. Mapping QTLs associated with drought resistance in sorghum (Sorghum bicolor L. Moench). Plant Mol. Biol. 2002, 48, 713–726. [Google Scholar] [CrossRef] [PubMed]
  8. Direction de l’Analyse de la Prévision et des Statistiques Agricoles (DAPSA). Rapport D’évaluation Préliminaire des Récoltes de la Campagne 2018/2019 et de la Sécurité Alimentaire et de la Nutrition; DAPSA: Dakar, Senegal, 2019. [Google Scholar]
  9. Salack, S.; Muller, B.; Gaye, A.T.; Hourdin, F.; Cisse, N. Analyses multi-échelles des pauses pluviométriques au Niger et au Sénégal. Sci. Chang. Planetaires Secher. 2012, 23, 3–13. [Google Scholar] [CrossRef]
  10. Elagib, N.A. Drought risk during the early growing season in Sahelian Sudan. Nat. Hazards 2015, 79, 1549–1566. [Google Scholar] [CrossRef]
  11. Eggen, M.; Özdoğan, M.; Zaitchik, B.F.; Ademe, D.; Foltz, J.; Simane, B. Vulnerability of sorghum production to extreme, sub-seasonal weather under climate change. Environ. Res. Lett. 2019, 14, 045005. [Google Scholar] [CrossRef]
  12. Duku, C.; Zwart, S.J.; Hein, L. Impacts of climate change on cropping patterns in a tropical, sub-humid watershed. PLoS ONE 2018, 13, e0192642. [Google Scholar] [CrossRef] [Green Version]
  13. Tovignan, T.K.; Fonceka, D.; Ndoye, I.; Cisse, N.; Luquet, D. The sowing date and post-flowering water status affect the sugar and grain production of photoperiodic, sweet sorghum through the regulation of sink size and leaf area dynamics. Field Crop. Res. 2016, 192, 67–77. [Google Scholar] [CrossRef]
  14. Tovignan, T.K.; Adoukonou-Sagbadja, H.; Diatta, C.; Clément-Vidal, A.; Soutiras, A.; Cisse, N.; Luquet, D. Terminal drought effect on sugar partitioning and metabolism is modulated by leaf stay-green and panicle size in the stem of sweet sorghum (Sorghum bicolor L. Moench). CABI Agric. Biosci. 2020, 1, 1–11. [Google Scholar] [CrossRef]
  15. Ghate, T.; Barvkar, V.; Deshpande, S.; Bhargava, S. Role of ABA Signaling in Regulation of Stem Sugar Metabolism and Transport under Post- Flowering Drought Stress in Sweet Sorghum. Plant Mol. Biol. Rep. 2019, 37, 303–313. [Google Scholar] [CrossRef]
  16. Kamal, N.M.; Gorafi, Y.S.A.; Tsujimoto, H.; Ghanim, A.M.A. Stay-Green QTLs Response in Adaptation to Post-Flowering Drought Depends on the Drought Severity. BioMed Res. Int. 2018, 2018, 1–15. [Google Scholar] [CrossRef]
  17. Dwivedi, S.L.; Perotti, E.; Ortiz, R. Towards molecular breeding of reproductive traits in cereal crops. Plant Biotechnol. J. 2008, 6, 529–559. [Google Scholar] [CrossRef] [PubMed] [Green Version]
  18. Craufurd, P.Q.; Peacock, J.M. Effect of Heat and Drought Stress on Sorghum (Sorghum Bicolor) II. Grain Yield. Exp. Agric. 1993, 29, 77–86. [Google Scholar] [CrossRef] [Green Version]
  19. Tari, I.; Laskay, G.; Takács, Z.; Poor, P. Response of Sorghum to Abiotic Stresses: A Review. J. Agron. Crop. Sci. 2013, 199, 264–274. [Google Scholar] [CrossRef] [Green Version]
  20. Bangar, P.; Chaudhury, A.; Tiwari, B.; Kumar, S.; Kumari, R. Morphophysiological and biochemical response of mungbean [Vigna radiata (L.) Wilczek] varieties at different developmental stages under drought stress. Turk. J. Boil. 2019, 43, 58–69. [Google Scholar] [CrossRef]
  21. Radhouane, L.; Aissa, N.; Romdhane, L. Effets d’un stress hydrique appliqué à différents stades de développement sur l’aspect quantitatif et qualitatif des semences chez un écotype autochtone de sorgho grain (Sorghum bicolor). J. Appl. Biosci. 2014, 74, 6149. [Google Scholar] [CrossRef] [Green Version]
  22. Soundharajan, B.; Sudheer, K. Deficit irrigation management for rice using crop growth simulation model in an optimization framework. Paddy Water Environ. 2009, 7, 135–149. [Google Scholar] [CrossRef]
  23. Devnarain, N.; Crampton, B.; Chikwamba, R.; Becker, J.; O’Kennedy, M.M. Physiological responses of selected African sorghum landraces to progressive water stress and re-watering. S. Afr. J. Bot. 2016, 103, 61–69. [Google Scholar] [CrossRef]
  24. Zegada-Lizarazu, W.; Monti, A. Photosynthetic response of sweet sorghum to drought and re-watering at different growth stages. Physiol. Plant. 2012, 149, 56–66. [Google Scholar] [CrossRef]
  25. Perrier, L.; Rouan, L.; Jaffuel, S.; Clément-Vidal, A.; Roques, S.; Soutiras, A.; Baptiste, C.; Bastianelli, D.; Fabre, D.; Dubois, C.; et al. Plasticity of Sorghum Stem Biomass Accumulation in Response to Water Deficit: A Multiscale Analysis from Internode Tissue to Plant Level. Front. Plant Sci. 2017, 8, 1516. [Google Scholar] [CrossRef] [Green Version]
  26. Taiwo, A.F.; Daramola, O.; Sow, M.; Semwal, V.K. Ecophysiology and Responses of Plants under Drought. In Plant Ecophysiology and Adaptation under Climate Change: Mechanisms and Perspectives I: General Consequences and Plant Responses; Hasanuzzaman, M., Ed.; Springer: Singapore, 2020; pp. 231–268. [Google Scholar]
  27. Henry, A. IRRI’s drought stress research in rice with emphasis on roots: Accomplishments over the last 50 years. Plant Root 2013, 7, 92–106. [Google Scholar] [CrossRef] [Green Version]
  28. Comas, L.H.; Becker, S.R.; Cruz, V.M.V.; Byrne, P.F.; Dierig, D. Root traits contributing to plant productivity under drought. Front. Plant Sci. 2013, 4, 442. [Google Scholar] [CrossRef] [PubMed] [Green Version]
  29. Masi, C.E.A.; Maranville, J.W. Evaluation of sorghum root branching using fractals. J. Agric. Sci. 1998, 131, 259–265. [Google Scholar] [CrossRef]
  30. Lynch, J.; Chimungu, J.G.; Brown, K.M. Root anatomical phenes associated with water acquisition from drying soil: Targets for crop improvement. J. Exp. Bot. 2014, 65, 6155–6166. [Google Scholar] [CrossRef] [Green Version]
  31. Firezer, G.; Firew, M.; Taye, T.; Temesgen, M.; Kassahun, B. Phenotyping sorghum [Sorghum bicolor (L.) Moench] for drought tolerance with special emphasis to root angle. Afr. J. Agric. Res. 2020, 16, 1213–1222. [Google Scholar] [CrossRef]
  32. Chopart, J.-L.; Sine, B.; Dao, A.; Muller, B. Root orientation of four sorghum cultivars: Application to estimate root length density from root counts in soil profiles. Plant Root 2008, 2, 67–75. [Google Scholar] [CrossRef] [Green Version]
  33. Gregory, P.J. Roots, rhizosphere and soil: The route to a better understanding of soil science? Eur. J. Soil Sci. 2005, 57, 2–12. [Google Scholar] [CrossRef]
  34. Faye, A.; Sine, B.; Chopart, J.-L.; Grondin, A.; Lucas, M.; Diedhiou, A.G.; Gantet, P.; Cournac, L.; Min, D.; Audebert, A.; et al. Development of a model estimating root length density from root impacts on a soil profile in pearl millet (Pennisetum glaucum (L.) R. Br). Application to measure root system response to water stress in field conditions. PLoS ONE 2019, 14, e0214182. [Google Scholar] [CrossRef] [Green Version]
  35. Böhm, W. In situ estimation of root length at natural soil profiles. J. Agric. Sci. 1976, 87, 365–368. [Google Scholar] [CrossRef]
  36. Tardieu, F. Analysis of the spatial variability of maize root density. Plant Soil 1988, 107, 259–266. [Google Scholar] [CrossRef]
  37. Zheng, Z.; Hey, S.; Jubery, T.Z.; Liu, H.; Yang, Y.; Coffey, L.; Miao, C.; Sigmon, B.; Schnable, J.C.; Hochholdinger, F.; et al. Shared Genetic Control of Root System Architecture between Zea mays and Sorghum bicolor. Plant Physiol. 2019, 182, 977–991. [Google Scholar] [CrossRef] [Green Version]
  38. Kapoor, D.; Bhardwaj, S.; Landi, M.; Sharma, A.; Ramakrishnan, M.; Sharma, A. The Impact of Drought in Plant Metabolism: How to Exploit Tolerance Mechanisms to Increase Crop Production. Appl. Sci. 2020, 10, 5692. [Google Scholar] [CrossRef]
  39. Ndiaye, M.; Adam, M.; Muller, B.; Guisse, A.; Cisse, N. Performances agronomiques et stabilité phénotypique de génotypes de Sorgho (Sorghum bicolor (L.) Moench) au Sénégal: Une étude des interactions génotypes-environnement. J. Appl. Biosci. 2018, 125, 12617. [Google Scholar] [CrossRef] [Green Version]
  40. Ndiaye, M.; Adam, M.; Ganyo, K.K.; Guisse, A.; Cisse, N.; Muller, B. Genotype-Environment Interaction: Trade-Offs between the Agronomic Performance and Stability of Dual-Purpose Sorghum (Sorghum bicolor L. Moench) Genotypes in Senegal. Agronomy 2019, 9, 867. [Google Scholar] [CrossRef] [Green Version]
  41. Joseph, S.B.D.; Boubacar, G.; Michel, V.; Mamoutou, K.; Léonce, L.D.; Mohamed, D.; Niaba, T.; Diaga, D.; Audebert, A. Response of eight sorghum varieties to plant density and nitrogen fertilization in the Sudano-Sahelian zone in Mali. Afr. J. Agric. Res. 2020, 16, 1401–1410. [Google Scholar] [CrossRef]
  42. Debieu, M.; Sine, B.; Passot, S.; Grondin, A.; Akata, E.; Gangashetty, P.; Vadez, V.; Gantet, P.; Foncéka, D.; Cournac, L.; et al. Response to early drought stress and identification of QTLs controlling biomass production under drought in pearl millet. PLoS ONE 2018, 13, e0201635. [Google Scholar] [CrossRef] [Green Version]
  43. Sinclair, T.; Ludlow, M. Influence of Soil Water Supply on the Plant Water Balance of Four Tropical Grain Legumes. Funct. Plant Biol. 1986, 13, 329–341. [Google Scholar] [CrossRef]
  44. Peyrano, G.; Taleisnik, E.; Quiroga, M.; De Forchetti, S.M.; Tigier, H. Salinity effects on hydraulic conductance, lignin content and peroxidase activity in tomato roots. Plant Physiol. Biochem. 1997, 35, 387–393. [Google Scholar]
  45. Strauss, A.; Krüger, G.; Strasser, R.; Van Heerden, P. Ranking of dark chilling tolerance in soybean genotypes probed by the chlorophyll a fluorescence transient O-J-I-P. Environ. Exp. Bot. 2006, 56, 147–157. [Google Scholar] [CrossRef]
  46. Oukarroum, A.; El Madidi, S.; Schansker, G.; Strasser, R.J. Probing the responses of barley cultivars (Hordeum vulgare L.) by chlorophyll a fluorescence OLKJIP under drought stress and re-watering. Environ. Exp. Bot. 2007, 60, 438–446. [Google Scholar] [CrossRef]
  47. Dusserre, J.; Audebert, A.; Radanielson, A.M.; Chopart, J.-L. Towards a simple generic model for upland rice root length density estimation from root intersections on soil profile. Plant Soil 2009, 325, 277–288. [Google Scholar] [CrossRef]
  48. McIntosh, M.S. Analysis of Combined Experiments 1. Agron. J. 1983, 75, 153–155. [Google Scholar] [CrossRef]
  49. Bartlett, M.S. Properties of sufficiency and statistical tests. Proc. R. Soc. Lond. Ser. A 1937, 160, 268–282. [Google Scholar] [CrossRef]
  50. Sebastien, L.; Josse, J.; Husson, F. FactoMineR: An R package for multivariate analysis. J. Stat. Softw. 2008, 25, 1–18. [Google Scholar]
  51. Kassambara, A.; Mundt, F. Factoextra: Extract and Visualize the Results of Multivariate Data Analyses. Available online: https://cran.r-project.org/web/packages/factoextra/index.htmlb (accessed on 18 October 2020).
  52. R Core Team. R: A Language and Environment for Statistical Computing; R Foundation for Statistical Computing: Vienna, Austria, 2018; Available online: https://www.R-project.org/ (accessed on 10 November 2020).
  53. Habyarimana, E.; Laureti, D.; Ninno, M.; Lorenzoni, C. Performances of biomass sorghum [Sorghum bicolor (L.) Moench] under different water regimes in Mediterranean region. Ind. Crop. Prod. 2004, 20, 23–28. [Google Scholar] [CrossRef]
  54. Hud, A.A.; Abuali, A.I.; Elnahsikh, M.H.; Ahmed, M.I.; Idris, A.E.; Farah, A.M.; Ali, H.A.; Mohamed, B.B.; Babiker, A.E.; Mohamed, E.A. Effect of water stress on vegetative growth, yield and yield components of sweet sorghum (Sorghum bicolor L.) genotypes. Environ. Nat. Resour. Int. J. 2016, 7755, 33–38. [Google Scholar]
  55. Kholová, J.; Hash, C.T.; Kakkera, A.; Kočová, M.; Vadez, V. Constitutive water-conserving mechanisms are correlated with the terminal drought tolerance of pearl millet [Pennisetum glaucum (L.) R. Br.]. J. Exp. Bot. 2009, 61, 369–377. [Google Scholar] [CrossRef] [PubMed] [Green Version]
  56. Kholová, J.; Hash, C.T.; Kumar, P.L.; Yadav, R.S.; Kočová, M.; Vadez, V. Terminal drought-tolerant pearl millet [Pennisetum glaucum (L.) R. Br.] have high leaf ABA and limit transpiration at high vapour pressure deficit. J. Exp. Bot. 2010, 61, 1431–1440. [Google Scholar] [CrossRef] [Green Version]
  57. Belko, N.; Zaman-Allah, M.; Cisse, N.; Diop, N.N.; Zombre, G.; Ehlers, J.D.; Vadez, V. Lower soil moisture threshold for transpiration decline under water deficit correlates with lower canopy conductance and higher transpiration efficiency in drought-tolerant cowpea. Funct. Plant Biol. 2012, 39, 306–322. [Google Scholar] [CrossRef] [Green Version]
  58. Verma, R.; Kumar, R.; Nath, A. Drought Resistance Mechanism and Adaptation to Water Stress in Sorghum [Sorghum bicolor (L.) Moench]. Int. J. Bio-Resour. Stress Manag. 2018, 9, 167–172. [Google Scholar] [CrossRef]
  59. Banks, J.M. Chlorophyll fluorescence as a tool to identify drought stress in Acer genotypes. Environ. Exp. Bot. 2018, 155, 118–127. [Google Scholar] [CrossRef]
  60. Tingting, X.; Peixi, S.; Lishan, S. Photosynthetic characteristics and water use efficiency of sweet sorghum underdifferent watering regimes. Pak. J. Bot. 2010, 42, 3981–3994. [Google Scholar]
  61. Harris, K.; Subudhi, P.K.; Borrell, A.; Jordan, D.; Rosenow, D.; Nguyen, H.; Klein, P.; Klein, R.; Mullet, J. Sorghum stay-green QTL individually reduce post-flowering drought-induced leaf senescence. J. Exp. Bot. 2006, 58, 327–338. [Google Scholar] [CrossRef] [PubMed] [Green Version]
  62. Kapanigowda, M.H.; Perumal, R.; Djanaguiraman, M.; Aiken, R.M.; Tesso, T.; Prasad, P.V.V.; Little, C. Genotypic variation in sorghum [Sorghum bicolor (L.) Moench] exotic germplasm collections for drought and disease tolerance. SpringerPlus 2013, 2, 1–13. [Google Scholar] [CrossRef] [PubMed] [Green Version]
  63. Chaves, M.; Pereira, J.S.; Maroco, J.; Rodrigues, M.L.; Ricardo, C.P.P.; Osório, M.L.; Carvalho, I.; Faria, T.; Pinheiro, C. How Plants Cope with Water Stress in the Field? Photosynthesis and Growth. Ann. Bot. 2002, 89, 907–916. [Google Scholar] [CrossRef] [Green Version]
  64. Jaleel, C.A.; Gopi, R.; Panneerselvam, R. Growth and photosynthetic pigments responses of two varieties of Catharanthus roseus to triadimefon treatment. Comptes Rendus Biol. 2008, 331, 272–277. [Google Scholar] [CrossRef]
  65. Shao, H.; Chu, L.-Y.; Jaleel, C.A.; Changxing, Z. Water-deficit stress-induced anatomical changes in higher plants. Comptes Rendus Biol. 2008, 331, 215–225. [Google Scholar] [CrossRef]
  66. Araus, J.L.; Tapia, L.; Alegre, L. The Effect of Changing Sowing Date on Leaf Structure and Gas Exchange Characteristics of Wheat Flag Leaves Grown under Mediterranean Climate Conditions. J. Exp. Bot. 1989, 40, 639–646. [Google Scholar] [CrossRef]
  67. Blanc, E. The Impact of Climate Change on Crop Yields in Sub-Saharan Africa. Am. J. Clim. Chang. 2012, 1, 1–13. [Google Scholar] [CrossRef] [Green Version]
  68. Vadez, V.; Hash, T.; Bidinger, F.R.; Kholová, J. II.1.5 Phenotyping pearl millet for adaptation to drought. Front. Physiol. 2012, 3, 386. [Google Scholar] [CrossRef] [PubMed] [Green Version]
  69. Elramlawi, H.R.; Mohammed, H.I.; Elamin, A.W.; Abdallah, O.A.; Taha, A.A. Adaptation of Sorghum (Sorghum bicolor L. Moench) Crop Yield to Climate Change in Eastern Dryland of Sudan. In Handbook of Climate Change Resilience; Springer: Cham, Switzerland, 2019; pp. 2549–2573. [Google Scholar]
  70. Gregory, P.J. Plant Roots: Growth, Activity and Interactions with the Soil. Clim. Chang. Phys. Sci. Basis 2013, 53, 1–30. [Google Scholar]
  71. Kothari, K.; Ale, S.; Bordovsky, J.P.; Porter, D.O.; Munster, C.L.; Hoogenboom, G. Potential benefits of genotype-based adaptation strategies for grain sorghum production in the Texas High Plains under climate change. Eur. J. Agron. 2020, 117, 126037. [Google Scholar] [CrossRef]
  72. Naoura, G.; Sawadogo, N.; Atchozou, E.A.; Emendack, Y.; Hassan, M.A.; Reoungal, D.; Amos, D.N.; Djirabaye, N.; Tabo, R.; Laza, H. Assessment of agro-morphological variability of dry-season sorghum cultivars in Chad as novel sources of drought tolerance. Sci. Rep. 2019, 9, 1–12. [Google Scholar] [CrossRef]
  73. Sinclair, T.R.; Pradhan, D.; Shekoofa, A. Inheritance of limited-transpiration trait in peanut: An update. J. Crop. Improv. 2018, 32, 281–286. [Google Scholar] [CrossRef]
  74. Salekdeh, G.H.; Reynolds, M.; Bennett, J.; Boyer, J. Conceptual framework for drought phenotyping during molecular breeding. Trends Plant Sci. 2009, 14, 488–496. [Google Scholar] [CrossRef] [PubMed]
  75. Passioura, J.B. Grain yield, harvest index, and water use of wheat. J. Aust. Inst. Agric. Sci. 1977, 43, 117–120. [Google Scholar]
  76. Richards, R.A.; Rebetzke, G.J.; Condon, A.G.; Van Herwaarden, A.F. Breeding Opportunities for Increasing the Efficiency of Water Use and Crop Yield in Temperate Cereals. Crop. Sci. 2002, 42, 111–121. [Google Scholar] [CrossRef]
  77. Venuprasad, R.; Lafitte, H.R.; Atlin, G.N. Response to Direct Selection for Grain Yield under Drought Stress in Rice. Crop. Sci. 2007, 47, 285–293. [Google Scholar] [CrossRef]
Figure 1. Daily averages of vapor pressure deficit and solar radiation (A), temperature and relative humidity (B) recorded during the dry season 2018; the minimum and maximum vapor pressure deficit (C) and potential evapotranspiration (D) recorded during the experiment in 2019.
Agronomy 11 00443 g001
Figure 2. Evolution of soil moisture stock (%) for 2018 (A) and 2019 (B), fraction of transpirable soil water for 2018 (C) and 2019 (D) and predawn leaf water potential (bar) for 2018 (E) and 2019 (F) compared between well-watered (ww) and drought stress (ds) treatments.
Agronomy 11 00443 g002
Figure 3. Evolution of stomata conductance (A), specific leaf area (SLA) per plant (B), plants height (C), dry weight (D), number of leaves (E) and photosynthesis rate (F) of sorghum varieties under well-watered and drought stress conditions. ww: well-watered; ds: drought stress.
Agronomy 11 00443 g003
Figure 4. Root length density (RLD) of sorghum varieties under well-watered (ww) and drought stress (ds) conditions at the end of stress. (A) RLD distribution according to [0–50], [60–120] and [0–120] depth horizons (B) Impact of water deficit on RLD profile. RLD: root length density; ww: well-watered; ds: drought stress. Data are mean +/− standard error, Significant differences are indicated by different letters (a and b).
Agronomy 11 00443 g004
Figure 5. Principal component analysis biplot of agro morphological and physiological traits of 10 sorghum varieties (V) under well-watered (A) and drought stress conditions (B). The C inside the rectangle followed by a number represents the cluster number; ww: well-watered environment; ds: drought stress environment; NLA: number of leaf appeared; PHS: plants height after stress; DLW: dead leaves weight; PHT: plants height at harvest; SDW: Straw dry weight; Yield: grain yield (kg ha−1); Pn: photosynthesis rate; C: stomatal conductance; E: leaf transpiration; Tleaf: leaf temperature; NTR: number of total roots; RLD: root length density; col: stand for the colors of the different clusters.
Agronomy 11 00443 g005
Figure 6. Picture depicting an overview of the stressed (ds) plots of the ten varieties at the 30th day after the onset of the drought stress compared to the well-watered (ww) ones during the 2019 field trial.
Agronomy 11 00443 g006
Table 1. Characteristics of the varieties used in this study and their origin.
VarietyCodeTypeMaturity
(Days)
Height
(cm)
Potential Yield (t/ha)Panicle FormPhotoperiod-SensitivityIsohyet
(mm)
Origin
FaddaV1Guinea (hybrid)128200–3004.5non compactmoderate700–1000Mali (IER/ICRISAT)
NIELENIV2Guinea (hybrid)1153004semi compactlow700–800Mali (IER/ICRISAT)
IS15401V3Guinea-Caudatum115400–4502semi compacthigh900–1200Mali (IER/ICRISAT)
PABLOV4Guinea (hybrid)1254004non compactmoderate700–1000Mali (IER/ICRISAT)
CSM63EV5Guinea904002non compactlow600–1000Mali (IER/ICRISAT)
SK5912V6Caudatum1702002.5–3.5semi compacthigh700–900Nigeria
GRINKANV7Caudatum901204semi compactnon500–800Mali (IER/ICRISAT)
SOUMBAV8Caudatum1152502.5semi compactlow600–1000Mali (IER/ICRISAT)
621BV9Caudatum1051752.5–3semi compactnon600–900Senegal (ISRA)
F2-20V10Caudatum1102103–5.3semi compactlow600–900Senegal (ISRA)
Table 2. Average performance and statistical parameters of some agro physio and morphological traits of sorghum genotypes under well-watered and drought stress conditions of 2018 and 2019 field trials.
20182019
TraitsMean wwMean dsΔWSSignif.Mean wwMean dsΔWSSignif.
NLA15.33 a13.92 b−9.1***15.30 a14.26 b−6.7***
PHS143.89 a120.33 b−16.3***130.55 a66.59 b−48.9***
DLW13.65 b19.56 a43.2***14.22 b16.37 a15.1***
PHT174.83 a148.58 b−15.0***165.75 a127.24 b−23.2***
SDW453.38 a370.61 b−18.2***427.35 a308.60 b−27.7***
Yield3271.85 a2526.21 b−22.7***2419.84 a1738.64 b−28.1***
Pn39.32 a34.43 b−12.4***41.38 a29.90 b−27.7***
C184.94 a150.97 b−18.3***179.14 a115.88 b−35.3***
E7.43 a5.47 b−26.3***7.04 a5.22 b−25.9***
Tleaf39.02 b39.53 a1.2**39.16 b42.15 a7.6***
ww: well-watered; ds: drought stress; NLA: number of appeared leaves; PHS: plant height at the end of stress; DLW: dead leaves weight; PHT: plant height at harvest; SDW: Straws dry weight; Yield: grain yield (kg/ha); Var: varieties; env: environment; signif: significativity; *** significant at p = 0.001; ** significant at p = 0.01; ΔWS: percentage of variation due to drought stress, the means with same letters are not significant.
Table 3. Drought recovery index of sorghum varieties on some growth traits.
Drought Recovery Index (DRI)
VarietiesNLAPHSDWPPn
V1−0.04−0.54−0.32−0.22
V2−0.10−0.43−0.60−0.24
V3−0.12−0.33−0.75−0.08
V4−0.13−0.81−0.980.07
V5−0.10−0.68−0.640.35
V6−0.09−0.80−0.97−0.16
V7−0.13−0.55−0.93−0.05
V8−0.11−0.77−0.570.12
V9−0.12−0.62−0.44−0.18
V10−0.12−0.69−0.320.00
MEAN−0.11−0.62−0.65−0.04
NLA: number of leaf appeared; PHS: plants height after stress; DWP: dry weight per plant; Pn: photosynthesis rate; the bold indicate the highest and lowest value measured.
Table 4. Variety and environment per se performance compared among ten sorghum varieties and two water treatments (well-watered and drought stress) for morphological traits measured during 2018 and 2019 field trials.
NLA PHSDLWPHTSDWYIELD
Vwwdswwdswwdswwdswwdswwds
Year 2018V114.6 cd13.5 bc133.7 bc111.7 bcd5.7 e13.9 cd172.5 cd148.9 cd427.6 bc358.7 abc4183.4 abc3182.3 b
V215.3 bc13.6 bc125.7 bc101.6 bcd16.8 ab28.7 a162.8 d140.4 cde470.2 abc349.3 abc3715.9 d3359.3 b
V315.5 abc13.2 bc204.3 a179.3 a12.6 bcd25.8 a191.2 bc193.6 ab498.7 ab409.0 abc2001.5 e1817.6 de
V415.5 abc13.8 bc200.6 a137.5 b10.7 cde17.3 bc205.6 b161.3 bc530.0 ab449.8 ab1606.4 ef1540.3 e
V515.0 bc13.5 bc186.3 a193.5 a6.0 e16.6 bc235.3 a215.6 a603.2 a461.4 a1473.1 f1168 f
V616.6 a15.9 a108.5 cd91.2 cd7.8 de9.9 de159.8 d133.6 cde408.0 bc424.4 ab3926 abcd2598.3 c
V713.5 d12.4 c92.5 d86.2 cd14.2 bc19.2 b127.2 e108.9 e315.0 c294.5 bc3812.1 cd2006.9 d
V816.0 ab14.4 ab147.5 b111.8 bcd22.4 a26.9 a168.1 d126.0 de496.8 ab339.9 abc3922 bcd3132.8 b
V915.7 abc14.9 ab98.4 d74.0 d18.3 ab8.6 e152.2 d117.1 de321.5 c259.3 c4246.0 ab3851.7 a
V1015.1 bc13.8 bc141.0 b116.1 bc21.4 a28.3 a169.3 cd140.0 cde451.0 abc359.3 abc4349.3 a2643.02 c
Grand mean15.3 a13.9 b 143.8 a 120.3 b13.6 b19.5 a174.8 a 148.5 b453.3 a370.6 b3271.85 a2526.21 b
Anova
V***********************************
E*** *** *** *** *** ***
V×Ens ** *** * Ns ***
Year 2019V115.7 ab13.7 a120.4 a77.5 a13.7 d15.1 e173.2 cd127 abcd494.2 bc377.3 abc3876.8 a2424 a
V216.5 a14.2 a140.6 a83.5 a14.9 ab16 abcd149.4 de120.1 bcd404.5 bcd259.0 bc2127.7 cd2070.3 abc
V315.0 ab13.8 a163.1 a103.1 a11.9 f15.7 de216.7 ab170.4 abc329.6 cd323.0 abc1886.4 d1752.5 bc
V415.2 ab14.3 a107.3 a38.3 a15.3 a16.1 cd204.6 bc183.2 ab791.2 a399.4 ab1233.9 e1124.5 de
V515.5 ab14.3 a154.6 a68.5 a14.8 ab16.3 bcd250.8 a198.2 a564.5 b428.4 a771.2 f817.4 e
V616.0 a15.3 a107.1 a60.8 a12.6 e16.1 cd137.9 ef88.4 d413.2 bcd274.0 abc3429.2 ab1582 bcd
V713.5 b14.1 a106.5 a55.3 a14.5 bc16 abcd109.2 f93.4 d380.8 bcd246.5 c3166.7 b2027.6 abc
V815.8 ab14.4 a124.5 a49.0 a15.1 ab17.2 a143 def106.1 cd330.4 cd267.8 abc2514.8 c2087.6 ab
V915.1 ab14.4 a99.4 a53.5 a15.0 ab17.1 ab131.4 ef101.8 cd303.7 d272.0 abc2105.5 cd2037 abc
V1014.3 ab13.7 a149.4 a66.3 a14.0 cd16.7 abc140 def102.6 cd382.6 bcd278.3 abc3085.8 b1462.9 cd
Grand mean15.3a14.2b130.5a66.5 b14.2 b16.3 a165.7 a127.2 b427.3 a308.6 b2419.84 a1738.64 b
Anova
V*nsnsns***********************
E*** *** *** *** *** ***
V×Ens ns *** * ** ***
BothYns *** *** *** *** ***
yearsV×Y* *** *** *** ** ***
E×Yns *** *** ns ** *
V×E×Yns ** * ns ns ***
ww: well-watered; ds: drought stress; NLA: number of leaf appeared; PHS: plant height after stress; DLW: dead leaves weight; PHT: plants height at harvest; SDW: Straw dry weight; Yield: grain yield (kg ha−1); V: variety; E: environment; Y: year; *** significant at p = 0.001; ** significant at p = 0.01; * significant at p = 0.05; ns: not significant, the means with same letters are not significant; the bold indicate the highest and lowest value measured.
Table 5. Variety and environment per se performance compared among ten sorghum varieties and two water treatments (well-watered and drought stress) for agrophysiological traits measured during 2018 and 2019 field trials.
PnCETleaf
Vwwdswwdswwdswwds
Year 2018V143.14 a31.92 abc213.06 a119.35 cd9.34 a5.06 ab36.34 cd40.70 ab
V241.57 ab33.29 abc189.14 ab101.85 d7.00 b4.00 b34.80 d39.12 abc
V339.88 ab39.66 a179.04 ab169.84 ab7.12 b6.42 a40.30 ab39.83 abc
V438.99 ab38.61 a169.08 b140.07 abcd7.38 b5.58 ab40.77 a39.77 abc
V535.64 b26.05 bc169.11 b128.31 bcd7.13 b4.45 ab39.87 ab39.08 bc
V642.17 ab39.83 a202.09 ab181.85 a7.56 ab6.16 a39.32 ab40.94 a
V740.69 ab37.81 a194.62 ab181.45 a6.39 b5.89 a40.40 ab39.54 abc
V838.16 ab38.02 a182.93 ab183.21 a7.68 ab6.36 a40.83 a38.51 c
V936.05 ab35.74 ab166.88 b166.72 ab7.50 ab6.53 a39.34 ab39.02 bc
V1037.70 ab22.96 c186.72 ab147.17 abc7.22 b4.61 ab37.83 bc38.75 c
Grand mean39.32 a34.43 b184.94 a150.97 b7.43 a 5.47 b 39.02 b39.53 a
Anova
V*******************
E*** *** *** **
V×E*** *** *** ***
Year 2019V147.03 a22.66 c193.03 a78.41 c7.28 ab4.00 b38.75 b42.86 ab
V242.37 abc29.28 abc189.03 a108.90 bc7.25 ab5.17 ab39.98 a42.72 ab
V341.56 abc35.05 ab191.45 a140.03 ab6.70 abc5.73 ab40.44 a41.68 bc
V437.76 bc34.51 ab137.08 b135.79 ab6.12 c5.40 ab38.30 bc43.11 a
V541.08 abc27.06 abc167.77 ab96.88 bc7.24 ab4.96 ab39.94 a40.73 c
V638.79 abc26.58 abc165.52 ab94.97 bc6.89 abc5.23 ab40.50 a42.12 ab
V743.72 ab35.59 ab194.77 a177.36 a7.65 a6.18 a37.36 c42.34 ab
V834.15 c27.81 abc164.44 ab98.39 bc6.56 bc4.78 ab40.00 a40.62 c
V943.24 ab25.57 bc190.44 a93.53 bc7.14 abc4.64 ab37.63 bc43.27 a
V1044.10 ab36.41 a197.92 a134.17 ab7.61 a6.11 a38.67 b42.06 ab
Grand mean41.38 a29.90 b179.14 a115.88 b7.04 a5.22 b39.16 b42.15 a
Anova
V*********************
E*** *** *** ***
V×E*** *** ** ***
BothYns *** ** ***
V×Y*** *** *** *
yearsE×Y*** *** ns ***
V×E×Y*** *** ** **
ww: well-watered; ds: drought stress; Pn: photosynthesis rate; C: stomatal conductance; E: leaf transpiration; Tleaf: leaf temperature; SDW: Straw dry weight; V: variety; E: environment; Y: year; *** significant at p = 0.001; ** significant at p = 0.01; * significant at p = 0.05; ns: not significant, the means with same letters are not significant; the bold indicate the highest and lowest value measured.
Table 6. Average performance and statistical parameters of roots length density (RLD) and number of total roots (NTR) traits of sorghum varieties under well-watered and drought stress conditions.
NTRRLD [0–120 cm]RLD [0–50 cm]RLD [60–120 cm]
Vwwdswwdswwdswwds
V163.00 a28.66 ab1922.80 a1687.83 g3457.35 c2764.00 a800.02 c1578.33 c
V232.00 f22.33 cd1760.68 bc2041.48 c3286.61 e2698.90 b654.07 f1571.89 c
V340.33 c26.00 bc1751.29 bc1769.92 f3358.45 d2435.41 f648.08 f1294.57 e
V450.33 b31.66 a1467.24 e1574.29 h2519.95 h2236.74 g715.29 e1090.53 f
V562.66 a28.66 ab1781.89 bc1945.37 e3245.57 e2641.44 c719.73 e1448.18 d
V640.00 cd28.66 ab1739.46 bc1993.00 d3564.50 b2520.00 e873.33 a1421.00 d
V736.00 e25.33 bc1827.72 b2190.90 b3311.3 de2598.55 d772.75 cd1807.34 b
V842.00 c30.66 a1991.88 a2453.95 a3659.27 a2704.23 b800.89 c2266.67 a
V937.00 de25.00 bcd1625.93 d1687.83 g2738.30 g2271.24 g831.38 b1271.11 e
V1037.00 de21.33 d1696.45 cd1757.95 f3121.66 f2428.02 f763.37 d1279.32 e
Grand mean44.03 a26.83 b 1758.61 b1897.27 a3214.64 a2522.88 b757.89 b1502.8 a
Anova
V************************
E*** *** *** ***
V×E*** *** *** ***
ww: well-watered; ds: drought stress; NTR: number of total roots; RLD: roots length density (m m−2); [0–120 cm]; [0–50 cm] and [60–120 cm] represent considered depth; V: variety; E: environment; *** significant at p = 0.001; the means with same letters are not significant; the bold indicate the highest and lowest value measured.
Table 7. The key traits involved in clusters classification, their technique and stage to phenotype under early water deficit in sorghum and their interest for breeding.
TraitsClustersStagePhenotypingInterest for Breeding
Roots Length Density 1,3,4GrowthMetricRelated yield set up
Soil water stock-GrowthMetricRelated yield set up
Plant height3,1,2Growth, maturityMetricBiomass increasing
Dead leaves weight2,1GrowthMetricRelated yield set up
Photosynthesis rate1,3,4GrowthMetricRelated yield set up
Transpiration rate1,3,4GrowthMetricRelated yield set up
Grain weight (yield)2,4,3MaturityMetricYield increasing
Straw dry weight3,1,2,3Growth, maturityMetricBiomass increasing
Publisher’s Note: MDPI stays neutral with regard to jurisdictional claims in published maps and institutional affiliations.

