Article

Safe Haven for Bitcoin: Digital and Physical Gold or Currencies?

1
Faculty of Economics and Administrative Sciences, Afyon Kocatepe University, Afyon 03200, Turkey
2
Institute of Management Commerce and Economics, Shri Ramswaroop Memorial University, Barabanki 225003, India
3
Department of Economics, College of Business Administration, Princess Nourah bint Abdulrahman University, Riyadh 84428, Saudi Arabia
4
Faculty of Economics and Management of Mahdia, University of Monastir, Monastir 5000, Tunisia
*
Author to whom correspondence should be addressed.
J. Theor. Appl. Electron. Commer. Res. 2025, 20(3), 171; https://doi.org/10.3390/jtaer20030171
Submission received: 6 April 2025 / Revised: 26 May 2025 / Accepted: 23 June 2025 / Published: 5 July 2025
(This article belongs to the Special Issue Blockchain Business Applications and the Metaverse)

Abstract

The recent economic turmoil and the increasing volatility of bitcoins have necessitated the need for exploring safe-haven assets for bitcoins. In this quest, the present study aims to investigate the safe haven for bitcoins by examining the dynamic relationship between bitcoins, gold, foreign exchange, and stablecoins. This is achieved by calculating hedge ratios and portfolio weight ratios for various asset classes, by employing adaptive-based techniques such as generalized orthogonal generalized autoregressive conditional heteroscedasticity, corrected dynamic conditional correlation, corrected asymmetric dynamic conditional correlation, and asymmetric dynamic conditional correlation under various market and time-varying conditions. The empirical estimate reveals that all the selected asset classes are effective risk diversifiers for bitcoins. However, among all the asset classes, as per the hedge and portfolio weight ratio, Japanese yen, stablecoin for Japanese yen and Great Britain Pound, and Crypto Holding Frank Token (lowest-cost hedging strategies) are the most effective risk diversifiers when compared with bitcoins. Moreover, while considering external economic shocks, the empirical estimate posits that stablecoins are more stable risk diversifiers compared to the asset class they represent. Furthermore, in terms of the bivariate portfolio analysis formed with bitcoin, this study concludes that the weight of bitcoin is more stable when combined with gold, tether gold, Euro, Great Britain Pound, Swiss franc, and Japanese Yen. Thus, these assets are attractive for long-term investment strategies. This study provides investors and policymakers with significant insight into understanding safe-haven assets for bitcoin’s volatility and constructing a flexible portfolio that is dependent on the investment timeline and the prevailing market conditions.

1. Introduction

Recently, global economies have witnessed severe turbulence due to various global events like the COVID-19 pandemic, the Russia–Ukraine war, the U.S.–China trade policy conflict, etc. These disruptive events have not only impacted the micro and macro dimensions of economies, but they have also created a significant ripple effect on the global financial markets, leading to significant volatility in asset prices [1]. Due to the rising volatility in the international financial markets, globally, investors have started seeking alternative safe instruments, often referred to as safe-haven assets. Conventionally, physical gold and stable fiat currencies, due to their high intrinsic value and stability, have been the preferred choice for safe-haven assets [2]. However, recently, cryptocurrencies, particularly bitcoin, a prominent digital currency, have garnered significant attention and introduced new dynamics into the safe-haven discourse. Bitcoin, which was introduced by Satoshi Nakamoto in 2009, was initially considered a speculative asset. In reference to the evolving metaverse ecosystem, where digital assets are considered integral for commercial transactions, the growing volatility of flagship cryptocurrencies, such as bitcoin, raises a serious concern for financial stability and value preservation. Metaverse platforms that predominantly function within tokenized economies are increasingly dependent on stablecoins for transactions, asset exchanges, and pricing mechanisms. Therefore, under such circumstances, identifying effective safe havens for bitcoins is not only crucial for the global financial market, but it will also ensure value stability and transactional trust within the realm of the metaverse. The exploration of the safe-haven potential of alternative investment instruments, such as fiat currencies, gold, stablecoins, etc., which are already integral to metaverse payment gateways, will provide insight for developers, users, and businesses operating within these virtual economies.
However, properties such as decentralization, finite supply, and rising mainstream acceptability have increased its potential as a safe-haven asset [3]. Within this framework, several scholars have examined the safe-haven properties of bitcoins under various market conditions. Additionally, they have also explored whether the safe-haven properties of bitcoins are similar to those of gold and traditional financial assets. In this context, few studies posit that bitcoins work as a safe-haven instrument, providing cover against currency devaluation, inflation, and stock market fluctuations, and they also function as a digital counterpart to gold (please refer to [4,5,6]). However, another strand of the literature suggests that although bitcoins perform well during various market conditions and share similar characteristics to traditional safe havens, due to high correlation and volatility, the global financial market sometimes weakens its safe-haven properties. During severe market downturns, bitcoin can sometimes function more like a risky asset (please refer to [7,8]).
Within the realm of research, the arguments supporting bitcoins as safe-haven instruments are significantly stronger than those considering bitcoins as risky assets. Recently, a few studies highlighted that the price volatility in bitcoin is extremely high; prices not only fluctuate over a longer duration, but they also show variation on a daily basis. The extant literature asserts that the volatility of bitcoin surpasses that of conventional stock markets by eight times [9]. During COVID-19, a similar volatility in bitcoin prices was also recorded, with a low of USD 5 k, a high of USD 60 k in 2021, a subsequent correction to USD 20 k, and a 300 percent increase is still being recorded. Recent studies by Symitsi and Chalvatzis [10] and Zhang et al. [11] have also reported high volatility in bitcoin prices. Given the excess volatility and fluctuation in bitcoin prices, investors started searching for alternative securities to hedge against bitcoin price volatility, or, in other words, started looking for a safe haven against bitcoin price volatility. The search for alternative safe havens prompted the question of which asset class could function as a safe haven for bitcoins. To answer this question, the present study attempts to explore the safe-haven characteristics of gold and currency against bitcoins. Specifically, this study investigates how gold (ons), and the currencies EUR, GBP, CHF, and JPY, along with their highest market cap crypto counterparts XAUT, EUS, GBPU, CHFT, and GYEN, provide a safe haven against bitcoins. A limited number of studies have explored safe havens for bitcoins; for instance, Baumöhl [12] explored possible cryptocurrencies as safe havens for bitcoins. Similarly, Baur and Hoang [13] investigated stablecoins as a potential safe haven for bitcoins. Nedved and Kristoufek [14] recently investigated whether oil and stock markets could serve as potential safe havens for bitcoins. However, within the limitations of the studies reviewed, there is no specific study that has examined a combination of currencies and their counterparts’ highest market-capitalized cryptocurrencies and gold, as safe havens for bitcoins. Against this backdrop, the present study attempts to explore the aforementioned relationship.
This study makes significant contributions to the existing literature in several ways. Firstly, to the best of the author’s knowledge, this study is the first to investigate the safe haven for bitcoins, incorporating a combination of major currencies, their highest market-capitalized stablecoins, and gold. This will significantly contribute to the existing literature exploring safe havens for bitcoins. Most of the previous studies examined oil, equities, gold, and stablecoins as safe havens against bitcoins (please refer to [13,14]). However, as previously stated, none of the studies analyzed the major currencies and their highest market-capitalized stablecoins as safe havens for bitcoins. Analyzing the aforementioned relationship will aid in comprehending how bitcoins respond to price volatility, exchange dynamics, market sentiment, inflation hedging, and global financial integration. This understanding will assist policymakers in understanding the interplay between currencies, cryptocurrencies, and bitcoins, thereby facilitating strategic and informed decision-making. Secondly, the present study attempts to examine the diversification properties of three different asset classes, i.e., gold, major traded currencies, and their counterpart stablecoins, which will assist investors in the selection of an optimal portfolio during complex market situations like geopolitical conflict, the Russian–Ukraine war, and the COVID-19 pandemic. Third, the present study also sheds light on different risk management strategies, highlighting the various asset diversification options available to investors during market turmoil. Additionally, in the context of methodological novelty, researchers have employed several distinct methodologies to explore the safe-haven properties among different asset classes. These methodologies include the linear and nonlinear autoregressive distribution lag approach [15], the copula approach [16], the wavelet quantile correlation methodology [17], other available long run and short run model estimates, etc. [18]. However, this study accounts for potential structural breaks by incorporating sine and cosine functions into bitcoin’s variance equation, given that the analysis period includes numerous global economic shocks, most notably the COVID-19 pandemic, and several other events significantly influencing cryptocurrency markets. Ignoring these structural breaks in the modeling phase could substantially reduce the reliability of our findings. Considering the known limitation of standard GARCH models in fully capturing structural breaks, we then compare the suitability of this model with the classic GARCH (generalized autoregressive conditional heteroskedasticity) model. The findings (see Table 1) indicate that the adaptive GARCH model, which considers potential structural breaks in bitcoin, is more appropriate. Finally, given the significance of adaptive GARCH, we estimated the most suitable multivariate adaptive GARCH model for each pair involving BTC and diversification options. In our case, GOGARCH (generalized orthogonal GARCH), cDCC (corrected dynamic conditional correlation), cADCC (corrected asymmetric dynamic conditional correlation), and ADCC (asymmetric dynamic conditional correlation) emerged as the most suitable models to explore the dynamic correlations amid different asset classes and find the dynamic portfolio weights and hedge ratios between different pairs. They permit us to find out in a more convenient way the conditional correlations, hedge ratios, and volatility dynamics between different asset classes.
The remaining parts of this study are organized as follows. Section 2 offers an in-depth assessment of the existing literature, focusing on bitcoin and its safe-haven properties. Section 3 sheds light on the methodology employed. Section 4 presents the results and analysis, while the final section discusses the concluding remarks and policy implications.

2. Literature Review

Evaluating safe-haven instruments during market turmoil is one of the most explored areas among academicians and industry experts. In this context, numerous scholars have conducted extensive studies on the interconnection between different asset classes, examining how they react and provide hedging during market crises. The current section offers a comprehensive review that explores the safe-haven properties of various asset classes, particularly bitcoins. To enhance clarity, we have divided the literature review into three distinct sections. The first section provides an extensive review of bitcoin’s safe-haven properties; the second section highlights those studies that project bitcoins as a risky asset; and finally, the last section covers a comprehensive review of those studies that focus on safe havens against bitcoin price volatility.

2.1. Bitcoin as Safe Haven

Traditionally, investors have referred to gold, government bonds, and stable currencies like Swiss francs as safe havens because of their stability during market turmoil [19]. Later, as cryptocurrencies evolved, investors began to view them as potential safe havens. In this regard, Kliber et al. [20], using a stochastic volatility model with the dynamic conditional correlation, analyzed the safe-haven properties of bitcoins on different stock markets based on the country’s economic condition, and concluded that bitcoins act as a potential safe haven for Venezuela and bolivars. In addition to investment in China and Japan, bitcoin acts as a risk diversifier. In the same way, Paule-Vianez et al. [21] studied the safe-haven properties of bitcoins against economic uncertainty using linear regression and quantile regression. They found that bitcoin returns and volatility go up during uncertain times, which is similar to how gold reacts. This supports bitcoin’s safe-haven properties. Kayral et al. [22] also reported a similar outcome when examining bitcoins’ safe-haven properties against G7 stocks using the DVECH-GARCH methodology. The authors posit that bitcoins acted as a safe haven against G7 stock indices before the COVID-19 pandemic and as diversifiers during the Russia–Ukraine conflict. In a recent study, Regaieg et al. [23] used the Markov-switching autoregressive (MS-AR) model to compare the safe-haven properties of bitcoins to the U.S. dollar index. The authors suggested that bitcoins offer higher returns than the U.S. dollar index even during a recession, which could be a sign of a safe-haven property. In yet another study, Tarchella et al. [24] explored the safe-haven properties of gold, oil, and cryptocurrencies against the G7 equity market during pre- and post-COVID-19 under different market conditions using linear and nonlinear generalized autoregressive conditional heteroskedasticity models. This study confirms that even though gold provides a safe haven against all market conditions, bitcoin is the best safe haven against the G7 equity market under stressful market conditions. In addition to the above studies, there are several other studies that have addressed similar findings and have strengthened the arguments that among all cryptocurrencies, bitcoin offers the best safe-haven properties against stock markets, oil volatility, and currency fluctuations (please refer to [4,5,6,25,26]). However, the context of the aforementioned studies, there is another strand of the literature that asserts that bitcoin prices are highly volatile and hence cannot be considered a safe haven and can only be treated as a risk diversifier. The subsequent section focuses on those studies that highlight bitcoins as a weak save haven and highly risky instruments.

2.2. Bitcoins as a Weak Safe Haven and a Risk Asset

Given the high price volatility, some researchers have asserted that bitcoins serve as a risk diversifier, while others have questioned their potential as a safe haven against market turmoil. In this context, Shahzad et al. [27], while exploring the role of bitcoins and gold against prominent indices using a cross-quantilogram approach, suggested that bitcoin cannot be treated as a strong safe haven against stock market volatility. A similar outcome is suggested by Canlon et al. [28], who explored the safe-haven characteristics of cryptocurrencies against equity market volatility. The author confirmed that bitcoins and ethereum are not safe havens against most of the international stock market indices. Similarly, Chemkha et al. [29] examined the interconnection between gold and bitcoins and the stock market performance of major developed and developing economies during COVID-19 by employing an asymmetric dynamic conditional correlation model. The authors provide compelling evidence that bitcoins cannot be treated as a safe haven against market turbulence due to their increased variability. Wang et al. [30] explored the ability of gold, commodities, and bitcoin as hedging instruments against market upheaval by employing the TVP-VAR model and concluded that in terms of safe-haven properties, bitcoin is ranked at the lowest position compared to gold and commodities. In addition, these authors also concluded that during market turbulence, the stock market acts as a major net spillover transmitter, whereas bitcoins and commodities act as net recipients. Recently, Rashid et al. [31] used a Markov regime-switching regression model to look into the safe-haven properties of bitcoins in relation to equity markets, currencies, foreign exchange markets, and financial markets. They found that bitcoin has a positive relationship with equity markets in both regimes, which means it cannot be a safe haven against any asset class. Due to its high volatility, these authors suggested that bitcoin may range as a diversifier or a hedger. In addition to the aforementioned studies, several other studies reported similar outcomes, projecting bitcoins more as a diversifier than a safe haven due to their highly volatile price volatility and unpredictability (please refer to [7,8]).
The aforementioned literature review depicts contradictory outcomes the context of the classification of bitcoins as a safe haven or as a risky asset, which poses a prominent question that has yet to be fully addressed. This divergence is probably because of methodological variations, distinct sample periods, and the selection of benchmark assets or dynamic market conditions, such as the COVID-19 pandemic, the Russia–Ukraine conflict, the U.S.–China trade war, etc. However, an important question that persists is the concept of the reverse perspective: while numerous studies characterize bitcoin as a safe haven for conventional assets, there is a notable scarcity of research exploring whether other assets serve as safe havens for bitcoin, especially in times of significant volatility within the cryptocurrency market. Examining this inverse relationship can yield a more profound insight into bitcoin’s function within contemporary diversified portfolios. The following section presents a concise examination of the literature exploring safe havens for bitcoins.

2.3. Safe Haven for Bitcoins

Given the high price volatility and ongoing debate surrounding the safety of bitcoins, a few scholars have also endeavored to explore alternative safe havens for bitcoins. In this context, Baumöhl [12] explored the connection between forex and cryptocurrencies using a quantile cross-spectral approach and concluded a negative dependency between the selected forex and cryptocurrencies, which offer a significant safe haven to investors against cryptocurrencies. Similarly, Baur and Hoang [13] conducted an investigation to determine if stablecoins could serve as a safe haven for bitcoins. Their findings revealed a negative correlation between bitcoins and stablecoins, particularly tether. This suggests that stablecoins can serve as a safe haven for bitcoins during periods of extreme price volatility. Recently, Nedved and Kristoufek [14] also attempted to explore the safe-haven properties of gold, oil, and stock markets for bitcoins and concluded that bitcoins and stock markets have a positive association whereas gold has a negative association with bitcoins, which implies precious metals can serve as a potential safe haven for bitcoins.
The present study aligns with the growing but limited literature that explores safe havens for bitcoin, rather than the more common practice of examining whether bitcoin acts as a hedge or safe haven for standard financial assets. For example, Baur and Hoang [13] and Nedved and Kristoufek [14] investigated whether stablecoins or gold provide safety during a bitcoin price decline, finding evidence that supports this reverse perspective. Nonetheless, this strand of the literature remains fragmented and lacks a unified consensus, particularly under evolving market conditions or structural changes. Moreover, the majority of the previously mentioned studies have either concentrated on stock markets as a safe haven for bitcoins, or they have encompassed a broad range of cryptocurrencies instead of solely focusing on bitcoins. The current study adds to this debate by potentially concentrating on the directionality of the safe-haven relationship. We explore whether selected traditional and digital assets, like gold, major currencies, and highly market-capitalized stablecoins, can serve as safe havens for bitcoin. In accomplishing this objective, we move beyond the prevailing narrative of bitcoin as a safe haven for other assets and alternatively focus on its vulnerabilities and what assets may mitigate them. This repositioning permits us to bridge the gap between two opposing classifications of bitcoin by highlighting that its behavior may differ depending on its wider asset context and prevailing market conditions.
Additionally, as already highlighted, most of the existing studies typically focus on a limited range of conventional or digital assets, such as gold, a single stablecoin, or equities. Nonetheless, the current study also distinguishes itself by encompassing a wider and more varied set of financial instruments, such as prominent fiat currencies, their highest market capitalization stablecoins, and gold. The inclusion of a diverse set of financial instruments permits us a more detailed analysis of bitcoin’s interactions with both conventional and digital safe-haven assets. Nonetheless, this approach also presents specific constraints. The initial consideration involves the potential heterogeneity of asset classes, such as commodities, fiat currencies, and crypto assets, which may result in structural and behavioral inconsistencies that impact the comparability of models. Secondly, the availability of data and the alignment of frequencies across a diverse array of assets can pose challenges to maintaining time-series consistency and uniformity in econometric modeling. Third, the differences in liquidity size, trading patterns, and market maturity could potentially introduce noise or bias into the estimates of volatility and correlation. In light of the aforementioned challenges, the incorporation of a wider array of assets enhances the external validity and practical significance of the findings, particularly concerning contemporary diversified portfolios that encompass both conventional and digital financial instruments. Additionally, we have also taken measures to mitigate these limitations by employing robust model selection frameworks (e.g., adaptive GARCH and multivariate GARCH), ensuring empirical rigor while capturing the real-world complexity of financial market interconnections. Against this backdrop, the present study attempts to measure a safe haven for bitcoins by including a comprehensive set of major traded currencies, their highest market capitalization stablecoins, and gold.

3. Methodology

In this study, we examine the diversification roles of gold, foreign exchange rates, and their stablecoin counterparts for bitcoin through dynamic correlations, hedge ratios, and portfolio weights. Figure 1 presents the flowchart of our analysis process.
Before the analysis, we convert the daily price series into a daily return series and examine the descriptive statistics of these return series. To account for potential structural breaks in bitcoin, we incorporate the Fourier series into the GARCH equation and model bitcoin using the adaptive GARCH, demonstrating its superiority over the classic GARCH model. Next, we estimate the most appropriate multivariate adaptive GARCH models for the bivariate datasets consisting of bitcoin and each diversification option. Afterwards, we conduct residual diagnostics for these models, confirming their suitability, as no issues were found in the diagnostics. Using these appropriate models, we proceed with modeling the datasets. Following the model application, we dynamically obtain the variances in the series and the correlations and covariances between bitcoin and its diversification options. Finally, using the covariances and variances, we calculate the hedge ratio and the weight of bitcoin in a one-unit portfolio, where bitcoin holds a long position, and the diversification option holds a short position. As part of the methodology, we introduce the adaptive GARCH model and the estimated suitable multivariate adaptive GARCH models for the bivariate datasets.

3.1. Adaptive GARCH

The adaptive GARCH model incorporates the Fourier series, as proposed by Anderson and Bollerslev [32], into the variance equation of the GARCH model [33] as a time-varying intercept term. This allows the model to account for potential structural breaks in the series and the periodically changing dynamics in the markets. Consequently, the model considers the possible structural breaks in bitcoin and the evolving market dynamics. Equation (1) presents the formula for the adaptive GARCH model:
σ t 2 = ω t   +   α 1   ε t 1 2   +   β σ t 1 2
where σt2 represents the conditional variance, εt−1 provides information about the previous period’s volatility, and α and β denote the ARCH and GARCH parameters, respectively. ω t represents the time-varying intercept term modeled using the Fourier series. To incorporate the Fourier series, the model utilizes the sine and cosine components of the series:
ω t = ω 0 + j = 1 k   s j sin 2 π j t T + c j c o s 2 π j t T
In Equation (2), ω 0 represents the constant term, while s j and c j denote the sine and cosine components, respectively, and T represents the total number of observations.

3.2. DCC, cDCC, ADCC, and cADCC

The DCC and its derivative models are implemented in two stages. In the first stage of our study, we apply a univariate adaptive GARCH model to each series. In the second stage, we calculate the DCC and the variants between bitcoin and the potential diversification assets.
The DCC model, developed by Engle [34], decomposes the covariance matrix H t as H t = S t P t S t , where the diagonal matrix S t represents the standard deviations from the univariate adaptive GARCH models, and P t denotes the correlation matrix. To ensure the positive definiteness of the covariance matrix, the correlation matrix P t must be positively definite. Additionally, all elements of the correlation matrix P t must, by definition, be equal to or less than one ( P t ≤ 1). To satisfy these requirements, the correlation matrix P t is decomposed as follows:
P t = C * 1 C t C * 1
C t = 1 k m C ¯ + k t 1 t 1 T + m C t 1
where C ¯ = c o v a r i a n c e ( t t T ) ”, where the parameters k and m are scalars. The elements of the diagonal matrix C * 1 are the square roots of the diagonal elements of C t . Additionally, in Equation (4), which represents the DCC model, k represents the shocks, while m denotes the dynamic correlations.
c o r x y , t = c o v x y , t v a r x x , t v a r y y t
In Equation (5), c o r x y , t represents the conditional correlation between x and y, c o v x y , t denotes the covariance between x and y, and v a r x x , t and v a r y y , t represent the variances of x and y, respectively. While the DCC model captures dynamic correlations, it does not account for the asymmetric effects of past correlations. Equation (6) presents the ADCC model [35], which reveals the impact of past positive and negative correlations on subsequent correlations between the series.
C t = C ¯ k C ¯ m C ¯ ψ F ¯ + k y ~ t 1 y ~ t 1 + ψ G t 1 G t 1 + m C t 1
where k represents the effect of shocks, m denotes the dynamic correlations, and ψ is a dummy variable that takes the value of 1 when the series have negative returns or are equal to zero. Additionally, the parameter estimates in the DCC model tend to be less consistent than the cDCC model [36]. Equation (7) presents the cDCC model:
C t = 1 k m H + k { C t * 1 / 2 t 1 t 1 C t * 1 / 2 } + m C t 1
In Equation (7), H represents the unconditional covariance matrix of C t * 1 / 2 t . The cDCC model assumes that the c o v x y , t matrix follows an autoregressive process [37]. Due to its ability to provide more consistent results than the DCC model and to examine the impact of past correlations on subsequent correlations, the ADCC and cADCC models are used together. Equation (8) presents the cADCC model formula [38,39]:
C t = 1 k m C ¯ ψ ϕ t ¯ + k t 1 t 1 T + ψ G t 1 G t 1 T + m C t 1

3.3. GO-Adaptive GARCH

Another multivariate GARCH model used in this study is the GO-adaptive GARCH. For the GO-adaptive GARCH model, we integrate the adaptive GARCH into the GOGARCH model developed by Van der Weide [40]. First, the return vector r t is transformed into orthogonal components ( O t ):
O t = P r t
where the matrix P consists of the eigenvectors of the correlation matrix. Afterwards, the adaptive GARCH model is applied to each orthogonal component:
σ it 2 = ω i t   +   α 1   O it 1 2   +   β σ it 1 2
where the time-varying intercept term ω i t is modeled using Fourier series:
ω i t = ω i 0 + j = 1 k s i j s i n 2 π j t T + c i j c o s 2 π j t T
The orthogonal transformation is reversed in the next step, and the covariance matrix is reconstructed.
Σ t = P D t P
D t represents the diagonal matrix that contains the conditional variances of each series. This step enables the conditional variances calculated from the orthogonal components to be transformed into the covariance matrix of the original multivariate series.

3.4. HR and PW

After analyzing the bivariate datasets consisting of bitcoin and the diversification options using multivariate adaptive GARCH models, we obtain dynamic variance values for each series and dynamic covariance values for the bivariate series. Using the variance and covariance values, we calculate the hedge ratio and bitcoin’s weight in a one-unit portfolio, where bitcoin holds a long position, and the diversification option holds a short position. Equation (13) presents the hedge ratio:
H R x y , t = c o v x y , t v a r y y , t
where x represents bitcoin and y denotes the diversification option. H R x y , t indicates the hedging cost of bitcoin in a one-unit portfolio at time t, where bitcoin holds a long position, and the diversification option holds a short position [41]. c o v x y , t represents the covariance between bitcoin and the diversification option at time t, while v a r y y , t denotes the variance in the diversification option at time t. After calculating the hedge ratio, we determine the weight of bitcoin in a one-unit portfolio, where bitcoin holds a long position, and the diversification option holds a short position:
P W x y , t = v a r y y , t c o v x y , t v a r x x , t 2 c o v x y , t + v a r y y , t
P W x y , t represents the weight of bitcoin in a one-unit portfolio consisting of bitcoin and the diversification option at time t [42]. v a r x x , t denotes the variance in bitcoin at time t. The portfolio’s diversification option’s weight can be calculated as 1−PW.

4. Data and Results

In this study, we utilize bitcoin alongside gold, foreign exchange rates, and stablecoins backed by gold and foreign currencies with the highest (we use CHFT to provide a broader perspective, as the starting observation periods for the highest market capitalization stablecoin based on the Swiss franc (VCHF) and the second largest CHF stablecoin (ZCHF) are relatively recent (30 March 2023, and 23 May 2024, respectively)) market capitalization. Our dataset includes variables such as bitcoin (BTC), gold per ounce/USD (XAU), Euro/USD (EU), Great Britain Pound/USD (GBP), Swiss franc/USD (CHF), Japanese Yen/USD (JPY), and their corresponding stablecoins: tether gold/USD (XAUT), Stasis Euro/USD (EURS), Upper Pound/USD (GBPU), Crypto Holding Frank/USD (CHFT), and GYEN/USD (GYEN). We have selected the aforementioned assets based on three central rationales: Firstly, we selected assets that represent prominent global fiat currencies. Second, stablecoins are characterized by a substantial trading volume, market capitalization, and finally relevance to blockchain-integrated or metaverse-related payment gateways. We have included stablecoins such as CHFT and GBPU due to their backing by widely traded fiat currencies such as CHF and GBP, respectively, and also because of their growing prominence in both regulated and decentralized financial transaction gateways. Moreover, we have included only selected fiat-pegged stablecoins based on their consistent market liquidity and availability of historical data throughout the designated sample period. Additionally, we have excluded certain digital assets owing to their restricted market presence, low capitalization, insufficient availability across exchanges, or their lack of relevance to this study’s aim of investigating diversified safe-haven assets in relation to bitcoin. The selection criteria facilitate a comprehensive evaluation by incorporating fiat-based, conventional, and digital assets, which are increasingly significant in both the virtual financial environment and real-world interactions. The data cover the period from 10 March 2021 (we select 10 March 2021 as the starting date for our dataset because GYEN began trading on that date) to 16 August 2024. Before the analysis, we convert the daily price series obtained from “yahoofinance.com” (accessed on 30 August 2024) into daily logarithmic return series using the following formula: (100 ( I n t / I n t 1 ) ) . Table 2 presents the descriptive statistics of the return series.
The descriptive statistics indicate that the average returns of foreign exchange rates and their corresponding stablecoins, except for the Swiss franc (CHF), are negative, while bitcoin (BTC), gold (XAU), and tether gold (XAUT) exhibit positive average returns. The series with the highest average return is XAU (0.043), followed by XAUT (0.039). Regarding the standard deviation, the series with the highest values are GBPU and CHF, followed by BTC. The high standard deviations in these foreign exchange-backed stablecoins are mainly their extreme maximum (350.73 and 135.23) and minimum (−230.24 and −157.08) values. These extreme values can be attributed to shocks in the cryptocurrency market. Since GBPU and CHFT are stablecoins backed by foreign exchange, and the underlying currencies do not exhibit similar standard deviations, these high fluctuations are likely related to the stablecoins themselves or shocks occurring in the markets in which they operate. Therefore, analyzing the changes in these series over time is crucial for examining shocks and their sources. The Jarque–Bera (JB) statistics, which test for normal distribution, show that none of the series follows a normal distribution. The ADF values, which represent the results of unit root tests, indicate that all series are stationary at their levels. The Ljung–Box (LB) statistics reveal that the squared residuals of the series exhibit a serial correlation at various lag lengths, indicating the presence of conditional heteroskedasticity (ARCH effect). Consequently, applying the GARCH model to these series is appropriate, as it can account for the ARCH effect observed in the data. Additionally, the observation period includes global events with significant economic impact, such as COVID-19 (following the declaration of a global pandemic in March 2020, various mutations and vaccine-related news continued to impact global markets), the Ukraine–Russia conflict (the conflict began in February 2022 and continues as of September 2024; additionally, during the early stages of the conflict, the U.S. and Europe imposed several sanctions and restrictions on Russia, including exclusion from the SWIFT international payment system, and in response, Russia used the cryptocurrency ripple (XRP) as an alternative to the SWIFT system; this incident underscored the significance and contributions of cryptocurrencies), the collapse of SVB (Silicon Valley Bank) (March 2023), and the Israel–Palestine conflict (the conflict began in October 2023 and continues as of September 2024), as well as shocks in the crypto asset market (during the COVID-19 period, extreme fluctuations were observed in the BTC and cryptocurrency markets in March, June, October, and December 2021, and volatility in bitcoin and the crypto asset market remained elevated in subsequent periods), including bitcoin and crypto asset price shocks, the collapse of LUNA (May 2022), the hacking of Solana-based hot wallets (In August 2022, over 8000 hot wallets using the Solana blockchain system were hacked, and the cryptocurrencies stored in these wallets were stolen; at the time, Solana, the ninth-largest crypto asset by market capitalization, lost over 10% of its value [43] (p. 55)), and the bankruptcy of FTX (November 2022). Considering and addressing the impact of these shocks are essential, particularly when evaluating the safe-haven roles of gold, foreign exchange rates, and their corresponding stablecoins in relation to bitcoin. Therefore, employing a dynamic model is essential. 
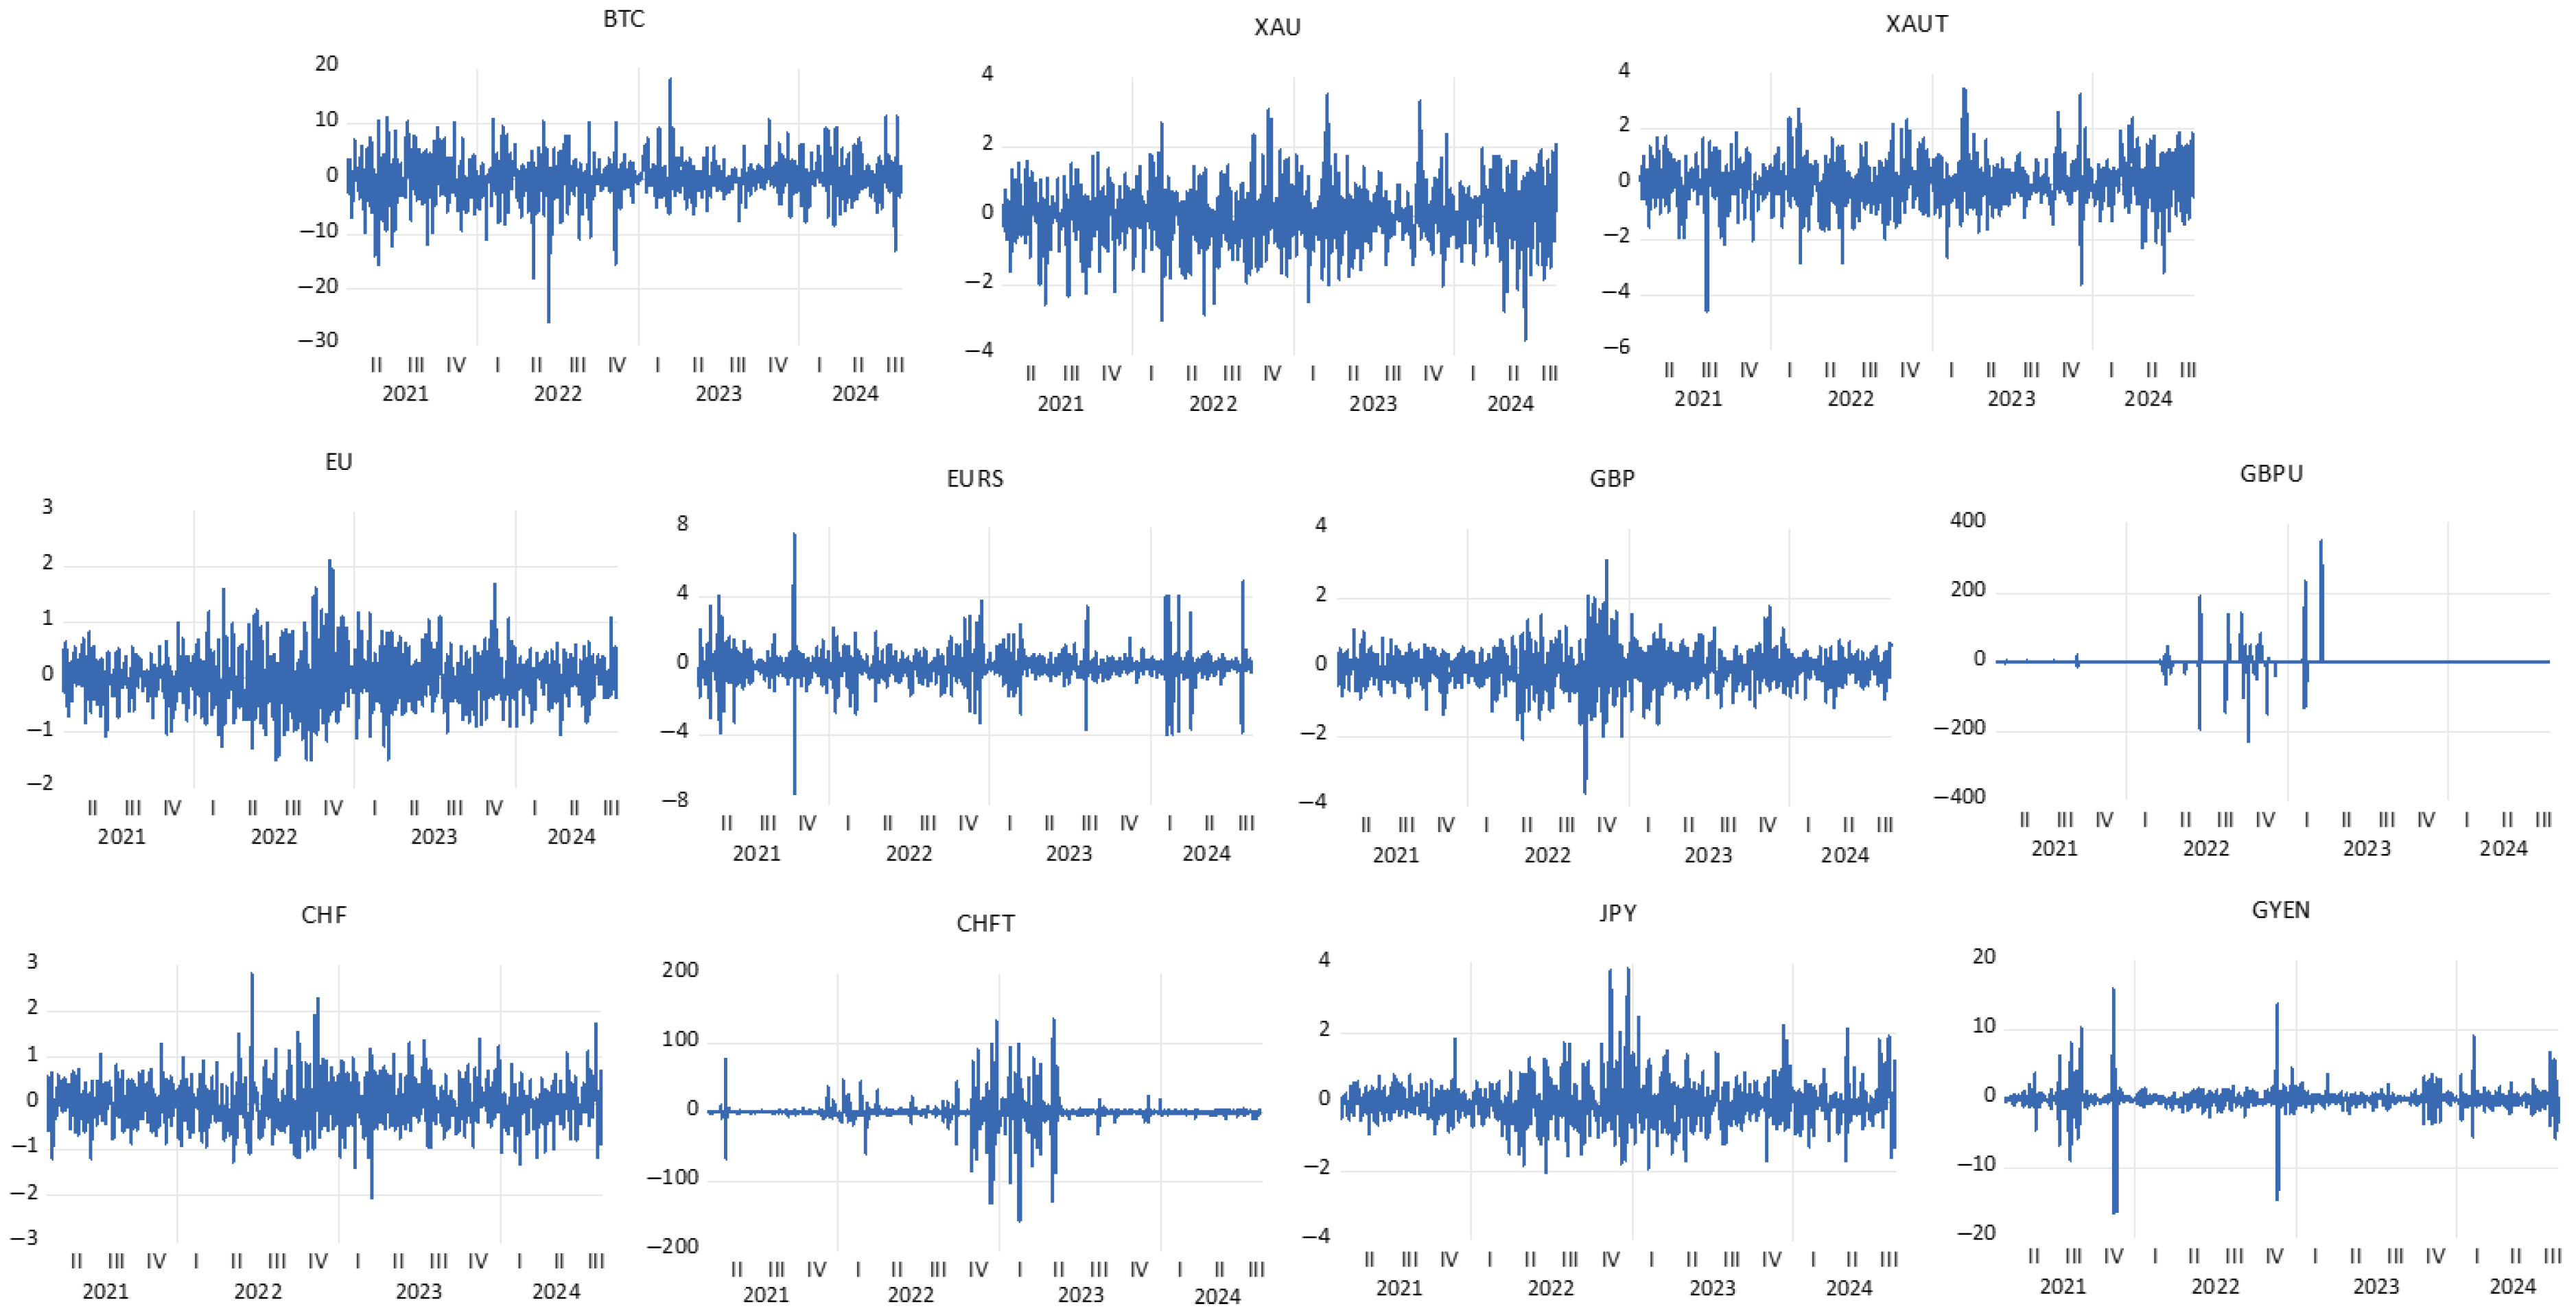
Figure 2 presents the time-series graphs of BTC and its diversification options.
The time-series graphs demonstrate that all series exhibit volatility and that this volatility fluctuates over time. The observation period encompasses both global events with economic implications and periods of price shocks within the crypto asset market. However, these global or cryptocurrency-specific events do not affect all series equally. Global events with economic impacts, such as COVID-19, the Ukraine–Russia conflict, the collapse of SVB, and the Israel–Palestine conflict, influence the volatility of all series. Additionally, price shocks in the cryptocurrency market during March, June, October, and December 2021, as well as the collapse of LUNA in May 2022, the hacking of Solana-based hot wallets in August 2022, and the bankruptcy of FTX in November 2022, significantly affect the volatility of BTC, gold, and foreign exchange-backed stablecoins. However, the impact of both global and cryptocurrency market shocks varies across the series. The time-varying nature of volatility in the series highlights the need to consider these shocks when examining the safe-haven roles of gold, foreign exchange rates, and their stablecoin counterparts in relation to bitcoin. It also underscores the necessity of using a dynamic model to capture the changing effects over time. In this study, we first model bitcoin using an adaptive GARCH model, incorporating sine and cosine functions into the variance equation to account for potential structural breaks. We then compare the adequacy of this model with that of the standard GARCH model to determine which approach better captures the dynamics of bitcoin. By doing so, we identify whether the model accounting for potential structural breaks or the standard GARCH model is more suitable for modeling bitcoin’s volatility. Table 1 presents the estimation results for the appropriate model for bitcoin.
Table 1 indicates that for all three information criteria, the adaptive GARCH model, which incorporates sine and cosine functions into the variance equation to account for potential structural breaks, is the most appropriate model for modeling BTC. In the next phase, we analyze bitcoin alongside its diversification options in pairs (BTC and the diversification option) using a multivariate dynamic adaptive GARCH approach. Prior to this analysis, we estimated the optimal multivariate adaptive GARCH model for each BTC-diversifier pair by incorporating sine and cosine functions of BTC volatility into Scalar-BEKK, Diag-BEKK, DCC, DCC-DECO, cDCC, ADCC, cADCC, and GOGARCH models. Table 3 presents the best-fitting adaptive GARCH models selected for each pair based on information criteria.
The findings from Table 3 indicate that the most suitable multivariate adaptive GARCH model for the pairs BTC-XAU, BTC-JPY, BTC-XAUT, BTC-EURS, and BTC-GYEN is the GOGARCH model. For the pairs BTC-EU, BTC-GBP, and BTC-GBPU, the optimal model is the cADCC, while the ADCC model is found to be the best fit for BTC-CHF, and the cDCC model is the most appropriate for BTC-CHFT. Subsequently, the selected optimal models were applied to each bivariate dataset, and their appropriateness was confirmed by checking for ARCH effects in the squared residuals using the Ljung–Box test, as shown in Table 4.
The residuals of all multivariate adaptive GARCH models constructed for BTC and its diversification options show no issues of conditional heteroskedasticity across different lag lengths, indicating that the ARCH effects have been effectively eliminated. As a result, the identified models are deemed appropriate and applicable for the series. Following the application of the multivariate adaptive GARCH models for each BTC-diversification pair, we obtain time-varying correlations, covariances, and variances in the series. We then calculate the dynamic hedge ratio and portfolio weight using these covariances and variances. Table 5 presents the average correlation between BTC and its diversification options and the average hedging ratio (HR) and portfolio weights (PWs) for a unit portfolio, where BTC holds a long position, and the diversification option holds a short position.
The findings reveal that the series with the lowest correlation coefficient with BTC is GYEN (−0.067), followed by JPY (0.004), CHFT (0.018), and XAUT (0.033). According to Baur and Lucey [19] a weak correlation between two assets suggests that they can serve as effective diversifiers for each other, while a strong negative correlation indicates that the assets could be more than just diversifiers—they could act as safe havens. In this regard, while most diversification options appear to be effective diversifiers for BTC, GYEN shows potential to be more than just a diversifier and may serve as a safe-haven asset. The average hedge ratios show that when diversification options are added to a long BTC portfolio in a short position, the portfolios containing JPY and GYEN have negative hedge ratios, while other series exhibit positive hedge ratios. This means that adding JPY and GYEN in the same direction as BTC (long/long or short/short) could be a more effective diversification strategy. Additionally, CHFT and XAUT stand out as the lowest-cost hedging strategies among the diversification options when paired with BTC. The average portfolio weights support these findings, indicating that less CHFT is required to hedge BTC compared to other assets, with GBPU and GYEN following suit. As a result, CHFT, GBPU, and GYEN emerge as more effective diversification options, even at lower allocation levels, when constructing a portfolio that includes BTC.
Given that this study’s observation period includes global events with economic impact and significant shocks in the crypto asset market, dynamically analyzing the correlation, hedge ratios, and portfolio weights can provide valuable insights into the impact of these shocks and the importance of employing dynamic strategies. 
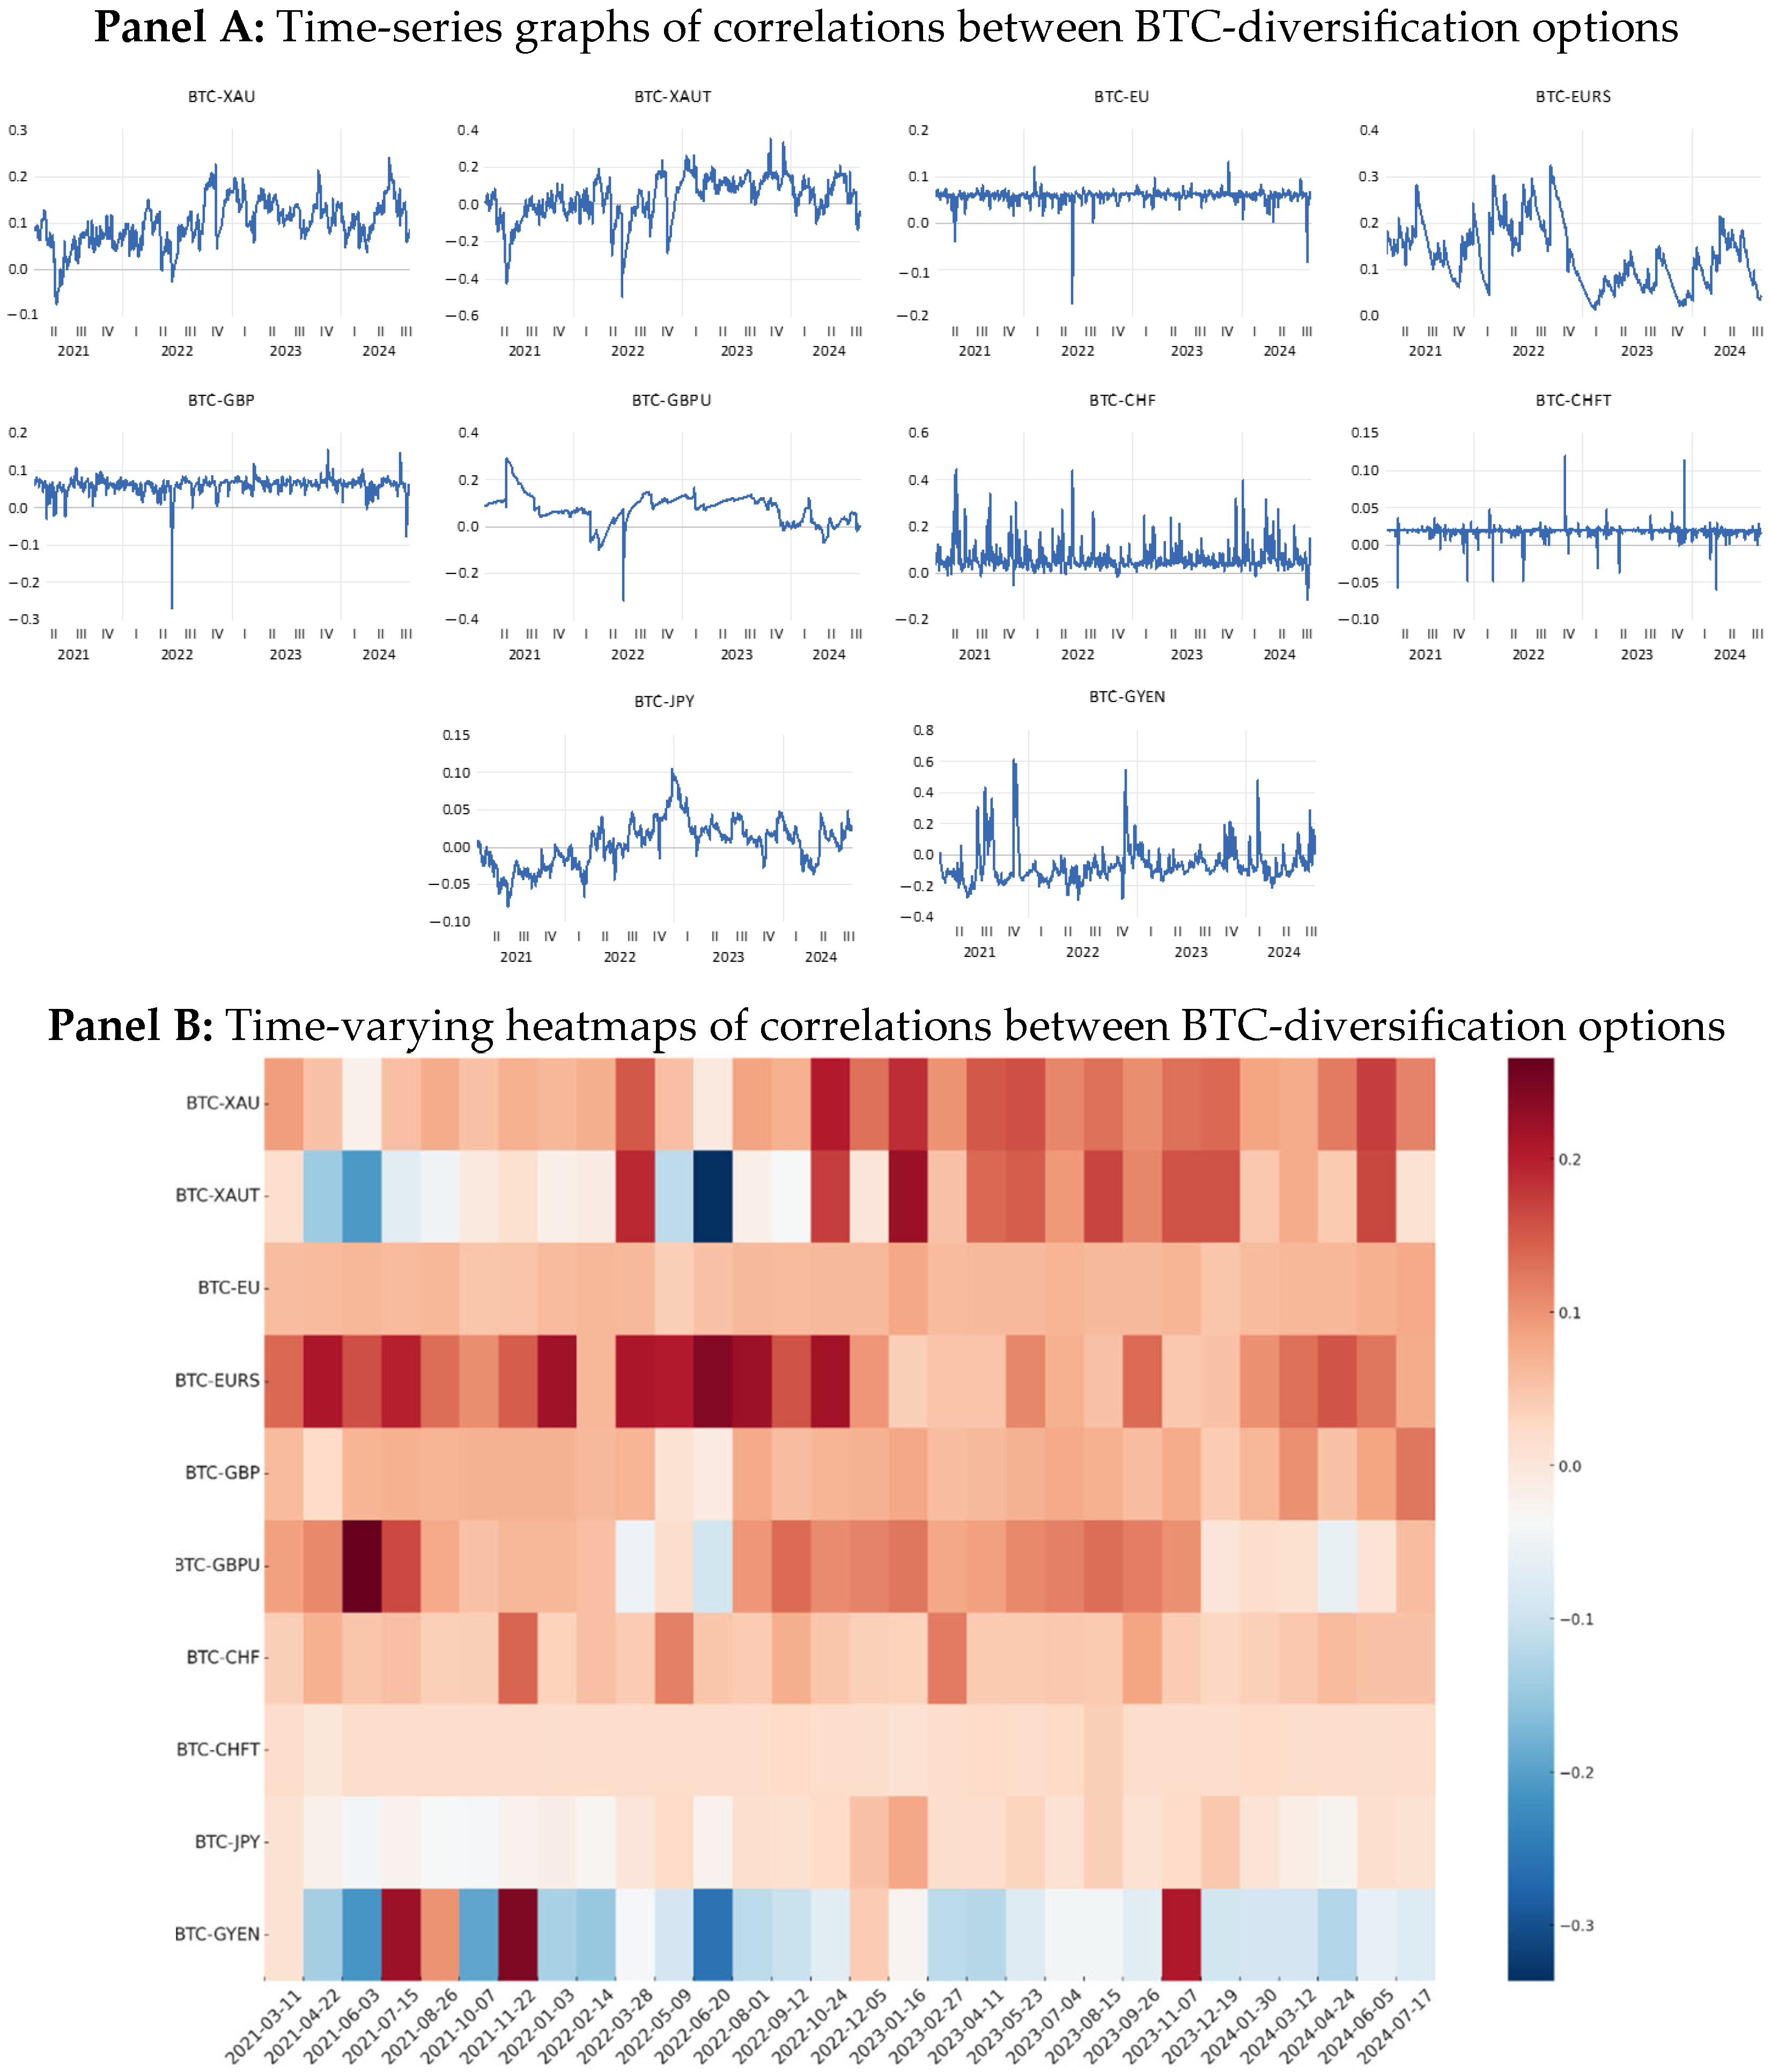
Figure 3 illustrates the time-varying correlations between BTC and its diversification options using graphs and heat maps.
The dynamic correlation findings indicate that the correlations between BTC and its diversification options fluctuate over time, with significant increases and decreases in some periods, varying according to the specific diversification option. Periods of sharp shifts in correlation tend to coincide with global economic events and crypto asset market shocks. However, the impact of these global or crypto-specific events on the correlation pairs differs. Furthermore, the correlations between BTC and gold or foreign exchange rates differ from those between BTC and their stablecoin counterparts backed by gold or currencies. The correlation between BTC and XAU (gold) was negative during May–June 2021 and May–June 2022 but positive throughout the rest of the observation period. In contrast, the correlations between BTC and XAUT differ from those with XAU, with more frequent negative values. Similarly, the correlation between BTC and EU shows variations compared to the correlations between BTC and foreign exchange-backed stablecoins. Overall, the correlations between BTC and gold or foreign exchange-backed stablecoins tend to be lower and more negative than those with the corresponding gold or currency assets. This suggests that stablecoins backed by gold and foreign currencies provide a more stable diversification option than the assets they represent. These outcomes are consistent with the study of Katsiampa [44] and Gorse and Tzeng [45], who examined the volatility and correlation of various stablecoins, including those backed by gold, compared them with traditional gold assets, and suggested that gold-backed stablecoins offer reduced volatility compared to gold itself.
However, the time-varying nature of correlations, influenced by global and cryptocurrency market shocks, highlights the importance of developing a dynamic portfolio diversification strategy. Despite this variability, the correlation findings reveal that all the diversification options generally offer good diversification potential. Among these, JPY and GYEN stand out as the most effective, followed by CHFT, XAUT, CHF, GBP, GBPU, and EU.
To further explore the diversification potential of gold, foreign exchange rates, and their stablecoin counterparts for BTC, we calculate BTC’s hedge ratios and portfolio weights in bivariate portfolios, where BTC is paired with each diversification option. 
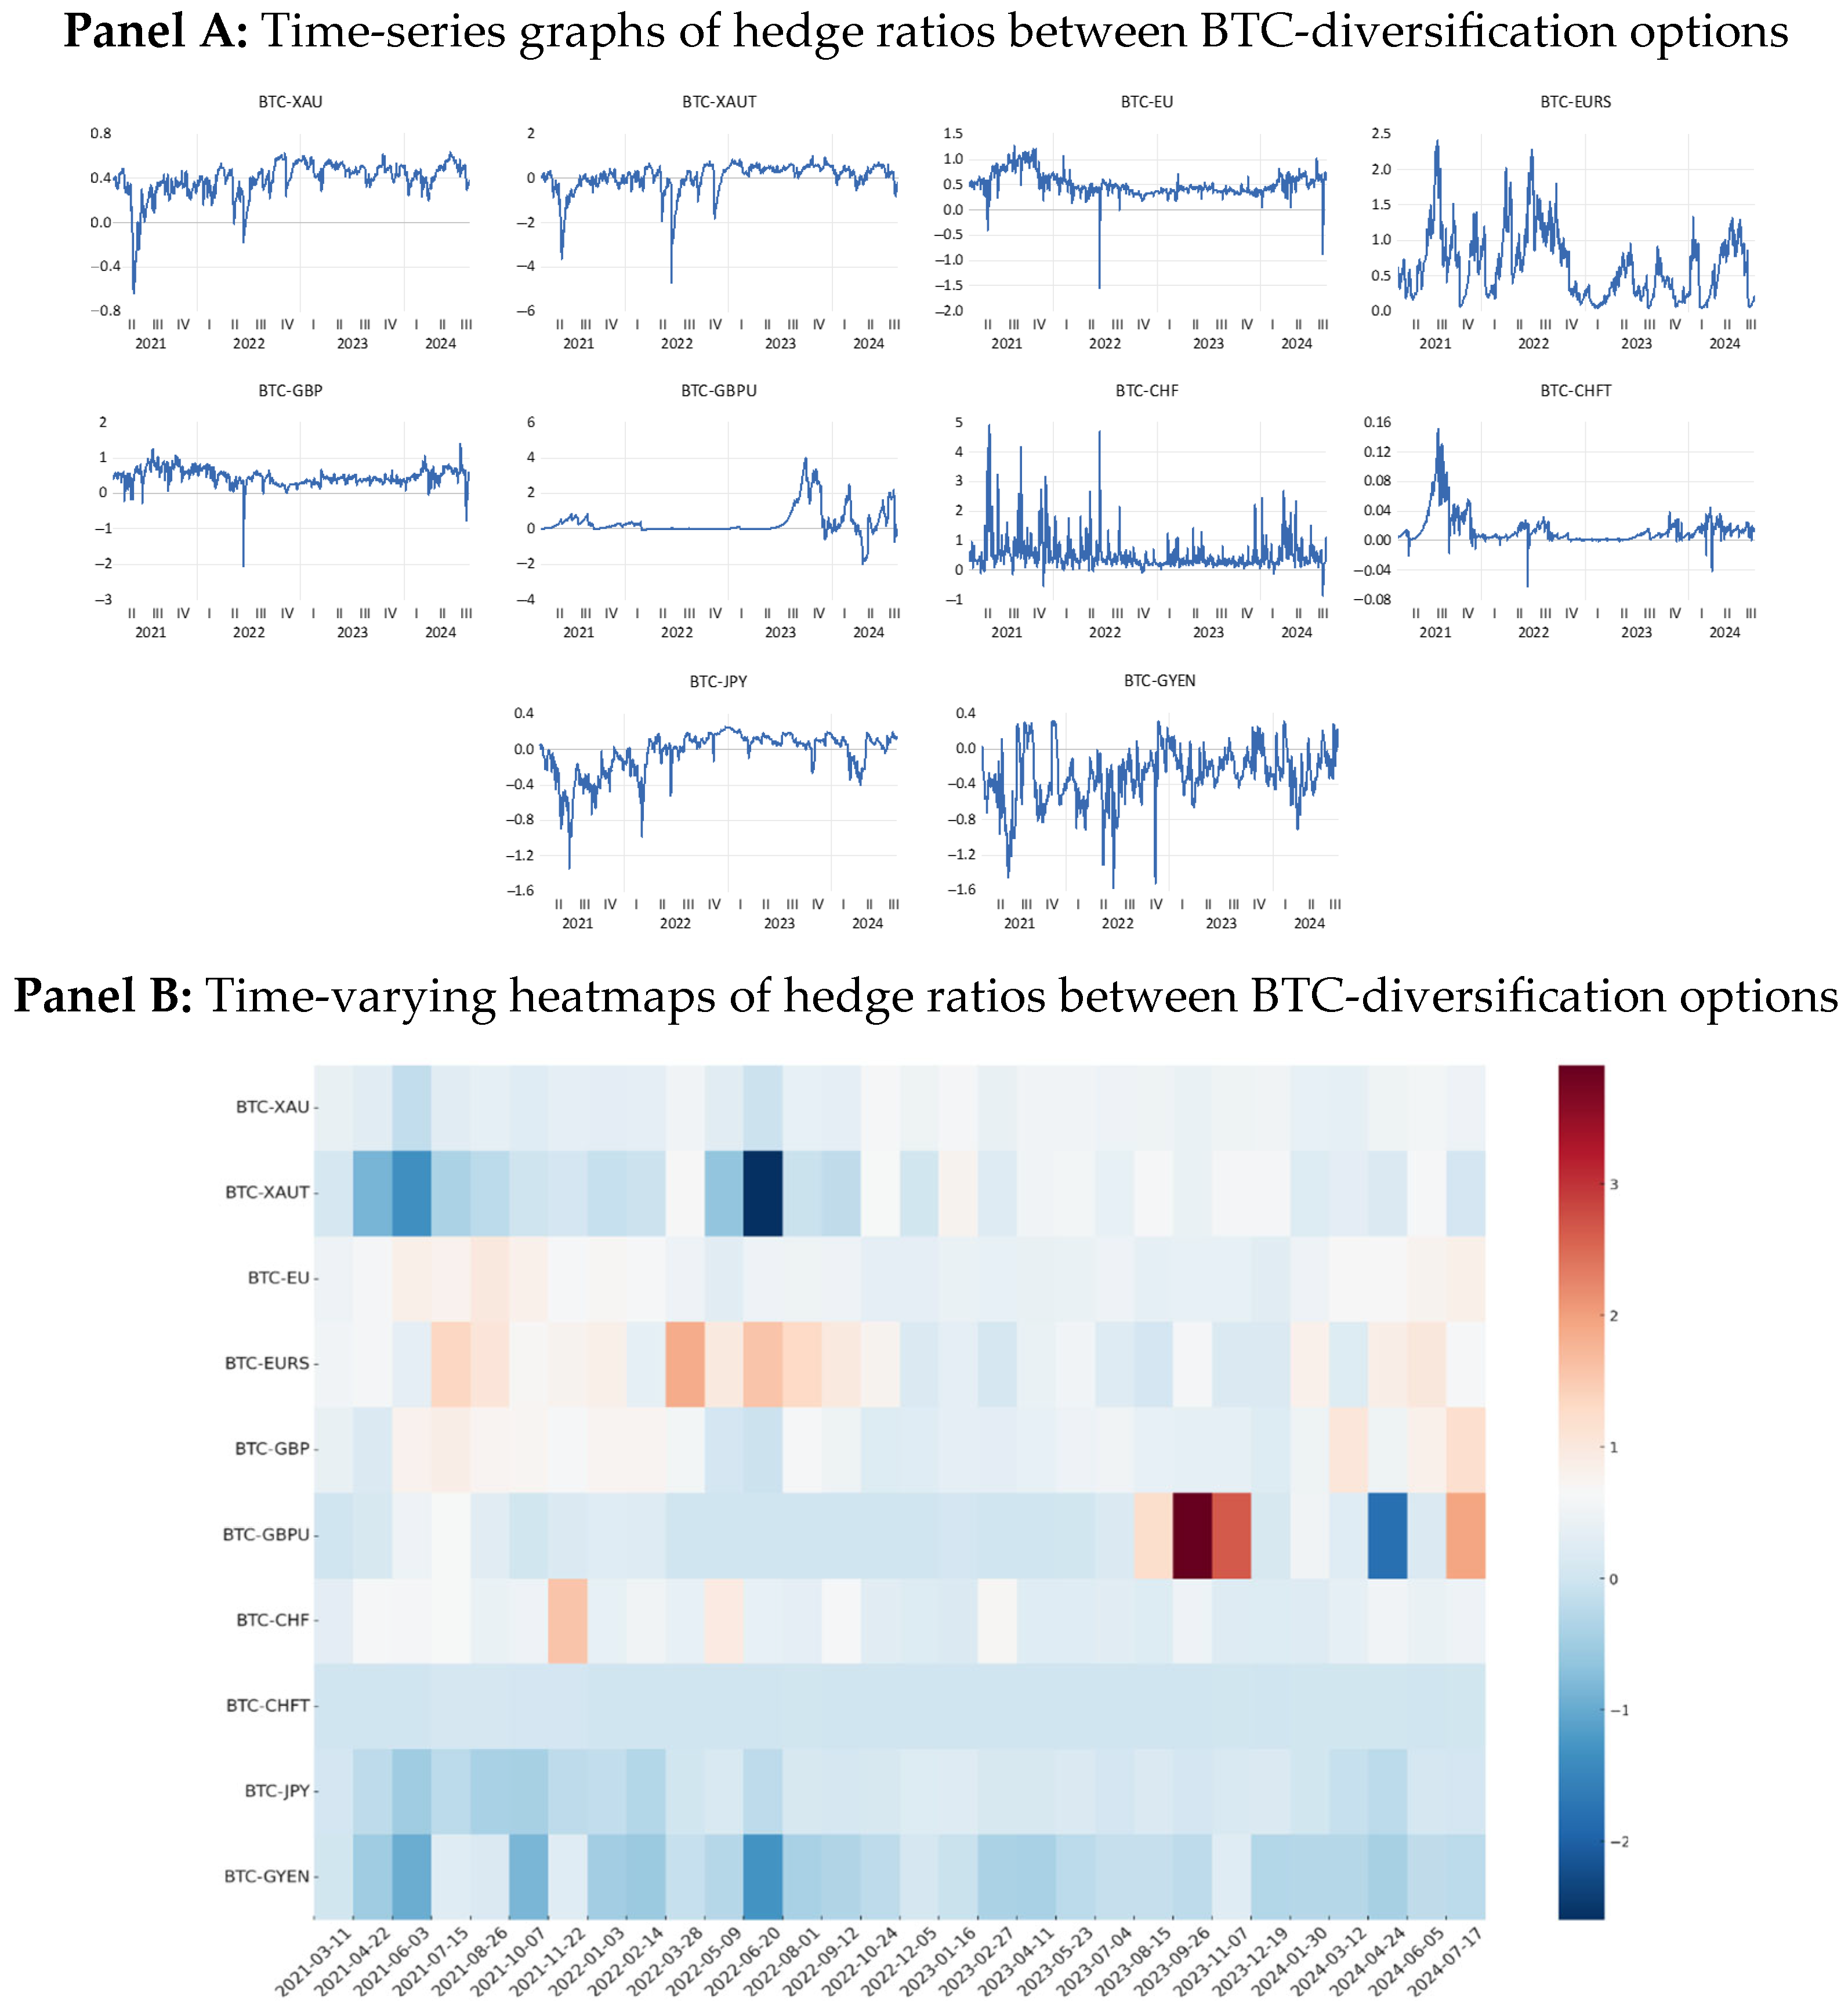
Figure 4, graphically and through heat maps, presents the dynamic hedge ratios of portfolios in which BTC holds a long position and the diversification option holds a short position.
The hedge ratio and portfolio cost in bivariate portfolios of BTC and various diversification options fluctuate over time. Although the hedge ratios for portfolios combining BTC with JPY and GYEN are volatile, they are generally negative. Therefore, adding JPY and GYEN in the same direction as BTC (long/long or short/short) proves to be a more effective strategy for portfolio diversification. On the other hand, CHFT offers a long-term, low-cost diversification advantage compared to other options. However, the hedge ratios of all bivariate portfolios change over time, and during periods of significant changes, the best diversification option also varies. This variation implies that diversification strategies must adapt over time.
The periods of fluctuation in hedge ratios are closely tied to global economic events or shocks in the crypto asset market. During these periods, hedge ratios experience significant spikes or drops, or they switch from positive to negative and vice versa. This indicates that the proportion and direction of the diversification option added to a BTC portfolio differ depending on the specific economic or market events impacting the portfolio. The findings suggest that a dynamic portfolio diversification strategy is essential for managing BTC effectively, aligning with the results from the dynamic correlation analysis. While all diversification options offer some benefit, JPY and GYEN emerge as the most effective diversifiers, with CHFT providing stable, long-term diversification at a lower cost and in periods of market shocks, adding diversification options in the same direction as BTC tends to be a more effective strategy.
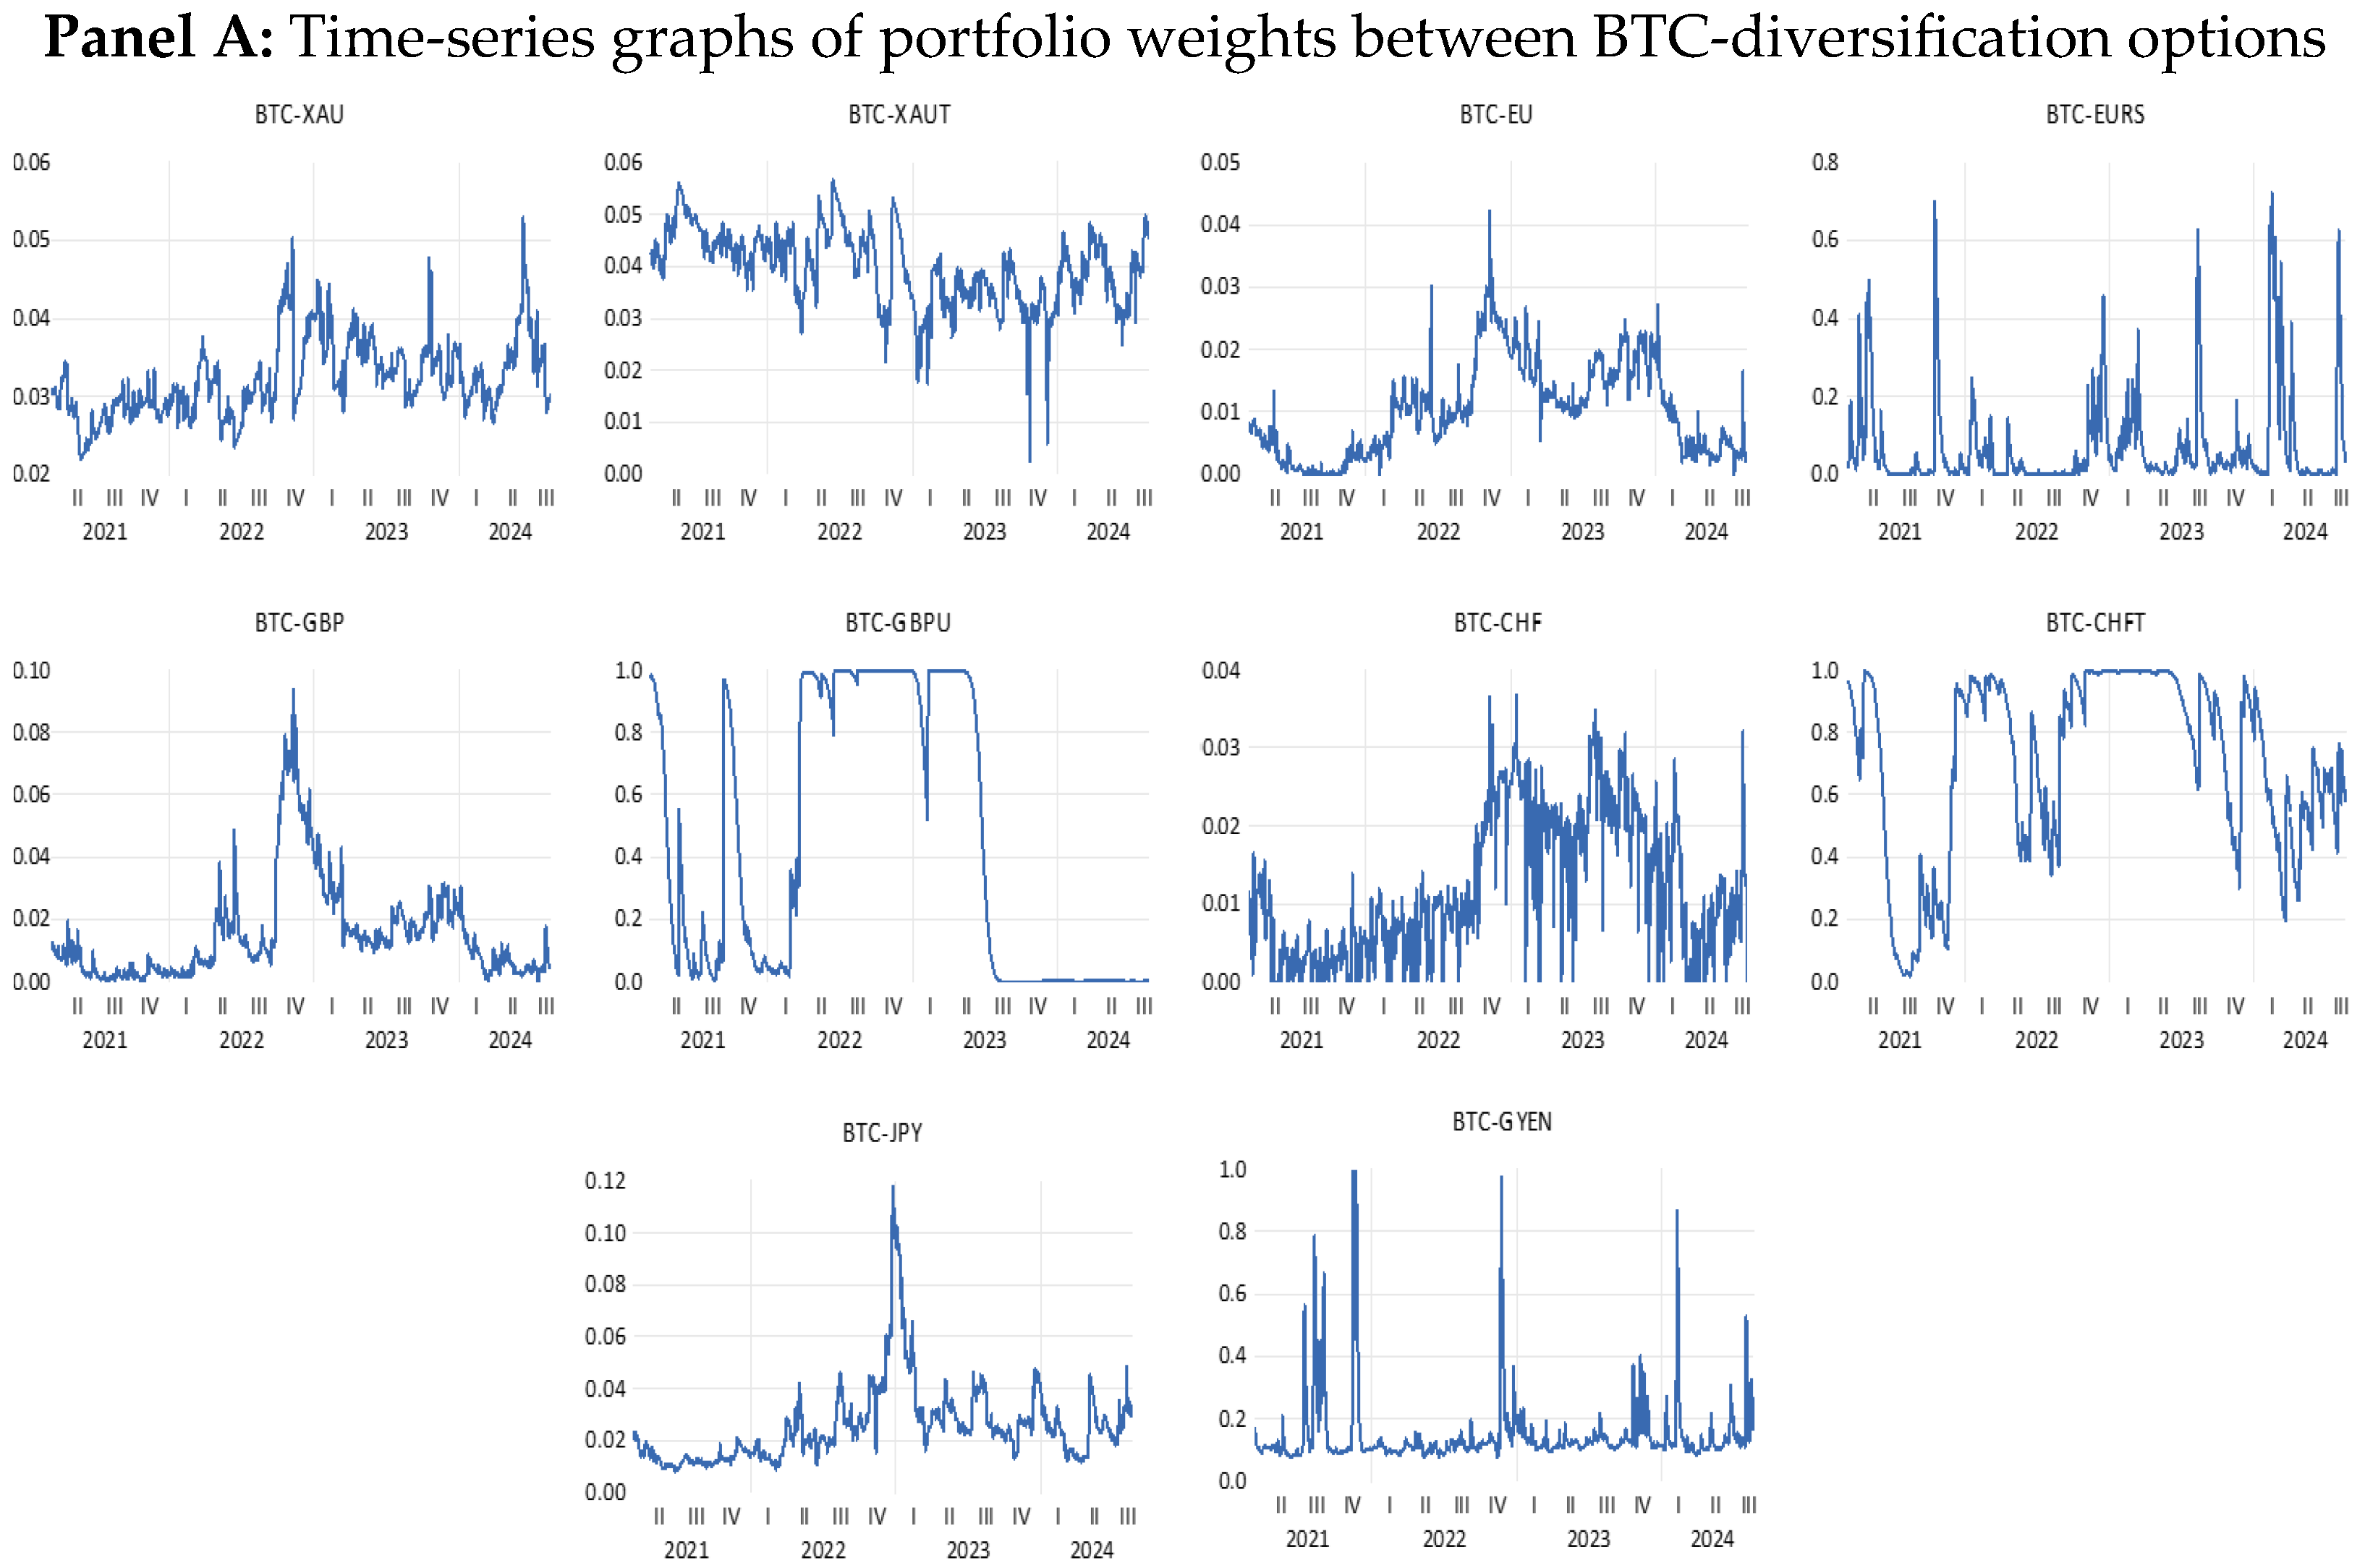
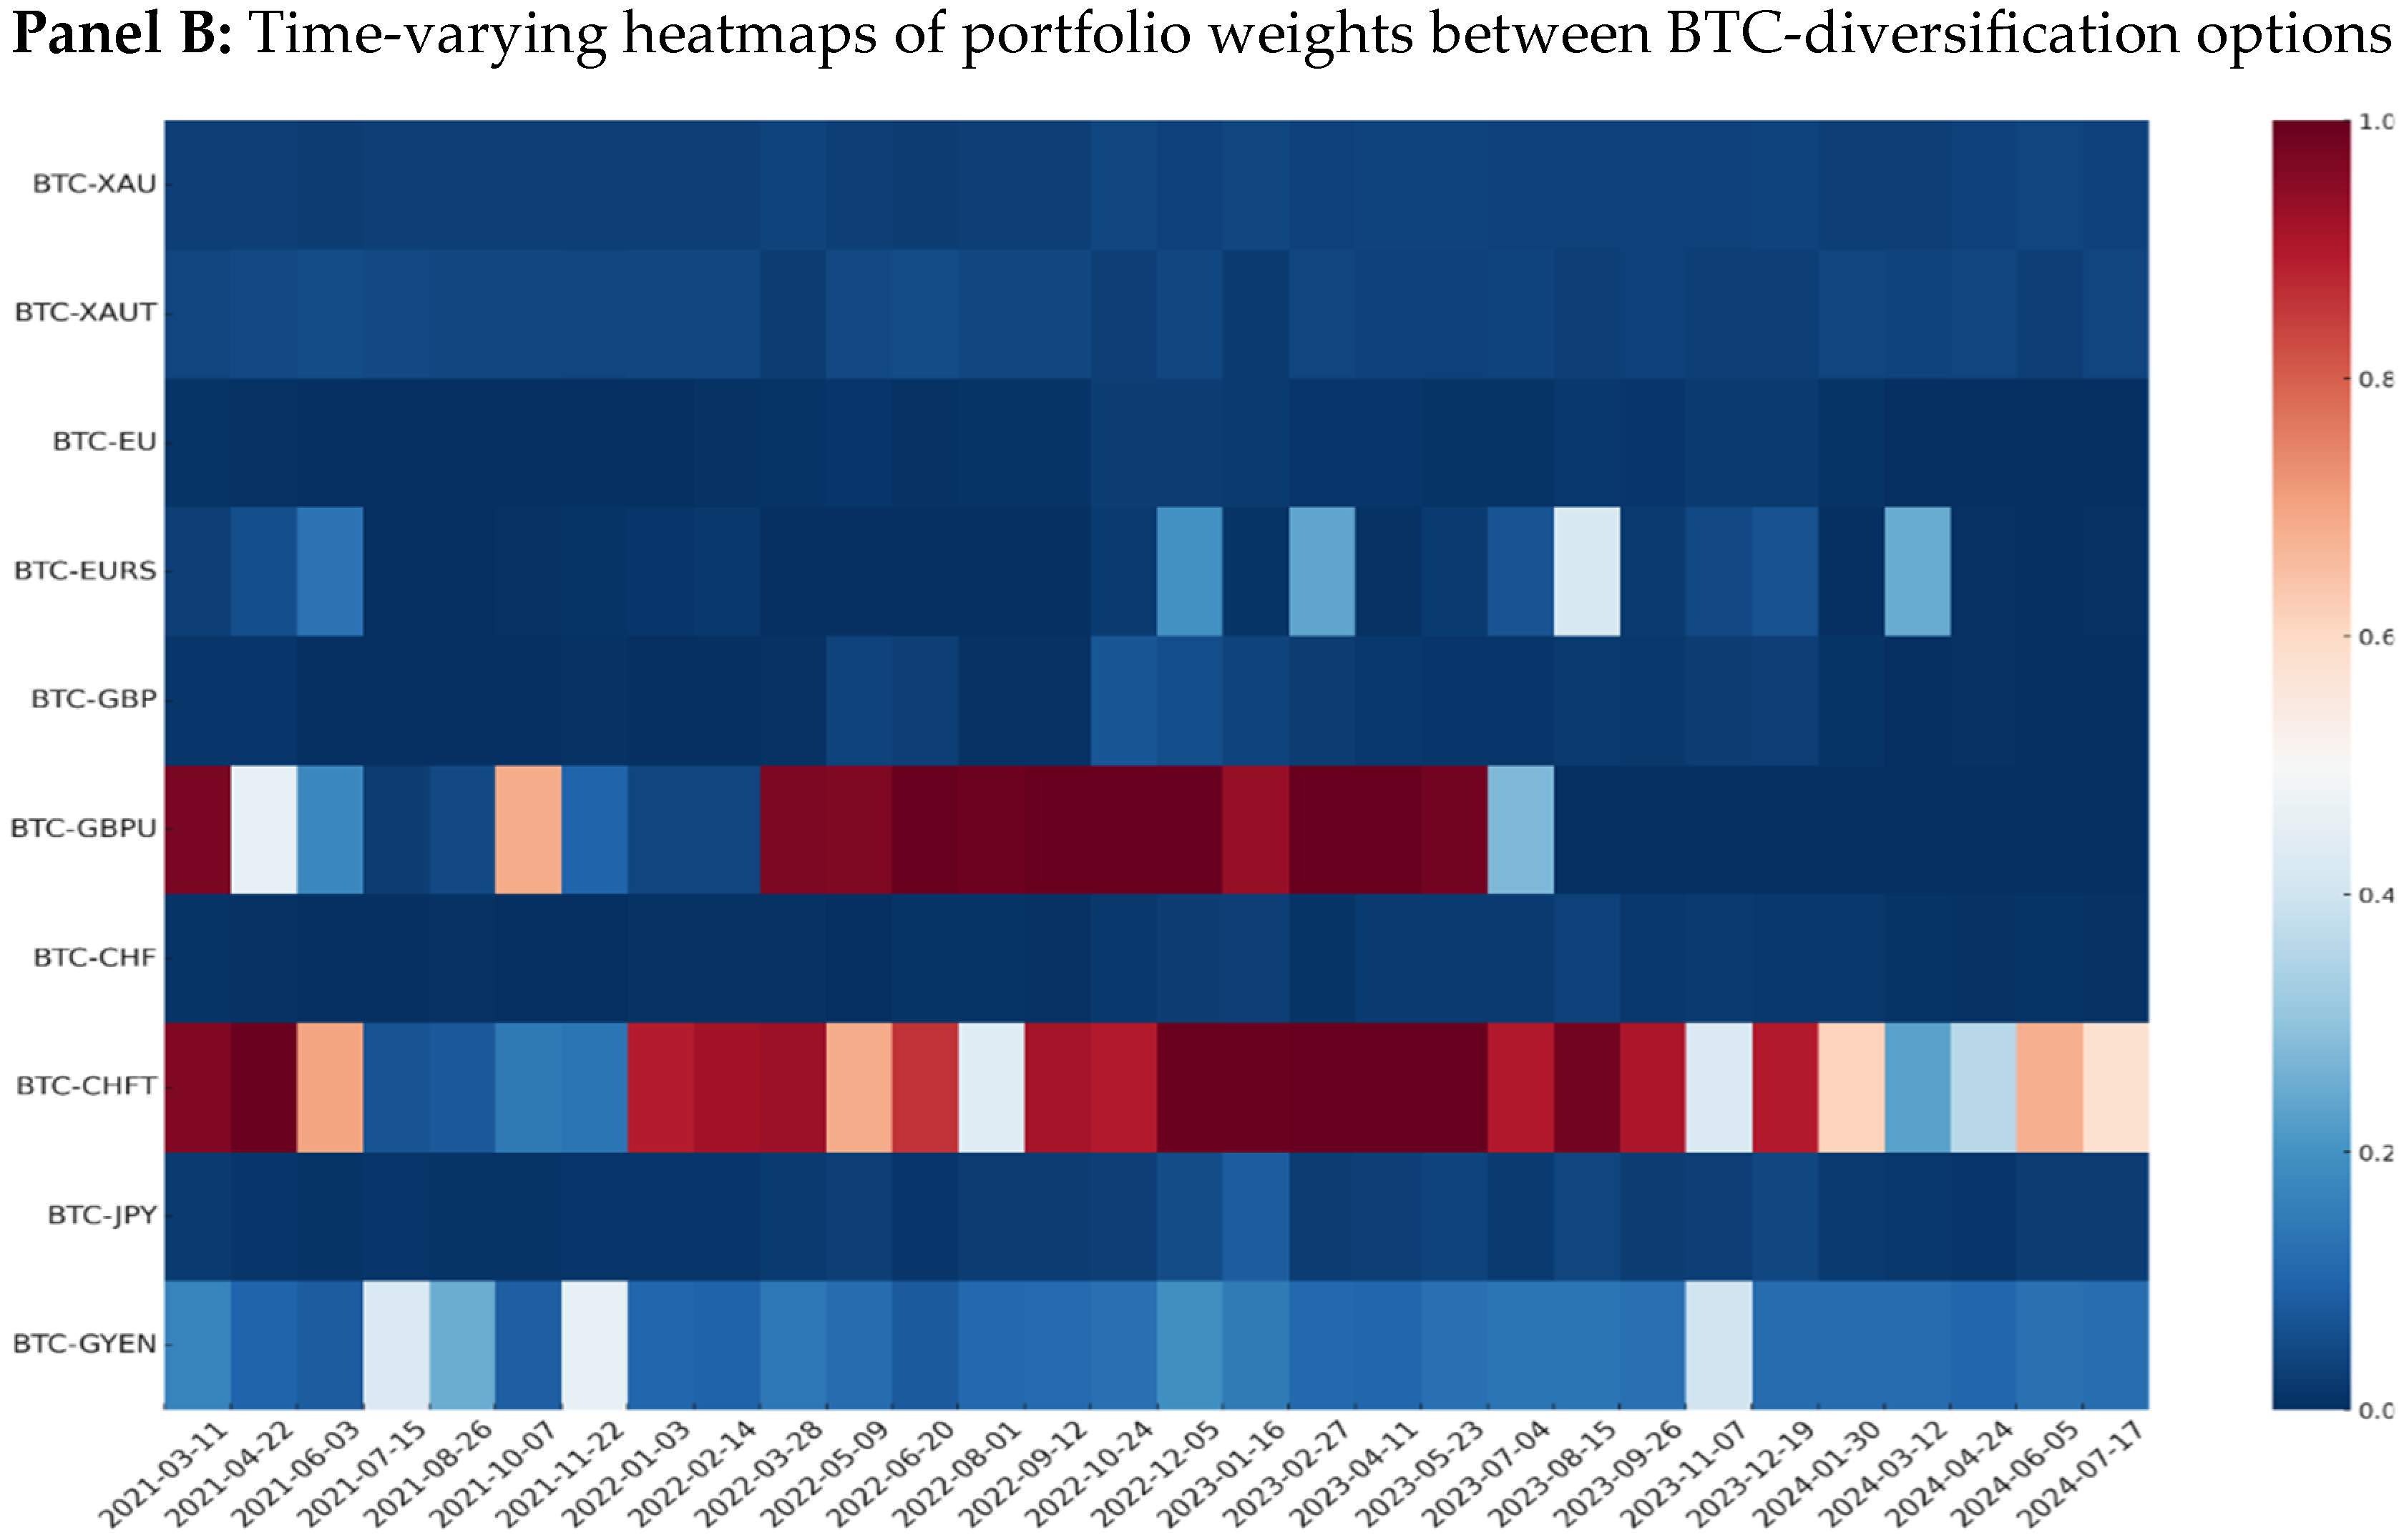
Figure 5 visualizes the time-varying portfolio weights of BTC in a one-unit portfolio where BTC holds a long position, and the diversification option holds a short position using graphs and heat maps.
In the bivariate portfolios formed with BTC, the weight of BTC is more stable when combined with XAU, XAUT, EU, GBP, CHF, and JPY. This stability makes these assets particularly attractive for long-term investment strategies. However, in these portfolios, the weight of BTC remains relatively low throughout the entire period, meaning that a significantly more significant proportion of the diversification option is required. In contrast, the portfolio consisting of BTC and CHFT requires a smaller amount of CHFT for diversification compared to all other options. Following CHFT, GBPU also stands out, as it allows for the greater diversification of BTC with a smaller allocation than other diversification options. The optimal portfolio weights fluctuate over time, and periods of extreme increases or decreases in BTC’s weight within the portfolio tend to coincide with global economic shocks or events specific to the cryptocurrency market. This further emphasizes the need for a dynamic portfolio strategy to diversify BTC effectively. A dynamic investment approach, which considers market shocks, aligns with the earlier findings and underscores the importance of adapting the portfolio to changing market conditions in both global and crypto asset markets.
The findings indicate that the effectiveness of diversification strategies in portfolios containing BTC varies significantly, depending on factors such as portfolio cost, hedge ratios, and the weights of assets within the portfolio. In particular, when different investment horizons (short- and long-term) and market conditions (stable versus crisis periods) are considered, it becomes evident that the optimal diversification strategy also differs accordingly. Thus, beyond the portfolio cost and hedge ratio, investment strategies must differ based on the investor’s time horizon. In terms of diversifying BTC, gold, foreign exchange rates, and their stablecoin counterparts all emerge as effective diversifiers. However, while YEN and GYEN stand out in correlations, CHFT and GBPU show more effective results in terms of hedge ratio and portfolio weight, making them suitable for diversification. Furthermore, XAU and XAUT can be considered effective diversification options for long-term investment strategies.
Our findings align with the results of prior studies, such as Huynh et al. [46], Abdullah et al. [47], Kandemir and Gökgöz [43], and Nedved and Kristoufek [14], who also highlighted gold as an effective diversifier for BTC. They also resonate with Wang et al. [48], who emphasized the role of gold and foreign exchange-backed stablecoins as BTC diversifiers, and Baur and Hoang [13] and Kayahan et al. [49], who showed that foreign exchange-backed stablecoins act as effective diversifiers for BTC. Additionally, Urquhart and Zhang [25] demonstrated that CHF and GBP are strong diversifiers for BTC, especially during periods of market shocks, findings that are consistent with our results.
Moreover, our research underscores the importance of following a dynamic strategy for BTC diversification. In particular, during global economic shocks or cryptocurrency market-specific events, the appropriate allocation of BTC and diversification assets within a portfolio may vary. Thus, any strategy to diversify BTC or BTC-containing portfolios must account for global or crypto market-specific events. This conclusion is also consistent with Nguyen et al. [50], who examined the sensitivity of cryptocurrencies and stablecoins to U.S. and Chinese interest rates, showing that global economic events influence the prices of cryptocurrencies and stablecoins. Similarly, Loukil et al. [51] highlighted the importance of the Ukraine–Russia conflict in shaping diversification strategies for portfolios containing gold and BTC. Furthermore, the study by Low et al. [52], which investigated the diversification properties of precious metals and diamonds, also highlights that the effectiveness of diversification options tends to vary during periods of crisis.
Our findings are particularly relevant for investors and financial advisors regarding risk management, developing risk strategies, and portfolio management, emphasizing the importance of dynamic approaches tailored to global economic events and shocks within the crypto asset market.

5. Conclusions

In the present study, considering the excessive volatility of bitcoins, we examine the diversification roles of gold, foreign exchange rates, and their stablecoin counterparts for bitcoin. In our quest to determine the safe haven for bitcoins, we employed a series of econometric modeling. Initially, we incorporated the sine and cosine functions into bitcoin’s variance equation to account for potential structural breaks and then analyzed bitcoin using the adaptive GARCH model. We then compared the suitability of this model with the classic GARCH model, which indicated that the adaptive GARCH model, which considers potential structural breaks in bitcoin, is more appropriate. Finally, given the significance of adaptive GARCH, we estimated the most suitable multivariate adaptive GARCH model for each pair involving bitcoins and diversification options. In our case, GOGARCH, cDCC, cADCC, and ADCC emerged as the most suitable models to explore the dynamic correlations amid different asset classes. Finally, through dynamic correlations, hedge ratios, and optimum portfolio weights, we offered crucial insight to comprehend the safe-haven properties of gold, foreign exchange rates, and their stablecoin counterparts for bitcoin. Taking into account the average correlations, hedge ratios, and optimum portfolio weight ratios, the empirical estimate emphasizes the following conclusions: First, the hedge ratios and portfolio weight ratios demonstrate that all asset classes are effective risk diversifiers for bitcoins, depending on market conditions and time-varying properties. Second, the hedge ratios highlight that all the asset classes, including JPY and GYEN, in the same direction as BTC (long/long or short/short) could be a more effective diversification strategy. When paired with BTC, the hedge ratios also highlight CHFT and XAUT’s lowest-cost hedging strategies. Moreover, in relation to portfolio weight, this study concludes that CHFT, GBPU, and GYEN emerge as more effective diversification options when constructing a portfolio that includes BTC, even at lower allocation levels. Third, while considering the external shocks and global events, this study highlights the importance of stablecoins backed by gold and foreign currencies, which provide a more stable diversification option than the asset class they represent. Furthermore, during external shocks and global events, this study also highlights the resilience of most of the asset classes against BTC. However, during such extreme times, JPY and GYEN again stand out as the most effective option, followed by CHFT, XAUT, CHF, GBP, GBPU, and EU. Furthermore, in the context of bivariate portfolios of BTC during extreme economic events, this study concludes that the hedge ratios for portfolios combining BTC with JPY and GYEN are volatile; they are generally negative. Therefore, the results again underscore the importance of adding JPY and GYEN in the same direction as BTC (long/long or short/short), which will prove to be a more effective strategy for portfolio diversification. Finally, in terms of the bivariate portfolio analysis formed with BTC, this study concludes that the weight of BTC is more stable when combined with XAU, XAUT, EU, GBP, CHF, and JPY. Thus, these assets are attractive for long-term investment strategies. However, in these portfolios, the weight of BTC remains relatively low throughout the entire period. Moreover, in terms of the bivariate portfolio analysis, the portfolio consisting of BTC and CHFT requires a smaller amount of CHFT and GBPU for diversification compared to all other options. Thus, the significance of portfolio allocations within the diversification options is underscored.
This research outlines several significant policy implications relevant to investors and policymakers alike. This research provides insights for investors regarding the diversification and safe-haven characteristics of gold, the foreign exchange rate, and their stablecoin counterparts for bitcoins, contributing to enhanced risk management and portfolio strategies. By taking these assets into account, investors can reduce the significant volatility associated with bitcoins while improving their risk-adjusted returns. This research further assists investors and policymakers in constructing appropriate portfolios in times of crisis by emphasizing stablecoin assets over the underlying asset class they represent. This research emphasizes the significance of a flexible portfolio diversification approach that is dependent on the investment timeline and the prevailing market conditions. Investors must prioritize the allocation of portfolio weights among different asset classes. It is essential for investors to conduct a thorough assessment of the appropriate allocation of bitcoins in conjunction with diversification assets, particularly in light of global economic disturbances or events that are unique to the cryptocurrency market. Moreover, the results also assist policymakers in developing suitable strategies that recognize the growing importance of stablecoins and gold-backed currencies, especially during periods of crisis. Additionally, this research underscores the importance of advocating for stablecoins, gold, and foreign exchange rates as potential safe havens to mitigate bitcoin volatility in the context of economic development and financial stability.
This study offers significant insights; however, it is crucial to recognize its limitations. This research is dedicated to analyzing the safe-haven attributes of a particular category of cryptocurrencies, specifically bitcoins. We confine the empirical findings to bitcoins alone, thereby presenting a possible direction for future research. Additionally, our analysis focuses primarily on price movements without explicitly considering trading volume and liquidity differences among assets, factors which may influence an asset’s role as a safe haven or diversifier. Future studies should incorporate trading volume and liquidity measures to achieve a more robust understanding of safe-haven dynamics. Furthermore, since variables are priced against the U.S. dollar, we excluded the USD and USD-pegged stablecoins, such as tether, from our primary analysis to avoid potential inverse correlations driven purely by pricing mechanisms. However, examining the role of the USD, possibly via the U.S. dollar index or stablecoins, might offer additional insights and represent another valuable direction for future investigations. Investigating further into various cryptocurrencies and the diversification traits of alternative asset classes, including green assets and oil prices, has the potential to enhance our empirical findings and justify additional inquiry.

Author Contributions

All authors contributed to this study’s conception and design. A.A.S. contributed to the literature review and provided oversight for the results, as well as contributed to the conceptual framework. H.G. provided oversight for the methodology, conducted the data analysis, and interpreted the results. H.A. and A.J. provided critical revisions, particularly in the interpretation and discussion of results sections. All authors have read and agreed to the published version of this manuscript.

Funding

This research was supported by Princess Nourah bint Abdulrahman University Researchers, Supporting Project number (PNURSP2025R549), Princess Nourah bint Abdulrahman University, Riyadh, Saudi Arabia.

Institutional Review Board Statement

Not applicable.

Informed Consent Statement

Not applicable.

Data Availability Statement

The datasets used and/or analyzed during the current study were obtained from investing.com. These datasets are available from the corresponding author on reasonable request.

Acknowledgments

Princess Nourah bint Abdulrahman University Researchers Supporting Project number (PNURSP2025R549), Princess Nourah bint Abdulrahman University, Riyadh, Saudi Arabia. We would like to thank the editor and reviewers for their valuable contributions to the improvement of this manuscript.

Conflicts of Interest

The authors declare no conflicts of interest.

References

  1. Izzeldin, M.; Muradoğlu, Y.G.; Pappas, V.; Petropoulou, A.; Sivaprasad, S. The impact of the Russian-Ukrainian war on global financial markets. Int. Rev. Financ. Anal. 2023, 87, 102598. [Google Scholar] [CrossRef]
  2. Baur, D.G.; McDermott, T.K. Is gold a safe haven? International evidence. J. Bank. Financ. 2010, 34, 1886–1898. [Google Scholar] [CrossRef]
  3. Smales, L.A. Bitcoin as a safe haven: Is it even worth considering? Financ. Res. Lett. 2019, 30, 385–393. [Google Scholar] [CrossRef]
  4. Dyhrberg, A.H. Bitcoin, gold and the dollar—A GARCH volatility analysis. Financ. Res. Lett. 2016, 16, 85–92. [Google Scholar] [CrossRef]
  5. Klein, T.; Thu, H.P.; Walther, T. Bitcoin is not the New Gold—A comparison of volatility, correlation, and portfolio performance. Int. Rev. Financ. Anal. 2018, 59, 105–116. [Google Scholar] [CrossRef]
  6. Corbet, S.; Larkin, C.; Lucey, B. The contagion effects of the COVID-19 pandemic: Evidence from gold and cryptocurrencies. Financ. Res. Lett. 2020, 35, 101554. [Google Scholar] [CrossRef]
  7. Goodell, J.W.; Goutte, S. Diversifying equity with cryptocurrencies during COVID-19. Int. Rev. Financ. Anal. 2021, 76, 101781. [Google Scholar] [CrossRef]
  8. Su, C.W.; Xi, Y.; Tao, R.; Umar, M. Can Bitcoin be a safe haven in fear sentiment? Technol. Econ. Dev. Econ. 2022, 28, 268–289. [Google Scholar] [CrossRef]
  9. Estrada, J.C.S. Analyzing Bitcoin Price Volatility. Ph.D. Thesis, University of California, Berkeley, CA, USA, 2017. [Google Scholar]
  10. Symitsi, E.; Chalvatzis, K.J. The economic value of Bitcoin: A portfolio analysis of currencies, gold, oil and stocks. Res. Int. Bus. Financ. 2019, 48, 97–110. [Google Scholar] [CrossRef]
  11. Zhang, C.; Ma, H.; Arkorful, G.B.; Peng, Z. The impacts of futures trading on volatility and volatility asymmetry of Bitcoin returns. Int. Rev. Financ. Anal. 2023, 86, 102497. [Google Scholar] [CrossRef]
  12. Baumöhl, E. Are cryptocurrencies connected to forex? A quantile cross-spectral approach. Financ. Res. Lett. 2019, 29, 363–372. [Google Scholar] [CrossRef]
  13. Baur, D.G.; Hoang, L.T. A crypto safe haven against Bitcoin. Financ. Res. Lett. 2021, 38, 101431. [Google Scholar] [CrossRef]
  14. Nedved, M.; Kristoufek, L. Safe havens for Bitcoin. Financ. Res. Lett. 2023, 51, 103436. [Google Scholar] [CrossRef]
  15. Lahiani, A.; Mefteh-Wali, S.; Vasbieva, D.G. The safe-haven property of precious metal commodities in the COVID-19 era. Resour. Policy 2021, 74, 102340. [Google Scholar] [CrossRef]
  16. Nguyen, Q.N.; Bedoui, R.; Majdoub, N.; Guesmi, K.; Chevallier, J. Hedging and safe-haven characteristics of Gold against currencies: An investigation based on multivariate dynamic copula theory. Resour. Policy 2020, 68, 101766. [Google Scholar] [CrossRef]
  17. Kumar, A.S.; Padakandla, S.R. Testing the safe-haven properties of gold and bitcoin in the backdrop of COVID-19: A wavelet quantile correlation approach. Financ. Res. Lett. 2022, 47, 102707. [Google Scholar] [CrossRef]
  18. Shakil, M.H.; Mustapha, I.H.M.; Tasnia, M.; Saiti, B. Is gold a hedge or a safe haven? An application of ARDL approach. J. Econ. Financ. Adm. Sci. 2018, 23, 60–76. [Google Scholar] [CrossRef]
  19. Baur, D.G.; Lucey, B.M. Is gold a hedge or a safe haven? An analysis of stocks, bonds and gold. Financ. Rev. 2010, 45, 217–229. [Google Scholar] [CrossRef]
  20. Kliber, A.; Marszałek, P.; Musiałkowska, I.; Świerczyńska, K. Bitcoin: Safe haven, hedge or diversifier? Perception of bitcoin in the context of a country’s economic situation—A stochastic volatility approach. Phys. A Stat. Mech. Its Appl. 2019, 524, 246–257. [Google Scholar] [CrossRef]
  21. Paule-Vianez, J.; Prado-Román, C.; Gómez-Martínez, R. Economic policy uncertainty and Bitcoin. Is Bitcoin a safe-haven asset? Eur. J. Manag. Bus. Econ. 2020, 29, 347–363. [Google Scholar] [CrossRef]
  22. Kayral, I.E.; Jeribi, A.; Loukil, S. Are bitcoin and gold a safe haven during COVID-19 and the 2022 Russia–Ukraine war? J. Risk Financ. Manag. 2023, 16, 222. [Google Scholar] [CrossRef]
  23. Regaieg, R.; Moussa, W.; Mgadmi, N. Can we reckon bitcoin as a hedge, a safe haven or a diversifier for US dollars? Glob. Bus. Rev. 2024, 25, 138–150. [Google Scholar] [CrossRef]
  24. Tarchella, S.; Khalfaoui, R.; Hammoudeh, S. The safe haven, hedging, and diversification properties of oil, gold, and cryptocurrency for the G7 equity markets: Evidence from the pre-and post-COVID-19 periods. Res. Int. Bus. Financ. 2024, 67, 102125. [Google Scholar] [CrossRef]
  25. Urquhart, A.; Zhang, H. Is Bitcoin a hedge or safe haven for currencies? An intraday analysis. Int. Rev. Financ. Anal. 2019, 63, 49–57. [Google Scholar] [CrossRef]
  26. Riahi, R.; Bennajma, A.; Jahmane, A.; Hammami, H. Investing in cryptocurrency before and during the COVID-19 crisis: Hedge, diversifier or safe haven? Res. Int. Bus. Financ. 2024, 67, 102102. [Google Scholar] [CrossRef]
  27. Shahzad, S.J.H.; Bouri, E.; Roubaud, D.; Kristoufek, L.; Lucey, B. Is Bitcoin a better safe-haven investment than gold and commodities? Int. Rev. Financ. Anal. 2019, 63, 322–330. [Google Scholar] [CrossRef]
  28. Conlon, T.; Corbet, S.; McGee, R.J. Are cryptocurrencies a safe haven for equity markets? An international perspective from the COVID-19 pandemic. Res. Int. Bus. Financ. 2020, 54, 101248. [Google Scholar] [CrossRef]
  29. Chemkha, R.; BenSaïda, A.; Ghorbel, A.; Tayachi, T. Hedge and safe haven properties during COVID-19: Evidence from Bitcoin and gold. Q. Rev. Econ. Financ. 2021, 82, 71–85. [Google Scholar] [CrossRef]
  30. Wang, Q.; Wei, Y.; Wang, Y.; Liu, Y. On the Safe-Haven Ability of Bitcoin, Gold, and Commodities for International Stock Markets: Evidence from Spillover Index Analysis. Discret. Dyn. Nat. Soc. 2022, 1, 9520486. [Google Scholar] [CrossRef]
  31. Rashid, A.; Bakry, W.; Al-Mohamad, S. Are cryptocurrencies a future safe haven for investors? The case of Bitcoin. Econ. Res.-Ekon. Istraživanja 2023, 36, 2140443. [Google Scholar] [CrossRef]
  32. Andersen, T.G.; Bollerslev, T. Heterogeneous information arrivals and return volatility dynamics: Uncovering the long-run in high frequency returns. J. Financ. 1997, 52, 975–1005. [Google Scholar] [CrossRef]
  33. Bollerslev, T. Generalized Autoregressive Conditional Heteroscedasticity. J. Econom. 1986, 31, 307–327. [Google Scholar] [CrossRef]
  34. Engle, R.F. Dynamic Conditional Correlation: A Simple Class of Multivariate Generalized Autoregressive Conditional Heteroskedasticity Models. J. Bus. Econ. Stat. 2002, 20, 339–350. [Google Scholar] [CrossRef]
  35. Cappiello, L.; Engle, R.F.; Sheppard, K. Asymmetric Dynamics in the Correlations of Global Equity and Bond Returns. J. Financ. Econom. 2006, 4, 537–572. [Google Scholar] [CrossRef]
  36. Aielli, G.P. Dynamic Conditional Correlation: On Properties and Estimation. J. Bus. Econ. Stat. 2013, 31, 282–299. [Google Scholar] [CrossRef]
  37. Kandemir, T.; Vurur, N.S.; Gökgöz, H. Investigation of the Interaction between Turkey’s CDS Premiums, BIST 100, Exchange Rates and Bond Rates via cDCC-EGARCH and Causality Analysis in Variance. KMU J. Soc. Econ. Res. 2022, 24, 510–526. [Google Scholar]
  38. Mostafa, M.Z.P.; Stavroyiannis, S. BRIC Dynamic Conditional Correlations, Portfolio Diversification and Rebalancing after The Global Financial Crisis of 2008–2009. Glob. Bus. Econ. Rev. 2016, 18, 28–40. [Google Scholar] [CrossRef]
  39. Gökgöz, H.; Afjal, M.; Bejaoui, A.; Jeribi, A. Comparative Analysis of Gold, Bitcoin and Gold-backed Cryptocurrencies as Safe Havens During Global Crises: A Focus on G7 Stock Market and Banking Sector Indices. Glob. Bus. Rev. 2024, 1–23. [Google Scholar] [CrossRef]
  40. Van der Weide, R. GO-GARCH: A Multivariate Generalized Orthogonal GARCH Model. J. Appl. Econom. 2002, 17, 549–564. [Google Scholar] [CrossRef]
  41. Kroner, K.F.; Sultan, J. Time-varying distributions and dynamic hedging with foreign currency futures. J. Financ. Quant. Anal. 1993, 28, 535–551. [Google Scholar] [CrossRef]
  42. Kroner, K.F.; Ng, V.K. Modeling asymmetric comovements of asset returns. Rev. Financ. Stud. 1998, 11, 817–844. [Google Scholar] [CrossRef]
  43. Kandemir, T.; Gökgöz, H. Is Bitcoin more than A Diversifier for Commodities? Range-Based Analysis via cDCC-GARCH. Res. Financ. Econ. Soc. Stud. 2022, 7, 227–240. [Google Scholar] [CrossRef]
  44. Katsiampa, P. Volatility and Correlation of Stablecoins with Traditional Assets. Econ. Lett. 2022, 220, 110855. [Google Scholar] [CrossRef]
  45. Gorse, G.; Tzeng, R. The Stability of Stablecoins: A Comparative Analysis with Gold and Cryptocurrencies. J. Financ. Econ. 2023, 148, 321–339. [Google Scholar] [CrossRef]
  46. Huynh, T.; Nasir, M.A.; Vo, X.V.; Nguyen, T.T. “Small things matter most”: The spillover effects in the cryptocurrency market and gold as a silver bullet. N. Am. J. Econ. Financ. 2020, 54, 101277. [Google Scholar] [CrossRef]
  47. Abdullah, A.M.; Abdul Wahab, H.; Ghazali, M.F.; Yaacob, M.H.; Masih, A.M.M. The dynamics of Australian stock indices and commodities based on MGARCH-DCC and wavelet techniques. Cogent Bus. Manag. 2022, 9, 2152154. [Google Scholar] [CrossRef]
  48. Wang, G.-J.; Ma, X.-y.; Wy, H.-y. Are stablecoins truly diversifiers, hedges, or safe havens against traditional cryptocurrencies as their name suggests? Res. Int. Bus. Financ. 2020, 54, 101225. [Google Scholar] [CrossRef]
  49. Kayahan, C.; Gökgöz, H.; Murat, T. Quantile Connectedness between Cryptocurrencies and Stablecoins. Int. J. Econ. Adm. Stud. 2022, 37, 143–156. [Google Scholar] [CrossRef]
  50. Nguyen, T.T.; Nguyen, T.V.; Nguyen, T.C.; Pham, T.A.; Nguyen, Q.M. Stablecoins versus traditional cryptocurrencies in response to interbank rates. Financ. Res. Lett. 2022, 47, 102744. [Google Scholar] [CrossRef]
  51. Loukil, S.; Syed, A.A.; Hamza, F.; Jeribi, A. Decoding the dynamic connectedness between traditional and digital assets under dynamic economic conditions. J. Theor. Appl. Electron. Commer. Res. 2025, 20, 97. [Google Scholar] [CrossRef]
  52. Low, R.K.Y.; Yao, Y.; Faff, R. Diamonds vs. precious metals: What shines brightest in your investment portfolio? Int. Rev. Financ. Anal. 2016, 43, 1–14. [Google Scholar] [CrossRef]
Figure 1. Analysis process.
Jtaer 20 00171 g001
Figure 2. Time-series graphs of return series.
Jtaer 20 00171 g002
Figure 3. Dynamic correlations. Note: Panel A illustrates the time-varying correlations between BTC and diversification options. Panel B displays heat maps of these time-varying correlations.
Jtaer 20 00171 g003
Figure 4. Dynamic hedge ratios. Note: Panel A shows the dynamic hedge ratios, representing a unit portfolio’s hedging cost (long BTC and short diversification options). Panel B presents corresponding heat maps depicting the time evolution of these hedge ratios.
Jtaer 20 00171 g004
Figure 5. Dynamic portfolio weights. Note: Panel A depicts the time-varying portfolio weights, specifically illustrating bitcoin’s weight in a portfolio where BTC is long and diversification alternatives are short. Panel B provides heat maps for these dynamic portfolio weights.
Jtaer 20 00171 g005aJtaer 20 00171 g005b
Table 1. Estimation of the appropriate model for bitcoin.
ModelSBCHQAIC
GARCH5.50295.48965.4814
Adaptive GARCH5.4745.45745.4472
Note: The appropriate model estimation is based on the Schwarz (SBC), Hannan–Quinn (HQ), and Akaike (AIC) information criteria. Bold values indicate the selected model.
Table 2. Descriptive statistics.
BTCXAUXAUTEUEURSGBPGBPUCHFCHFTJPYGYEN
Mean0.0102270.0431590.039456−0.00845−0.009391−0.007988−0.2176380.00789−0.306614−0.034697−0.05889
Median−0.0665630.0531630.0314680−0.0066850.0078850−0.018503−0.227796−0.065985−0.058608
Maximum17.927243.5227153.4733542.1207237.6524153.09531350.73242.804655135.23133.86729215.84616
Minimum−25.89626−3.551972−4.56919−1.498554−7.3863−3.627223−230.2437−2.05088−157.0844−2.070744−16.52805
Std. Dev.3.8265150.8709230.8319990.4729530.96920.55891122.891620.48979218.761010.6044841.730956
Skewness−0.500626−0.067493−0.123680.1597370.201479−0.1379093.441680.510218−0.6659470.849237−0.790768
Kurtosis7.5519114.2458435.6060974.34739215.371056.949923106.86985.45328428.346767.82580341.87454
JB808.2544 **58.42999 **254.9861 **71.34802 **5700.515 **583.3511 **403,201.2 **262.6868 **23,970.8 **973.861 **56,323.41 **
ADF−30.6637 **−29.9253 **−29.7136 **−29.8648 **−27.9335 **−29.0846 **−34.3882 **−27.9382 **−16.8635 **−28.6168 **−24.0768 **
LBQ2 (5)13.9497 *16.8811 *11.7753 **75.9063 **162.222 **153.552 **7.096131.4807 **170.278 **18.5204 **175.105 **
LBQ2 (10)19.3961 *19.2187 *13.4852 *130.837 **163.377 **270.958 **7.3524433.0663 **259.54 **29.9665 **210.119 **
LBQ2 (20)36.8565 *25.8764 *17.6481 *218.329 **171.907 **434.904 **9.12289 *42.0017 **288.157 **80.6919 **211.052 **
LBQ2 (50)90.5805 **51.497533.4145468.128 **179.647 **746.279 **90.8107 **75.0572 **693.519 **216.102 **216.907 **
Note: “*” and “**” denote significance at the 5% and 1% levels, respectively.
Table 3. Multivariate adaptive GARCH model estimates for bitcoin and diversification options.
ModelBTC-XAUBTC-EUBTC-GBPBTC-CHFBTC-JPY
SBCHQAICSBCHQAICSBCHQAICSBCHQAICSBCHQAIC
Scalar-BEKK8.04278.02958.02136.74746.73426.72596.99486.98956.97336.88216.86886.86067.20367.19037.1821
Diag.-BEKK8.0578.03718.02486.75916.73926.72697.00176.98186.96956.89246.87256.86027.21137.19147.1791
DCC8.0498.04238.03826.71866.70426.69796.95296.94936.94226.85126.84456.84047.18617.17957.1754
DCC-DECO8.0498.04238.03826.71866.70426.69796.95296.94936.94226.85126.84456.84047.18617.17957.1754
cDCC8.04918.04258.03846.71866.70426.69796.95296.94936.94226.85136.84476.84067.18637.17967.1755
ADCC8.05598.04598.03986.71596.70596.69976.95846.94846.94236.85586.84436.83977.19357.18367.1774
cADCC8.05648.04658.04036.71356.70366.69746.95836.94836.94226.85646.84646.84037.19377.18387.1776
GOGARCH8.0378.02048.01026.73226.71566.70536.97486.95826.94796.87636.85986.84957.197.17357.1632
ModelBTC-XAUTBTC-EURSBTC-GBPUBTC-CHFTBTC-GYEN
SBCHQAICSBCHQAICSBCHQAICSBCHQAICSBCHQAIC
Scalar-BEKK7.96897.95567.94748.02768.01438.0061---12.79912.78612.7788.96688.95358.9453
Diag.-BEKK7.97667.95677.94447.98727.96737.955---12.73812.71812.7068.92498.9058.8927
DCC7.93977.93317.9298.14258.13598.131810.26310.25610.25212.61712.61112.6078.88028.87368.8695
DCC-DECO7.93977.93317.9298.14258.13598.131810.26310.25610.25212.61712.61112.6078.88028.87368.8695
cDCC7.94027.93367.92958.14248.13588.131610.26310.25610.25212.61712.60912.6078.88028.87368.8695
ADCC7.9477.9377.93098.14978.13978.133610.2710.2610.25312.62512.61512.6098.88658.87668.8704
cADCC7.94337.93337.92728.14768.13778.131510.2610.21110.251---8.88658.87668.8704
GOGARCH7.94527.92867.91847.9437.92647.9162---12.70712.6912.688.89028.87268.8633
Note: The most appropriate multivariate GARCH model for binary variables is selected based on the Schwarz (SBC), Hannan–Quinn (HQ), and Akaike (AIC) information criteria. In cases where the information criteria suggest different models, the AIC is prioritized. Bold values indicate the most suitable multivariate GARCH models as identified by the information criteria.
Table 4. Residual diagnostics of the estimated appropriate multivariate adaptive GARCH models.
SeriesBTC-XAUBTC-EUBTC-GBPBTC-CHFBTC-JPY
BTCXAUBTCEUBTCGBPBTCCHFBTCJPY
LB Q2 (5)0.3549121.966014.325592.697844.31463.901994.333142.14520.7112631.28343
LB Q2 (10)5.575993.329157.087644.269167.0789614.11257.146284.562474.849383.67031
LB Q2 (20)21.662610.926121.026615.638620.9626.275921.123711.171718.318612.1349
LB Q2 (50)54.080932.239149.41936.249249.252747.677149.589336.814756.002451.0061
SeriesBTC-XAUTBTC-EURSBTC-GBPUBTC-CHFTBTC-GYEN
BTCXAUTBTCEURSBTCGBPUBTCCHFTBTCGYEN
LB Q2 (5)0.1868273.214494.212380.6898243.496850.110564.416831.946840.1521420.745508
LB Q2 (10)4.756915.237436.934981.011826.207610.2092337.202552.445755.100382.7775
LB Q2 (20)18.81149.6556720.16182.098620.16960.41069321.16974.8865220.27713.1056
LB Q2 (50)48.977332.810348.68087.8217948.70528.014449.194426.229350.12244.40071
Table 5. Correlation, hedge ratio, and average portfolio weights between bitcoin and diversification options.
Por. Pair.Cor.HRPW
BTC-XAU0.0975480.3873130.032177
BTC-XAUT0.0328690.0503290.039721
BTC-EU0.0577370.5063710.010082
BTC-EURS0.1305860.6361050.070363
BTC-GBP0.059770.4629360.015247
BTC-GBPU0.0737050.366420.438225
BTC-CHF0.0621640.5163650.011903
BTC-CHFT0.0185110.0150050.705442
BTC-JPY0.004549−0.042890.025478
BTC-GYEN−0.06683−0.295530.14815
Note: The hedge ratio represents the portfolio cost for a one-unit portfolio where bitcoin is in a long position and the diversification option is in a short position, while the portfolio weight indicates bitcoin’s weight in this two-asset portfolio.
Disclaimer/Publisher’s Note: The statements, opinions and data contained in all publications are solely those of the individual author(s) and contributor(s) and not of MDPI and/or the editor(s). MDPI and/or the editor(s) disclaim responsibility for any injury to people or property resulting from any ideas, methods, instructions or products referred to in the content.

