Abstract
Driven by data, the cross-border expansion of head platforms (HPs) leveraging their data advantages increasingly impacts small and medium-sized platforms (SMPs) and the market innovation ecosystem. This paper constructs a two-stage evolutionary game model to depict the competitive dynamics between HPs and SMPs from the perspective of platforms’ behaviors and strategies. This study finds that, in the core market, HPs’ expansion and SMPs’ retention depend on three factors: HPs’ expansion costs and their impact on data resources, SMPs’ operational costs and their impact on data resources, and the gap in the data value between the platforms. In related markets, under a competitive environment, HPs with a greater innovation influence tend to choose cross-border innovation, while resource-limited SMPs may opt for non-innovation. However, if SMPs have a greater innovation influence but face high costs, the game will not converge to a specific equilibrium. In a monopolistic environment, stable strategies are driven by the scale of innovation and the innovation influence of each platform. Except in cases of minor innovation with a strong innovation influence from SMPs or major innovation with a strong influence from HPs, SMPs’ innovation influence and innovation costs are decisive in the game.
1. Introduction
In the era of the digital economy, data have become a key production factor, driving digital platforms to play a central role in resource allocation, innovation, and industry integration [1]. These platforms can be categorized into super platforms, large platforms, and small platforms, based on user numbers, constraints, and business scope [2,3]. This classification provides a standardized and differentiated framework for the platform economy. It also highlights the significant disparities between head platforms (HPs) and small and medium-sized platforms (SMPs) in terms of data accumulation, technological capabilities, and market influence. Against the backdrop of HPs leveraging their data advantages to expand across industries, how platforms of different tiers utilize their data resources to capture new opportunities and the challenges they face is a critical question. These uncertainties are not only relevant to theoretical research but are also closely linked to current market strategies and policies. Existing research has largely focused on the overall development trends and competitive strategies of platforms [4,5], but there has been limited exploration of competitive and innovative strategies for cross-border expansion of HPs within the data-driven platform tiering framework.
In the early stages of the platform economy, platforms generally had limited data resources and market shares, and the data advantage of HPs was not yet significant [6]. The competition was primarily focused on their core business. With the advancement of intelligent algorithms and computational power, the scale of the data accumulated by platforms has continued to grow. Under the winner-takes-all effect, HPs have gained a substantial competitive advantage, while SMPs, due to their limited data resources, face the risk of market elimination [7].
As the platform economy enters its mature stage, data growth in the core markets of HPs tends to be saturated [8]. This drives them to leverage the massive data resources accumulated in their core markets to expand into related markets along the industry chain [9,10]. For example, Amazon transformed itself from a single online bookstore into an integrated online retailer and expanded into the cloud computing market by leveraging its data processing advantages. Furthermore, HPs can acquire potential competitors through mergers and acquisitions [11] or use their data advantages to engage in vertical exclusion [12], thereby squeezing the market space of SMPs in related sectors and even suppressing market innovation. However, the cross-border innovation of HPs also demonstrates significant competitiveness, not only in traditional business transformations but also in the integration of new technologies and the innovation of business models [6]. At the same time, in a diversified market environment, research and development (R&D) often becomes a key factor that SMPs utilize to secure a foothold in the market [13]. These SMPs tend to be more sensitive to market changes, often driving disruptive data technology innovations that inject new vitality into the market [14]. However, these disruptive innovations may threaten the market position of HPs. Given the dynamic impact of platform innovation on market capacity and the market share of different platforms, when the market approaches saturation, similar innovation investments may no longer yield significant data growth, indicating a diminishing marginal return on innovation [15]. Nevertheless, SMPs’ data-driven innovations may still reshape the market competition landscape [13], influencing the cross-border strategies of HPs.
Driven by the advantages of data, platforms’ cross-border expansion behaviors are reshaping market competition and innovation ecosystems. Existing research has focused on platforms’ cross-border expansion and innovation [16,17,18], but several theoretical issues remain to be addressed: First, the static analysis paradigm struggles to capture the dynamic flow characteristics of data elements. It also often overlooks the heterogeneity between platforms of different scales. Second, research on cross-border innovation often takes a macro perspective, lacking a micro-level analysis of the differentiated innovation strategies of platforms with different data scales. Third, existing game models are mostly limited to single-market scenarios and have yet to reveal the complex interactive mechanisms of cross-market competition.
This study aims to solve the following questions from the perspective of data elements: (1) Will HPs leverage their data advantages to adopt expansion strategies in their core markets? In the face of this data advantage, will SMPs in these markets choose to exit due to their disadvantage in data resources? (2) After HPs use their data advantages to expand into related markets, should they engage in cross-border innovation in the new markets, or should they utilize their existing data resources to implement cross-border monopolization? (3) In response to the cross-border monopolistic or competitive behavior of HPs leveraging their data advantages, should SMPs in related markets continue investing in innovation to bridge the data gap and enhance competitiveness, or should they maintain the status quo to mitigate risks?
The main contributions of this paper are as follows: First, this paper incorporates data elements into the platform strategy game analysis framework, providing an in-depth analysis of the two-stage game behavior of HPs in both core and related markets, as well as the strategic evolution paths of HPs and SMPs. It clarifies how cross-border behavior based on data advantages impacts the innovation process in competitive or monopolistic environments. This contributes to a better understanding of platform competition dynamics driven by data elements in academic research. Second, after the data elements of HPs are transferred from the core market to related markets, this paper proposes that innovation intensity (major or minor) and innovation impact are the key determinants of game evolution. Third, this paper provides management decision-making guidance for both HPs and SMPs regarding competition and innovation under data-driven, cross-border behavior, helping them adapt to the ever-changing market environment.
The remainder of this paper is organized as follows: Section 2 reviews the relevant literature on cross-border competition, cross-border innovation, and evolutionary game theory. Section 3 analyzes the game dynamics between HPs and SMPs in the core market. Section 4 and Section 5 analyze the game dynamics between HPs and SMPs after HPs expand into related markets, with Section 4 focusing on competitive environments and Section 5 on monopolistic environments. Finally, Section 6 summarizes the conclusions and managerial insights and provides directions for future research.
2. Literature Review
The literature related to this study mainly focuses on three aspects: platforms’ cross-border competition, cross-border innovation, and evolutionary game theory.
2.1. Cross-Border Competition
Platforms are always faced with the potential emergence of competing platforms [19]. The network effects and data accumulation advantages of two-sided markets make it easier for platforms to engage in cross-border expansion within the industry chain [5]. The motivation behind such cross-border behavior stems from the fact that existing data resources can reduce the difficulty of entering new markets [18]. However, the accessibility and competitiveness of data in the market are important variables. Platforms will only consider entering a new market when they foresee substantial economic benefits from the cross-border move [20]. The phenomenon of cross-border expansion not only reflects the absence of significant economies of scale in the related markets but also suggests that the platform’s business has not yet reached economies of scope. In markets with limited competition, a platform’s cross-border strategy may enhance user stickiness through data-driven price optimization and service quality improvements, thereby benefiting consumers [21]. Due to the complementary nature of data [18], platforms can gain a competitive advantage across multiple domains when integrating related businesses by controlling key infrastructures, R&D technologies, and talent, thus gaining a data-driven competitive edge [16,22]. Some scholars have explored the cross-market transmission of platforms’ competitive advantages from the perspective of data leverage, viewing the competitive advantage created by combining data and algorithms as a form of leverage [22]. Platforms can use this data advantage to quickly establish a competitive position in new markets with minimal costs. However, when a dominant platform holds a large share and earns significant profits in its core market, it may adopt a data monopoly strategy during cross-border expansion [23], which reduces the economic efficiency of the related industry and leads to an uneven distribution of benefits. When platforms expand into new markets, there can be positive feedback effects that amplify and strengthen their competitive advantages [5,24], as well as negative feedback effects that magnify operational flaws. Expansion into new markets can increase the loyalty of existing users and attract new users from the new market. Additionally, the cyclical feedback of data and algorithms may drive platforms to repeatedly exploit merchants or consumers, maximizing platform profits [25] while reducing user welfare [26].
Existing research has discussed the motivations for platforms’ cross-border competition, its competitive effects, and the pathways through which competitive advantages are transmitted. However, there are two main limitations in the existing literature: First, most studies adopt static equilibrium analysis methods, which fail to fully reveal the dynamic evolutionary characteristics of data elements’ cross-market flow. Second, there is a common assumption of platform homogeneity, neglecting the heterogeneity of platforms in terms of data scale and competitive strategies. To address these limitations, this study is the first to construct a dynamic competition model for platforms of different data scales. Using the evolutionary game analysis framework, it reveals the game characteristics of HPs in cross-border decisions, as well as the path dependence in the process of the data flow across markets. This study not only fills a theoretical gap but also provides a new perspective for understanding the complex dynamics of platforms’ cross-border competition.
2.2. Cross-Border Innovation
The concept of cross-border innovation was first introduced by Enkel and Gassmann [27], referring to the innovative activities where companies integrate new external knowledge with their core products during cross-industry expansion. From a data-driven perspective, cross-border innovation connects the data value of core operations with that of related markets to create new value innovations [28]. The data-driven dividends across domains create more development opportunities for platforms and enhance cross-border innovation performance [29], including the cross-industry integration of data elements [18], business model updates [30], user demand satisfaction [31], and an increased user scale [9]. Moreover, cross-border innovation also helps achieve precise alignment between products and consumer demands across related industry chains [32]. From the perspective of platform value networks and innovation capabilities, some studies have found that, during the process of the cross-border integration of ecosystems, platforms focus on accumulating and integrating innovative resources to build new value networks [33,34]. This integration not only effectively meets platform user demands but also leverages the inherent network effects of the platform economy to create positive feedback loops, accumulating more data resources [35]. In cross-border competition, platforms rely on their strong data foundations to drive cross-border innovation, injecting new vitality into their ecosystems and further promoting both internal and external collaborative innovation within the ecosystem [17,36,37], enabling the cross-industry co-creation of data value. Especially for small and medium-sized enterprises, the different dimensional characteristics of big data (such as volume, variety, velocity, etc.) can significantly impact the breadth and depth of their open innovation [38]. Some scholars argue that cross-border monopolization by platforms may suppress innovation from other competing platforms in the market [23,24]. This is because the feedback loop of data and capital as production factors leads to the concentration of more advantageous data resources in HPs, and the strong user lock-in effect makes it difficult for other competing platforms to access effective data and engage in innovative R&D.
The existing literature on cross-border innovation primarily focuses on how platforms utilize data resources for cross-industry integration, optimizing business models, and enhancing user demand matching. However, existing research generally emphasizes the general behaviors of platforms. This paper aims to reveal the differentiated behavioral logic of platforms with different data scales in cross-border innovation, with particular focus on the differences in data resources, innovation costs, and innovation impacts and how these factors influence platforms’ cross-border innovation strategies. The goal is to provide theoretical support for addressing the innovation competition of platforms driven by data, enriching the existing theoretical framework on platforms’ cross-border innovation.
2.3. Evolutionary Game Theory
Traditional game theory often relies on assumptions of fully rational participants and a perfectly informed environment. However, these conditions are rarely met in practice. Platforms in the real world cannot stabilize the entire data ecosystem through a single strategy choice; instead, they must undergo long-term learning and strategy adjustments to reach the final equilibrium. Under the assumptions of the limited rationality of the game participants and imperfect information in the game environment, Nash’s evolutionary game theory considers the continuous trial-and-error and imitation processes of participants during the game. Since the equilibrium points in the game may differ under varying data conditions or market environments, the system’s convergence in evolutionary game theory is not unique, which aligns with the complexity of the data-driven platform economy. Evolutionarily stable strategies (ESSs) identify the strategy combinations chosen by participants after repeated games [39]. Taylor and Jonker [40] introduced the concept of “replicator dynamics”, which emphasizes that the probability of a participant’s strategy choice is not fixed but varies according to the strategy choices of other participants. In the field of platform economics, evolutionary game theory has been applied to analyze the behavioral strategies of various players. Research has explored the dynamic evolutionary processes of cooperation and competition among e-commerce firms [41]; the industrial chain cooperation game between logistics platforms and suppliers [42]; the evolutionary game of information sharing in supply chains [43]; supply chain procurement costs [44] and collaborative innovation in platform ecosystems [45]; and the dynamic evolution of competitive intensity and innovation decisions [46].
In the existing literature, evolutionary game theory is mainly used to analyze the adaptive development strategies adopted by competitive agents under conditions of bounded rationality and information asymmetry. However, most studies focus on the gamified relationships in single markets or specific scenarios, with less exploration of the dynamic game process among the participants from the perspective of data-driven cross-market behavior. This paper constructs a two-stage evolutionary game model to examine the competitive dynamics between HPs and SMPs in both core markets and related markets. In a data-driven platform economy, HPs and SMPs face different competitive pressures and opportunities due to the disparities in their data resource endowments, depending on their market positions. Their strategic choices, based on data advantages or disadvantages, are crucial for shaping the competitive landscape and innovation dynamics in the market. Therefore, it is necessary to conduct a deeper investigation into the strategic interactions between HPs and SMPs, particularly in the context of data-driven cross-border competition and innovation.
3. Core Market: Expansion of HPs and Exit of SMPs
In the real digital platform market, Meta (formerly Facebook) expanded in the core social media market by leveraging its data advantages to increase advertising revenue and enhance user engagement. As the number of users grew, Meta’s advertising system became more precise, with the platform utilizing user behavior data to optimize ad performance and achieve commercial breakthroughs. Meanwhile, some SMPs (such as MySpace, Vine, etc.), due to a lack of comparable data resources and advertising technology to Meta, faced immense competitive pressure and ultimately chose to exit the market or maintain existing operations, unable to compete with Meta.
Considering the transaction data available to platforms, which includes both individual user information and aggregated market-wide information, as platform competition shifts from traffic-based competition to competition based on data stock, data have become increasingly important for the development of platforms. Therefore, this study aims to explore the strategic interactions between HPs and SMPs from the perspective of the user traffic value.
3.1. Model Parameters for Core Market
The game participants include HPs and SMPs, both of which exhibit limited rationality. During their development process, HPs face two strategic choices: to expand or not to expand. In contrast, due to the asymmetry in the market structure, SMPs face two strategic choices: to exit or not to exit the market. Let the probability of an HP adopting an expansion strategy be denoted as , and the probability of adopting a non-expansion strategy as , where . For SMPs, the probability of choosing to exit the market is denoted as , while the probability of choosing not to exit is , where .
The initial data resources of the HPs are denoted as , with the value created by each unit of data being . Similarly, the initial data resources of the SMPs are denoted as , with the value created by each unit of data being . Driven by network effects, the platform’s data scale is positively related to its ability to attract users. In the process of acquiring and processing data resources, platforms need to invest corresponding costs. Therefore, the data processing cost required for an HP to adopt an expansion strategy is denoted as , while the data operation cost required for an SMP to continue competing in an asymmetric market structure is denoted as . For HPs, the purpose of adopting an expansion strategy is to acquire more data resources to strengthen their competitive advantage. Hence, we assume that the impact of this expansion behavior on the platform’s data scale is represented by , where . Correspondingly, for SMPs, choosing to remain in the market and continue participating in competition impacts their data scale, which is represented by , where .
3.2. Replication Dynamic Analysis in the Core Market
Considering the characteristics of online platforms and the central role of data resources [47], this study analyzes the impact of HPs adopting expansion or non-expansion strategies on themselves and other platforms. For this purpose, the payoff matrix in Table 1 was constructed.

Table 1.
The payoff matrix of the game between two types of platforms in core markets.
When an HP chooses the expansion strategy, it needs to consider the behavior decisions of SMPs. If an SMP chooses to exit with a probability of , an HP receives a payoff of . If an SMP chooses the non-exit strategy with a probability of , an HP receives a payoff of . Therefore, the expected payoff, , for an HP when choosing the expansion strategy is the weighted average of these two scenarios:
Similarly, when an HP chooses the non-expansion strategy, it also needs to consider the exit probability, , and the non-exit probability, , of SMPs. The expected payoff, , is the weighted average of these two scenarios:
The average expected payoff, , is
The replicator dynamic process describes how game participants adjust the probability values of their choices based on the effects of their current strategies in a changing environment [40]. Specifically, the adjustment process of probability values and can be represented by differential equations, which are the replicator dynamic equations. Then, the replicator dynamics equation, , for an HP is
For Equation (4), we derive
Based on the relative stability principle of the replicator dynamics equation, if and , then is stable. Even in the presence of small perturbations, the replicator dynamics will eventually return to this point. Let , which yields or , and the critical value of is .
Next, we analyze the replicator dynamics for SMPs. When an SMP chooses the exit strategy, it needs to consider the behavior decisions of HPs. If an HP chooses expansion with a probability of , an SMP receives a payoff of 0. If an HP chooses non-expansion with a probability of , an SMP receives a payoff of 0. Therefore, the expected payoff for an SMP when choosing the exit strategy is the weighted average of these two scenarios.
Similarly, when an SMP chooses the non-exit strategy, it needs to consider an HP’s expansion probability and non-expansion probability . The expected payoff for an SMP is the weighted average of these two scenarios:
The average expected payoff is
Then, the replication dynamic equation for an SMP, , is
For Equation (9), we derive
Similarly, if and , then is the stable strategy for SMPs. Let , which yields or , and the critical value of is .
Next, we analyze the replicator dynamics of the two types of platforms and derive Lemma 1. The proofs of all the lemmas and propositions are provided in Appendix A.
Lemma 1.
In the core market, for the following is true:
- (i)
- For the HPs, (1) when and , both the expansion and non-expansion strategies are equilibrium points. (2) When , , and , the expansion strategy is locally stable. (3) When , , and , the non-expansion strategy is locally stable
- (ii)
- For the SMPs, (1) when and , both the exit and non-exit strategies are equilibrium points. (2) When , , and , the exit strategy is locally stable. (3) When , , and , the non-exit strategy is locally stable.
3.3. Stability Analysis in the Core Market
The evolutionary game between HPs and SMPs has five local equilibrium points, which are (0, 0), (0, 1), (1, 0), (1, 1), and (, ). To determine the stability of these five equilibrium points, the Jacobian matrix, , is constructed using the replicator dynamics equations derived from Equations (1) and (2). The matrix, , is as follows:
According to the Lyapunov stability discriminant method, the five equilibrium points are substituted into the above Jacobian matrix, and if the determinant, , is greater than zero and the trace, , is less than zero, the equilibrium point can be judged to be an evolutionary stability strategy (ESS). The conditions are as follows:
As shown in Table 2, at the equilibrium point (, ), where , the trace condition, , is not satisfied. Therefore, it is only necessary to analyze the stability of the remaining four equilibrium points. When , ; when , . Under the conditions of and , it can be known that , , , and are all satisfied.
Table 2.
Stability analysis of each equilibrium point.
By combining Table 2 with Figure 1a, it can be seen that the evolutionary game converges to the two points, (0, 0) and (1, 1), corresponding to the strategies {non-expansion, non-exit} and {expansion, exit}, respectively. The position of the saddle point, , in Figure 1a determines the system’s tendency toward one of the two equilibrium states. If the position of is in region 2, meaning that and are smaller than , then the system will converge to the equilibrium point (1, 1), as shown in Figure 1b.
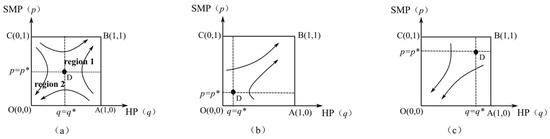
Figure 1.
The dynamic evolution of the game between HPs and SMPs in the core market. (a) System convergence trend; (b) Convergence to {expansion, exit}; (c) Convergence to {non-expansion, non-exit}. The arrow points to the direction of game convergence.
Given and , we can derive the following propositions.
Proposition 1.
If , then , and if , then , and the game converges to the equilibrium point {expansion, exit}.
This proposition illustrates that when the cost of the expansion strategy () for HPs decreases, or the impact of the expansion strategy on the data scale () increases; when the data operation cost () for SMPs increases, or the impact of the non-exit strategy on the data scale () decreases; or when the total data value difference between the two platforms () grows, the system’s tendency to converge to the equilibrium point (1, 1) strengthens. Consequently, HPs adopt the expansion strategy, while SMPs choose to exit the market. This proposition reveals that HPs should optimize data technologies (such as AI algorithms and cloud computing) to improve their data processing efficiency and reduce marginal costs, while SMPs must establish barriers early on through rapid innovation or differentiated positioning; otherwise, they may be eliminated by the expansion strategies of HPs.
Taking the social media platform Meta as an example, it has expanded its market share by collecting vast amounts of user data, optimizing its advertising algorithms, and reducing data processing costs. In contrast, SMPs like MySpace, with limited data resources, are at a disadvantage in the competition. Although MySpace has not completely exited the market, its market share has significantly shrunk, making it unable to compete with Meta in terms of its user base and advertising revenue.
Proposition 2.
If , then , and if , then , and the game converges to the equilibrium point {non-expansion, non-exit}.
This proposition indicates that when the expansion strategy cost of HPs () increases, or the impact of the expansion strategy on the platform data scale () decreases; when the data operation cost of SMPs () decreases, or the impact of the non-exit strategy on the platform data scale () increases; or when the total difference in the data value between the two platforms () decreases, the system will exhibit a stronger tendency to converge toward the equilibrium point (0, 0). In this case, HPs adopt the non-expansion strategy, while SMPs choose not to exit the market. Under this scenario, point is located in region 1, where the system converges toward the equilibrium point (0, 0), and the tendency toward this equilibrium is intensified, as shown in Figure 1c. This proposition highlights that HPs should carefully assess the costs and benefits of expansion to avoid resource wastage from blind growth, while SMPs should enhance their competitiveness through technological innovation and refined operations, establishing differentiated advantages in specific areas.
3.4. Sensitivity Analysis in the Core Market
To further explore the impact of the expansion strategy of HPs on the data scale () and the impact of the non-exit strategy of SMPs on the data scale (), this study assigned values to the model’s parameters and conducted numerical simulations using Matlab. Based on the app ranking data provided by Aurora iAPP, the data scales of the top three HPs are approximately five times larger than those of the SMPs ranked between 10 and 15. Therefore, we assume that and . The cost for HPs is , and the cost for SMPs is .
As shown in Figure 2, as the impact of the HPs’ expansion strategy on the data scale () increases, the impact of the SMPs’ non-exit strategy on the data scale () decreases. The game results tend to converge towards (1, 1), indicating that the HPs expand while the SMPs exit the market.
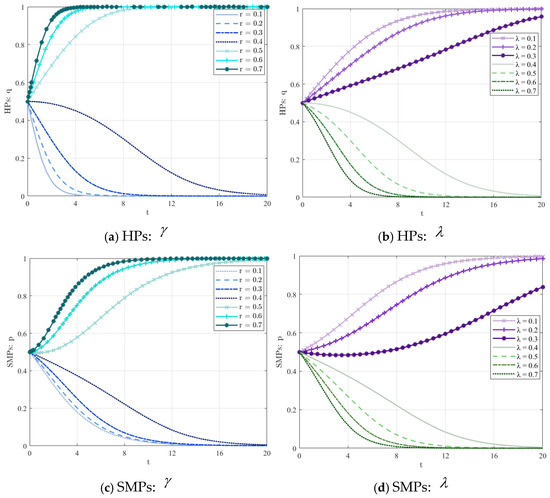
Figure 2.
Sensitivity analysis of and , where (a,b) show the impact on the strategy choices of HPs, and (c,d) show the impact on the strategy choices of SMPs.
Although the HPs have accumulated substantial data resources in the core market, the benefits of expansion will decrease when the cost of the HPs’ expansion strategy increases or when their impact on the data scale () diminishes. This change prompts HPs to reassess their strategies and lean toward adopting the non-expansion strategy to avoid additional data processing costs or diminished data returns. Additionally, as the impact of the SMPs’ non-exit strategy on the data scale () increases, the SMPs realize that staying in the market remains profitable. As a result, the game will tend towards the {non-expansion, non-exit} equilibrium.
In the context of the platform economy, network externalities give platforms a significant first-mover advantage when entering the market. This implies that once these HPs have accumulated substantial data resources in the market, they possess immense market power, making it extremely challenging for emerging SMPs to enter or expand their market share, especially in data-intensive sectors such as the social media market. While these HPs may provide users with free core services, such as messaging or content sharing, they have built a large and active data ecosystem, which provides them with powerful data analytics and value creation advantages. With these advantages, HPs can easily expand into related areas, such as e-commerce, advertising, or financial services, and create more value and revenue in these new business areas.
4. Competition and Innovation Strategies Under the Cross-Border Expansion of Platforms
In fact, Meta has leveraged its advantage in user information and used its data flow to expand its business from social networking and communication to markets such as digital advertising, the metaverse, and online gaming. By acquiring Instagram in 2012 and WhatsApp in 2014, Meta successfully achieved cross-border expansion into related markets, like instant messaging and photo sharing. This expansion created significant competitive pressure for SMPs (such as Snapchat). Although Snapchat attracted users through innovation (such as augmented reality technology), it still struggled to compete with Meta in terms of data resources. As a result, Snapchat not only faces enormous challenges but also needs to continuously optimize its products and business models to find new breakthroughs.
HPs like Meta leverage their existing data resources, data analytics technologies, and capital advantages to compete with rivals in related markets. The cross-border competition strategy aims to consolidate or expand their data advantages in new markets by acquiring more high-quality data. At the same time, HPs can meet potential needs through cross-border innovation and reshape the market competition landscape through data integration. For SMPs, they may choose to maintain their current business modes to reduce data operation risks and costs or pursue innovation to enhance their competitiveness, seeking new paths to compete with HPs.
Therefore, the game participants include the HPs and the SMPs in the related market. When HPs leverage their data advantages to expand into related markets, both types of platforms can access certain information to adjust their respective competitive strategies. However, considering the complexity of the market environment and the limitations in resource acquisition for both parties, their decision-making processes reflect a bounded rationality in terms of data-driven decisions. Based on the principle of maximizing their interests, these platforms will continuously adjust their behavioral strategies.
4.1. Model Parameters for Related Markets
In the related market, the data resources of SMPs are denoted as , and the value created by each unit of data for the platform is . The cost of data-driven innovation is . The data resources accumulated by the HPs in the related market are denoted as , and the cost of cross-border innovation is . Additionally, any platform’s innovative behavior results in a change in its degree of the market share, denoted as , where represents minor innovation, and represents major innovation. Any platform’s innovative behavior also results in a change in the overall market size, denoted as , where . Considering that both HPs and SMPs adopting innovation strategies can influence and , it is assumed that the impact on the overall market growth rate, , is represented by the influence coefficient , where . For the impact on , the influence coefficient is denoted as , where , and if the HPs’ innovation influence is greater than that of the SMPs, , then . Conversely, if the innovation influence of SMPs is greater, , then .
Assume that the HPs adopt a cross-border competition strategy with a probability of and adopt a cross-border innovation strategy with a probability of , where . For SMPs, the probability of choosing innovation is , while the probability of maintaining the status quo is , where .
4.2. Replication Dynamic Analysis in Competitive Related Markets
Based on the above model assumptions, the payoff matrix for the innovation strategies of HPs and SMPs in the related market was constructed, as shown in Table 3.
Table 3.
The payoff matrix for the game between two types of platforms in the related market (competitive environment).
When an HP chooses the cross-border competition strategy, if an SMP chooses innovation with a probability of , an HP receives a payoff of . If an SMP chooses non-innovation with a probability of , an HP receives a payoff of . Therefore, the expected payoff, , for an HP when choosing the cross-border competition strategy is the weighted average of these two scenarios:
When an HP adopts the cross-border innovation strategy, its expected payoff, , is
The average expected payoff, , is
Then, the replicator dynamics equation for an HP, , is
Let , which gives or , and the critical value of is .
Next, we analyzed the replicator dynamics for SMPs. When an SMP chooses the innovation strategy, it needs to consider the behavior decisions of an HP. If an HP chooses cross-border competition with a probability of , an SMP receives a payoff of . If an HP chooses cross-border innovation with a probability of , an SMP receives a payoff of . Therefore, the expected payoff, , for an SMP when choosing the innovation strategy is the weighted average of these two scenarios:
When an SMP chooses the non-innovation strategy, its expected payoff, , is
The average expected payoff, , is
Then, the replication dynamic equation for an SMP, , is
Similarly, let , which yields or , and the critical value of is .
Next, we analyzed the replicator dynamics of the two types of platforms and derived Lemma 2.
Lemma 2.
In the related market (competitive environment), the following is true:
- (i)
- For the HPs, (1) when and , both cross-border competition and cross-border innovation strategies are equilibrium points. (2) When , , and , the cross-border competition strategy is locally stable. (3) When , , and , the cross-border innovation strategy is locally stable.
- (ii)
- For the SMPs, (1) when and , both the innovation and non-innovation strategies are equilibrium points. (2) When , , and , the non-innovation strategy is locally stable. (3) When , , and , the innovation strategy is locally stable.
If the innovation influence of HPs is greater than that of SMPs, i.e., , then , and always holds. As shown in Figure 3a, the system converges to the point (0, 0), where HPs choose the cross-border innovation strategy, and SMPs choose the non-innovation strategy.
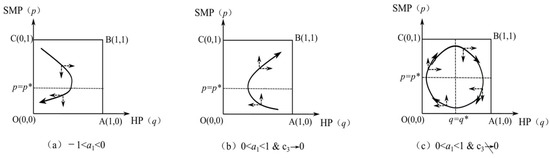
Figure 3.
The dynamic evolution of the game between HPs and SMPs in the related market (competitive environment). The horizontal and vertical dashed lines represent the strategy convergence trends of HPs and SMPs, respectively, while the solid line represents the system convergence trend.
If the innovation influence of HPs is less than that of SMPs, i.e., , and the innovation cost is for SMPs, then , and always holds. As shown in Figure 3b, the system converges to the point (1, 1), where HPs choose the cross-border competition strategy, and SMPs choose the innovation strategy.
However, if the innovation cost, , for SMPs cannot be ignored, , as shown in Figure 3c. In this case, both platforms continuously adjust their strategies during the repeated game to respond to changes in the other platform’s behavior. The system does not stabilize at a specific equilibrium state but instead remains in a state of continuous change or oscillation.
Proposition 3.
In a competitive environment, the game dynamics yield the following equilibrium results:
- (i)
- If , then and ; the system converges to (0, 0), indicating an equilibrium of {cross-border innovation, non-innovation}.
- (ii)
- If and is small, then and ; the system converges to (1, 1), indicating an equilibrium of {cross-border competition, innovation}.
- (iii)
- If and cannot be ignored, then ; the system diverges with no definite equilibrium state.
Proposition 3 encompasses the evolutionary game between HPs and SMPs in the context of the competitive environment of the related market. It explains how different levels of innovation influence and innovation costs affect the strategic choices of the platforms and the stability of the system. From Proposition 3(i), when the innovation influence of HPs is greater than that of SMPs, HPs adopt the cross-border innovation strategy with the intent of maintaining or expanding their market share in the related market through innovation. Meanwhile, SMPs, lacking sufficient resources or capabilities, choose the non-innovation strategy, meaning they maintain their existing operations without pursuing additional innovation. For example, Meta, through its powerful data resources and innovative features, such as Reels and Instagram Stories, has successfully attracted a large number of users, consolidating its dominance in the social media and advertising markets. While Snapchat has made attempts at innovation in areas like augmented reality (AR) and short videos, its limited data resources have prevented it from competing with Meta in terms of its market share. As a result, Snapchat has chosen to maintain its existing operational model rather than pursue large-scale innovation.
On the other hand, from Proposition 3(ii), when the innovation influence of HPs is smaller than that of SMPs and the innovation cost for SMPs is low, HPs tend to choose the cross-border competition strategy, merely attempting to enhance their ecosystem’s business domains through cross-market competition. In response, SMPs opt for the innovation strategy, leveraging innovation to increase their market share or improve their competitive position. For example, Spotify has continuously strengthened its competitiveness in the music streaming market through its personalized recommendation algorithm, innovative playlists, and data analytics. In contrast, Apple Music relies on bundling its hardware devices (such as iPhones and AirPods), resulting in a weaker impact from innovation. Spotify’s low-cost innovation has positioned it advantageously in the competition, while Apple Music relies more on its hardware ecosystem.
Proposition 3(iii) indicates that if the innovation cost for SMPs is relatively high, it may influence their strategic choices, making them more cautious or conservative in pursuing innovation while attempting to identify the optimal market positioning. At the same time, HPs might experiment with different strategies to counteract the changing strategies of SMPs. Under such circumstances, the system does not converge to a specific stable point, meaning that market competition fails to reach a stable and predictable equilibrium state.
The strategic implication of Proposition 3 is that, in a competitive environment, the strategic choices of platforms are essentially a precise game focused on the influence of innovation and cost-effectiveness. When HPs have significant innovation advantages, they should continue to strengthen technological investments to consolidate market dominance. When innovation advantages are insufficient, they should shift towards cross-border competition to leverage ecosystem synergies. SMPs should focus on differentiated innovation to establish competitive barriers when resources allow. When resources are limited, they should seek external cooperation and form strategic alliances with external R&D institutions and technology companies to reduce innovation costs.
4.3. Sensitivity Analysis in Competitive Related Markets
In this subsection, we conduct a sensitivity analysis of the impact of platform innovation influence. According to Proposition 3(i), when the innovation influence of HPs is greater than that of SMPs (i.e., ), the game converges to (0, 0), meaning HPs engage in cross-border innovation while SMPs maintain the status quo. As shown in Figure 4, we find that when , as increases, the probability of HPs choosing cross-border innovation becomes higher (i.e., approaches 0 more quickly), while the probability of SMPs choosing to maintain the status quo also increases (i.e., approaches 0 more quickly). Consequently, the speed at which the game converges to a stable state also increases. In addition, from Proposition 3(ii), when the innovation influence of SMPs is greater than that of HPs (i.e., ), the game converges to (1, 1). Based on Figure 4, when , as increases, the probability of HPs choosing cross-border competition also increases (i.e., approaches 1 more quickly), while the probability of SMPs choosing innovation also increases (i.e., approaches 1 more quickly). Consequently, the speed at which the game converges to (1, 1) also increases.
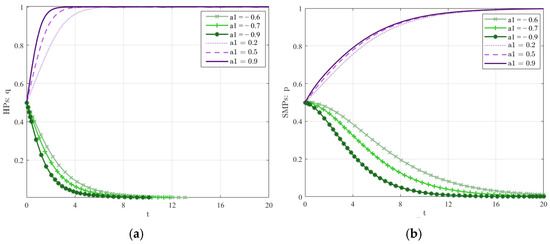
Figure 4.
Sensitivity analysis of innovation influence, . (a) HPs; (b) SMPs.
5. Monopoly and Innovation Strategies Under the Cross-Border Expansion of Platforms
In the cross-border expansion process of platforms like Meta, both the positive impact of cross-border innovation and the controversial nature of cross-border monopoly strategies are evident. For example, when entering the short video market, Meta initially attempted to compete with TikTok by internally incubating the Reels feature as a form of cross-border innovation. However, Meta was also accused of employing cross-border monopoly tactics, such as algorithmically prioritizing Reels content and restricting the spread of TikTok videos on its platform to weaken its competitor’s market share. This case demonstrates that HPs, during cross-border expansion, may simultaneously adopt both innovation and monopoly strategies: expanding the market through innovation and consolidating their competitive advantage through a monopoly.
When HPs expand into related markets, they can leverage their existing data resources to innovate, meet new user demands, and enhance the value of their data ecosystems. Furthermore, these HPs may also use their data monopoly and competitive advantages in the core market to implement cross-border monopolies in related markets, aiming to extract more value from data resources. Therefore, this section considers two strategies for HPs in related markets: cross-border monopolies and cross-border innovation. Meanwhile, SMPs in the related market may choose to engage in innovation to improve the quality of their products or services, thereby maintaining and increasing their data resources. However, if the cost of data operation is too high or the data value returns are too low, they may choose to maintain the non-innovation strategy, refraining from additional innovation investments. Thus, SMPs have two strategic choices in the game: innovation and non-innovation.
5.1. Replication Dynamic Analysis in Monopolistic Related Markets
Assume that the impact of HPs’ cross-border monopoly behavior on data resources is , where . HPs adopt the cross-border monopoly strategy with a probability of and the cross-border innovation strategy with a probability of , where . SMPs choose the innovation strategy with a probability of and the non-innovation strategy with a probability of , where . The payoff matrix for the game between the two types of platforms is shown in Table 4.
Table 4.
The payoff matrix for the game between two types of platforms in the related market (the monopoly environment).
The replicator dynamic equation for HPs, , is
Let , which gives or , and the critical value of is .
The replicator dynamic equation for SMPs, , is
Let , which gives or , and the critical value of is .
Next, we analyze the replicator dynamics of the two types of platforms and derive Lemma 3.
Lemma 3.
In the related market (monopoly environment), the following is true:
- (i)
- For the HPs, (1) when and , both the cross-border monopoly and the cross-border innovation strategies are equilibrium points. (2) When , , and , the cross-border innovation strategy is locally stable. (3) When , , and , the cross-border monopoly strategy is locally stable.
- (ii)
- For the SMPs, (1) when and , both the innovation and non-innovation strategies are equilibrium points. (2) When , , and , the non-innovation strategy is locally stable. (3) When , , and , the innovation strategy is locally stable.
5.2. Stability Analysis in Monopolistic Related Markets
Based on the above analysis, it can be concluded that the evolutionary game has two equilibrium points, (0, 1) and (1, 0), corresponding to the two outcomes: {cross-border innovation, innovation} and {cross-border monopoly, non-innovation}, as shown in Figure 5a. Next, we will separately discuss the outcomes of the game under the two scenarios of major innovation and minor innovation.
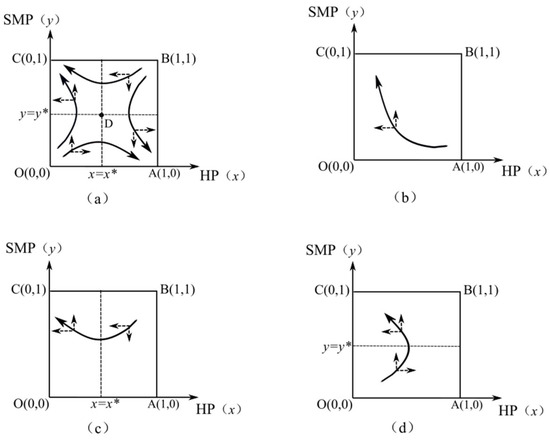
Figure 5.
The dynamic evolution of the game between HPs and SMPs in the related market (the monopoly environment). (a) System convergence trend; (b–d) Convergence to {cross-border innovation, innovation} under different conditions.
Scenario 1. Under major innovation () with , the following outcomes will emerge:
(1) If the innovation influence of HPs is greater (), then , and always holds. At this time, if the innovation cost of SMPs is , as shown in Figure 5b, the system converges to the equilibrium point(0, 1), corresponding to the outcome {cross-border innovation, innovation}. If , as shown in Figure 5c, the system still converges to (0, 1), corresponding to the outcome {cross-border innovation, innovation}.
(2) If the innovation influence of SMPs is greater (), and , then . At this time, if the innovation cost of SMPs is , as shown in Figure 5d, the system converges to the equilibrium point(0, 1), corresponding to the outcome {cross-border innovation, innovation}. However, if , as shown in Figure 5a, the system still converges to the two equilibrium points (0, 1) and (1, 0), corresponding to the outcomes {cross-border innovation, innovation} and {cross-border monopoly, non-innovation}, respectively.
Scenario 2. Under minor innovation () with , the following outcomes will emerge:
(1) If the innovation influence of HPs is greater (), then . At this time, if the innovation cost of SMPs is , as shown in Figure 5d, the system converges to the equilibrium point (0, 1), corresponding to the outcome {cross-border innovation, innovation}. However, if , as shown in Figure 5a, the system still converges to the two equilibrium points (0, 1) and (1, 0), corresponding to the outcomes {cross-border innovation, innovation} and {cross-border monopoly, non-innovation}, respectively.
(2) If the innovation influence of SMPs is greater (), and , then . At this time, if the innovation cost of SMPs is , as shown in Figure 5b, the system converges to the equilibrium point (0, 1), corresponding to the outcome {cross-border innovation, innovation}. However, if , as shown in Figure 5c, the system still converges to (0, 1), corresponding to the outcome {cross-border innovation, innovation}.
Based on the above two situations, the innovation influence of HPs and SMPs, as well as the influence of the innovation cost on the system convergence point, Propositions 4 and 5 are obtained.
Proposition 4.
Under major innovation (), the following is true:
- (i)
- If , the system converges to (0, 1), meaning {cross-border innovation, innovation}.
- (ii)
- If and , the system converges to (0, 1), meaning {cross-border innovation, innovation}. If , the system may converge to (1, 0), meaning {cross-border monopoly, non-innovation}.
Proposition 4 summarizes the system dynamics of HPs and SMPs when facing major innovation. When the innovation influence of HPs is more significant, the system converges to a specific equilibrium point. This occurs because HPs, already possessing abundant data resources in the core market, adopt a cross-border innovation strategy as they expand their business into new markets to seek additional growth opportunities. In response to the competitive pressure from HPs and the influence of market dynamics, SMPs opt to invest in innovation to enhance their market share or, at the very least, maintain their current market position.
Additionally, when the innovation influence of SMPs is greater, their innovation costs play a critical role in shaping both their own strategic decisions and the overall evolution of the system. With lower innovation costs, SMPs are more inclined to invest in innovation activities, driving the system to converge to a specific equilibrium point. This equilibrium may represent a market structure where SMPs secure a certain share of the market through innovation. To counter the innovation challenges posed by SMPs, HPs will also adopt innovation strategies. However, when innovation costs are high, the increased risks and uncertainties associated with innovation lead SMPs to hesitate in investing in innovation. As a result, the system may have the potential to converge to multiple different equilibrium points. To avoid the risks and costs associated with high-investment innovation projects, SMPs opt for non-innovation strategies. In this case, HPs will adopt a cross-border monopoly strategy, leveraging their resources and market advantages to dominate and control the new market segments.
The strategic implication of Proposition 4 suggests that, when faced with significant innovation, HPs should fully leverage their innovation influence advantage and explore new growth opportunities through cross-border innovation strategies. Meanwhile, SMPs need to carefully evaluate the costs and benefits of innovation. When resources permit, they should actively invest in innovation to capture market share; however, when innovation costs are too high, they should consider differentiated survival strategies.
Proposition 5.
Under minor innovation (), the following is true:
- (i)
- If and , the system converges to (0, 1), meaning {cross-border innovation, innovation}. If , the system may converge to (1, 0), meaning {cross-border monopoly, non-innovation}.
- (ii)
- If , regardless of the value of the innovation cost, , the system always converges to (0, 1), meaning {cross-border innovation, innovation}.
Proposition 5 summarizes how the innovation influence and innovation costs of HPs and SMPs affect the system’s convergence and the strategic choices of both platforms under minor innovation scenarios. In the context of minor innovation, the scale of innovation is relatively small. When HPs have greater innovation influence, they are more likely to adopt a cross-border innovation strategy. Since SMPs face lower innovation costs, they are willing to invest in innovative activities to enhance their competitiveness. However, if SMPs encounter higher innovation costs, under minor innovation conditions, they are inclined to maintain the status quo to avoid the risks associated with costly innovation. In this case, after evaluating the relative benefits of minor innovations versus cross-border monopolies, HPs may choose a cross-border monopoly strategy. On the other hand, even in a minor innovation context, if SMPs exhibit a greater innovation influence, they will still pursue innovative activities. Correspondingly, HPs will adopt a cross-border innovation strategy to seek new growth opportunities in response to the competitive pressure from SMPs.
Regardless of whether it is a major or minor innovation scenario, if the innovation cost of SMPs satisfies , the evolutionary game between the two types of platforms will eventually converge to {cross-border innovation, innovation}. When decreases, the position of point in Figure 5a will shift downward, indicating a stronger tendency for the system to converge to {cross-border innovation, innovation}.
The strategic implication of Proposition 5 is that, in the context of minor innovations, the relative advantage of the innovation influence plays a more significant role than innovation costs in determining platforms’ strategy choices. HPs should maintain an open attitude even when facing minor innovations, avoiding falling into a monopolistic mindset. SMPs need to recognize that even minor innovations, if they can continuously accumulate innovation influence, can still change the competitive landscape. This requires companies to establish agile innovation mechanisms, while also suggesting that policymakers should pay attention to the cumulative effects of minor innovations and create a favorable development environment for them.
To further support Propositions 4 and 5, this study analyzed the actual case of Meta in related markets. Meta completed the acquisitions of the image and video sharing platform Instagram in April 2012 and the instant messaging platform WhatsApp in February 2014. Using relevant data from Statista, Figure 6a illustrates that before being acquired by Meta, WhatsApp and Instagram experienced slow global user traffic growth. After the acquisitions, user traffic continued to grow rapidly and steadily. However, the user traffic growth of other SMPs in the markets of these two platforms differed. For instance, the user traffic of the platform Discord in the instant messaging market remained relatively slow from 2011 to 2023, while the smaller photo-sharing platform Pinterest experienced rapid user traffic growth from 2012 to 2023. Based on the annual reports of Discord and Pinterest, Figure 6b shows that from 2017 to 2023, Pinterest’s average annual R&D expenditure accounted for approximately 43.2%, peaking at 55.4% in 2019, while Discord’s average annual R&D expenditure accounted for only about 22.5%. This significant difference in innovation investment had a notable impact on the platforms’ traffic growth trends. Pinterest, with its high level of R&D investment, achieved continuous technological iteration and business model optimization, leading to steady user traffic growth.
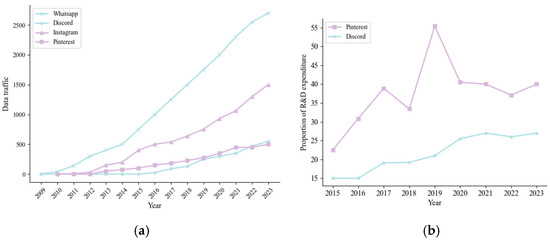
Figure 6.
(a) Changes in user traffic for HPs and SMPs; (b) R&D expenditure of SMPs.
In this scenario, Meta’s innovation influence was greater than that of the SMPs, so it chose a cross-border innovation strategy. SMPs, such as Pinterest, need to continuously invest in innovation to increase their market share or at least maintain their current market position. This phenomenon aligns with Proposition 4(i). Discord did not invest enough resources in innovation and, therefore, failed to effectively respond to the competitive pressure from HPs. This aligns with the situation in Proposition 4(ii) or Proposition 5(i), where SMPs choose to maintain the status quo.
Proposition 6.
In the relevant market, when the game converges to {cross-border innovation, innovation}, the following is true:
- (1)
- When , if , then and ; if , then and .
- (2)
- When , if , then and ; if , then and .
Under the scenario of major innovation (), then ; if the innovation is dominated by the major innovation of HPs (), it satisfies and . If the innovation is led by the major innovation of SMPs (), it also satisfies and . This suggests that under the major innovation scenario, as the influence of coefficient on the market volume change rate increases, and the influence of coefficient on the market share change rate decreases, becomes smaller, and the critical point, D, shifts downward. Consequently, the game outcome increasingly favors {cross-border innovation, innovation}.
In the scenario of minor innovation (), then ; if the innovation influence of HPs is relatively large (), it satisfies and . Similarly, if the innovation influence of SMPs is relatively large (), it also satisfies and . This implies that under the minor innovation scenario, as the influence of coefficient on the market volume change rate decreases and the influence of coefficient on the market share change rate increases, becomes smaller, leading HPs to choose cross-border innovation and SMPs to choose innovation.
Market share refers to the proportion of a platform’s presence in the market, while market capacity refers to the overall user base of the market. In the context of major innovation, market capacity can expand significantly due to the disruptive and novel nature of the innovation, attracting more consumers into the market and providing broader opportunities for all the market’s participants. However, major innovation typically requires time to be accepted and fully utilized by the market, meaning it does not immediately result in the rapid growth of the market share for platforms. In such a scenario, both HPs and SMPs tend to pursue innovation strategies, aiming to benefit from the increased market capacity over the long term. Minor innovation offers platforms an opportunity to quickly test market responses and adjust their strategies accordingly. It is also more easily accepted by users, making it appealing for platforms to implement. While minor innovation does not significantly increase the market capacity, it generates swift market feedback and recognition. As a result, both HPs and SMPs are motivated to adopt innovation strategies to enhance their market share and responsiveness.
According to Proposition 6, if the innovation cost for SMPs remains as , both major and minor innovations maintain their appeal. This spontaneous market mechanism suggests that there is no need for the government or other regulatory bodies to introduce additional policies to promote market competition and innovation, as the market is already self-adjusting and evolving. Such a market environment not only ensures competitiveness but also fosters continuous innovation, delivering high-quality experiences and added value to consumers and all participants.
5.3. Sensitivity Analysis in Monopolistic Related Markets
In this subsection, we conduct a sensitivity analysis of the parameter . As shown in Figure 7, we find that as increases, the probability of HPs choosing cross-border innovation becomes higher (i.e., approaches 0 more quickly), while the probability of SMPs opting for innovation also increases (i.e., approaches 1 more quickly). Consequently, the speed at which the game converges to a stable state also increases.
Figure 7.
Sensitivity analysis of market share change rate, . (a) HPs; (b) SMPs.
6. Conclusions
In light of the impact of HPs’ cross-border expansion on the competitiveness and the level of innovation of both core markets and related markets, this paper outlines the evolutionary logic of platforms in cross-market competition. By constructing an evolutionary game model from the perspective of data factors, it analyzes their expansion strategies in core markets and cross-border behaviors in related markets. This paper discusses the evolutionarily stable strategies of the two types of platforms (HPs and SMPs) under different conditions and the factors influencing their strategy choices, supplemented by numerical simulations to validate the game process. The rapid development of the digital economy and advancements in data algorithm technologies have enabled platforms to acquire real-time, granular, and structured market data, further accelerating the industry’s digital transformation through cross-border competition among platforms.
6.1. Findings
This study finds that, in the core market, whether HPs adopt an expansion strategy and whether SMPs choose a non-exit strategy primarily depend on three factors. First, the cost required for HPs to implement the expansion strategy and the extent to which this strategy impacts the user scale. Second, the operational costs for SMPs to adopt a non-exit strategy and their influence on the user scale. Third, the gap in the total user value between HPs and SMPs. Any of these three factors can significantly affect the convergence outcome of the game.
When HPs engage in cross-border activities in related markets, they may choose cross-border competition, cross-border innovation, or a cross-border monopoly. In a competitive environment, HPs are likely to consider two strategic options: cross-border competition or cross-border innovation, while SMPs in the related market decide whether to pursue innovation or adopt non-innovation strategies. The findings suggest that when HPs have a greater innovation influence, they tend to choose cross-border innovation, while SMPs, lacking sufficient technology or resources, opt for a non-innovation strategy. Conversely, when SMPs have a greater innovation influence, low innovation costs drive them to pursue innovation. However, if innovation costs are high, these SMPs become more conservative, and the system fails to converge to a specific equilibrium point.
In related markets, under a monopolistic environment, HPs may choose between cross-border monopoly and cross-border innovation strategies. In the context of system dynamics involving major innovation, when HPs possess a greater innovation influence, the system converges to a specific equilibrium point: {cross-border innovation, innovation}. Conversely, when SMPs have a greater innovation influence, the level of innovation costs determines the direction of system evolution. In the context of system dynamics involving minor innovation, if HPs have a greater innovation influence, the level of SMPs’ innovation costs influences the system’s evolution. If innovation costs are low, the system converges to {cross-border innovation, innovation}; however, if innovation costs are high, the system may converge to {cross-border monopoly, non-innovation}. On the other hand, if SMPs have a greater innovation influence, regardless of the level of innovation costs, the system always converges to {cross-border innovation, innovation}.
6.2. Research Contributions
This study makes three important contributions to the existing literature on platforms’ cross-border competition and innovation: (1) The current research primarily focuses on static analysis, whereas this study constructs a two-stage evolutionary game model based on data elements. It systematically analyzes the expansion behavior of HPs in core markets and their cross-border competition behavior in related markets. This research provides a new perspective for the theoretical framework of platforms’ cross-border competition, particularly revealing the dynamic characteristics of data flow in different market environments and its impact on the strategic decisions of HPs. (2) Existing research primarily focuses on innovation modes and mechanisms at the macro level, whereas this study explores the innovation strategy adjustments of SMPs from a micro perspective. Specifically, this study analyzes how SMPs flexibly adjust their innovation decisions based on their own resource constraints and the strategies of HPs, in response to varying innovation costs and impacts. This contribution expands the research scope in the field of innovation for SMPs, particularly providing a new analytical framework for their innovation capabilities and adaptation strategies in dynamic competitive environments. (3) This study fills the research gap regarding the impact of cross-border competition and cross-border monopoly strategies on related markets. We analyzed the interactions between HPs and SMPs in cross-border markets under different innovation scenarios and explored how their innovation strategies jointly shape the system’s steady state under the coexistence of monopolies and competition.
6.3. Managerial Insights
This study offers several managerial implications aimed at providing strategic guidance for both HPs and SMPs. HPs should consider the following aspects when formulating strategies: In the core market, if the HPs’ goal is to expand their market share, they should continuously optimize data technologies, management, and operational processes to reduce the costs associated with data-driven expansion. HPs should increase their investment in data value, further widening the gap in data resources between themselves and SMPs, thereby consolidating their market leadership. However, HPs need to be mindful of the risks of over-expansion, ensuring that expansion does not lead to resource waste or unhealthy market competition. In the competitive environment of related markets, HPs should focus on their innovation influence. If there is a clear innovation advantage, HPs should opt for a cross-border innovation strategy, expanding the market by integrating data resources from new fields and attracting more users through innovation. However, HPs should avoid using monopoly tactics to control the market and prevent excessive competition from stifling innovation. In monopolistic environments, HPs need to balance the impact of cross-border innovation and cross-border monopoly strategies on the data scale and choose the strategy that maximizes data growth. Additionally, HPs must pay attention to interactions with SMPs’ innovation behavior. If SMPs demonstrate a significant influence on innovation, HPs should consider collaborating with them or adopting alternative strategies to maintain their data scale.
In the face of data-driven market competition, SMPs in the core market should assess whether they have sufficient data resources and innovation capabilities to compete with HPs. If the expansion costs for HPs are low and their data resource advantages are significant, SMPs may face pressure to exit the market. Therefore, platform managers should consider finding a differentiated competitive strategy in market segmentation or unique positioning to avoid direct competition with HPs, thereby reducing the risk of being forced to exit the market. In related markets, particularly in a competitive environment, if SMPs can effectively accumulate data resources and enhance their innovation influence through R&D, they will be better positioned to survive in a highly competitive environment. As such, SMPs should focus on innovation in products, technologies, and services, creating differentiated competitive advantages by strengthening their innovation influence. In a monopolistic environment, if the innovation costs faced by SMPs are relatively low, even under strong competition from HPs, SMPs should continue to invest in innovation, steadily increasing their data scale and market share. When HPs have a strong innovation advantage, SMPs can lower entry barriers and enhance their market competitiveness through continuous innovation. However, if innovation costs are high, SMPs should carefully evaluate the potential returns from innovation to avoid wasting resources on high innovation costs. In such a situation, SMPs should consider collaborating with other platforms or R&D institutions to jointly reduce innovation barriers, share technological resources, and leverage external partnerships for innovation, thus lowering risks and improving their market adaptability.
To promote the healthy development of the data element market and ensure fair competition, policymakers need to adopt a multifaceted approach. First, clear data governance rules should be established to prevent the over-expansion of HPs and safeguard the development space of SMPs. Policymakers should strengthen the regulation of data privacy, data monopolies, and platform competition behaviors to ensure that platforms comply with fair competition rules during expansion. In addition, policies should reduce innovation costs through innovation funds, tax incentives, R&D subsidies, and other measures, encouraging platforms to engage in technological R&D and market innovation. These policies can help SMPs lower the economic barriers to innovation and improve their market competitiveness. As HPs expand into related markets, governments should intensify the regulation of cross-border monopolistic behaviors. Through antitrust laws and policies, the government should prevent HPs from leveraging their data advantages to establish unfair monopolistic positions in new markets and suppress innovation. Policies can guide platforms to find a balance between collaborative innovation and competition, avoiding excessive market concentration, and ensuring that all platforms can develop in a fair competitive environment.
6.4. Limitations and Future Research
In this study, “cross-border competition” and “cross-border monopoly” are abstract representations of platform behaviors, explicitly identified as behavior path choices based on data migration and utilization, rather than concrete market phenomena or rule definitions. “Cross-border competition” refers to the behavior of platforms leveraging the data and traffic advantages that they accumulated in the core market to enter related markets and compete with existing firms. On the other hand, “cross-border monopoly” describes a platform’s monopolistic behaviors in related markets, driven by its data advantages from the core market during cross-border activities. It is worth noting that this study does not delve into specific types of cross-border monopoly behaviors; rather, it treats these concepts as surface-level manifestations of cross-border platform behaviors. The deeper issue lies in how cross-border data migration serves as the basis for platform behavior choices—namely, how platforms utilize data migration from their core markets to enter related markets, form competitive advantages, and subsequently choose either the cross-border competition or cross-border monopoly path.
Future research can further refine the behavioral classifications of “cross-border competition” and “cross-border monopoly”. For example, it could explore different forms of cross-border monopolies (such as algorithmic discrimination, data blocking, and vertical integration) and how they manifest in the platform economy. Additionally, studies could consider the influence of varying market characteristics (e.g., differences in user demand or market entry barriers) on platforms’ behavior choices in cross-border competition, thereby providing a more comprehensive depiction of platforms’ strategy dynamics in cross-border activities.
Author Contributions
Conceptualization, M.L. and Z.Y.; methodology, M.L.; software, M.L. and M.K.; validation, M.L.; formal analysis, M.L.; model construction, M.L.; resources, M.L. and Z.Y.; writing—original draft preparation, M.L.; writing—review and editing, M.L. and M.K.; supervision, Z.Y.; project administration, Z.Y. All authors have read and agreed to the published version of the manuscript.
Funding
This research was funded by the National Natural Science Foundation of China (No. 72371007).
Institutional Review Board Statement
Not applicable.
Informed Consent Statement
Not applicable.
Data Availability Statement
The data that support the findings of this study are available from the corresponding author upon reasonable request.
Acknowledgments
The authors would like to thank the anonymous reviewers for very detailed and helpful comments and suggestions on this work.
Conflicts of Interest
The authors declare no conflicts of interest.
Appendix A
Proof of Lemma 1.
Let , which yields or , and the critical value of is . The stability of the replicator dynamics for HPs is analyzed as follows: (1) When , , indicating that for HPs, whether they choose an expansion strategy or a non-expansion strategy, the outcome is stable for them. (2) When , , , which indicates that , and the expansion strategy is the locally stable equilibrium point. (3) When , and , which indicates that , and the non-expansion strategy is the locally stable equilibrium point.
Let , which yields or , and the critical value of is . The replicator dynamics for SMPs are analyzed as follows: (1) When , , indicating that for SMPs, whether they choose the exit strategy or the non-exit strategy, the outcome is stable. (2) When , and , which indicates that , and the exit strategy is the locally stable equilibrium point. (3) When , and , which indicates that , and the non-exit strategy is the locally stable equilibrium point. Thus, Lemma 1 is proven. □
Proof of Proposition 1.
Based on the expressions for and , it is evident that when , , and when , . These conditions suggest that the system tends to converge toward the equilibrium state (1, 1).
As illustrated in Figure 1a, the position of the saddle point, , determines the system’s trajectory toward one of the two equilibrium states. When the saddle point, , falls within region 2, both and are less than . Consequently, the system is more likely to converge toward the equilibrium point (1, 1), as the tendency for this equilibrium state becomes stronger, as shown in Figure 1b. Thus, Proposition 1 is proven. □
Proof of Proposition 2.
When , ; when , . Under these conditions, the saddle point, , lies in region 1. Consequently, the system tends to converge on the equilibrium point (0, 0), as the tendency for this equilibrium state is reinforced, as shown in Figure 1c. Thus, Proposition 2 is proven. □
Proof of Lemma 2.
The replicator dynamics for HPs are analyzed as follows: (1) When , , indicating that for HPs, whether they choose a cross-border competition strategy or a cross-border innovation strategy, the outcome is stable for them. (2) When , and , which indicates that , and the cross-border competition strategy is the locally stable equilibrium point. (3) When , and , which indicates that , and the cross-border innovation strategy is the locally stable equilibrium point.
The replicator dynamics for SMPs are analyzed as follows: (1) When , , indicating that for SMPs, whether they choose the non-innovation strategy or the innovation strategy, the outcome is stable. (2) When , and , which indicates that , and the non-innovation strategy is the locally stable equilibrium point. (3) When , and , which indicates that , and the innovation strategy is the locally stable equilibrium point. Thus, Lemma 2 is proven. □
Proof of Proposition 3.
The denominator of is . We analyzed each term separately to determine its sign: Since (a standard assumption for platform parameters being positive), we have . Additionally, (representing the relevance or influence of innovation) is positive. Therefore, . Since (representing the impact factor of innovation, either major or minor), we concluded and . By summing these terms, the denominator becomes a sum of all negative terms. Thus, the statement is proven: when , we have , and is always satisfied. As shown in Figure 4a, the system converges to the point , where HPs choose the cross-border innovation strategy, and SMPs choose the non-innovation strategy.
The numerator of is . Given , all the terms in are positive if , which is assumed to hold. is sufficiently small, so it does not dominate the numerator. By comparing the numerator and denominator of , it was found that . Therefore, when is sufficiently small, the numerator is greater than the denominator, leading to . As shown in Figure 4b, the system converges to the point , where HPs choose the cross-border competition strategy, and SMPs choose the innovation strategy.
If cannot be neglected, there exists a situation where the numerator is smaller than the denominator, resulting in . Thus, Proposition 3 is proven. □
Proof of Lemma 3.
The replicator dynamics for HPs are analyzed as follows: (1) When , , indicating that for HPs, whether they choose a cross-border monopoly strategy or a cross-border innovation strategy, the outcome is stable for them. (2) When , and , indicating that is the stable equilibrium point. In this case, HPs will adopt the cross-border innovation strategy. (3) When , and , indicating that is the stable equilibrium point. In this case, HPs will adopt the cross-border monopoly strategy.
The replicator dynamics for SMPs are analyzed as follows: Since , when the innovation cost of SMPs is , , and becomes the stable equilibrium point. In this case, SMPs will adopt the innovation strategy. If the innovation cost of SMPs is , : (1) When , becomes the stable equilibrium point, and SMPs choose the non-innovation strategy. (2) When , becomes the stable equilibrium point, and SMPs choose the innovation strategy. Thus, Lemma 3 is proven. □
Proof of Proposition 6.
Under the scenario of major innovation (), . When , then . Additionally, if and , then ; if , then as well.
In the scenario of minor innovation (), . When , . In this case, if and , ; if , . Thus, Proposition 6 is proven. □
References
- Nuccio, M.; Guerzoni, M. Big data: Hell or heaven? Digital platforms and market power in the data-driven economy. Comp. Change 2019, 23, 312–328. [Google Scholar] [CrossRef]
- Parker, G.G. Platform Revolution: How Networked Markets Are Transforming the Economy and How to Make Them Work for You; WW Norton & Company: New York, NY, USA, 2016. [Google Scholar]
- Evans, D.S. Matchmakers: The New Economics of Multisided Platforms; Harvard Business Review Press: Brighton, MA, USA, 2016. [Google Scholar]
- Qiu, Z.; Yin, Y.; Yuan, Y.; Chen, Y. Research on credit regulation mechanism of e-commerce platform based on evolutionary game theory. J. Syst. Sci. Syst. Eng. 2024, 33, 330–359. [Google Scholar] [CrossRef]
- Deng, Z.; Wang, Z. Early-mover advantages at cross-border business-to-business e-commerce portals. J. Bus. Res. 2016, 69, 6002–6011. [Google Scholar] [CrossRef]
- Gawer, A.; Cusumano, M.A. Industry platforms and ecosystem innovation. J. Prod. Innov. Manag. 2014, 31, 417–433. [Google Scholar] [CrossRef]
- Cutolo, D.; Kenney, M. Platform-dependent entrepreneurs: Power asymmetries, risks, and strategies in the platform economy. Acad. Manag. Perspect. 2021, 35, 584–605. [Google Scholar] [CrossRef]
- Varga, S.; Cholakova, M.; Jansen, J.J.; Mom, T.J.; Kok, G.J. From platform growth to platform scaling: The role of decision rules and network effects over time. J. Bus. Ventur. 2023, 38, 106346. [Google Scholar] [CrossRef]
- Cennamo, C. Competing in digital markets: A platform-based perspective. Acad. Manag. Perspect. 2021, 35, 265–291. [Google Scholar] [CrossRef]
- Ritala, P.; Golnam, A.; Wegmann, A. Coopetition-based business models: The case of Amazon.com. Ind. Mark. Manag. 2014, 43, 236–249. [Google Scholar] [CrossRef]
- De Cornière, A.; Taylor, G. Data-driven mergers. Manag. Sci. 2024, 70, 6473–6482. [Google Scholar] [CrossRef]
- Lee, R.S. Vertical integration and exclusivity in platform and two-sided markets. Am. Econ. Rev. 2013, 103, 2960–3000. [Google Scholar] [CrossRef]
- Zhang, X.; Gao, C.; Zhang, S. The niche evolution of cross-boundary innovation for Chinese SMEs in the context of digital transformation—Case study based on dynamic capability. Technol. Soc. 2022, 68, 101870. [Google Scholar] [CrossRef]
- Chan, C.M.; Teoh, S.Y.; Yeow, A.; Pan, G. Agility in responding to disruptive digital innovation: Case study of an SME. Inf. Syst. J. 2019, 29, 436–455. [Google Scholar] [CrossRef]
- Alghamdi, O.; Agag, G. Competitive advantage: A longitudinal analysis of the roles of data-driven innovation capabilities, marketing agility, and market turbulence. J. Retail. Consum. Serv. 2024, 76, 103547. [Google Scholar] [CrossRef]
- Carroni, E.; Madio, L.; Shekhar, S. Superstar exclusivity in two-sided markets. Manag. Sci. 2024, 70, 991–1011. [Google Scholar] [CrossRef]
- Cozzolino, A.; Corbo, L.; Aversa, P. Digital platform-based ecosystems: The evolution of collaboration and competition between incumbent producers and entrant platforms. J. Bus. Res. 2021, 126, 385–400. [Google Scholar] [CrossRef]
- Shi, R.; Aaltonen, A.; Henfridsson, O.; Gopal, R.D. Comparing Platform Owners’ Early and Late Entry into Complementary Markets. MIS Q. 2023, 47, 1727–1744. [Google Scholar] [CrossRef]
- Feng, Y.; Hu, M. Market Entry and Competition Under Network Effects. Oper. Res. 2024, 72, 2467–2487. [Google Scholar] [CrossRef]
- Rietveld, J.; Schilling, M.A. Platform competition: A systematic and interdisciplinary review of the literature. J. Manag. 2021, 47, 1528–1563. [Google Scholar] [CrossRef]
- Liu, Q.; Serfes, K. Price discrimination in two-sided markets. J. Econ. Manag. Strat. 2013, 22, 768–786. [Google Scholar] [CrossRef]
- Grover, V.; Chiang, R.H.; Liang, T.P.; Zhang, D. Creating strategic business value from big data analytics: A research framework. J. Manag. Inf. Syst. 2018, 35, 388–423. [Google Scholar] [CrossRef]
- Halberstadt, J.; Kollhoff, S.; Kraus, S.; Dhir, A. Early bird or early worm? First-mover (dis) advantages and the success of web-based social enterprises. Technol. Forecast. Soc. Change 2022, 181, 121784. [Google Scholar] [CrossRef]
- Cennamo, C.; Santalo, J. Platform competition: Strategic trade-offs in platform markets. Strateg. Manag. J. 2013, 34, 1331–1350. [Google Scholar] [CrossRef]
- Eisenmann, T.; Parker, G.; Van Alstyne, M. Platform envelopment. Strateg. Manag. J. 2011, 32, 1270–1285. [Google Scholar] [CrossRef]
- Eisenmann, T. Strategies for Two-Sided Markets; Harvard Business Review Press: Brighton, MA, USA, 2006. [Google Scholar]
- Enkel, E.; Gassmann, O. Creative imitation: Exploring the case of cross-industry innovation. R&D Manag. 2010, 40, 256–270. [Google Scholar] [CrossRef]
- Bond III, E.U.; Houston, M.B. Barriers to matching new technologies and market opportunities in established firms. J. Prod. Innov. Manag. 2003, 20, 120–135. [Google Scholar] [CrossRef]
- Chen, T.Y.; Chang, H.F. Critical success factors and architecture of innovation services models in data industry. Expert Syst. Appl. 2023, 213, 119014. [Google Scholar] [CrossRef]
- Jia, Y.; Su, J.; Cui, L.; Wu, L.; Tan, K.H. Platform business model innovation in the digitalization era: A “driver-process-result” perspective. J. Bus. Res. 2023, 160, 113818. [Google Scholar] [CrossRef]
- Wen, W.; Zhu, F. Threat of platform-owner entry and complementor responses: Evidence from the mobile app market. Strateg. Manag. J. 2019, 40, 1336–1367. [Google Scholar] [CrossRef]
- Markides, C. Disruptive innovation: In need of better theory. J. Prod. Innov. Manag. 2006, 23, 19–25. [Google Scholar] [CrossRef]
- McIntyre, D.; Srinivasan, A.; Afuah, A.; Gawer, A.; Kretschmer, T. Multisided platforms as new organizational forms. Acad. Manag. Perspect. 2021, 35, 566–583. [Google Scholar] [CrossRef]
- Gebauer, H.; Paiola, M.; Saccani, N.; Rapaccini, M. Digital servitization: Crossing the perspectives of digitization and servitization. Ind. Mark. Manag. 2021, 93, 382–388. [Google Scholar] [CrossRef]
- Aral, S.; Brynjolfsson, E.; Van Alstyne, M. Information, technology, and information worker productivity. Inf. Syst. Res. 2012, 23, 849–867. [Google Scholar] [CrossRef]
- Li, J.; Chen, L.; Yi, J.; Mao, J.; Liao, J. Ecosystem-specific advantages in international digital commerce. J. Int. Bus. Stud. 2019, 50, 1448–1463. [Google Scholar] [CrossRef]
- Siaw, C.A.; Sarpong, D. Dynamic exchange capabilities for value co-creation in ecosystems. J. Bus. Res. 2021, 134, 493–506. [Google Scholar] [CrossRef]
- Ferrigno, G.; Barabuffi, S.; Marcazzan, E.; Piccaluga, A. What “V” of the big data influence SMEs’ open innovation breadth and depth? An empirical analysis. R&D Manag. 2024. [Google Scholar] [CrossRef]
- Smith, J.M. The theory of games and the evolution of animal conflicts. J. Theor. Biol. 1974, 47, 209–221. [Google Scholar] [CrossRef]
- Taylor, P.D.; Jonker, L.B. Evolutionary stable strategies and game dynamics. Math. Biosci. 1978, 40, 145–156. [Google Scholar] [CrossRef]
- Du, J.; Li, J.; Li, J.; Li, W. Competition–cooperation mechanism of online supply chain finance based on a stochastic evolutionary game. Oper. Res. 2023, 23, 55. [Google Scholar] [CrossRef]
- Liu, W.; Long, S.; Wei, S.; Xie, D.; Wang, J.; Liu, X. Smart logistics ecological cooperation with data sharing and platform empowerment: An examination with evolutionary game model. Int. J. Prod. Res. 2022, 60, 4295–4315. [Google Scholar] [CrossRef]
- Li, F.; Qian, X.; Kong, J.; Luo, Z. Evolutionary game analysis of information sharing among closed-loop supply chain members in cloud environment. Arab. J. Sci. Eng. 2022, 47, 3945–3961. [Google Scholar] [CrossRef]
- Tao, Z.; Wang, B.; Shu, L. Analysis on the procurement cost of construction supply chain based on evolutionary game theory. Arab. J. Sci. Eng. 2021, 46, 1925–1940. [Google Scholar] [CrossRef]
- Yang, Y.; Chen, N.; Chen, H. The digital platform, enterprise digital transformation, and enterprise performance of cross-border e-commerce—From the perspective of digital transformation and data elements. J. Theor. Appl. Electron. Commer. Res. 2023, 18, 777–794. [Google Scholar] [CrossRef]
- Zhang, R.; Sun, B. A competitive dynamics perspective on evolutionary game theory, agent-based modeling, and innovation in high-tech firms. Manag. Decis. 2019, 58, 948–966. [Google Scholar] [CrossRef]
- Fuentelsaz, L.; Garrido, E.; Maicas, J.P. Incumbents, technological change and institutions: How the value of complementary resources varies across markets. Strateg. Manag. J. 2015, 36, 1778–1801. [Google Scholar] [CrossRef]
Disclaimer/Publisher’s Note: The statements, opinions and data contained in all publications are solely those of the individual author(s) and contributor(s) and not of MDPI and/or the editor(s). MDPI and/or the editor(s) disclaim responsibility for any injury to people or property resulting from any ideas, methods, instructions or products referred to in the content. |
© 2025 by the authors. Licensee MDPI, Basel, Switzerland. This article is an open access article distributed under the terms and conditions of the Creative Commons Attribution (CC BY) license (https://creativecommons.org/licenses/by/4.0/).