Abstract
This research aims at examining the progress of retail demand forecasting and customer classification via regression models and RFM analysis in the retail chain industry. Entailing actual retail sales data, this work utilizes three regression models:—MLP Regressor, Ridge Regressor, and KNN Regressor to forecast sales. Of them, the MLP Regressor yielded the least Mean Squared Error (MSE = 2.66 × 10) and the best coefficient of determination (R2 = 0.9398) stressing its ability to identify deviations from linearity in the sales data. Also, RFM analysis, augmented by K-Means clustering, successfully categorized customers into actionable segments: loyal customers, champions, at-risk, and hibernating. Exploratory data analysis (EDA) findings indicated dramatic changes in sales and revenue, activities, and customer interactions, and products. The combined application of these approaches offers operational solutions in product acquisition, marketing communication, and revenue enhancement. The study advances current research by integrating predictive regression models with RFM segmentation, offering a dual-framework that enhances retail demand forecasting and customer behavior analysis, thereby bridging a critical gap in data-driven decision-making. However, bearing in mind that the lack of demographic data and limited feature variety may constrain the model’s ability to capture personalized customer behaviors, the findings provide a foundation for integrating more diverse datasets and advanced learning approaches for improved retail analytics.
1. Introduction
The retail industry has become highly informative through the collection of large amounts of transactional data every day [1]. These data are a gold mine when it comes to analyzing customer trends, managing stock, and increasing organizational effectiveness. To optimally utilize this wealth of data, health care organizations need not only strong analytical concepts and models, but analytical concepts and models that include exploratory, predictive, and prescriptive analytics [2]. Knowledge about how to use such data is important for being able to survive in the current business environment, more so for retail businesses. The global retail market environment has become volatile in terms of demand and steadily increasing competition, which requires accurate demand forecasting and consumer segmentation as critical success factors [3]. The challenges that affect the retailers include the ability to forecast sales so as to avoid holding large stocks or running out of stock; identification of loyal customers who should be sustained as a way of reducing channel leakage; and finally, awareness of any new trends within the market so as to know which aspect to focus on while conducting marketing [4]. With changing business dynamics, where most decisions are made based on data, the use of machine learning, statistical modeling for data analysis, and advanced segmentation techniques have become a solution to these problems.
Exploratory data analysis or EDA has for a long time now been a staple of retail analytics where organizations can investigate large transactional datasets to find new patterns [5]. Information derived from EDA can include seasonality patterns for sales, transaction rates, and patterns of revenues [6]. Nevertheless, descriptive analytics form a basis, but this lacks the answer to creating necessary predictive reports and forecasts. This gap is filled by predictive modeling, which in turn helps the businesses to forecast or estimate the future performance and outcomes including the certain sales or the demand for certain products [7]. Among these methods, regression models are used most frequently for demand forecasting because of their ability to estimate such quantitative targets as constant growth rates, percentage increases, etc. However, the other critical aspect for the deployment of strategic marketing and engagement is customer behavior prediction [8]. RFM analysis, which stands for recency, frequency, and monetary, is an effective method for a customer’s division according to his/her buying profile [9]. Studying customers as a valuable or loyal group, at-risk or potential to leave the company, or new, RFM analysis enables businesses to create subsequent marketing strategies for the above segments to ensure customer retention and satisfaction [10]. Combining predictive modeling and RFM analysis provides a synergy that effectively covers both probable selling and customer relations issues.
The integration of regression models for demand forecasting with RFM-based customer segmentation presents a novel approach that simultaneously optimizes stock management and marketing strategies. By leveraging predictive analytics and behavioral clustering, this study provides a holistic view of retail dynamics. A major spear that grounds this study is that today’s retailers require new knowledge from their inherent transactional data. Research has shown that many retailers face challenges in implementing exploratory data analysis (EDA), training predictive models, and segmenting customers effectively. These issues contribute to inefficiencies in inventory management and targeted marketing, highlighting the need for integrated analytical solutions [11]. This gap leads to cost waste in inventory, lack of proper segmentation in the market, and a general lack of responsiveness to market changes. This research is particularly driven by the possibilities that bring together more than one analytical approach to achieving comprehensive results. For instance, regression models can be used to predict sales trends, but partners cannot use this model as guide to solve the behavioral aspect of customer retention. Likewise, RFM analysis categorizes those vital customers into loyal and churner, but it gives no assistance in demand forecasting [12]. While previous studies have examined either demand forecasting or customer segmentation separately, few have explored their integration for comprehensive retail analytics. This study fills this gap by combining predictive modeling with behavioral segmentation to provide a data-driven framework for strategic retail decision-making [13,14]. The information obtained from the results can contribute to the sound management decisions for inventory management, marketing, and customer relations activities as well as to increase profitability and reduce business costs.
The rest of this paper is organized as follows. Section 2 provides a brief literature review of the topics in retail analytics, methods of prediction, and customer segmentation. Section 3 describes the approach with explainers on data preparation and cleaning, exploratory visualization, feature construction, and the model flow. Section 4 includes the analysis of the data presented in the study and key findings, all of which are then discussed with a focus on their implications on the operations of retail organizations. Finally, in Section 5, the conclusion consists of conclusions on contribution, limitations, and future research direction.
2. Literature Review
The author of [15] improves retail selling forecast by adding macroeconomic indicators, such as CPI, ICS, and unemployment rates, into a dataset that embraces selling records from five years ago collected from Walmart. Using Lasso, Ridge Regression models, LightGBM, XGBM, and Decision Trees, this paper assesses the impact of these macroeconomic predictors on prediction bias. When macroeconomic factors are included, it is established that there are slight but significant enhancements achieved in model performance enhancement, whereby the LightGBM model is found to enhance the best value of the RMSE of 1.715 and MAE of 0.847. This approach highlights the importance of supplementing traditional time-series data with external economic factors while providing a strong framework for more accurate retail demand estimates and hence more efficient working of inventory holding and supply chains. The author of [16] presents a sales forecast model based on machine learning utilizing the XGBoost algorithm, which exhibits high scalability and effectiveness. The additional feature engineering involves time aggregation, date lags, and rolling stats, extracted from 1913 days of Walmart sales history. There are also explanatory variables included in the dataset as well, such as price and promotional data. During data preprocessing, there were techniques of outlier’s removal and memory optimization. Concerning the effectiveness of the model, the experimental results indicate the distinguished RMSSE of the proposed XGBoost model, which is 0.655, and is higher than that of Linear Regression with 16.3% and Ridge Regression with 15.4%. Thus, the present research demonstrates XGBoost’s ability to provide highly accurate and time-efficient sales predictions, thus stressing its efficiency for enhancing retail business functionality.
The authors of [17] discussed the issues in retail forecasting to answer questions at the strategic, tactical, and operational levels for products, supply chains, and temporal resolutions. The authors focus on the use of econometric and machine learning tools for forecasting while discussing issues like stock-outs or promotional interactions and demand fluctuations. The study indicates that developed techniques such as econometric models perform better than less developed techniques since they correctly reflect changes in the market needs, especially during the period of economic instability. While prior studies have focused on retail forecasting, they often overlook the role of customer segmentation in refining marketing strategies [15,16,17]. Additionally, most demand forecasting models do not integrate behavioral insights, which limit their practical applicability. Our study addresses these gaps by combining regression-based forecasting with RFM-based segmentation to offer a more comprehensive analytical approach. Prior studies have extensively examined retail forecasting, and they often overlook the critical role of customer segmentation in refining marketing strategies. Additionally, many demand forecasting models lack integration of behavioral insights, limiting their practical applicability. Our study addresses these gaps by combining regression-based forecasting with recency, frequency, monetary (RFM)-based segmentation to offer a more comprehensive analytical approach [18]. However, the research finds that there are some limitations, such as the absence of empirical studies that evaluate non-linear models and the absence of synchronization between macroeconomic variables and retail prediction. The results support the call for focused interventions that increase the accuracy to facilitate better informed strategic retail decisions. The author in [19] outlines a strategic plan to establish a reliable Customer Segregation Infrastructure with the help of data mining. The method included data acquisition from multiple organizational sources and data preprocessing, exploratory data analysis, and feature selection for data relevance. Clustering, classification, and association mining data mining algorithms were then used, to uncover underlying patterns for accurate customer segmentation. The insights were then translated into developing specific targeted marketing plans and implementing the right resources. Such changes were evident, including positive changes to customer relations by favoring personalized interactions, efficiency in resource management and accurate targeting of customers. The study brought out the effectiveness of data mining in the development of customer-oriented business models, but it was made clear that this practice must be accompanied by ethical considerations since the problem of data privacy and security cannot be overlooked. Recent advancements in deep learning have demonstrated the efficacy of models like Long Short-Term Memory (LSTM) networks and Transformer-based architectures in time-series forecasting. For instance, a study published in Scientific Reports proposes a time series prediction model that fuses Transformer and LSTM algorithms, highlighting the strengths of both approaches in capturing temporal dependencies [20]. Similarly, alternative clustering methods such as Density-Based Spatial Clustering of Applications with Noise (DBSCAN) and hierarchical clustering have been explored for customer segmentation. A comparative analysis on Kaggle demonstrates the application of K-Means, DBSCAN, and Affinity Propagation clustering algorithms for segmenting mall customers, showcasing the effectiveness of these methods in identifying distinct customer groups [21,22,23]. While these techniques offer potential improvements, our study focuses on interpretable and widely adopted methodologies for practical retail applications.
In this paper [24], the author employs IoT analytics and marketing intelligence with a view to facilitating decision-making within the complex digital context. The authors presented a method involving data acquisition utilizing the IoT devices, data gathering, and data pre-processing, followed using machine learning-based client-side analytics including clustering, classification, and regression. It focused on the ingestion and analysis of streams, and the proposed approach is thus applied by integrating it with a smart retail store. It was found that the effective use of IoT data to double the effectiveness of customer segmentation, improve the effectiveness of targeted marketing, and optimize supply chain decisions. Such integration paved the way for the capability in monitoring the equipment in real-time, performing preventive maintenance, and even preventing promotional actions that affect customer experience and business profitability. However, the research also revealed some of the limitations such as privacy issues, integration issues, and issues of building an IT infrastructure that is scalable enough to contain the explosion of data that comes with IoT marketing intelligence; issues that speak of ethical concerns and good data management practices that must also underpin IoT marketing intelligence. The author in this paper [25] presents the system design that combines domain knowledge for improving EDA process using the VizML framework, based on guided analytics. The approach entails capturing EDA sessions of the domain experts through the storing of their interactions and context into the interaction and context storage system. These stored interactions are then used to suggest sequences of analysis steps for domain newbies, who are always in one way the direct consumer of the findings performing in a similar dataset and guiding them to useful discoveries. The system uses the MLP machine learning model to sort out interaction sequences depending on the predictive proficiency to make valuable conclusions. A prototype was defined, and its utility was tested with temperature time series data from Brazil indicating that the system can indeed recommend thought-provoking interaction sequences. The results indicate research ideas regarding reduced analysis time and enhanced quality of the outcome for the application of the presented approach when expert knowledge is included in EDA, as well as further developments in various complicated fields and in use and transfer of expertise from one domain to another.
In ref. [26], the authors use the RFM (recency, frequency, monetary) model with the help of the K-means clustering technique to classify customers according to their buying habits. The researchers use data obtained from an e-commerce platform in the UK that included transactions that occurred between the years 2010 and 2011 and clean the data by deleting any incomplete information. Using the Elbow Method, they decide on the right number of clusters to classify the customers into four groups depending on their revenue. The segmentation helps a company to find better and new clients and come up with proper marketing approaches. The result coming from the assessment of the quality of clustering based on the Silhouette Index is 0.442, which is quite satisfactory in terms of internal cluster compactness and inter-cluster spacing. Through the research study, audiences can appreciate the roles of using data analytics in customizing and optimizing business strategies and customer relations. The authors of [27] employed both machine learning (ML) techniques and the recency, frequency, and monetary (RFM) model to improve customer segmentation and churn prediction from transactional data. The work employs datasets from online retail and measures of data distribution by preprocessing data using Box–Cox transformation. Whereas K-means clustering and DBSCAN are compared by the authors to cluster the customers into six more groups, which reveal different consumer behavior. The results show that the segmentation based on these ML techniques is a more useful and systematic technique for the classification of customers, which helps the business to implement the marketing strategies objectively. The results of the study show the benefits of separate non-ML RFM analysis and the subsequent integration of resulting feeds with the aid of ML algorithms to increase the precision of the prediction of a customer’s actions and, consequently, to decrease churn rate.
3. Proposed Approach
3.1. Dataset Description and Feature Engineering
In the Retail Sales Dataset (https://www.kaggle.com/datasets/mohammadtalib786/retail-sales-dataset/data, accessed on 12 December 2024), there is a detailed real-life simulation of the retail industry, and the details of the numerous transactions in commodities and customers have been well outlined; it provides many ideas on the purchase power, the selected customer group, and even the financial power of the outlets. The dataset does not include demographic attributes such as age or income level, which could enhance model accuracy by providing deeper customer insights. Future research should incorporate demographic variables to improve the granularity of customer segmentation. For this reason, the following are attributes that are part of this dataset: Transaction ID, date, customer id, gender, age, product category, quantity, price per unit, and total amount are some of the most crucial attributes that offer a baseline for analyzing customer behavior, sales success, and trends in the retail sector. A typical record contains a transaction ID number assigned to each sale, which can be easily tracked and referenced. Single sales can be tracked and differentiated from each other because they have a unique transaction ID. The date is also logged to see effects such as the effect of seasonality, peak shopping period, or effectiveness of certain marketing methods. The product ID associates each sale with a customer and can be used to track specific customer spending, patterns, and behavioral pattern. This is particularly useful when creating customer segments for analysis and creating models such as the RFM model, which segments customers by their recency, frequency, and monetary value. Other related features like gender and age offer a more added breakdown; firms use these to deliver customized communication, products, or promotions, to target audiences. For example, gender analysis can provide information about spending habits, product preferences, and responses to certain marketing promotions; age analysis, on the other hand, can show the distribution pattern of the brands by age segments, which in turn explain the lifestyle factors that have an influence on buying decisions. The product category attribute is a key component, as it provides insights concerning the product level performance per each segment, and which categories, including electronics, clothing or beauty, perform well among the chosen buckets. This insight is useful for understanding the fluctuations that are required to be made in the inventory, as well as the demand patterns in different seasons, to decide on the location of the products and promotional strategies. The value bought, accompanied by the unit price, affects purchasing patterns, basket size, and price elasticity. For example, organizations can detect clients who are seasonal or those who are price-sensitive to ensure they gain benefit from such adjustments in ways that stock piling strategies can be most beneficial.
In the last level, the total amount retains the addends of quantity and unit price and expresses the entire value, which a customer brings to drive the financial outcome of the business. This attribute is particularly valuable for viewing revenue, evaluating the effectiveness of distinct goods or groups, and examining client lifetime worth. When the total amount is subdivided according to customer categories, companies can develop effective tactics and goals for increasing the frequency of consumers’ visits and, therefore, the average check. Since the Retail Sales Dataset has diverse information, using the resource is helpful for carrying out exploratory data analysis (EDA) and predicting conclusions based on the data. The dataset, therefore, lays good groundwork for the more complex analysis like sales forecasting, trend analysis, or even customer behavior prediction. Machine learning models help organizations estimate the likelihood of customers leaving and even generalize which products one should buy, how one should shop, and how marketing should be done. Also, its integration with RFM Analysis makes it easier for the business to segment its customers according to their transaction behaviors, and hence market to them and retain them accordingly. In conclusion, this dataset is beneficial for the political decision-makers for managing their retail, increasing clients’ engagement, and improving the retail’s financial outcomes.
3.2. Feature Engineering
During the feature engineering process, several more features were created, and the others were modified in order to make the input data more valuable and predictive. First, the new month column was obtained by extracting only the month from the date field for the frequency analysis of columns, perfect for recognizing seasonality, the monthly sales trend, or the impact of time-specified promotions or events. Furthermore, a new column, new customer IDs, was introduced, which separated the unique customer data between new and returning customers in relation to customer capture and chop behaviors. Additionally, one must note that the feature age was also presented in predefined age brackets, which made it easier to distinguish the purchasing tendencies according to different segments of consumers and, thus, stimulate the efficient keying up of appropriate marketing strategies. By further extending the conception of the product category, new fields were created, each of which is a binary value representing the user’s preferred product category: Electronics, Clothing, Beauty, and others. The transformation allowed analyzing the customers’ buying behaviors regarding categories of products. Finally, the gender feature was dichotomized into gender male and gender female to permit the occurrence of gender-specific buying behavior analysis down to the female gender. In terms of practical implications, these feature engineering steps gave a more elaborate and formal input array to be conducive to more substantive, far-reaching segmentation of the customers as well as enhanced analysis and decision-making processes in retailing.
3.3. Exploratory Data Analysis
During the exploratory data analysis (EDA), the dataset was analyzed broadly to identify trends or relationships that can prevail as a guide throughout the study. The first analysis conducted was to check out the sales trend over the year. This made it easy to see how the levels of sales changed over the period under consideration by plotting the total amount. This aggregation helped to determine customer spending patterns by which high and low periods can be defined, for example, during the holiday season or during a promotion. These trends are important for businesses to know how to adjust inventory, advertisements, and hiring forecasts accordingly. The next type was to make a frequency analysis of transactions for one year; the number of transactions was counted monthly. This analysis highlighted the number of transactions that occurred per time to further understanding of customer shopping trends. For instance, specific months grossed more sales than the others, perhaps reflecting on some marketing promotion or celebration. The collected information can then be utilized to better position the marketing campaigns as well as enhance user interactions during the time of low activity. Another factor that was considered while analyzing the research was the sales of the product categories for a given month. To a certain degree, by analyzing the number of books sold under each product category we were able to identify which categories were most popular during distinct months of the year. Thus, the monthly fluctuations as to the demand for Electronics, Clothing or Beauty were registered with some product categories showing higher demand in some months as compared to others, for instance Electronics in the fourth quarter. Such knowledge is useful in coordinating product publicity with periods of high demand and managing stocks exceptionally well.
The product categories purchased by age group were also analyzed, shedding light on the preferences of different customer segments. This analysis revealed that specific age groups favored certain product categories, which can be vital for segmenting customers and personalizing marketing efforts. For instance, younger customers may prefer Clothing and Beauty products, while older customers might show more interest in Electronics or other practical items. This segmentation allows businesses to tailor their product offerings to meet the specific needs of different age groups. Moreover, the general dispersion of age and gender in product categories was analyzed. With respect to the research objectives, this analysis offered a richer understanding of the ways in which the effects of age and gender on purchasing behavior varied by category. Recognizing the male and or female customers and their differences, for example, in recompose ages, the businesses will be in a better position to market their products and services. For instance, the product category might sell more among females in the age bracket of 18–34 but another might sell more among males in the same age bracket. Such information can be used in coming up with the right product, a perfect promotion, and often appealing and unique marketing campaigns. Last of all, based on the flow of money in and out during the year, the overall performance of the retail operation was evaluated in terms of its revenue. Since revenue changes were evaluated concerning time, this analysis showed periods of high or low revenue generation. Such information is crucial when considering the viability of a business and the ways to increase the income during the period of the lowest turnovers. When used in conjunction with transactional frequency and product type results, these figures enable businesses to formulate tactics to drive year-round profitability.
3.4. Regression Modeling
In this project, three different regression models were utilized to predict the total amount of sales transactions based on the features in the dataset. Here, the used algorithms are presented: MLP (Multi-Layer Perceptron) Regression, Ridge Regression, K-Nearest Neighbors (KNN) Regression. Algorithm 1 shows the utilized approach for the prediction. Specifically, each model was selected to address various forms of relationships in the data and compare the abilities and effectiveness of the models to the given task. The hyperparameters for the MLP Regressor were tuned using grid search cross-validation, optimizing for the lowest mean squared error. The learning rate, number of hidden layers, and activation function were adjusted iteratively. Ridge Regression used alpha tuning to control regularization, while the number of neighbors for KNN was chosen based on cross-validation performance. A sensitivity analysis was conducted to evaluate the effect of varying hyperparameters on model accuracy.
| Algorithm 1 Regressor Model for Predicting Total Amount |
|
3.4.1. MLP (Multi-Layer Perceptron) Regression
MLP Regression is a Sub Type of Neural Network or a type of ANN Model. This model has multiple layers of neurons, and every layer is capable of leaning the relation between input data and output data with the help of activation function; the prediction Equation is shown in Equation (1). There are good reasons to advocate for the use of MLP as the paradigm for learning in the data territory since it can model the complex non-linear associations that define the data terrain and can learn through multiple layers of features. In this specific project, MLP occurred and was applied to predict the total amount from the features such as age of products, product category, and price per unit. Hyperparameter tuning for MLP was performed using grid search, optimizing parameters such as hidden layer size, activation function, and learning rate. A single-layer MLP was chosen to balance model complexity and interpretability, ensuring generalizability while capturing non-linear relationships. In the architecture of the existing network inputs are one or two parameters: focal elements with an input layer, several hidden layers, of which activation functions used ReLU and used the output layer to calculate the percentage of the total sales. The training process in this model includes adjusting the weights and biases using backpropagation and gradient descent techniques, to find a small difference between the actual and estimated values. In this case, we used MLP regression because the method offers the possibility not only to estimate relationships between predictors and outcome variables but also to capture these relationships more effectively than simple methods.
where
- is the predicted output (Total Amount).
- W1 and W2 are the weight matrices for the first and second layers.
- b1 and b2 are the biases for the first and second layers.
- X is the input feature vector (e.g., age, product category, price per unit, etc.).
- σ is the activation function (e.g., ReLU or Sigmoid) applied to the output of the hidden layer.
3.4.2. Ridge Regression
Ridge Regression is a version of Linear Regression that addresses the problem of model complexity using L2 regularization of loss function. This helps to minimize overfitting particularly if the data we have has multicollinearity or if we have too many predictors. In Ridge Regression, the main aim is minimization of residual sum of squares but with an additional term of sum of squared value of coefficients. This penalty term pulls the coefficients towards zero, which makes the model less prone to overfitting because it is not ‘overfitting the noises’ in the data. In this project, Ridge Regression was employed to predict total amount task by training a linear model by adding a regularization parameter to minimize the model overfitting but at the same time, the model could generalize from the trained data. Equation (2) shows the predicted output calculation for a Ridge regressor. It is an ideal decision when the observational variables are related, and when there is a need to regulate the intricacy of the model.
where
- is the predicted output (total amount).
- X is the matrix of input features.
- β is the vector of coefficients (weights).
- ϵ is the error term.
3.4.3. K-Nearest Neighbors (KNN) Regression
The K-Nearest Neighbors (KNN) Regression model is one type of non-parametric model used for instance-based learning and is used to make predictions with the help of K nearest training data points available in the feature space. For regression tasks, KNN determines the value of the output for a data point through finding an average of the target values in the case of the ‘total amount’. In the number of neighbors, K is one of the important hyperparameters because the choice of K impacts the ability of the model to capture neighbors’ patterns; an example is shown in Equation (3). A smaller value of K can lead to a mechanism whereby the resulting model is very sensitive to noise and a larger value of K smooths the prediction so much that the model is not very sensitive to small changes. KNN Regression does not make any assumption about the nature and degree of the dependence of the features X on the target variable Y, meaning that the model is well scaled when there are complex interactions between the features and the target variable. In this work, KNN was used to predict total amount, based on the computations of samples of the K nearest customer or transaction identified by their feature values and calculating their average value for total amount, where KNN for regression was proved to be very effective without sophisticated computation.
where
- is the predicted target value (total amount) for the i-th test point.
- NK(i) is the set of the **K** nearest neighbors of the i-th test point.
- yj is the target value (Total Amount) of the j-th neighbor.
- The sum is taken over the **K** nearest neighbors of i.
In all of these MLP, Ridge, and KNN were used on the given dataset to understand the relationship between the features and the target sales in three different ways of approach. MLP provided a rich source of differential architecture to identify issues related to this specific retail sales forecasting problem; Ridge provided a simple and effective testing framework, which could also be applied to estimate. Lastly, KNN offered an orthogonal testing approach to characterize the variability of a given method.
MLP was selected for its ability to capture non-linear relationships in sales data. Ridge Regression was used due to its robustness in handling multicollinearity. KNN was included as a non-parametric method that can adapt to local patterns in data. While XGBoost and Decision Trees are strong alternatives, their tendency to overfit small datasets and higher computational requirements made them less suitable for this study. Future work may explore these models in a comparative analysis.
3.5. RFM Customer Segmentation
Recency, frequency, and monetary (RFM) analysis is a useful framework widely applied to customer segmentation by purchase behavior. Since it can put customers into various categories, it enables the formulation of better marketing niches. RFM analysis also helps businesses understand just how loyal or active customers are based on when they last shopped, how often they shop, and how much they spend each time. Frequency is the number of times a customer has made a purchase, and recency is the time between the most recent transaction and the current point in time. This index helps businesses to determine clients who are currently interacting with the brand and are hence more liable to have positive responsiveness to marketing by the business. The idea is simple: users who bought their goods recently are likely to purchase others shortly after that. For instance, a customer who made a purchase in the last 30 days is considered active; a customer who did not make a purchase in more than a year may be considered a churn risk. As such, recency can be used as a fall-out predictor for the level of customer engagement. Figure 1 shows the distribution of RFm scores for the current dataset. Frequency concerns the number of times a customer makes a purchase in a time. This metric is very important when assessing the level of commitment by a customer towards the brand. Frequency of exposure is known to cause brand awareness and brand recall leading to high brand loyalty. For instance, a customer who has purchased a product weekly should be considered more engaged than a customer who only purchases a product yearly. By sorting out its purchase pattern, the business obtains insights into which of its clientele are more loyal or which customers need more attention and possibly incentives to make them purchase more frequently. Monetary means the total amount of spending that a customer undertakes at a particular period. This metric helps businesses in singling out or pinpointing those customers most valuable and those that generate the highest revenue. For instance, a customer who makes infrequent purchases but gives a substantial figure while making the purchase would still be considered valuable. The analysis of the monetary aspect is essential for defining “whales”: the customers, who bring a high percentage of total sales but are, perhaps, not so frequent shoppers. This information is helpful for identifying the most lucrative customers and offering them exclusive or match offers with a view to exploiting the high revenues.
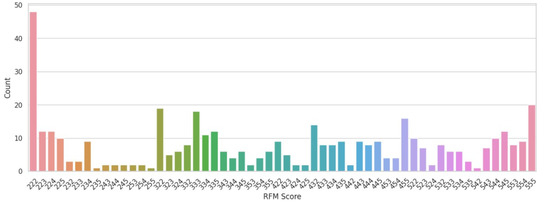
Figure 1.
Distribution of RFM scores.
To do RFM analysis, the businesses will first determine the RFM ratios for all customers. Recency, frequency, and monetary are all scored on the behavior of the customer, often on a 5-point scale where the best is scored as 5 (in terms of the most recent purchase, the most frequent, and the highest expenditure). For instance, recency would assign a high score to a customer who shopped one week ago, and a low score to a customer who has not shopped for more than a year. Both frequency and monetary are computed in the same manner, and a score related to the customer is provided in each of these categories. After the use of the RFM model to assign scores to customers, the next step is to segment the customer according to their behavior patterns. Cluster analysis techniques, for instance K-means or hierarchical clustering, are normally applied to segment customers. The outcome is one group with common purchase behavior of customers being grouped. For example, broad customer segments could include ‘champion’ customers, who are high scoring across all dimensions while ‘hibernating’ customers can be defined as customers with low scores across all dimensions. What these clusters mean is that it is possible for a business to seize different customer segments that would be defined by the clusters believed to be present in a specific market domain. Champions are those customers who frequently visit the site, those that are most recent buyers, and those who frequently spend more. Loyal customers should always be given incentives such as loyalty cards, free coupons, and quick access to new products on the market. Loyal customers are those who frequently purchase but have not made a purchase recently or may not have made a big order. Introducing individual offers or a loyalty program might allow such customers to remain ‘highly active’. Lapsed are those customers who were once heavy users but are generally inactive. Offers or campaigns appealing to their attention or recall purchasing and reminders of placed orders should assist in bringing such consumers back. The last one, the hibernating customers category, is solved by customers who have not engaged with the brand’s efforts for a while. These customers are inactive, but some of them would find a reason to return if a discount or some special content were to be waiting for them.
4. Results and Discussion
4.1. EDA Insights
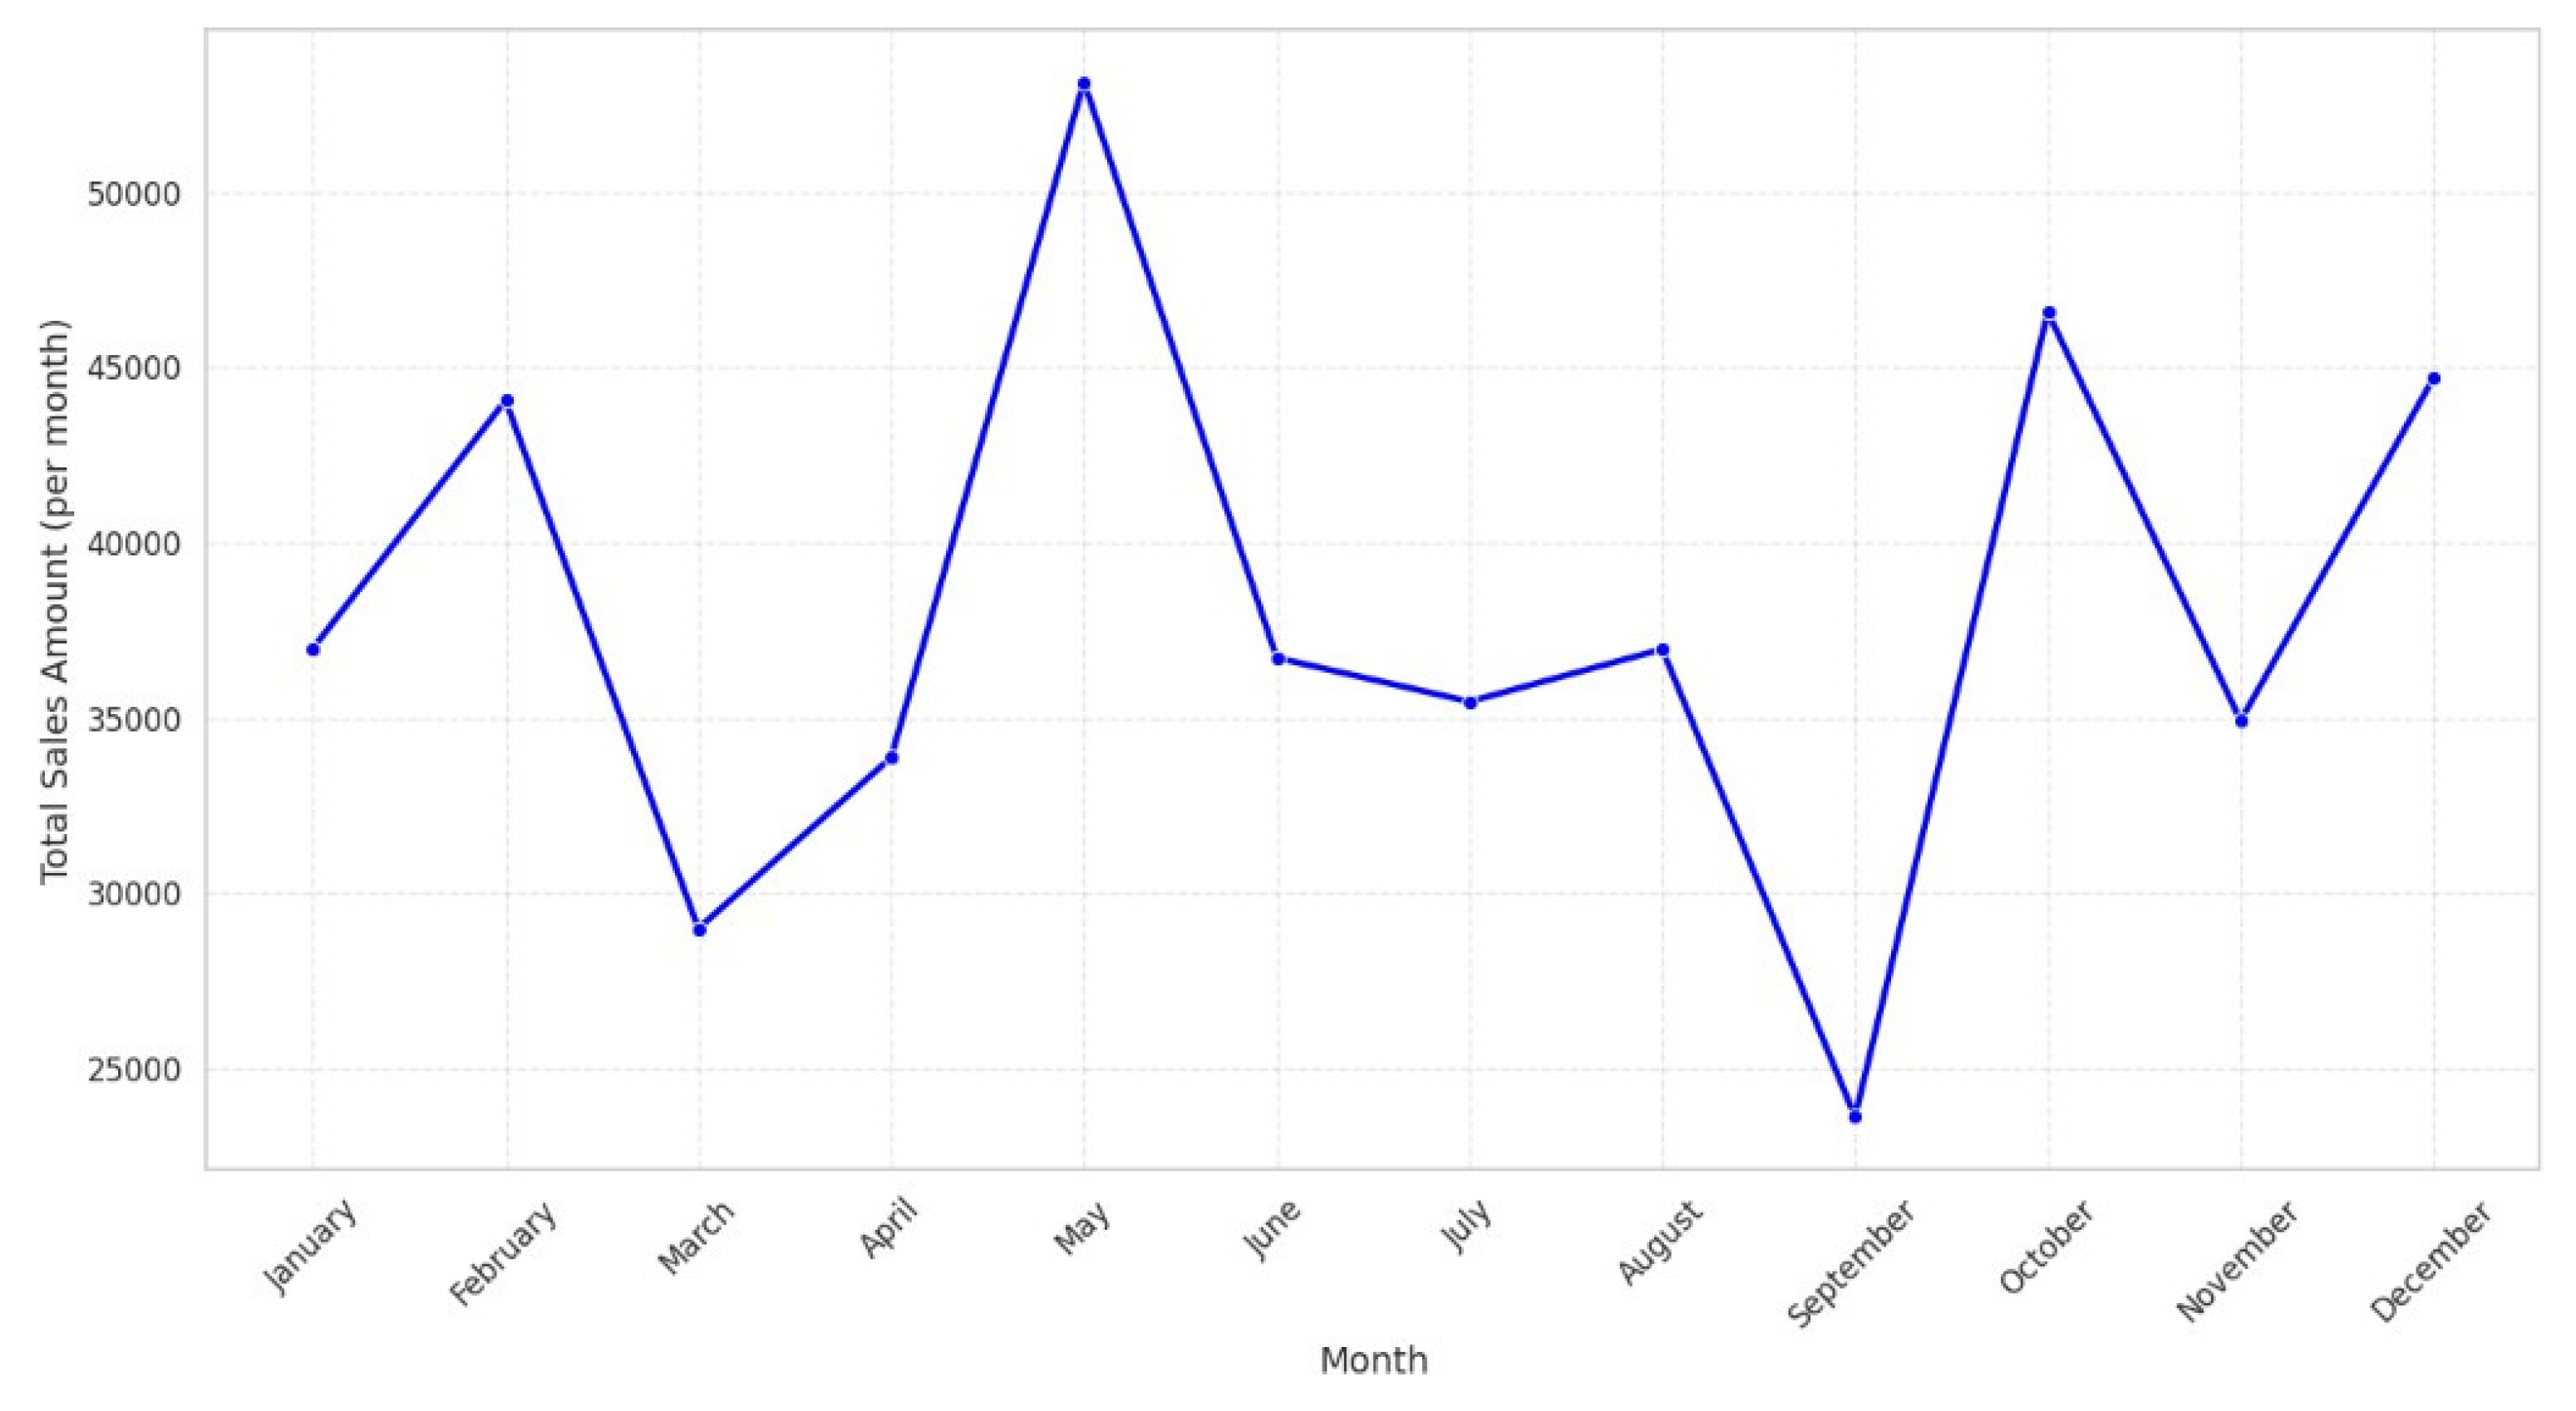
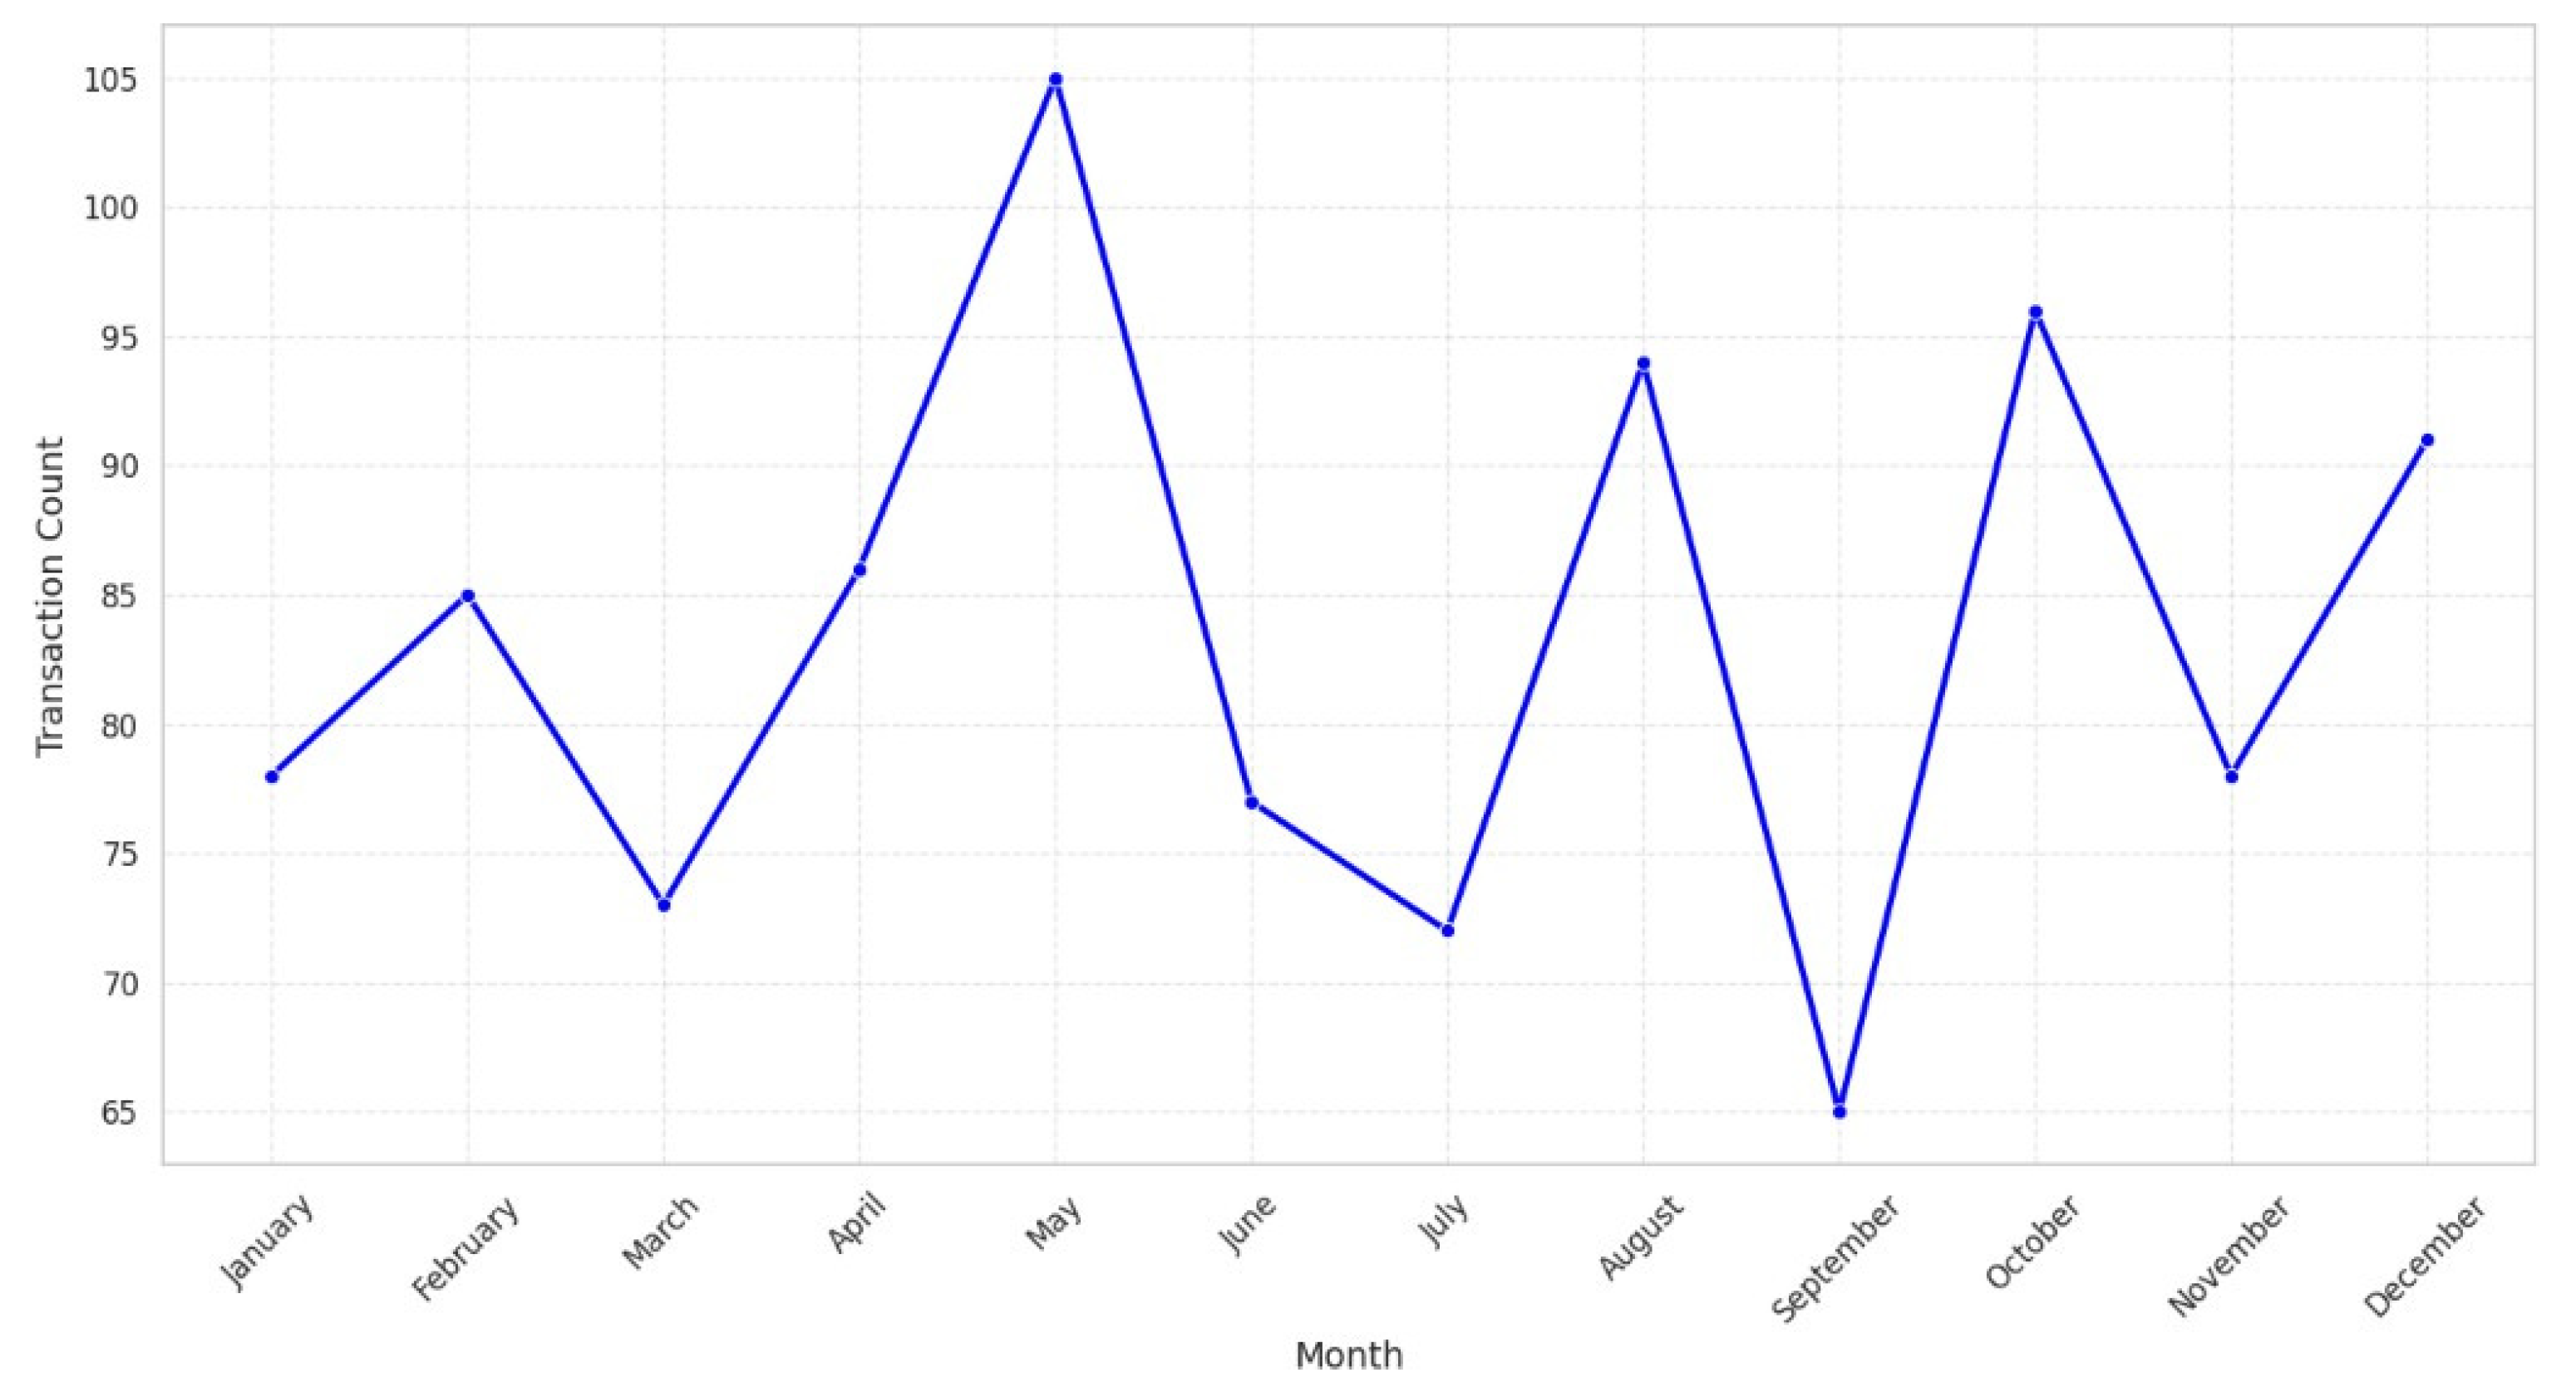
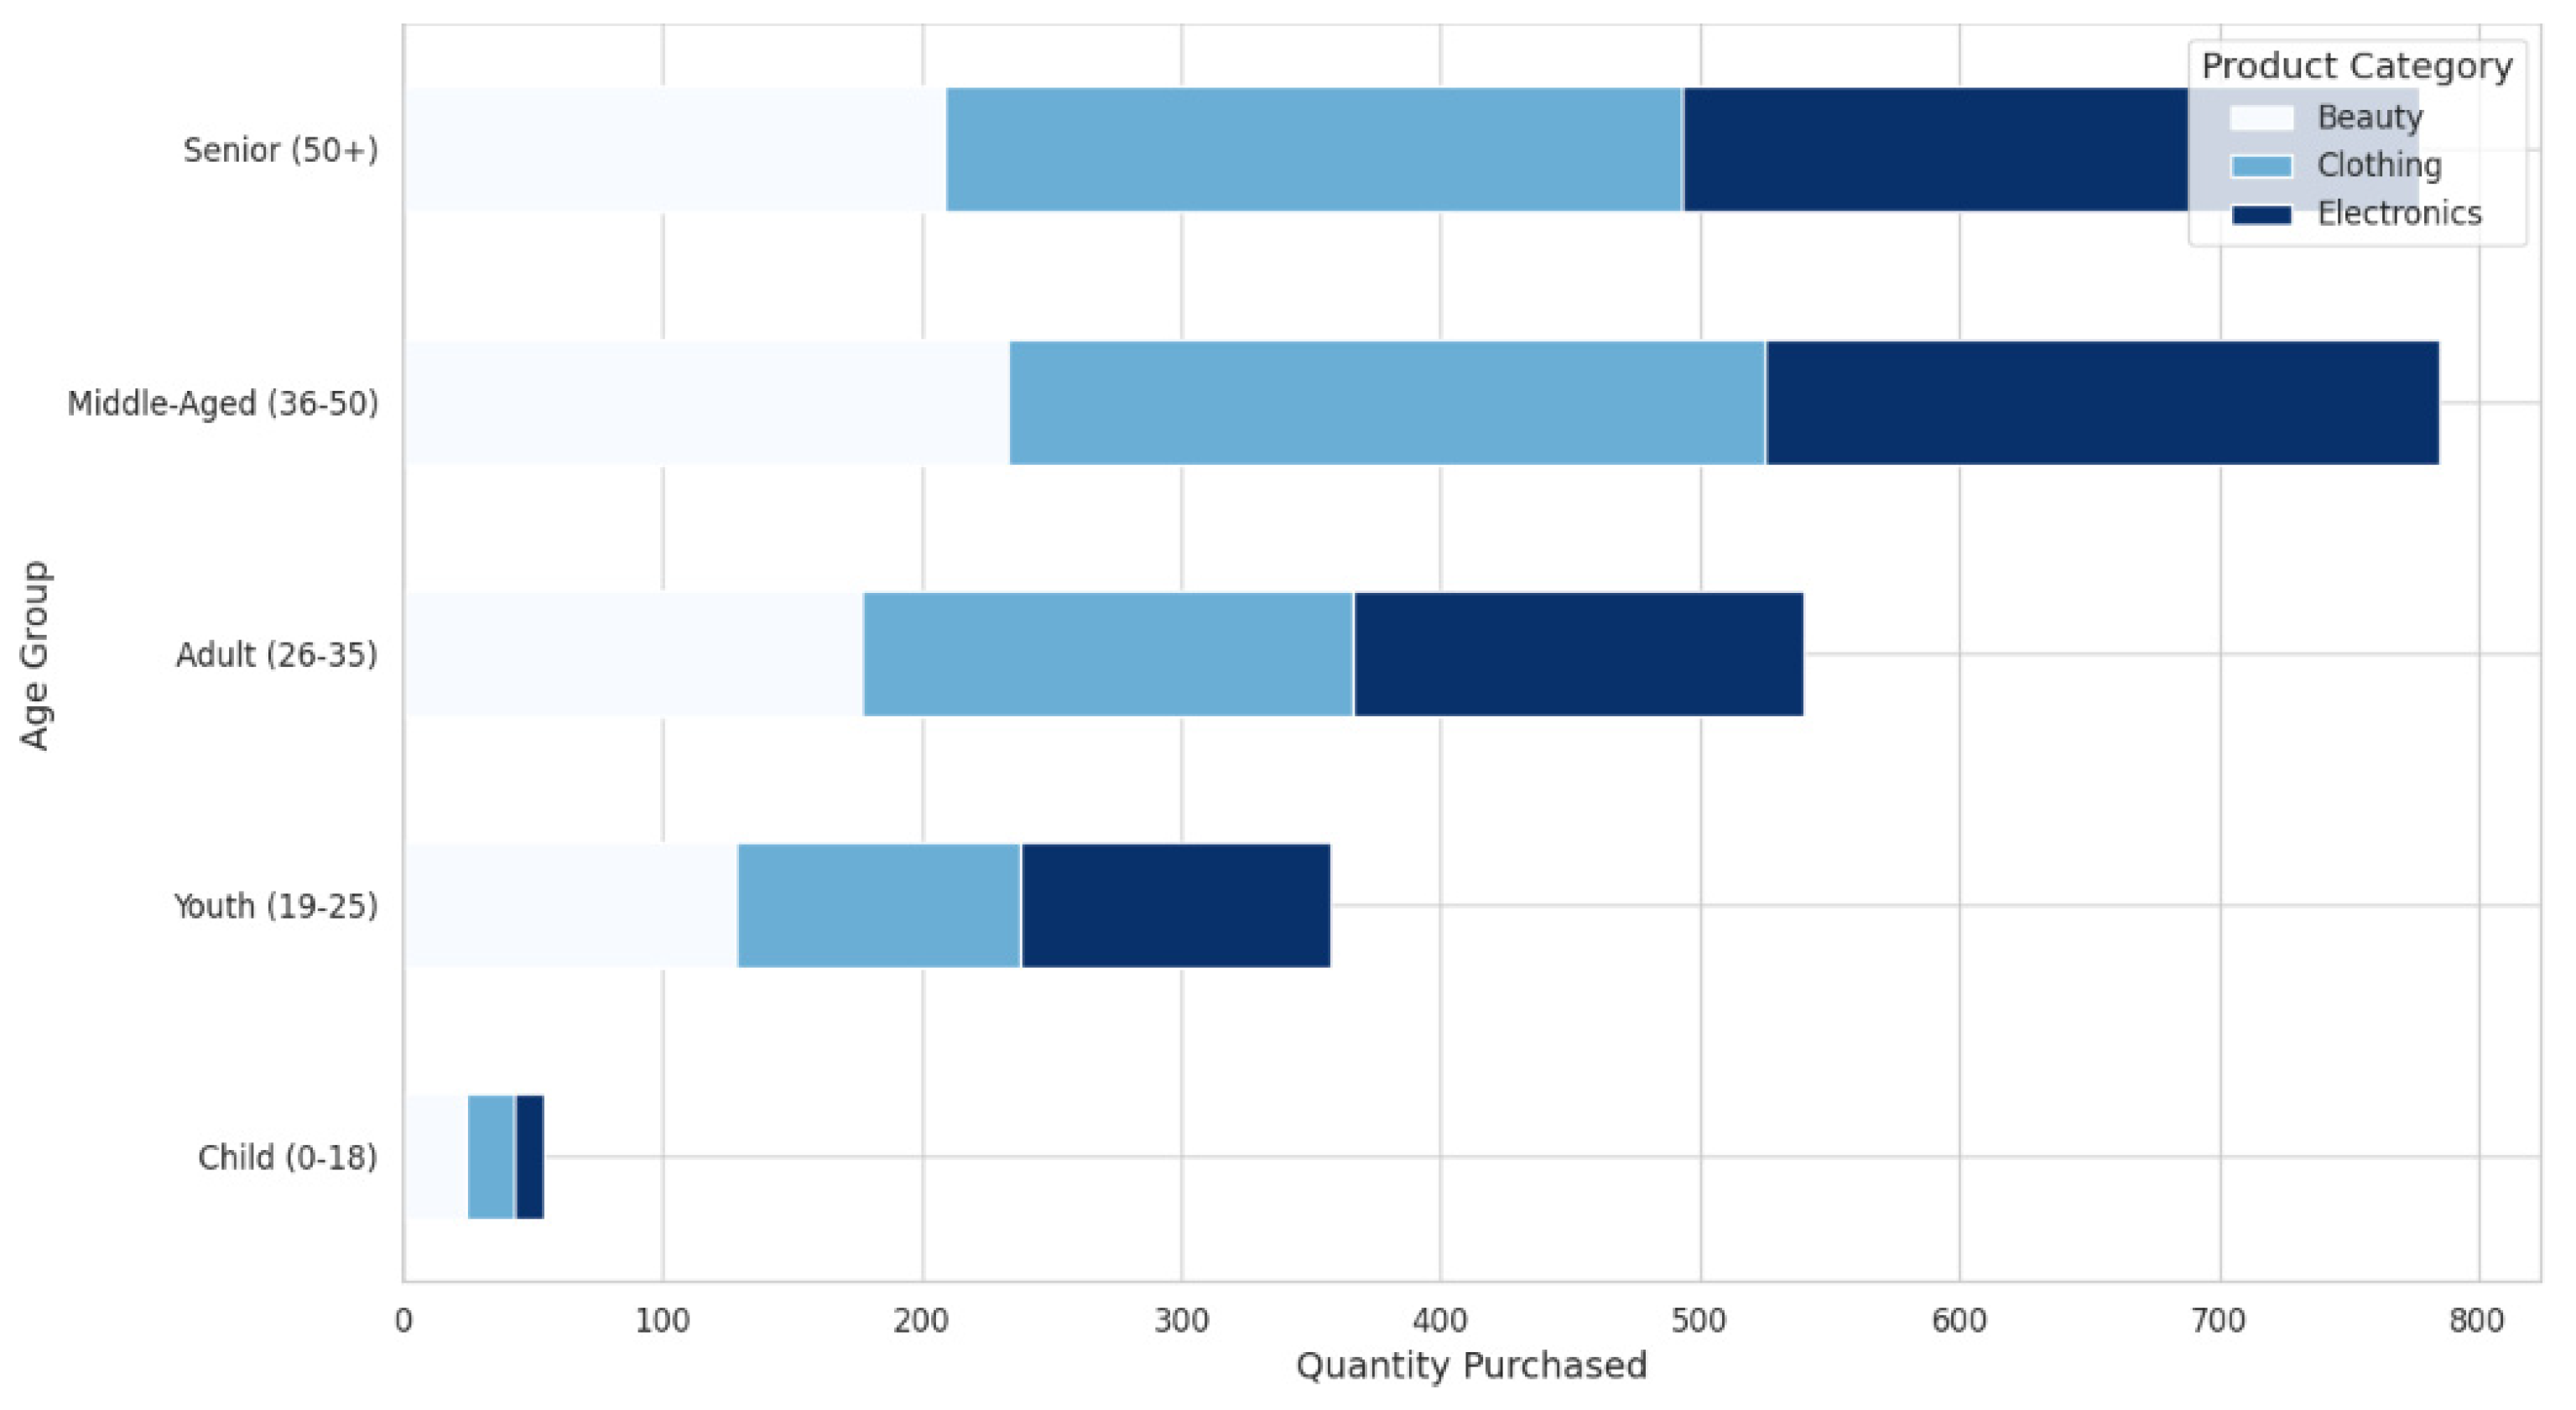
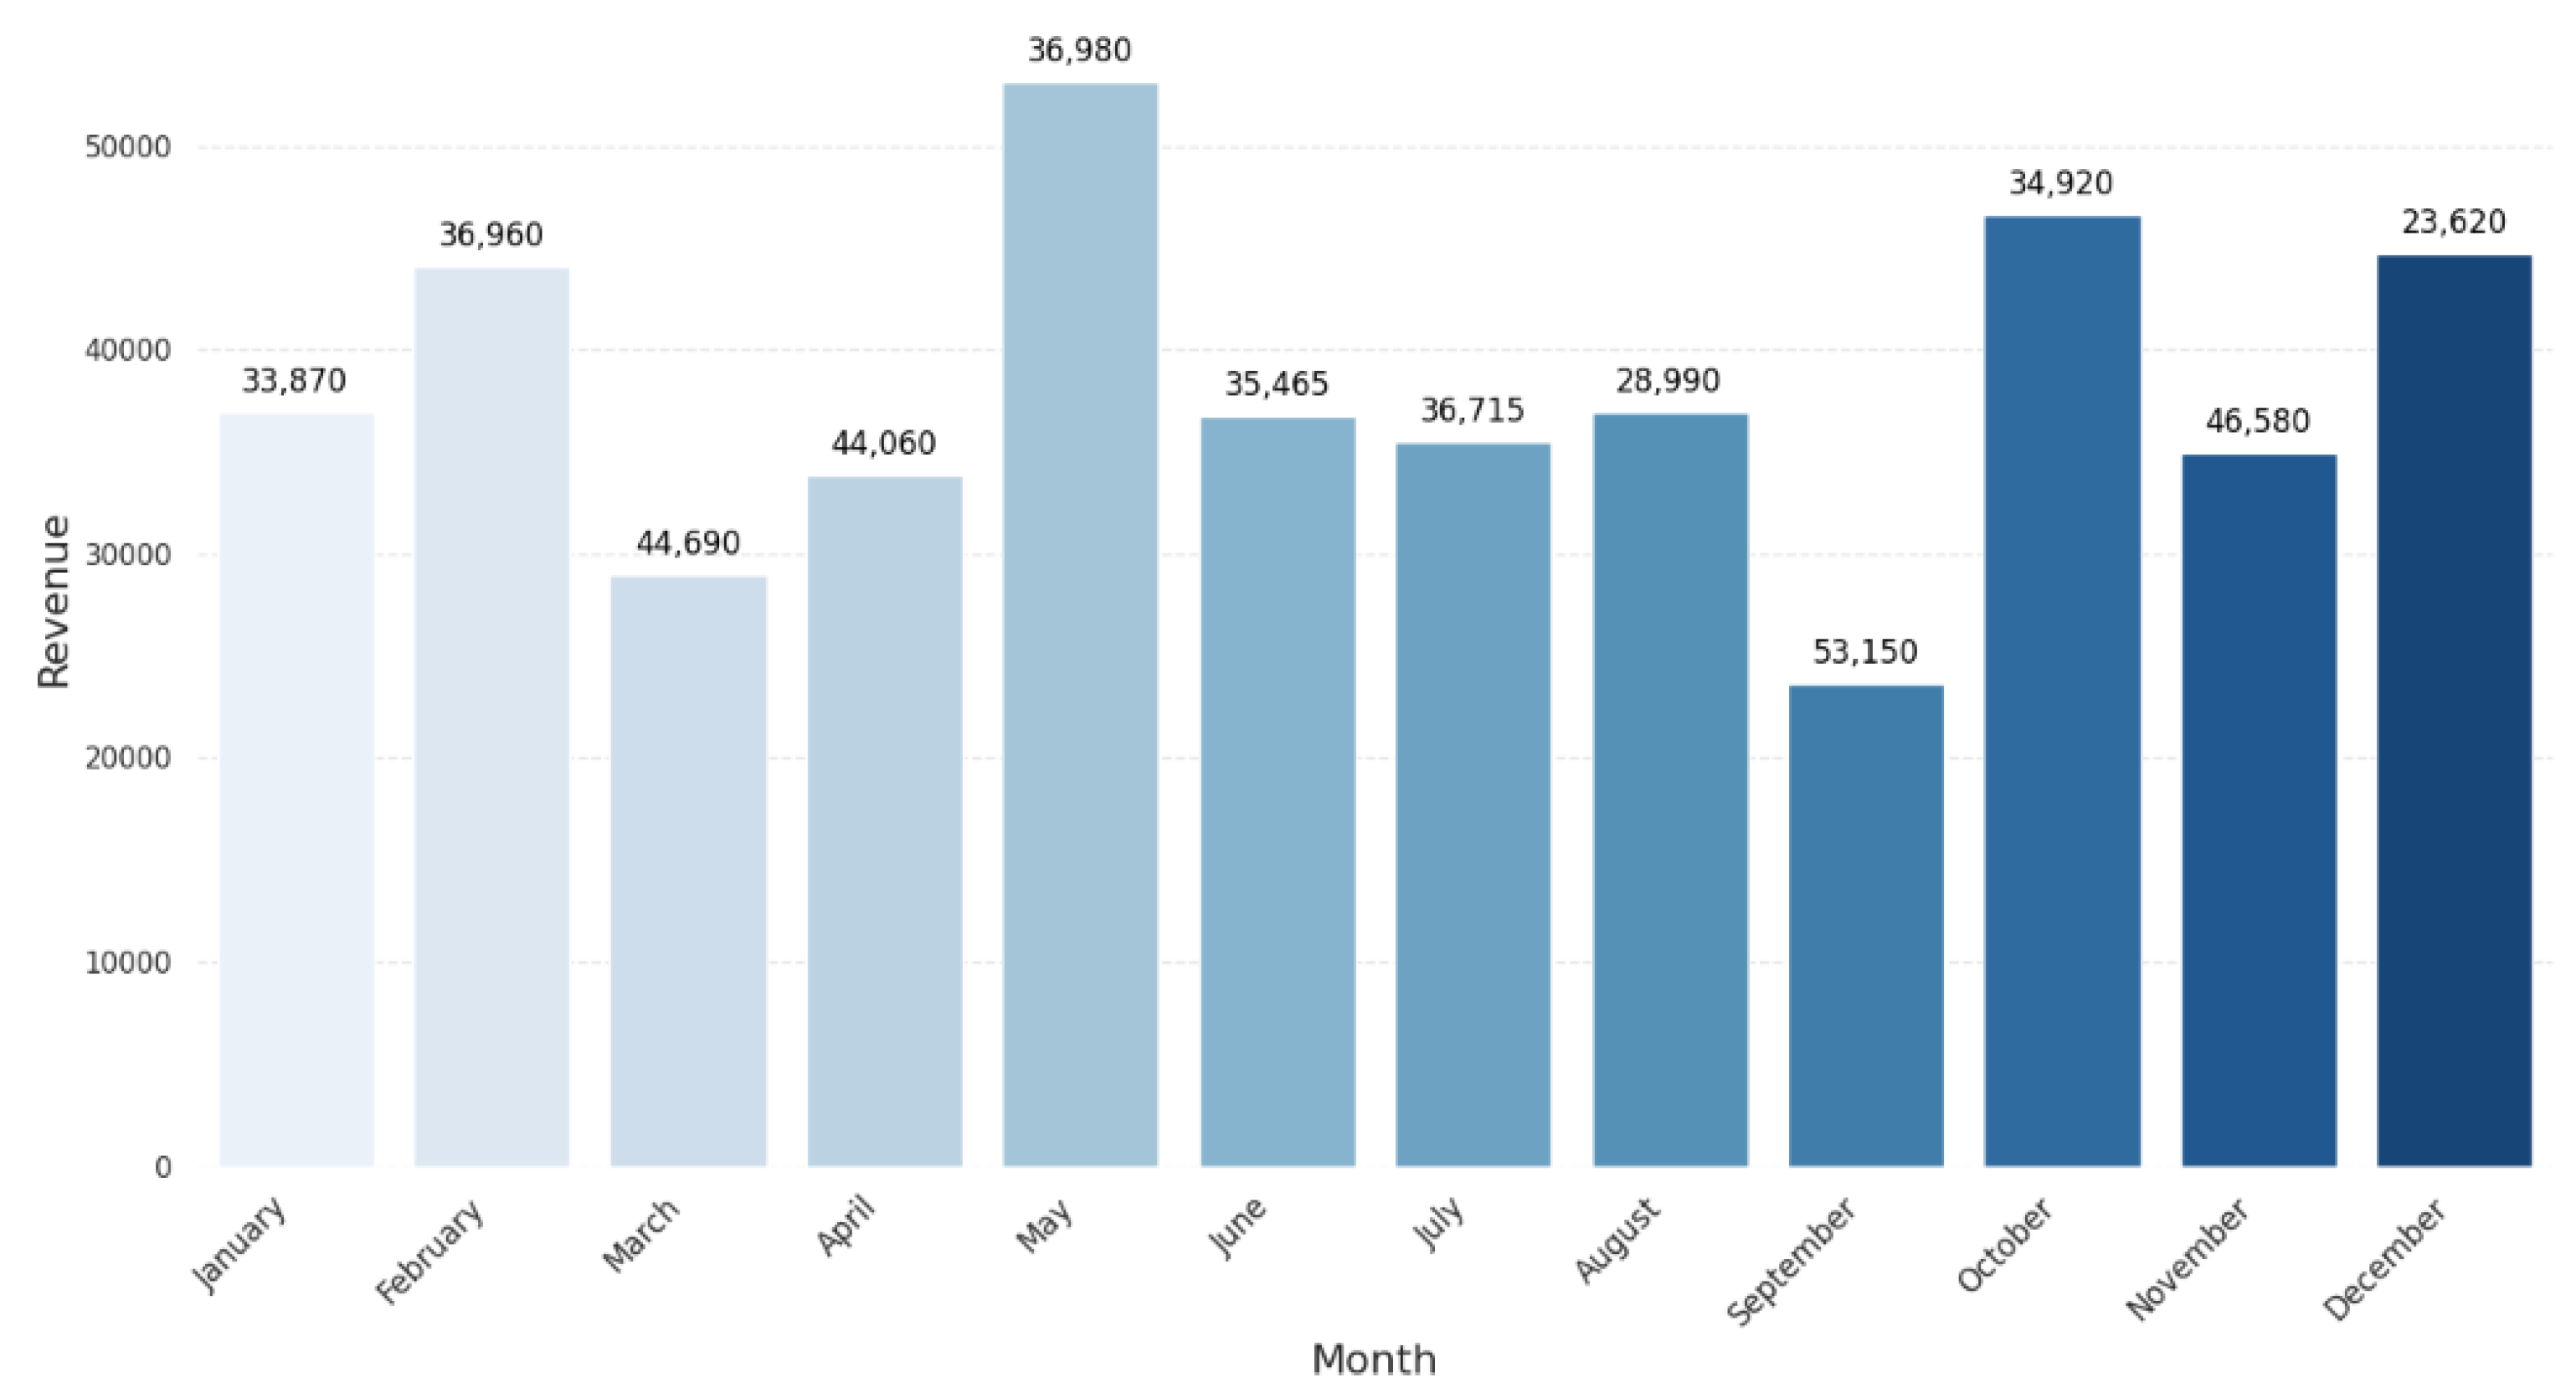
The data have shown the following trends after the exploratory data analysis (EDA) of the retail sales data. First, the breakdown of the sales data by months reveals some ups and downs, which may be related to some particular events and occasions, as seen in Figure 2. These trends are useful for knowing when the business sees spikes and dips in revenue, which helps inventory and marketing. Also, using the transaction frequency by the year shown in Figure 3, we can identify how the number of purchases is realized in the year, and this depicts how there is a realization of concentrated buying month. In relation to sales, products within different categories display different trends per month, with categories such as Electronics and Beauty showing preference in certain months due to end consumer seasonal preferences and occasions that can be seen in Figure 4. If these distributions of age and gender across product categories are examined, it will be understood that a certain demographic will ideally gravitate towards a specific product as can be seen in Figure 5 and Figure 6. In addition, the evaluation of the revenues for the different months of the year shown in Figure 7 shows that there are some months that are more profitable than others and that such information is useful when it comes to designing promotional campaigns, sales, and specials.
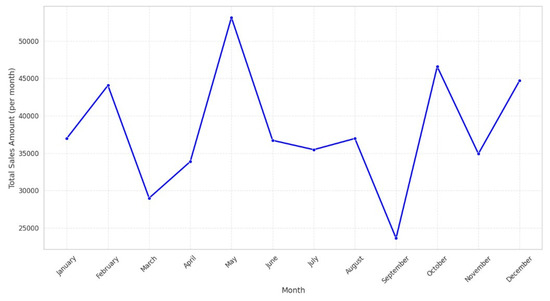
Figure 2.
Sales trends by month.

Figure 3.
Transaction frequency by month.
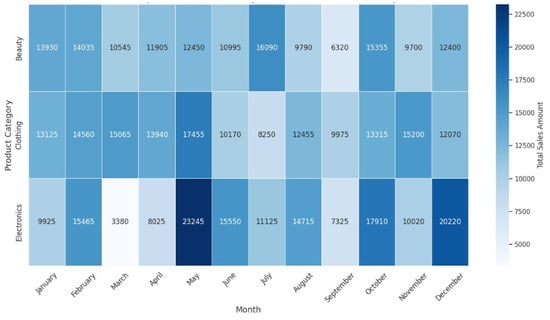
Figure 4.
Sales of product categories per month.
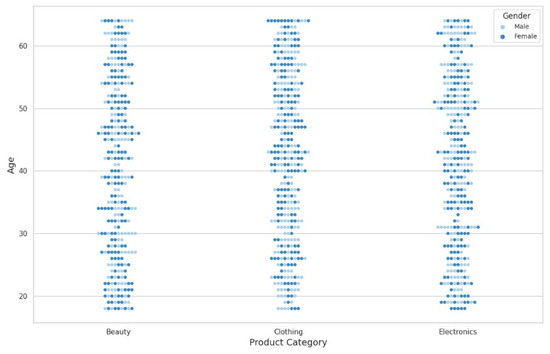
Figure 5.
Distribution of age and gender across product categories.

Figure 6.
Product categories purchased by age group.
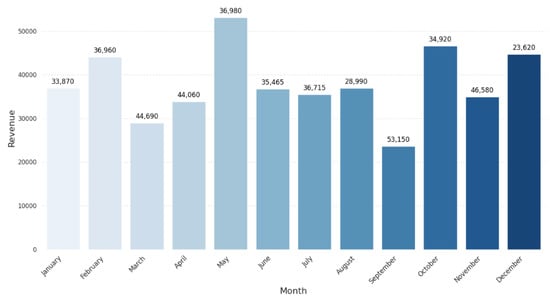
Figure 7.
Monthly revenue trends.
4.2. Regression Model Results
An evaluation of the three regression models that have been built, which includes MLP Regressor, Ridge Regressor, and KNN Regressor was performed using MSE, RMSE, and R2 Score which are global metrics commonly used to measure the precision of models. Traditional forecasting methods like ARIMA and deep learning models such as LSTMs were not included due to their higher computational cost and domain-specific tuning requirements. Future work could compare these methods to evaluate their trade-offs in retail analytics. Out of the three models’ medium long rule, the MLP Regressor performed better with an MSE of 17,622.20, RMSE of 132.75, and a highest R2 of 0.9398. These results suggest that MLP Regressor’s accuracy is extremely high for sales prediction and points to its abilities in capturing maximal differences between input and output data; therefore, it seems that the MLP Regressor models feature sales dependencies successfully. Table 1 compares the results of these models.

Table 1.
Regression model performance metrics.
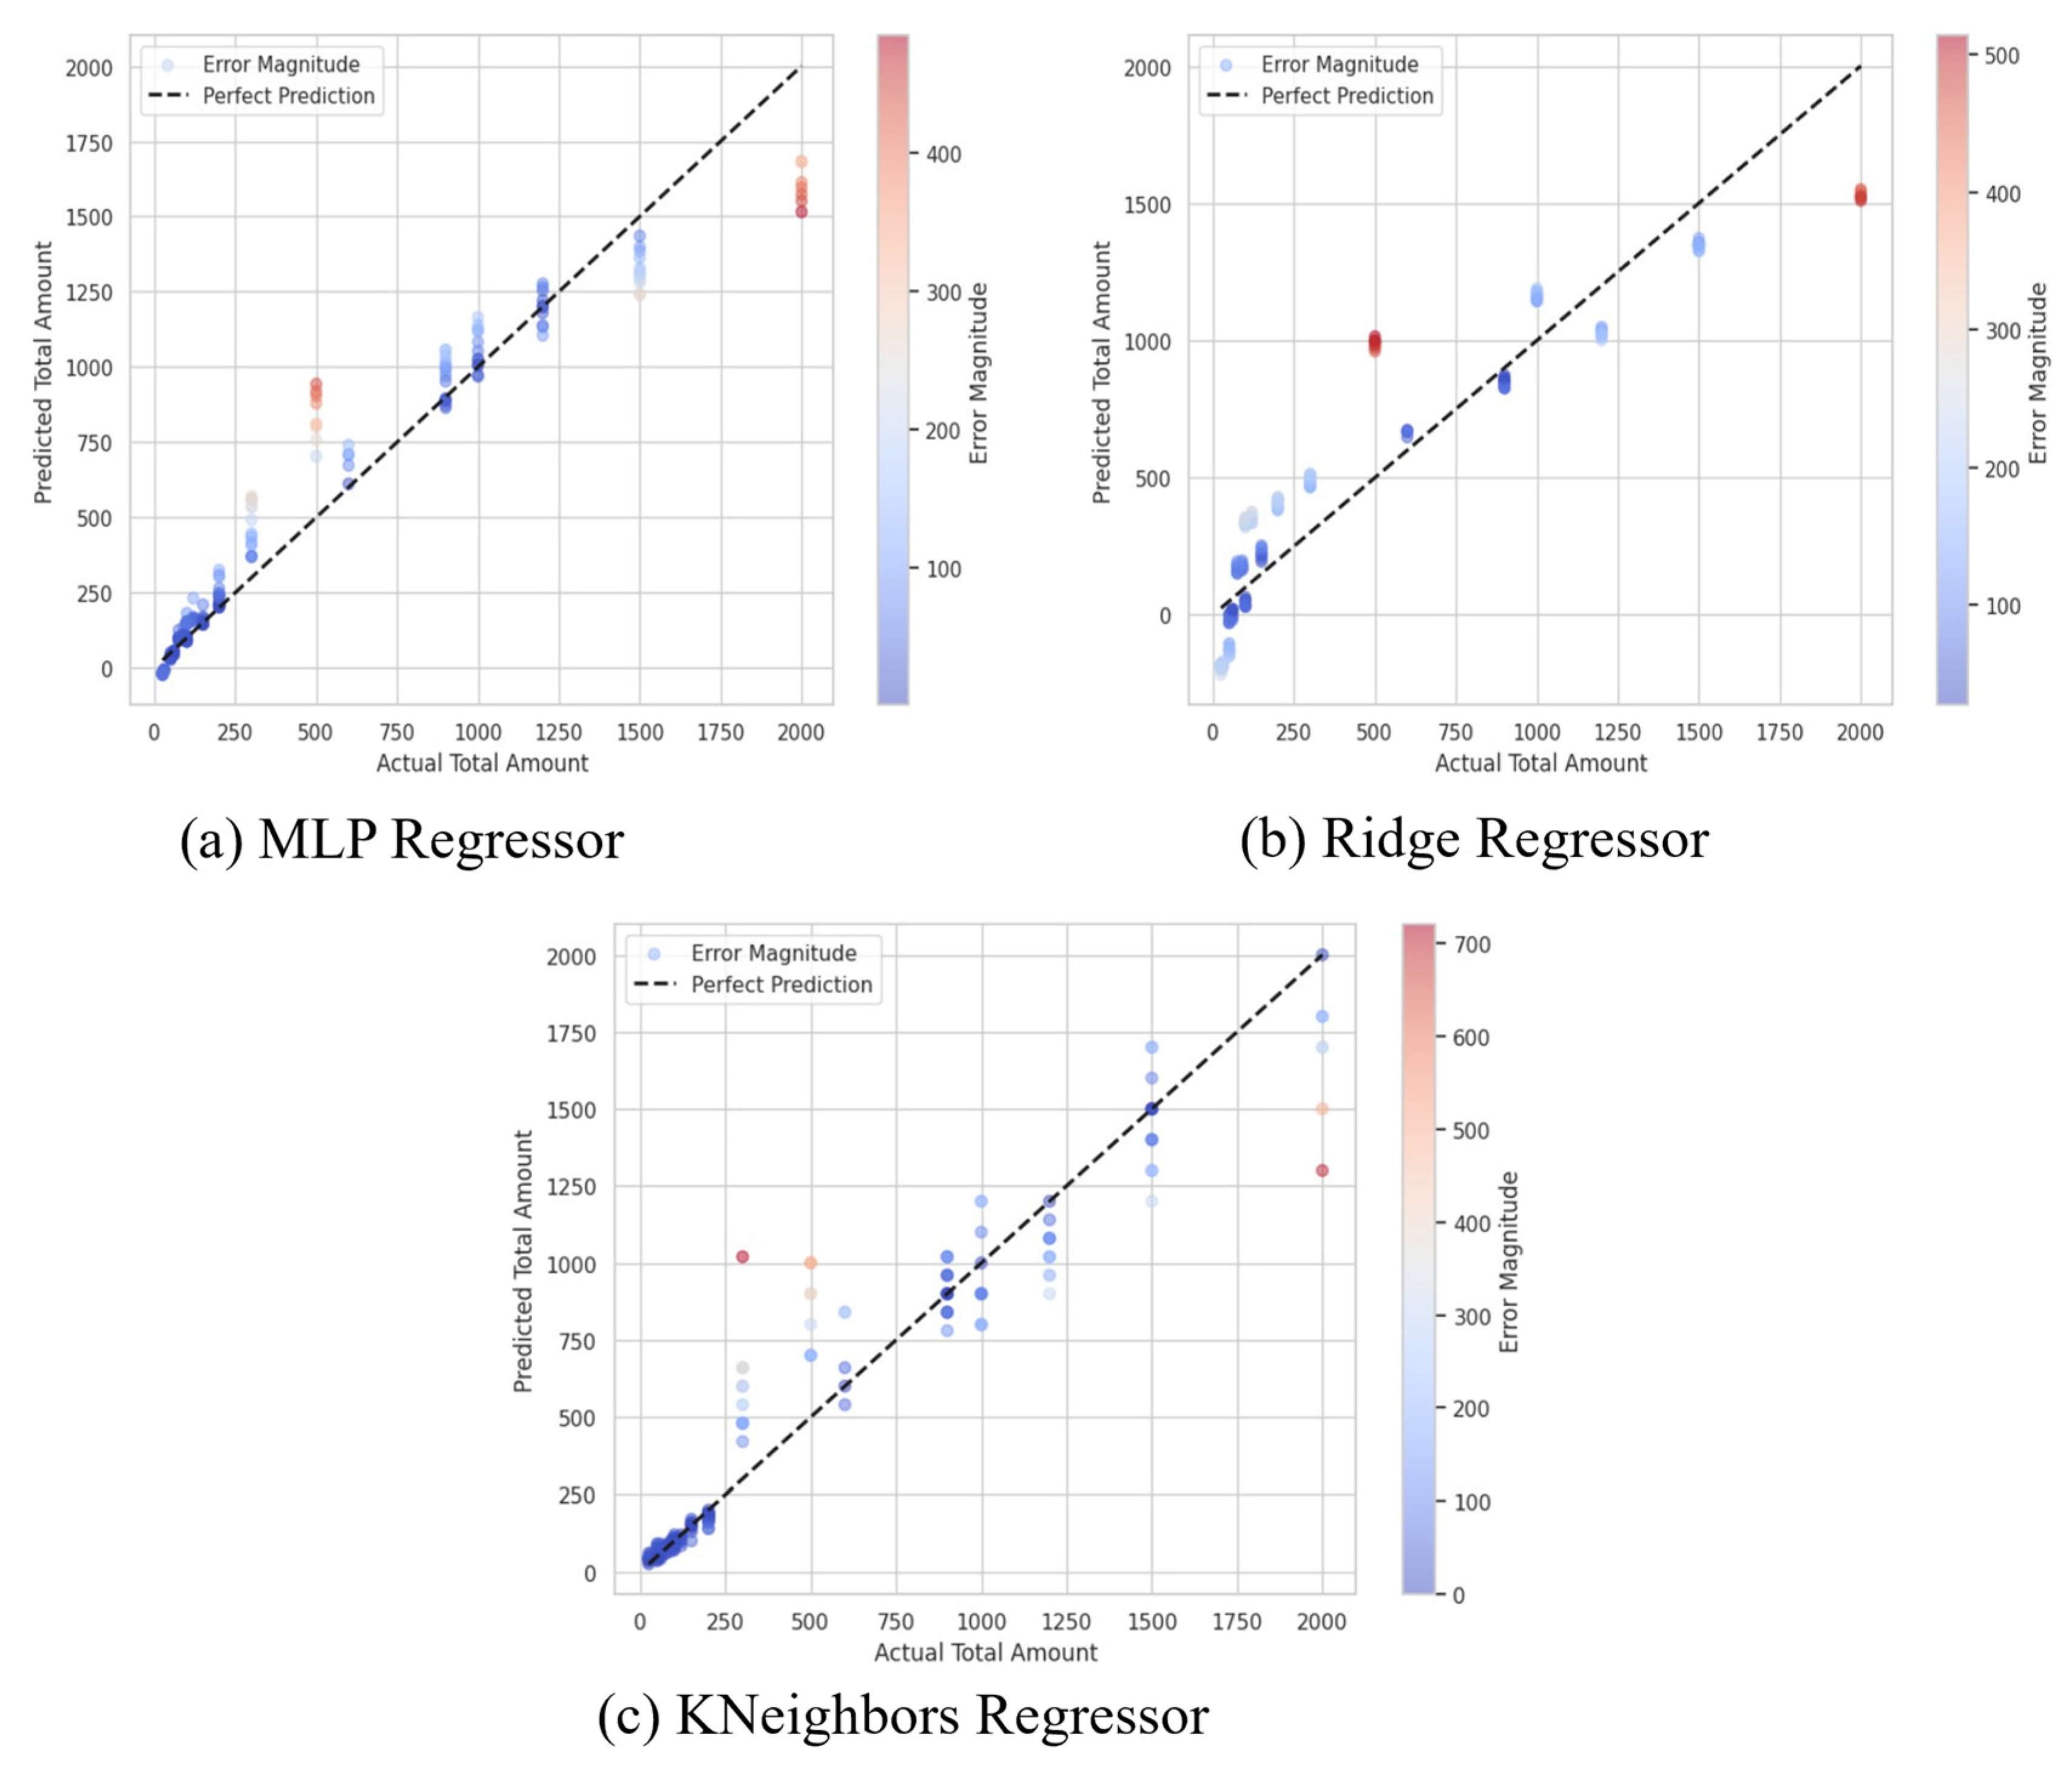
On the other hand, the Ridge Regressor also provided a reasonably good result but was less accurate compared to the MLP model. It predicted an MSE of 41,878.87, RMSE of 204.64, and R2 of 0.8569. These metrics indicate that although regularization technique in Ridge correctly solves the overfitting problem the model is not as suitable to capture the data complexity as compared with the flexible MLP Regressor. The KNN Regressor had an MSE of 23,575.34, an RMSE of 153.54 and an R2 of 0.9195. Although KNN had a better performance than Ridge, it is still behind the MLP Regressor at the accuracy front. Despite exhibiting acceptable performances for classification, the time efficiency and effectiveness of KNN can be a problem because it can require larger time space for computation as the number of training samples increases, and the amount of time required increases even if the dimension of the data increases little by little; there are conditions of its hyperparameters that can affect the generality of KNN in expanding the data analysis space, including features such as hyperparameters and the curse of dimensionality. The graphs of the model’s prediction are shown in Figure 8.
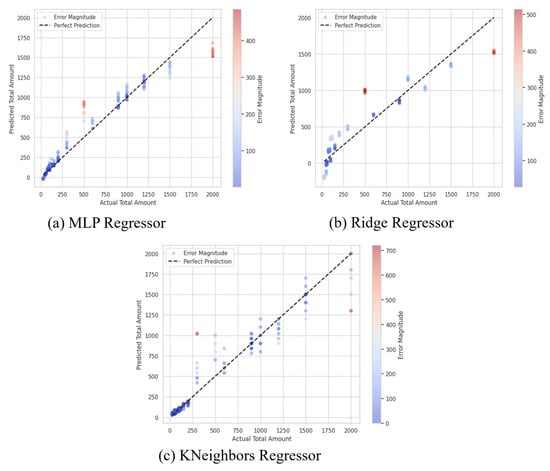
Figure 8.
Regressor model results.
In general, the higher R2 coefficient of the MLP Regressor proves that this model provides a better way of capturing the interactions between features and sales since it may contain non-lineal connections rather than Ridge and KNN. These outcomes also support the necessity of choosing the right model for prediction tasks and stress that with ever-more complicated data, as is the case of the here analyzed retail data sales data, there are more enhanced models like MLP. The MLP model, with its ability to learn complex patterns, is particularly useful in dynamic retail environments where demand is influenced by multiple factors. However, its computational cost and need for extensive tuning may limit its applicability in real-time systems. Simpler models like Ridge Regression may be preferable for quick, interpretable insights.
4.3. RFM Analysis Findings
The RFM analysis was quite helpful in understanding the behavior of customers at different levels where the RFM values were used to segment the customers. The decision on the choice of clusters was taken by the K-Means clustering algorithm, which grouped the customers into four key categories as shown in Figure 9, the description of which can be used to design effective marketing campaigns. Our RFM segmentation findings align existing literature, identifying similar customer groups such as ‘champions’, ‘at-risk’, and ‘hibernating’ customers. These results support prior research that highlights the effectiveness of RFM in predicting customer retention and spending behavior. However, differences in purchasing trends and spending habits observed in our dataset indicate that segmentation models may require industry-specific adjustments. To evaluate K-Means clustering, we computed the Silhouette Score (0.442), indicating moderate cluster separation. Future work could explore alternative clustering techniques for improved segmentation validity.
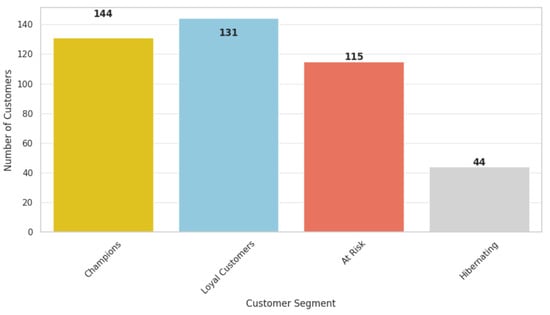
Figure 9.
Customer segmentation.
The first segment is made up of 144 CLV customers, which have been recently replenished, and that recency = 49.57; the Fre = 4.73. This kind of customer also exhibits a high-spend profile: monetary 3001.59. As a way of increasing and preserving this loyalty, businesses can offer incentives such as loyalty cards, special offers, and more targeted promotions that are in line with customers’ buying behavior. This can help to cement these customers and incentivize them to make another purchase from your business.
KNeighbors Regressor
The second master, or segment, is the champions, which constituted 131 highly valuable customers the business recently acquired and have been interacting frequently and recently with the business. Their total spending (monetary = 1490.92) also proved their value to the business even more. Such a strategy should offer loyalty programs, such as VIP perks, early bird access to sales, and referral bonuses, which will help to enhance their loyalty and voice of brand. We have learned that increasing such factors can improve their experience and boost their lifetime value.
The third group of customers is the at-risk group, containing 115 clients with low activity indicators. While they have a high recency score of 83.24, this implies that they have been recently rather active but have a low purchase frequency and are therefore close to customer disengagement. Thus, it is crucial to put together specific reactivation campaigns that promote special promotions that restore the customer’s interest and add to the list all the benefits of getting customers to return to the company. Research indicates that targeted promotions leveraging personalized marketing campaigns can effectively reactivate dormant customers. For instance, a study found that personalized messages and exclusive offers significantly enhance reactivation efforts [28]. Similarly, AI-driven targeted promotions and personalized content can boost customer engagement and purchases. Additionally, a study also discussed how personalized promotions can effectively re-engage inactive customers [29,30].
Finally, the segment called hibernating customers has 44 and they are characterized by very low recency with an average frequency of 263.44. These customers are virtually indifferent towards the products, and it is important to start waking these up. Promo coupons, ‘we miss you’ campaigns, and feedback seeking through online questionnaires and polls serve as useful strategies for winning customers back into the fold.
Table 2 sums up the results of K-Means clustering, with reference to four customers’ clusters derived from RFM analysis. Cluster 3 looks like the most profitable customer group, their recency level is 49.57 days on average, they have the highest transactions frequency, equaling 4.73, and the highest monetary value, which equals 3001.59. Engaging this audience should be conducted through personalized messages, membership cards or bonuses, and any other incentive that can keep them glued. The cluster of customers with lower loyalty and moderately interacting with the organization is Cluster 0, with customers having a recency of 76.97 days, frequency of 3.06, and average monetary value of 1490.92. It is always useful to develop its increased frequency and to do this, it is possible to use incentives such as bonuses or personalized quantity-based discounts. Cluster 1 customers have slightly higher values for the recency aspect, at 83.24 days, and low values for the frequency aspect, 1.69, and the spending aspect, 391.11 as well. Such customers need reactivation strategies and targeted offers to bring them back into patronizing the business. Last, Cluster 2 is the group of customers in a hibernation state with the recipients who have the highest recency (263.44) and the lowest frequency (1.28), and moderate monetary value (628.70). Such customers should be wooed back with special tactics including a flash sale option or a ‘we miss you’ sale. That is, by identifying the behavior of these clusters, firms can tailor their marketing strategies, retain their customers, and therefore increase their revenues.
Table 2.
Cluster Summary (K-Means).
These segments offer various opportunities for marketing optimization for business organizations. To the extent that a business can adjust campaigns to meet the unique characteristics of these groups, customer/turnover rates may be bolstered, while revenues and overall CLV magnified. Intended messages meant to be delivered to at-risk and hibernating customers should be effective in initiative if their referrals are geared towards nurturing long run business since they have proved to be valuable.
4.4. Discussion
The synthesis of the findings from EDA, regression modeling, and RFM sheds light on the nature of customers and sales characteristics. Through EDA, vital patterns were established in the sales volume, frequency of transactions, and product categories, especially during and across different seasons of the year and consumers’ preferences. These were complemented by predictive models whereby MLP Regressor showcased the best performance in the provision of sales forecast, which would be imperative for decision-making on future demand. At the same time, with the help of RFM analysis it was possible to divide customers into different groups according to their purchasing behavior and to choose the necessary actions in the framework of the sales promotion.
When assimilated, these ideas help in building an improved approach to the process of decision-making in business organizations. For example, the product categories revealed in EDA as the outstanding performers can be combined with the tool that predicts the sales accordingly. Further, knowledge about customers through the classification of customer segments with RFM analysis will allow one to address clients more individually; while using regression models, the number of sales and the extra stock that will be needed in the future can be forecasted. Combined, these analyses create a sound practice that would enhance the ways and means by which retailers calibrate their operational functions, deliver value to shoppers, and expand sustainable sales in the long run.
5. Conclusions
The research proposes a detailed framework for analyzing the sales pattern and customer profile using EDA, regression analysis, and RFM analysis. The descriptive analytics, performed using EDA, provided a precious preliminary picture of the sales patterns, the transaction rate, and the revenues, providing the framework for the further, exploratory, PDA, and segmentation analysis. At the end of testing all regression models, MLP Regressor gave better results than Ridge and KNN in terms of R2 of 0.9398 showing how accurate MLP Regressor is in handling non-linear sales data. The RFM evaluation completed the segmentation of customer into loyal customers, champions, at-risk, and hibernating, and it provided significant data for better overall evaluation of customer involvement and potential technique of post-holiday customer retention and revenue enhancement.
Retailers will find these findings highly relevant. Optimizing demand forecasting helps in managing inventories to avoid stock shortages or excess stock while customer segmentation creates customer groups for marketing communication that improve customer experiences. When resources and campaigns are customized according to the customer segmentation needs, it is possible to attain long-term growth. While this study applies standard techniques, its contribution lies in the integration of predictive modeling and behavioral segmentation, demonstrating their combined potential for retail decision-making.
Nevertheless, the present study has certain limitations that must be considered here. However, some limitations were about the demographic and customer characteristic of the dataset and there was no additional input redesigned for the model to improve the segmentation. The possible study could consider these factors as an integrated proposition, continued exploration of more novel machine learning topologies, and the development of a real time analytics base for customer insights. Eliminating these limitations can open an opportunity to enhance the innovation in retail analytics and decision-making.
Future studies can incorporate demographic attributes such as customer income levels and lifestyle indicators to refine segmentation. Additionally, integrating external data sources (e.g., market trends, competitor pricing) can enhance predictive accuracy. More advanced deep learning architectures could also be explored for improved generalization. Future research could focus on real-time sales prediction using streaming data architectures and advanced deep learning models. The integration of reinforcement learning for dynamic pricing strategies and customer behavior prediction in real-time settings could further enhance retail decision-making.
Funding
This research was funded by the Nanjing University of Posts and Telecommunications, funded by Major Projects of Philosophical and Social Science Research in Jiangsu Universities, China (Grant No. 2020SJZDA080).
Data Availability Statement
The original contributions presented in the study are included in the article, further inquiries can be directed to the corresponding author.
Acknowledgments
The authors are grateful for supporting the research to the Nanjing University of Posts and Telecommunications, funded by Major Projects of Philosophical and Social Science Research in Jiangsu Universities, China.
Conflicts of Interest
The authors declare no conflicts of interest.
References
- Har, L.L.; Rashid, U.K.; Te Chuan, L.; Sen, S.C.; Xia, L.Y. Revolution of retail industry: From perspective of retail 1.0 to 4.0. Procedia Comput. Sci. 2022, 200, 1615–1625. [Google Scholar]
- Rehman, A.; Naz, S.; Razzak, I. Leveraging big data analytics in healthcare enhancement: Trends, challenges and opportunities. Multimed. Syst. 2022, 28, 1339–1371. [Google Scholar]
- Yusof, Z.B. Analyzing the role of predictive analytics and machine learning techniques in optimizing inventory management and demand forecasting for e-commerce. Int. J. Appl. Mach. Learn. 2024, 4, 16–31. [Google Scholar]
- Best, J.; Glock, C.H.; Grosse, E.H.; Rekik, Y.; Syntetos, A. On the causes of positive inventory discrepancies in retail stores. Int. J. Phys. Distrib. Logist. Manag. 2022, 52, 414–430. [Google Scholar]
- Suryawanshi, R.; Musale, S.; Bhosale, S. Comparative analysis of use of machine learning algorithm for prediction of sales. J. Electr. Syst. 2024, 20, 851–863. [Google Scholar]
- Kadam, V.; Vhatkar, S. Design and develop data analysis and forecasting of the sales using machine learning. In Intelligent Computing and Networking: Proceedings of IC-ICN 2021; Springer: Singapore, 2022; pp. 157–171. [Google Scholar]
- Mahoto, N.A.; Iftikhar, R.; Shaikh, A.; Asiri, Y.; Alghamdi, A.; Rajab, K. An intelligent business model for product price prediction using machine learning approach. Intell. Autom. Soft Comput. 2021, 30, 1. [Google Scholar]
- Vidhya, V.; Donthu, S.; Veeran, L.; Lakshmi, Y.S.; Yadav, B. The intersection of AI and consumer behavior: Predictive models in modern marketing. Remit. Rev. 2023, 8, 4. [Google Scholar]
- Wan, S.; Chen, J.; Qi, Z.; Gan, W.; Tang, L. Fast RFM model for customer segmentation. In Companion Proceedings of the Web Conference 2022; Association for Computing Machinery: New York, NY, USA, 2022; pp. 965–972. [Google Scholar]
- Bagul, N.; Berad, P.; Surana, P.; Khachane, C. Retail customer churn analysis using RFM model and K-means clustering. Int. J. Eng. Res. Technol. 2021, 10, 3. [Google Scholar]
- Cordova, R.S. Customer segmentation in the online retail industry using big data analytics. J. Theor. Appl. Inf. Technol. 2024, 102, 22. [Google Scholar]
- Aruva, S.P. A Systematic Evaluation of Regressions and Loss Functions for the Prediction of Monetary Value in RFM Analysis. Ph.D. Thesis, National College of Ireland, Dublin, Ireland, 2023. [Google Scholar]
- Rivera-Castro, R.; Pletnev, A.; Pilyugina, P.; Diaz, G.; Nazarov, I.; Zhu, W.; Burnaev, E. Topology-based clusterwise regression for user segmentation and demand forecasting. arXiv 2020, arXiv:2009.03661. Available online: https://arxiv.org/abs/2009.03661 (accessed on 10 December 2024).
- Yanchenko, A.K.; Deng, D.D.; Li, J.; Cron, A.J.; West, M. Hierarchical dynamic modeling for individualized Bayesian forecasting. arXiv 2021, arXiv:2101.03408. Available online: https://arxiv.org/abs/2101.03408 (accessed on 10 December 2024).
- Haque, M.S.; Amin, M.S.; Miah, J. Retail demand forecasting: A comparative study for multivariate time series. arXiv 2023, arXiv:2308.11939. [Google Scholar]
- Xie, D.; Zhang, S. Machine learning model for sales forecasting by using XGBoost. In Proceedings of the 2021 IEEE International Conference on Consumer Electronics and Computer Engineering (ICCECE), Guangzhou, China, 15–17 January 2021; IEEE: Piscataway, NJ, USA; pp. 480–483. [Google Scholar]
- Fildes, R.; Ma, S.; Kolassa, S. Retail forecasting: Research and practice. Int. J. Forecast. 2022, 38, 1283–1318. [Google Scholar] [CrossRef]
- Kasem, M.S.; Hamada, M.; Taj-Eddin, I. Customer profiling, segmentation, and sales prediction using AI in direct marketing. arXiv 2023, arXiv:2302.01786. Available online: https://arxiv.org/abs/2302.01786 (accessed on 1 January 2025).
- Naik, S. Customer segregation infrastructure: Unveiling insights through data mining. Int. J. Artif. Intell. 2023, 3, 1–4. [Google Scholar]
- Cao, K.; Zhang, T.; Huang, J. Advanced hybrid LSTM-transformer architecture for real-time multi-task prediction in engineering systems. Sci. Rep. 2024, 14, 4890. [Google Scholar]
- Iaousse, M.; Jouilil, Y.; Bouincha, M.; Mentagui, D. A comparative simulation study of classical and machine learning techniques for forecasting time series data. Int. J. Online Biomed. Eng. iJOE 2023, 19, 56–65. [Google Scholar]
- Rousseeuw, P.J. Silhouettes: A graphical aid to the interpretation and validation of cluster analysis. J. Comput. Appl. Math. 1987, 20, 53–65. [Google Scholar]
- DataRK1. Customers Clustering: K-Means, DBSCAN, and Affinity Propagation. Kaggle. 2023. Available online: https://www.kaggle.com/code/datark1/customers-clustering-k-means-dbscan-and-ap (accessed on 1 January 2025).
- Rajan, P. Integrating IoT analytics into marketing decision-making: A smart data-driven approach. Int. J. Data Inf. Intell. Comput. 2024, 3, 12–22. [Google Scholar]
- Langer, T.; Meisen, T. System design to utilize domain expertise for visual exploratory data analysis. Information 2021, 12, 140. [Google Scholar] [CrossRef]
- Shirole, R.; Salokhe, L.; Jadhav, S. Customer segmentation using RFM model and K-means clustering. Int. J. Sci. Res. Sci. Technol. 2021, 8, 591–597. [Google Scholar]
- Lewaaelhamd, I. Customer segmentation using machine learning model: An application of RFM analysis. J. Data Sci. Intell. Syst. 2024, 2, 29–36. [Google Scholar]
- Terho, H.; Mero, J.; Siutla, L.; Jaakkola, E. Digital content marketing in business markets: Activities, consequences, and contingencies along the customer journey. Ind. Mark. Manag. 2022, 105, 294–310. [Google Scholar]
- Santos, Z.R.; Cheung, C.M.; Coelho, P.S.; Rita, P. Consumer engagement in social media brand communities: A literature review. Int. J. Inf. Manag. 2022, 63, 102457. [Google Scholar]
- Waltenrath, A.; Brenner, C.; Hinz, O. Some interactions are more equal than others: The effect of influencer endorsements in social media brand posts on engagement and online store performance. J. Interact. Mark. 2022, 57, 541–560. [Google Scholar]


Disclaimer/Publisher’s Note: The statements, opinions and data contained in all publications are solely those of the individual author(s) and contributor(s) and not of MDPI and/or the editor(s). MDPI and/or the editor(s) disclaim responsibility for any injury to people or property resulting from any ideas, methods, instructions or products referred to in the content. |
© 2025 by the author. Licensee MDPI, Basel, Switzerland. This article is an open access article distributed under the terms and conditions of the Creative Commons Attribution (CC BY) license (https://creativecommons.org/licenses/by/4.0/).