Article

Designing a Sustainable Supply Chain Network for Perishable Products Integrating Internet of Things and Mixed Fleets

1
Business School, Hunan University, Changsha 410082, China
2
Business School, Xiangtan Institute of Technology, Xiangtan 411100, China
3
School of Digital Economy and Management, Fuyao University of Science and Technology, Fuzhou 350100, China
*
Authors to whom correspondence should be addressed.
J. Theor. Appl. Electron. Commer. Res. 2025, 20(2), 137; https://doi.org/10.3390/jtaer20020137
Submission received: 11 April 2025 / Revised: 28 May 2025 / Accepted: 4 June 2025 / Published: 6 June 2025
(This article belongs to the Special Issue Digitalization and Sustainable Supply Chain)

Abstract

:
Designing a sustainable supply chain network for perishable products is challenging due to their short shelf life and sensitivity to environmental conditions. These factors necessitate strict quality control and efficient logistics. The emergence of Internet of Things (IoT) technology has significantly improved supply chain operations by enabling real-time monitoring of environmental conditions. This helps maintain product quality and ensures timely deliveries. Additionally, using mixed fleets—comprising both electric and conventional vehicles—can reduce carbon emissions without compromising operational reliability. While previous studies have explored the application of IoT to enhance delivery efficiency and the use of mixed fleets to address environmental concerns, few have examined both technologies within a unified modeling framework. This study proposes a sustainable multi-period supply chain network for perishable products that integrates IoT technology and mixed fleets into an optimization framework. We develop a multi-objective location-inventory-routing model. The first objective minimizes total costs, including production, facility operation, inventory, transportation, carbon emissions, IoT deployment, and energy use. The second objective aims to maximize service levels, which are measured by product quality and on-time delivery. The model is solved using the Non-Dominated Sorting Genetic Algorithm II (NSGA-II). A case study based on real-world data demonstrates the model’s effectiveness. Sensitivity analysis indicates that balancing the emphasis on quality and delivery reliability leads to improved cost and service performance. Furthermore, while total costs steadily increase with higher demand, service levels remain stable, showcasing the model’s robustness. These results provide practical guidance for managing sustainable supply chains for perishable products.

1. Introduction

In recent years, the design of supply chain networks for perishable products—such as food, pharmaceuticals, and blood products—has gained significant attention due to its crucial role in industrial and commercial operations [1,2]. These products are characterized by their short shelf life and sensitivity to environmental conditions, requiring careful management of storage, transportation, and distribution [3,4]. Supply chain network design (SCND) for perishable and short-lifecycle goods is widely recognized as one of the most complex and critical areas within supply chain management [5,6]. Food waste is a serious global issue, with approximately 1.3 billion tons—one-third of total global food production—discarded each year [4]. In India, post-harvest losses of fruits ranged from 6.02 to 15.05%, while losses for vegetables varied from 4.87 to 11.61% during the 2021–2022 period [7]. In China, the damage rate of perishable goods during transportation and storage is estimated at 30%, which is significantly higher than the 5% observed in developed countries [8]. The causes of these losses are multifaceted, including inadequate cold chain infrastructure, inefficient network design, poor logistics coordination, inaccurate demand forecasting, and limited adoption of advanced technologies [4,8,9,10]. Thus, designing efficient and resilient supply chain networks for perishable products is essential for reducing waste, preserving product quality, and ensuring timely delivery to consumers.
The Internet of Things (IoT) has significantly enhanced the speed and accuracy of data collection and decision-making, enabling supply chains to respond to changes in real time [11,12]. IoT refers to a network of interconnected physical devices capable of monitoring and interacting within and across organizational boundaries. This connectivity improves supply chain agility, visibility, tracking, and information sharing—factors essential for effective planning, control, and coordination [13]. In perishable supply chains, IoT sensors are deployed across production equipment, transportation vehicles, pallets, and storage facilities. These sensors can detect and record key environmental parameters such as temperature and humidity in real time. The collected data are transmitted to centralized control systems via wireless gateways [14]. This setup allows for continuous, real-time monitoring throughout the supply chain, ensuring adherence to product quality standards and timely delivery [15].
The supply chain for perishable products necessitates strict control of temperature and humidity across various stages, including storage and transportation, which significantly contributes to carbon emissions [4]. The use of refrigerated conventional vehicles (CVs) in cold chain logistics generates approximately 20% more carbon emissions than non-refrigerated CVs, resulting in a much larger carbon footprint compared to other freight transport modes [4,16]. As an alternative, electric vehicles (EVs) provide several benefits, such as lower operating costs, higher energy efficiency, and considerably reduced greenhouse gas (GHG) emissions [17]. According to Farooq and Cora [18], GHG emissions vary significantly between vehicle types. Diesel-powered vehicles emit approximately 0.192 kg of GHG per kilometer, while gasoline vehicles emit around 0.185 kg/km. In contrast, electric vehicles (EVs) generate much lower emissions, averaging 0.096 kg/km during operation. While replacing diesel vehicles with EVs is a promising strategy for reducing carbon emissions, several challenges persist, including limited battery capacity, inadequate charging infrastructure, and high upfront investment costs [16,19]. Nevertheless, ongoing advancements in battery technology and the gradual expansion of charging networks have enhanced the feasibility of integrating EVs into perishable goods supply chains. Balancing cost control and emission reduction has thus, become a critical concern in the transition to low-carbon logistics for perishable products. In this context, hybrid fleets—comprising both CVs and EVs—offer a practical solution that supports carbon mitigation while maintaining transportation efficiency.
According to the World Bank, strict carbon regulations could reduce global emissions by 4% by 2030, helping to achieve the climate targets outlined in the Paris Agreement [17]. Among various policy instruments, the carbon tax is widely recognized by researchers and economists as a cost-effective method for reducing emissions [20,21]. The implementation of carbon tax policies fundamentally changes the cost structures within supply chain networks, influencing both strategic and operational decisions. By imposing monetary penalties on carbon emissions from production, inventory, and transportation activities, carbon taxes encourage companies to redesign their supply chains to be more sustainable [22,23]. In this study, the effects of the carbon tax are explicitly incorporated into the model’s objective function as an emissions-based cost component. This approach ensures that the proposed model aligns with real-world policy contexts and allows for the assessment of how environmental regulations impact supply chain sustainability.
Sustainability is often defined through three key dimensions: economic, social, and environmental [24]. In recent years, researchers have concentrated on developing sustainable supply chain networks. One significant area of research focuses on incorporating environmental and social considerations into the design of networks for perishable products [4,25,26]. Another area explores the integration of IoT technologies into supply chain planning, with some studies beginning to address sustainability aspects alongside technological implementation [27,28]. Additionally, a third research direction investigates the use of mixed fleets—combining electric and conventional vehicles—in single-period location-routing problems within cold chain logistics [29,30]. However, there is limited research that integrates both IoT and mixed fleets into a unified sustainable SCND while addressing the location-inventory-routing problem for perishable products.
This study proposes a sustainable, multi-period SCND for perishable products that incorporates IoT technology and uses a mixed fleet of EVs and CVs under a carbon tax policy. A multi-objective location-inventory-routing model is developed to simultaneously optimize economic performance—measured by total costs, including production, facility operations, inventory, transportation, IoT deployment, and carbon emissions—and service level, assessed based on product quality and delivery delays. The NSGA-II is utilized to address the trade-offs between these conflicting objectives by generating Pareto-optimal solutions. The model’s effectiveness is validated through a real-world case study. Additionally, a sensitivity analysis offers practical insights for supply chain managers on how to leverage IoT technologies to enhance service levels and effectively incorporate EVs into distribution to reduce emissions.
The remainder of this paper is structured as follows: Section 2 provides a review of the relevant literature; Section 3 defines the problem and presents the mathematical model; Section 4 introduces the NSGA-II algorithm; Section 5 and Section 6 present the case study and sensitivity analysis, respectively; and Section 7 concludes this paper and outlines directions for future research.

2. Literature Review

In the following, we review the literature on sustainable SCND for perishable products, specifically focusing on the integration of IoT technology and mixed fleets. First, we analyze existing research on sustainable SCND for perishable products. Second, we examine studies that incorporate IoT into SCND. Third, we explore works focusing on SCND with mixed fleet. In addition, we highlight the differences between our work and the previous research.

2.1. Sustainable SCND for Perishable Products

Sustainable SCND for perishable products has garnered significant attention in recent years. Most existing studies primarily focus on the economic and environmental aspects of sustainability [7,31,32,33,34], while relatively few explore the social dimension [35,36]. Only a limited number of studies attempt to integrate all three dimensions of sustainability. These studies often highlight social sustainability through factors such as job creation and economic development [2,37,38], reducing traffic congestion [39], and broader concepts of social responsibility, including community development and customer satisfaction [40]. While these studies offer valuable insights, they often simplify complex socio-environmental trade-offs or fail to fully account for factors like customer satisfaction and service responsiveness.
Recent research has increasingly highlighted the importance of product quality and delivery performance in promoting supply chain sustainability. For instance, Liu, Zhu, Xu, Lu, and Fan [4] proposed an integrated location-inventory-routing model for perishable products in emerging markets. This model aims to lower economic costs and carbon emissions while enhancing product freshness. Similarly, Golestani et al. [41] developed a bi-objective green hub location model for cold supply chains, focusing on balancing overall system costs with product quality. Sogandi and Shiri [25] developed a multi-objective optimization framework for the saffron supply chain under uncertain conditions. Their goal was to reduce overall supply chain costs, promote regional economic growth through job creation, and improve product quality. Similarly, Seyedzadeh et al. [42] proposed a sustainable supply chain network model for the viticulture industry, which aims to minimize economic and environmental costs while delivering social value. Their approach involves classifying grapes based on quality and allocating them accordingly—for example, premium grapes are designated for fresh consumption, raisins, and syrup, while lower-quality grapes are processed into vinegar. Other researchers have focused more on enhancing delivery performance within perishable supply chains. Wang et al. [43] introduced a multi-objective model for a complex four-echelon intermodal system that manages multiple perishable products. Their model analyzes trade-offs between operational costs, lead times, emissions, and mismatches between demand and supply. Meidute-Kavaliauskiene et al. [44] developed a novel location-routing model that takes into account environmental impact, cost, lead time, and customer satisfaction. The goal of their model is to minimize costs, delivery times, and emissions while simultaneously maximizing customer satisfaction. Fathi, Zamanian, and Khosravi [26] presented a mixed-integer linear programming model that integrates the three pillars of sustainability into SCND. Their objectives include minimizing total costs and delivery time, maximizing employment opportunities, and reducing carbon emissions, nitrous oxide release, and water consumption.
The studies emphasize important factors related to sustainability in the supply chains of perishable products, including costs, emissions, product quality, and delivery performance. They also showcase the variety of modeling approaches utilized in SCND. Building on this foundation, our study introduces a comprehensive model that integrates location, inventory, and routing for sustainable SCND of perishable products. This model takes into account product quality, delivery reliability, IoT technology, mixed fleets, and carbon tax policies within a unified supply chain design framework.

2.2. SCND Integrating IoT

The IoT has found extensive applications in various industries, including healthcare, battery recycling, and food logistics. It enables real-time monitoring, improved traceability, and enhanced operational efficiency. In the healthcare sector, IoT is utilized in waste management systems to track waste streams and to ensure compliance with regulations [45,46]. Similarly, Salehi-Amiri et al. [47] applied IoT in home healthcare supply chains to manage uncertainties and improve system responsiveness. In the realm of electric vehicle (EV) battery recycling, IoT enhances transparency by improving traceability and recycling efficiency [48,49].
IoT technology plays a vital role in managing supply chains for perishable products by helping to maintain product quality, reduce waste, and enhance overall performance. Numerous studies have developed IoT-enabled models to optimize the supply chain operations of perishable products. For instance, Ekren et al. [50] proposed a conceptual IoT-based inventory-sharing model for fresh food e-commerce networks, which aims to minimize food waste. However, this model is limited to a single-echelon framework and overlooks essential factors such as physical routing decisions and service level indicators. Additionally, important operational trade-offs—such as the type and cost of IoT deployment and fuel consumption—are not addressed. In a related study, Mohammadi, Sajadi, Najafi, and Taghizadeh-Yazdi [28] introduced a four-echelon supply chain model that integrates IoT technologies with a vendor-managed inventory (VMI) policy to reduce total cost and delivery times for various perishable products. The model utilizes innovative technologies such as RFID, WSN, and blockchain, but its primary focus is on economic efficiency, with limited consideration for environmental impacts. Most existing studies on IoT-integrated SCND have concentrated on cost optimization and delivery efficiency, while largely overlooking environmental sustainability. An exception is the work by Goodarzian, Navaei, Ehsani, Ghasemi, and Muñuzuri [27], who developed a four-echelon, multi-objective model for a green cold vaccine supply chain during the COVID-19 pandemic. Their model emphasized cost minimization, demand fulfilment, timely delivery, and environmental objectives. They proposed an IoT-based solution to classify populations by region and prioritize high-risk groups, thereby enhancing equity and responsiveness under pandemic constraints. However, the study did not explicitly address the financial costs or performance impact of IoT implementation, which limits its ability to evaluate trade-offs between technological investment and operational effectiveness.
The studies reviewed demonstrate various strategies for integrating IoT technologies into SCND from different perspectives. However, when it comes to sustainable SCND for perishable products, there is limited research on using IoT technologies to monitor product quality degradation, track vehicle routes, and ensure timely delivery.

2.3. SCND Integrating Mixed Fleets

Environmental concerns in supply chain management primarily focus on GHG emissions, carbon footprints, and the consumption of fuel and energy—key themes in sustainability research [51,52,53]. As global awareness of climate change grows, along with the urgent need to reduce reliance on fossil fuels, the adoption of electric vehicles (EVs) has become a crucial strategy for modernizing transportation systems [54,55]. Recent studies have increasingly highlighted the use of mixed fleets—comprising both conventional and electric vehicles—as an effective approach to tackling complex logistics challenges, such as the vehicle routing problem [16,56], inventory routing problem [57], and location-routing problem [29,30,58,59]. Xu, Li, Wu, Huang, Guan, Zheng, and Shen [58] examined the location-routing problem in pharmaceutical cold chain logistics, utilizing a mixed fleet of conventional and electric vehicles. They developed a multi-objective optimization model that addresses key uncertainties such as carbon emissions, fuzzy pharmaceutical demand, travel time, and energy consumption. The goal of their model is to reduce both the number of dispatched vehicles and the overall operational costs. Liu and Shi [29] examined the design of cold chain distribution networks in the context of various carbon reduction policies, including emission quotas, carbon taxes, and subsidies. They developed a multi-objective model that simultaneously optimizes vehicle routing, fleet composition (comparing internal combustion and electric refrigerated trucks), and the placement of distribution centers and charging stations while adhering to time window constraints. The primary goals of this model are to minimize distribution operation costs and reduce customer dissatisfaction. Leng, Wang, Wan, Zhao, Liu, and Zuo [59] investigated the effects of ambient temperature, path flexibility, and hybrid fleet composition in a dual-mode, energy-efficient location-routing problem. Their model aimed to balance economic and environmental objectives by minimizing logistics costs, energy consumption, and emissions. The fleet analyzed in this study included three types of vehicles: conventional fuel vehicles, electric vehicles, and EVs with battery-swapping capabilities. The results indicated that hybrid fleets could reduce logistics costs by an average of 2.51–5.94% compared to homogeneous fleets. However, practical concerns related to product quality and delivery performance—both crucial for customer satisfaction and service effectiveness—were not fully addressed. To address this issue, Leng, Jin, Chen, Wan, and Wang [30] introduced a comprehensive model that simultaneously evaluates cost, product quality, delivery timeliness, and environmental impact in cold chain logistics. This model also analyzes the effects of ambient temperature, routing flexibility, and hybrid fleets on performance. Although the use of EVs results in increased total travel time, distance, and product degradation, it significantly reduces logistics costs and carbon emissions, ultimately enhancing the sustainability of the overall network.
The studies reviewed have incorporated mixed fleets into various supply chain optimization models, particularly focusing on vehicle routing and location-routing problems, to improve operational efficiency, especially in cold chain logistics. However, most of these models are limited to static, single-period scenarios and do not adequately reflect the dynamic nature of real-world operations. Additionally, inventory-related decisions, which are crucial for managing perishable products, have often been overlooked. There is a significant gap in the literature regarding the integration of location, inventory, and routing decisions within a unified SCND framework. Specifically, few studies address multi-period settings that simultaneously consider facility location, inventory management, and routing within the context of mixed fleets and sustainability objectives.

2.4. Research Gap

Although the previous sections provide a detailed introduction to relevant research, Table 1 outlines the differences between our model and the closely related models mentioned earlier. This comparison focuses on five aspects: the perishability of products, sustainability dimensions, decision types in SCND, the IoT, and mixed fleets. In summary, the limitations of the previous literature can be categorized into two main areas. First, while some studies have explored IoT-enabled supply chains (e.g., [27,28]) and others have investigated mixed fleet configurations in cold chain logistics (e.g., [30,58]), very few have integrated both technologies within a cohesive SCND framework. Second, many sustainable location-inventory-routing models tend to emphasize either economic or environmental objectives, often overlooking social sustainability aspects. Specifically, they neglect to jointly consider product quality and delivery timeliness—two critical dimensions in supply chains for perishable products. For instance, studies such as those by Sogandi and Shiri [25] and Fathi, Zamanian, and Khosravi [26] focus on only one aspect, either product quality or delivery time, failing to capture the combined impact of both factors.
This study presents a multi-period location-inventory-routing model that incorporates IoT-enabled monitoring and mixed fleet operations within the context of carbon tax regulations. The model aims to simultaneously optimize costs, service levels (including product quality and delivery timeliness), and environmental impact, thereby providing a more comprehensive and realistic framework for designing sustainable perishable supply chain networks. Based on previous research, this paper makes the following contributions to the literature:
  • To the best of our knowledge, this is the first mathematical model that integrates IoT technology and mixed fleets within a sustainable SCND framework specifically for perishable products.
  • This is also the first time we have incorporated service levels—related to both quality and timely delivery—as an aspect of social sustainability within multi-objective location-inventory-routing models for sustainable SCND of perishable products. The model effectively balances three key dimensions of sustainability: economic performance, environmental impact, and service level.
  • We analyze the effects of allocating service level weight coefficients on both total cost and service level in SCND. Our findings suggest that by strategically adjusting the emphasis on quality and delivery, the supply chain can achieve a competitive advantage in terms of both cost-effectiveness and service level.
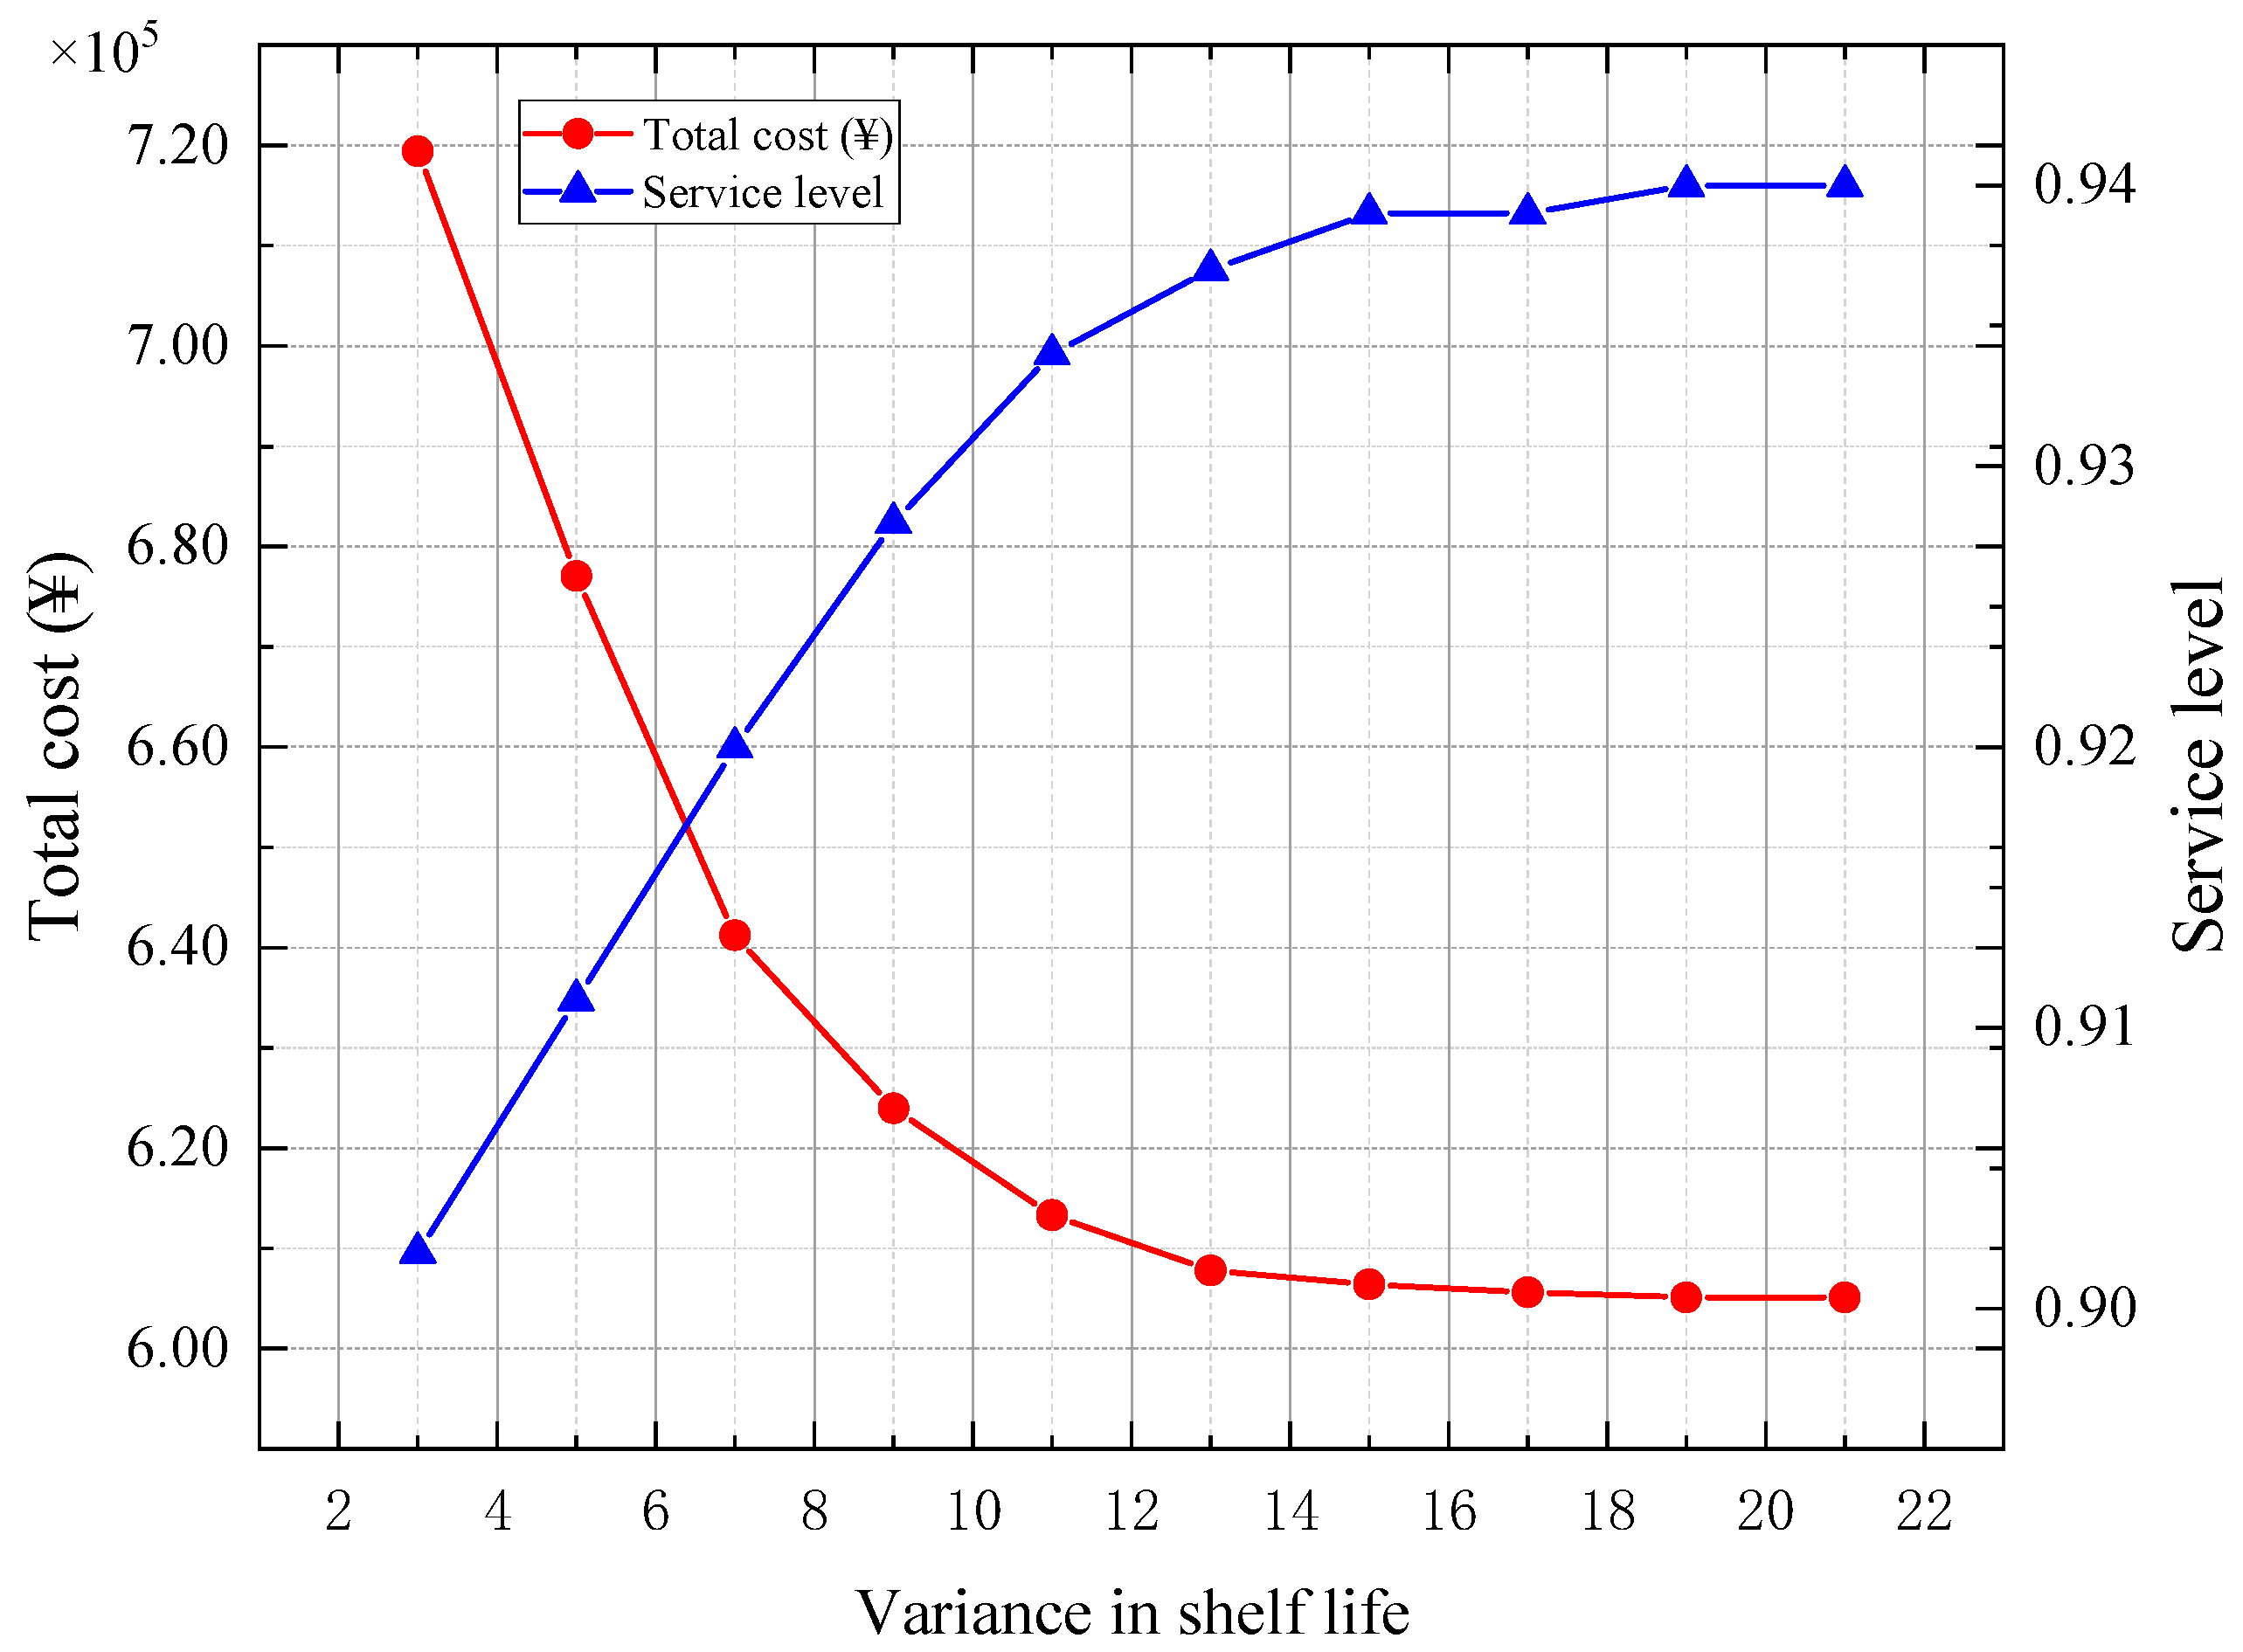
  • Additionally, we discover that by moderately extending the shelf life of perishable products, total costs can be reduced while simultaneously improving service levels. However, if the extension exceeds a certain threshold, the effectiveness of this strategy significantly diminishes.

3. Problem Description and Mathematical Model

3.1. Problem Description

This study introduces a multi-objective optimization model for the location-inventory-routing problem (LIRP). The goal is to design sustainable supply chain networks specifically for perishable products. The model incorporates IoT technologies and features a heterogeneous vehicle fleet consisting of EVs and CVs to improve sustainability and operational efficiency. Operating across T   discrete planning periods, the model accounts for a three-echelon network structure that includes manufacturers, distribution centers (DCs), and customers. It specifically addresses vehicle heterogeneity, incorporating the EVs and CVs.
The IoT infrastructure is systematically integrated throughout the supply chain to facilitate real-time monitoring of environmental conditions, enhance operational transparency, and support adaptive decision-making. This IoT architecture combines cloud-based platforms, GNSS-enabled geolocation tracking, and RFID-based product traceability. As a result, it ensures compliance with quality standards, mitigates the impact of demand fluctuations, and allows for a dynamic response to environmental disruptions.
The proposed model aims to minimize total operational costs, which include production, facility establishment, transportation, inventory holding, IoT deployment, and carbon emission penalties due to carbon tax regulations, while simultaneously maximizing service levels. Service level performance is measured using two key metrics: (1) product quality preservation, defined as the ratio of quality-adjusted quantities delivered to the initial demand, and (2) the on-time delivery rate, which penalizes deviations from the customer-specified time windows. These two objectives are weighted using normalized preference coefficients ( η 1   a n d   η 2 ), with η 1 + η 2 = 1 , allowing for flexibility based on managerial priorities regarding quality and timeliness. Strategic decisions within the model involve selecting DC locations and determining fleet composition. Meanwhile, tactical and operational decisions focus on inventory replenishment policies and vehicle routing schedules, which are subject to capacity and time window constraints.

3.2. Problem Assumptions

The model is established by considering the following assumptions:
  • Candidate DCs are pre-determined and have finite inventory capacity constraints.
  • During each planning period, a DC can source products from multiple manufacturers, while each customer is served by only one DC to meet their demand.
  • Product quality deteriorates linearly over time, with a degradation rate of one unit per period, reflecting the perishable nature of the goods.
  • All vehicles must depart from and return to their assigned DCs within specified time windows.
  • Each customer may only be visited once per period.
  • IoT technologies vary in complexity. Basic IoT solutions are low-cost and have limited functionality (e.g., temperature monitoring only), while advanced IoT solutions are more expensive and offer enhanced capabilities (e.g., real-time humidity control, geolocation tracking, and dynamic routing). This results in multiple types of IoT servers, each differing in deployment cost and energy consumption.

3.3. Notatio

The proposed model uses the following notations, which are described in Table 2.

3.4. Mathematical Model

The mathematical formulation for the perishable product sustainable supply chain network is obtained as follows:
M i n f 1 = m , t a m w m t + m , t b m p m t + r Φ r χ r                                  + r ς r Θ χ r + j f j x j + j , q , t h j q I j q t + m , j , v , k , t T v k y m j v k t + m , j , v , k , t t v k s m j v k t D m j + i , i A , v , k , t T v k z i i v k t + i , i A , v , k , t t v k ϱ i i v k t D i i + ϵ m , t α m w m t + m , t β m p m t + r ς r ϑ χ r + j ζ j x j + j , q , t π j q I j q t + m , j , v , k , t ε v k s m j v k t D m j + i , i A , v , k , t ε v k ϱ i i v k t D i i
M a x   f 2 = 1 η 1 × l , v , k , q , r , t ψ l v k q r t / l , t d l t + η 2 × l , v , k , r , t δ l v k r t / l , v , k , t u l v k t
S.t.
r χ m r = w m t m , t
r ξ j r = x j j
y m j v k t x j m , j , v , k , t
m , v , k , t s m j v k t = v , k , q , t ω j v k q t + q , t = T I j q t j
s m j v k t ϖ v k m , j , v , k , t
p m t = j , v , k s m j v k t m , t
p m t C m m , t
I j 0 t = m , v , k s m j v k t v , k ω j v k 0 t j , t
I j q t = m , v , k s m j v k t + I j q 1 , t 1 v , k ω j v k q t j , q Q \ 0 , t
I j q t k , t σ t + τ ω j k q σ j , q , t
q I j q t H j j , t
q ω j v k q t = l ϱ j l k t j , v , k , t
q ω j v k q t ϖ v k j , v , k , t
δ l v k r t χ r l , v , k , r , t
ψ l v k q r t θ × χ r l , v , k , q , r , t
ϱ i l v k t q , r ψ l v k q r t = ϱ l i v k t i , i J L , i l : l i : i i , l , k , t
v , k , q , r ψ l v k q r t = d l t l , t
ϱ i j v k t = 0 i J L , v , k , t
z j i v k t x j j , i J L , v , k , t
i J L z j i v k t λ x j j , v , k , t
l z j l v k t = l z l j v k t j , v , k , t  
i J L : i l z i l v k t = i J L : i l z l i v k t = v l v k t l , v , k , t
z i j v k t = 0 i J , j , v , k , t
v , k u l v k t = 1 l , t
u i v k t u i v k t λ n L , n L z n n v k t 1 + 1 L L , i J L , i J , i i , k , t
φ j v k t + τ j l λ 1 z j l v k t γ l v k t , j , l , v , k , t
γ l v k t + ρ l + τ l l λ 1 z j l v k t γ l v k t , l , l L , l l , v , k , t
γ l v k t + ρ l + τ l j λ 1 z j l v k t ϕ j v k t , j , l , v , k , t  
μ l G 1 z j l v k t γ l v k t σ l + G 1 σ l , l , v , k , t
φ j v k t e j , j , v , k , t
ϕ j v k t l j , j , v , k , t
w m t 0 , 1 m , t
χ r 0 , 1 r
x j 0 , 1 j
y m j v k t 0 , 1 m , j , v , k , t
z i i v k t 0 , 1 i J L , i J L , i i , v , k , t
u l v k t 0 , 1 l , v , k , t
δ l v k r t 0 , 1 l , v , k , r , t
p m t 0 m , n , t
I j q t 0 j , q , t
s m j v k t 0 j , m , v , k , t
ω j v k q t 0 j , v , k , q , t
ϱ i i v k t 0 i J L , i J L , i i , v , k , t
ψ l v k q r t 0 l , v , k , q , r , t
φ j v k t 0 j , v , k , t
ϕ j v k t 0 j , v , k , t
γ l v k t 0 l , v , k , t
The first objective (1) aims to minimize the total cost of the supply chain network, which includes production costs, IoT technology deployment costs at manufacturers and DCs, energy consumption by IoT systems at these facilities, facilities establishment costs, inventory holding costs, transportation costs, and carbon emission costs associated with production, IoT operations, inventory, and logistics activities under a carbon tax policy. The second objective (2) seeks to optimize a weighted service level criterion by minimizing product quality deterioration and delivery delays. Constraint (3) and Constraint (4) guarantee that each established facility—whether it is a manufacturer or a DC—is equipped with exactly one type of IoT technology. Constraint (5) specifies that manufacturers are permitted to deliver perishable products only to operational DCs. Constraint (6) maintains flow balance at the DCs throughout the planning horizon. Constraint (7) ensures that shipments from manufacturers to DCs do not exceed the capacity limits of the DCs. Constraint (8) calculates the quantity of products produced by manufacturers in each period, while Constraint (9) ensures that this quantity does not exceed their production capacity. Constraints (10) and (11) represent the balance of inventory flow for perishable products at DCs. Constraint (12) emphasizes the importance of considering shelf life when managing inventories at these DCs. Constraint (13) ensures that inventory levels remain within the storage capacities of the DCs. Constraint (14) connects the quantity loaded onto vehicles at the DCs with the actual delivery loads. Constraint (15) limits the quantities of vehicles being picked up to ensure they do not exceed their capacity. Constraint (16) defines how delivery scheduling is linked to the type of IoT technology that is implemented. Constraint (17) relates the quantities of products delivered at various quality levels to the corresponding IoT technologies in use. Constraint (18) determines the load that each vehicle carries on each leg of transportation. Constraint (19) ensures that vehicle deliveries to customers meet their demands. Constraint (20) specifies that vehicles must return to DCs with empty loads. Constraints (21) and (22) limit vehicle operations to active DCs only. Constraints (23) and (24) ensure a balanced flow of vehicles at customer nodes. Constraint (25) prohibits lateral transfers between DCs. Constraint (26) guarantees that all customer demands are met in each period. Constraint (27) eliminates sub-tour cycles within the distribution network. Constraints (28) and (29) address the timing of vehicle arrivals at customers. Constraint (30) specifies the required time for vehicles to return to DCs. Constraint (31) ensures that customer time windows are adhered to. Constraints (32) and (33) impose limits on the departure and return times of vehicles at the DCs, respectively. Finally, Constraints (34) to (49) define the nature and domains of the decision variables used in the model.

4. Non-Dominated Sorting Genetic Algorithm II (NSGA-II)

Two primary approaches are commonly used to solve multi-objective optimization problems. The first approach involves transforming multiple objectives into a single aggregated objective by assigning predefined weights to each criterion. While this method simplifies the optimization process, it introduces subjectivity in the selection of weights and may not fully capture the complexity of real-world scenarios, as the relative importance of objectives can change under different conditions. The second approach is based on the concept of Pareto optimality, which was originally proposed by the Italian economist, Vilfredo Pareto. This method focuses on identifying a set of non-dominated solutions, known as the Pareto optimal set, where no objective can be improved without causing a decline in at least one other. Although the weighted-sum approach reduces computational complexity, the Pareto-based method is more widely adopted because it provides a more comprehensive understanding of the trade-offs among competing objectives.
Deb et al. [61] improved the original NSGA algorithm by introducing the NSGA-II, which features fast non-dominated sorting and an elitism-preserving strategy. As a result, NSGA-II has become one of the most widely used algorithms for solving multi-objective optimization problems, due to its enhanced computational efficiency and robustness. It has been successfully applied to various challenges, including the location-inventory-routing problem [62], sustainable SCND for perishable products [25,63,64], IoT-enabled sustainable SCND [65], and SCND involving heterogeneous vehicle fleets [66] These applications collectively demonstrate the algorithm’s versatility and effectiveness. For more detailed information on NSGA-II, readers are encouraged to consult the relevant literature.
The NSGA-II algorithm has several important advantages. First, it reduces computational complexity by using an efficient non-dominated sorting procedure. This process ranks the population into hierarchical layers based on Pareto dominance, which speeds up convergence toward the optimal solution set. Additionally, NSGA-II employs a crowding distance mechanism to maintain population diversity; when multiple solutions have the same rank, those with greater crowding distances are given priority. This approach ensures a well-distributed Pareto front. Furthermore, NSGA-II incorporates an elitism strategy by retaining high-quality solutions from both parent and offspring populations, which enhances the stability and quality of the optimization results over generations.

5. Case Study

5.1. Case Description

To validate our proposed multi-objective sustainable supply chain model, we partnered with a leading dairy producer in China, referred to as “Company X”, operating in Hunan Province. The company manages two manufacturing facilities in Changsha and distributes perishable dairy products (e.g., fresh milk, yogurt) to 166 retail customers—including supermarkets and hotels—across Changsha through a network of five candidate distribution centers (DCs). Key operational challenges identified include (1) Product Spoilage: Historical data revealed an average spoilage rate of 12% due to temperature deviations during transportation. (2) Carbon Emissions: Refrigerated diesel vehicles accounted for 85% of the fleet, contributing approximately 53 tons of CO2 emissions weekly. (3) Service Inefficiency: On-time delivery rates averaged only 78%, with frequent violations of customer time windows—22% of orders were delayed by more than 30 min. To address these issues and ensure compliance with China’s carbon tax policies, the company aimed to redesign its supply chain network by integrating IoT-enabled monitoring systems and deploying a mixed fleet of EVs and CVs.
Data were collected systematically from three sources to ensure the robustness and realism of the model: (1) Historical Operational Data (2021–2023): (a) Demand Patterns—Weekly customer demand (in kg) and specified time windows (Table 3). (b) Vehicle Specifications—CVs were diesel-powered with a 10-ton capacity and a range of 400 km; EVs featured a 150 kWh battery, a range of 150 km, and a charging time of 2 h. (c) Facility Costs—Fixed weekly operating costs for DCs ranged from 15,000 to ¥25,000, while production costs at manufacturing plants ranged from 1.2 to ¥1.8 per kg. (2) Expert Consultations: (a) IoT Deployment Costs—Validated through interviews with the company’s logistics managers, who confirmed IoT sensor costs at ¥3500 per unit. (b) Carbon Tax Compliance—Ensured through alignment with China’s 2023 Emission Trading Scheme regulations. (3) Public and Technical Sources: (a) Geospatial Data—Distances between nodes were calculated using the Baidu Maps API (Table 4 and Table 5). (b) Energy Parameters—IoT energy consumption, ranging from 0.8 to 1.2 kWh per day per device, was sourced from Huawei IoT technical manuals.
The parameters for the NSGA-II algorithm are configured as follows: the population size is set to 200, the crossover probability is 0.75, the mutation probability is 0.1, and the maximum number of generations is 400. The multi-objective model, optimized using the NSGA-II algorithm, is implemented in MATLAB® 2020a and executed on a PC with a 2.4 GHz processor.

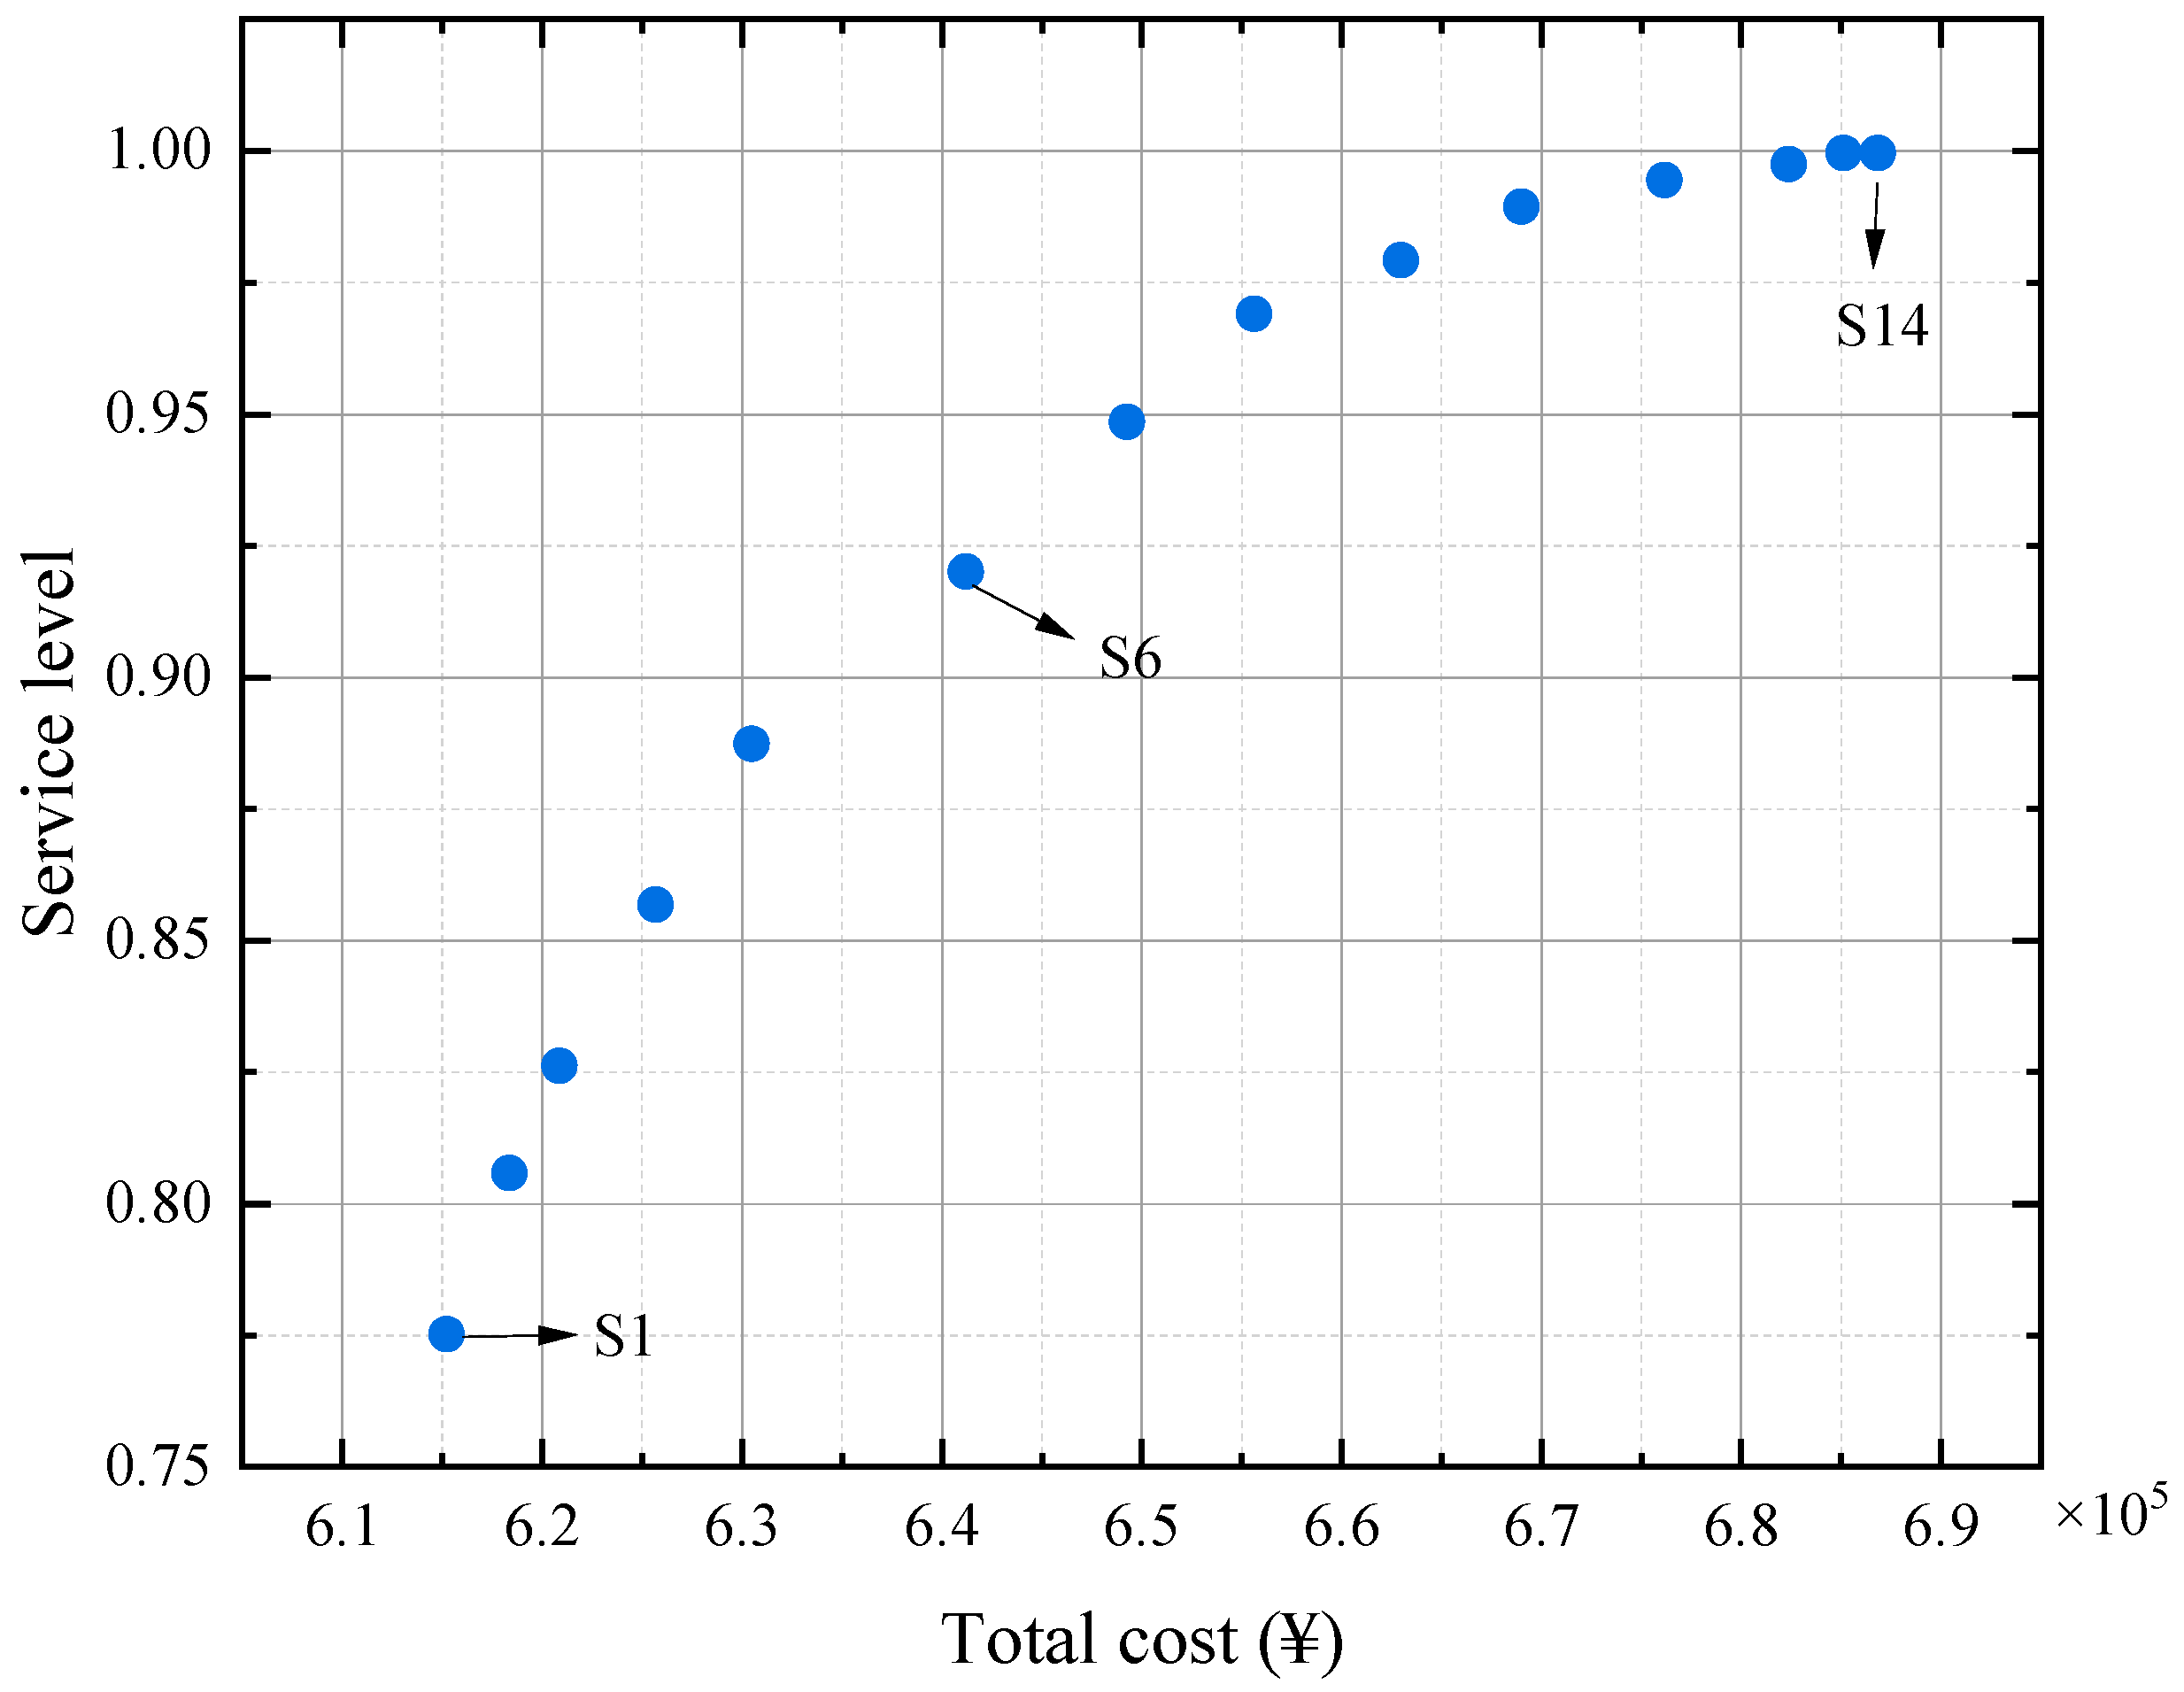
5.2. Pareto-Optimal Solutions Analysis

The NSGA-II algorithm produced 14 non-dominated solutions along the Pareto front, illustrating the trade-off between total cost f 1 and service level f 2 . As the second objective was normalized, its values range from 0 to 1. To perform a comprehensive analysis of these solutions, we assessed both the objective values and their spatial distribution, as illustrated in Figure 1.
As shown in Figure 1, each grid point represents an optimal compromise between minimizing total cost and maximizing service level. Each solution on the Pareto frontier reflects a trade-off, where a slight increase in one objective leads to a corresponding improvement in the other. The shape of the Pareto frontier underscores the inherent challenge of designing a sustainable supply chain network for perishable products—striking a balance between economic efficiency and high service levels. By analyzing these non-dominated solutions, decision-makers can identify the most appropriate configuration based on their specific priorities and strategic preferences. This process allows for cost reduction while enhancing service performance. Therefore, the Pareto frontier serves as a valuable decision-support tool, enabling stakeholders to make informed choices that balance the economic viability of the supply chain network with sustainability goals.
To facilitate decision-making, three representative solutions were selected for detailed analysis: the Cost-Optimal solution (S1), the Compromise solution (S6), and the Service-Optimal solution (S14), as shown in Table 6.
Table 6 outlines the trade-offs among cost, service level, and sustainability in three selected Pareto-optimal solutions. The Cost-Optimal solution (S1) achieves the lowest total cost of ¥597,309.74 but compromises on service quality and environmental performance. It records a service level of 0.775, higher CO2 emissions of 40.31 tons, and relatively low adoption rates of IoT and electric vehicles (64% and 29%, respectively). This configuration prioritizes economic efficiency, resulting in compromised product quality (3.5) and on-time delivery performance (83.63%). In contrast, the Service-Optimal solution (S14) maximizes both service level (0.996) and sustainability, reducing CO2 emissions to 35.98 tons and achieving high IoT and EV utilization rates of 99% and 78%, respectively. However, this improvement comes at a significantly higher cost of ¥686,847.03. The Compromise solution (S6) strikes a balanced trade-off between these two extremes. It offers a moderate total cost of ¥641,223.15, an improved service level of 0.920, lower emissions of 37.63 tons, and reasonable adoption rates of IoT and EV technologies (87% and 43%). This middle-ground option presents a pragmatic choice for decision-makers aiming to balance cost efficiency with service and environmental objectives.
The data demonstrate the interconnectedness of various objectives. Increased adoption of EVs and IoT technologies results in reduced emissions and improved service quality. For instance, S14 achieves a 99.64% on-time delivery rate, compared to 81.63% in S1. However, this improvement comes with higher operational costs. Similarly, stricter quality controls, evidenced by lower quality level values (such as 0.1 in S14), lead to reduced product waste and better service performance, but require greater investment. These findings highlight that optimizing supply chains for perishable products necessitates a strategic alignment of priorities—whether focused on cost reduction, service excellence, or environmental sustainability—along with corresponding investments in advanced technologies and fleet configuration.

6. Sensitivity Analysis

To assess the effectiveness and applicability of the proposed multi-objective model under dynamic conditions, we conducted sensitivity analyses on three critical parameters: service quality weights ( η 1 and η 2 ), customer demand fluctuations ( d l t ), and product shelf life ( τ ). These parameters were chosen for their direct impact on the trade-offs between cost, service level, and perishability management. This aligns with the model’s focus on balancing economic efficiency, sustainability, and adaptability for perishable products.

6.1. The Effects of the Service Level Weight Allocation ( η 1 : Product Quality vs. η 2 : On-Time Delivery)

To evaluate the impact of prioritizing between product quality and on-time delivery, we conducted a sensitivity analysis by varying the quality weight ( η 1 ) from 0 to 1 (with η 2 = 1 − η 1 ). The analysis was based on the compromise solution S6 ( η 1 = 0.6, η 2 = 0.4), which serves as the baseline for comparing trade-offs between cost and service levels. Table 7 summarizes the key results, and Figure 2 illustrates the variations in total cost and service levels across different η 1   values.
The sensitivity analysis reveals distinct trends in total cost and service level as η1 increases from 0 to 1. Total cost exhibits a U-shaped curve, initially decreasing by 2.58% (from 638,148.31 to ¥654,603.88) as η 1   rises from 0 to 0.4. This reduction is driven by optimized resource allocation in IoT-enabled quality monitoring and mixed fleet coordination, which help decrease spoilage and enhance routing efficiency. During this same range, the service level steadily improves (from 0.789 to 0.920) until η 1   reaches 0.6, reflecting the advantages of proactive perishability mitigation through real-time inventory adjustments and prioritized delivery schedules. However, beyond η 1 = 0.4, total cost reverses its trend, rising by 5.74% (from 639,181.56 to ¥675,233.59 at η 1 = 1.0), while the service level peaks at η 1 = 0.6 (0.920) before declining to 0.879 at η 1 = 1.0. This divergence highlights asymmetric thresholds: cost minimization occurs earlier ( η 1 = 0.4) than service maximization ( η 1 = 0.6), emphasizing the delayed impact of quality-centric investments on operational efficiency.
The staggered peaks arise from differing dynamics in resource utilization. When η 1 < 0.4, cost reduction is the primary focus, as the integration of IoT and hybrid fleets streamlines operations with minimal overhead. However, beyond 0.4 of η 1 , increased investments in high-resolution sensors and EV over deployment inflate energy and infrastructure costs, which can erode efficiency gains. Service levels continue to improve until η1 reaches 0.6, as enhanced quality control reduces spoilage and delays. However, excessive prioritization η 1   beyond 0.6 can disrupt logistical balance; for instance, over-monitoring can extend handling times, and limitations in EV range can delay deliveries. This overload results in a degradation of service despite increased costs. These findings suggest a phased strategy: prioritize cost efficiency when the value is between 0.4 and 0.6 to maintain a balance between service excellence and sustainability. It is advisable to avoid prioritization above 0.6 to prevent destabilizing the balance between economic, environmental, and service factors. This calibration is crucial in volatile markets or under strict carbon regulations, ensuring adaptive resilience in perishable supply chains. Overall, these findings validate the model’s robustness and offer quantitative guidance for dynamically adjusting priorities between quality preservation and delivery timeliness in perishable supply chains.

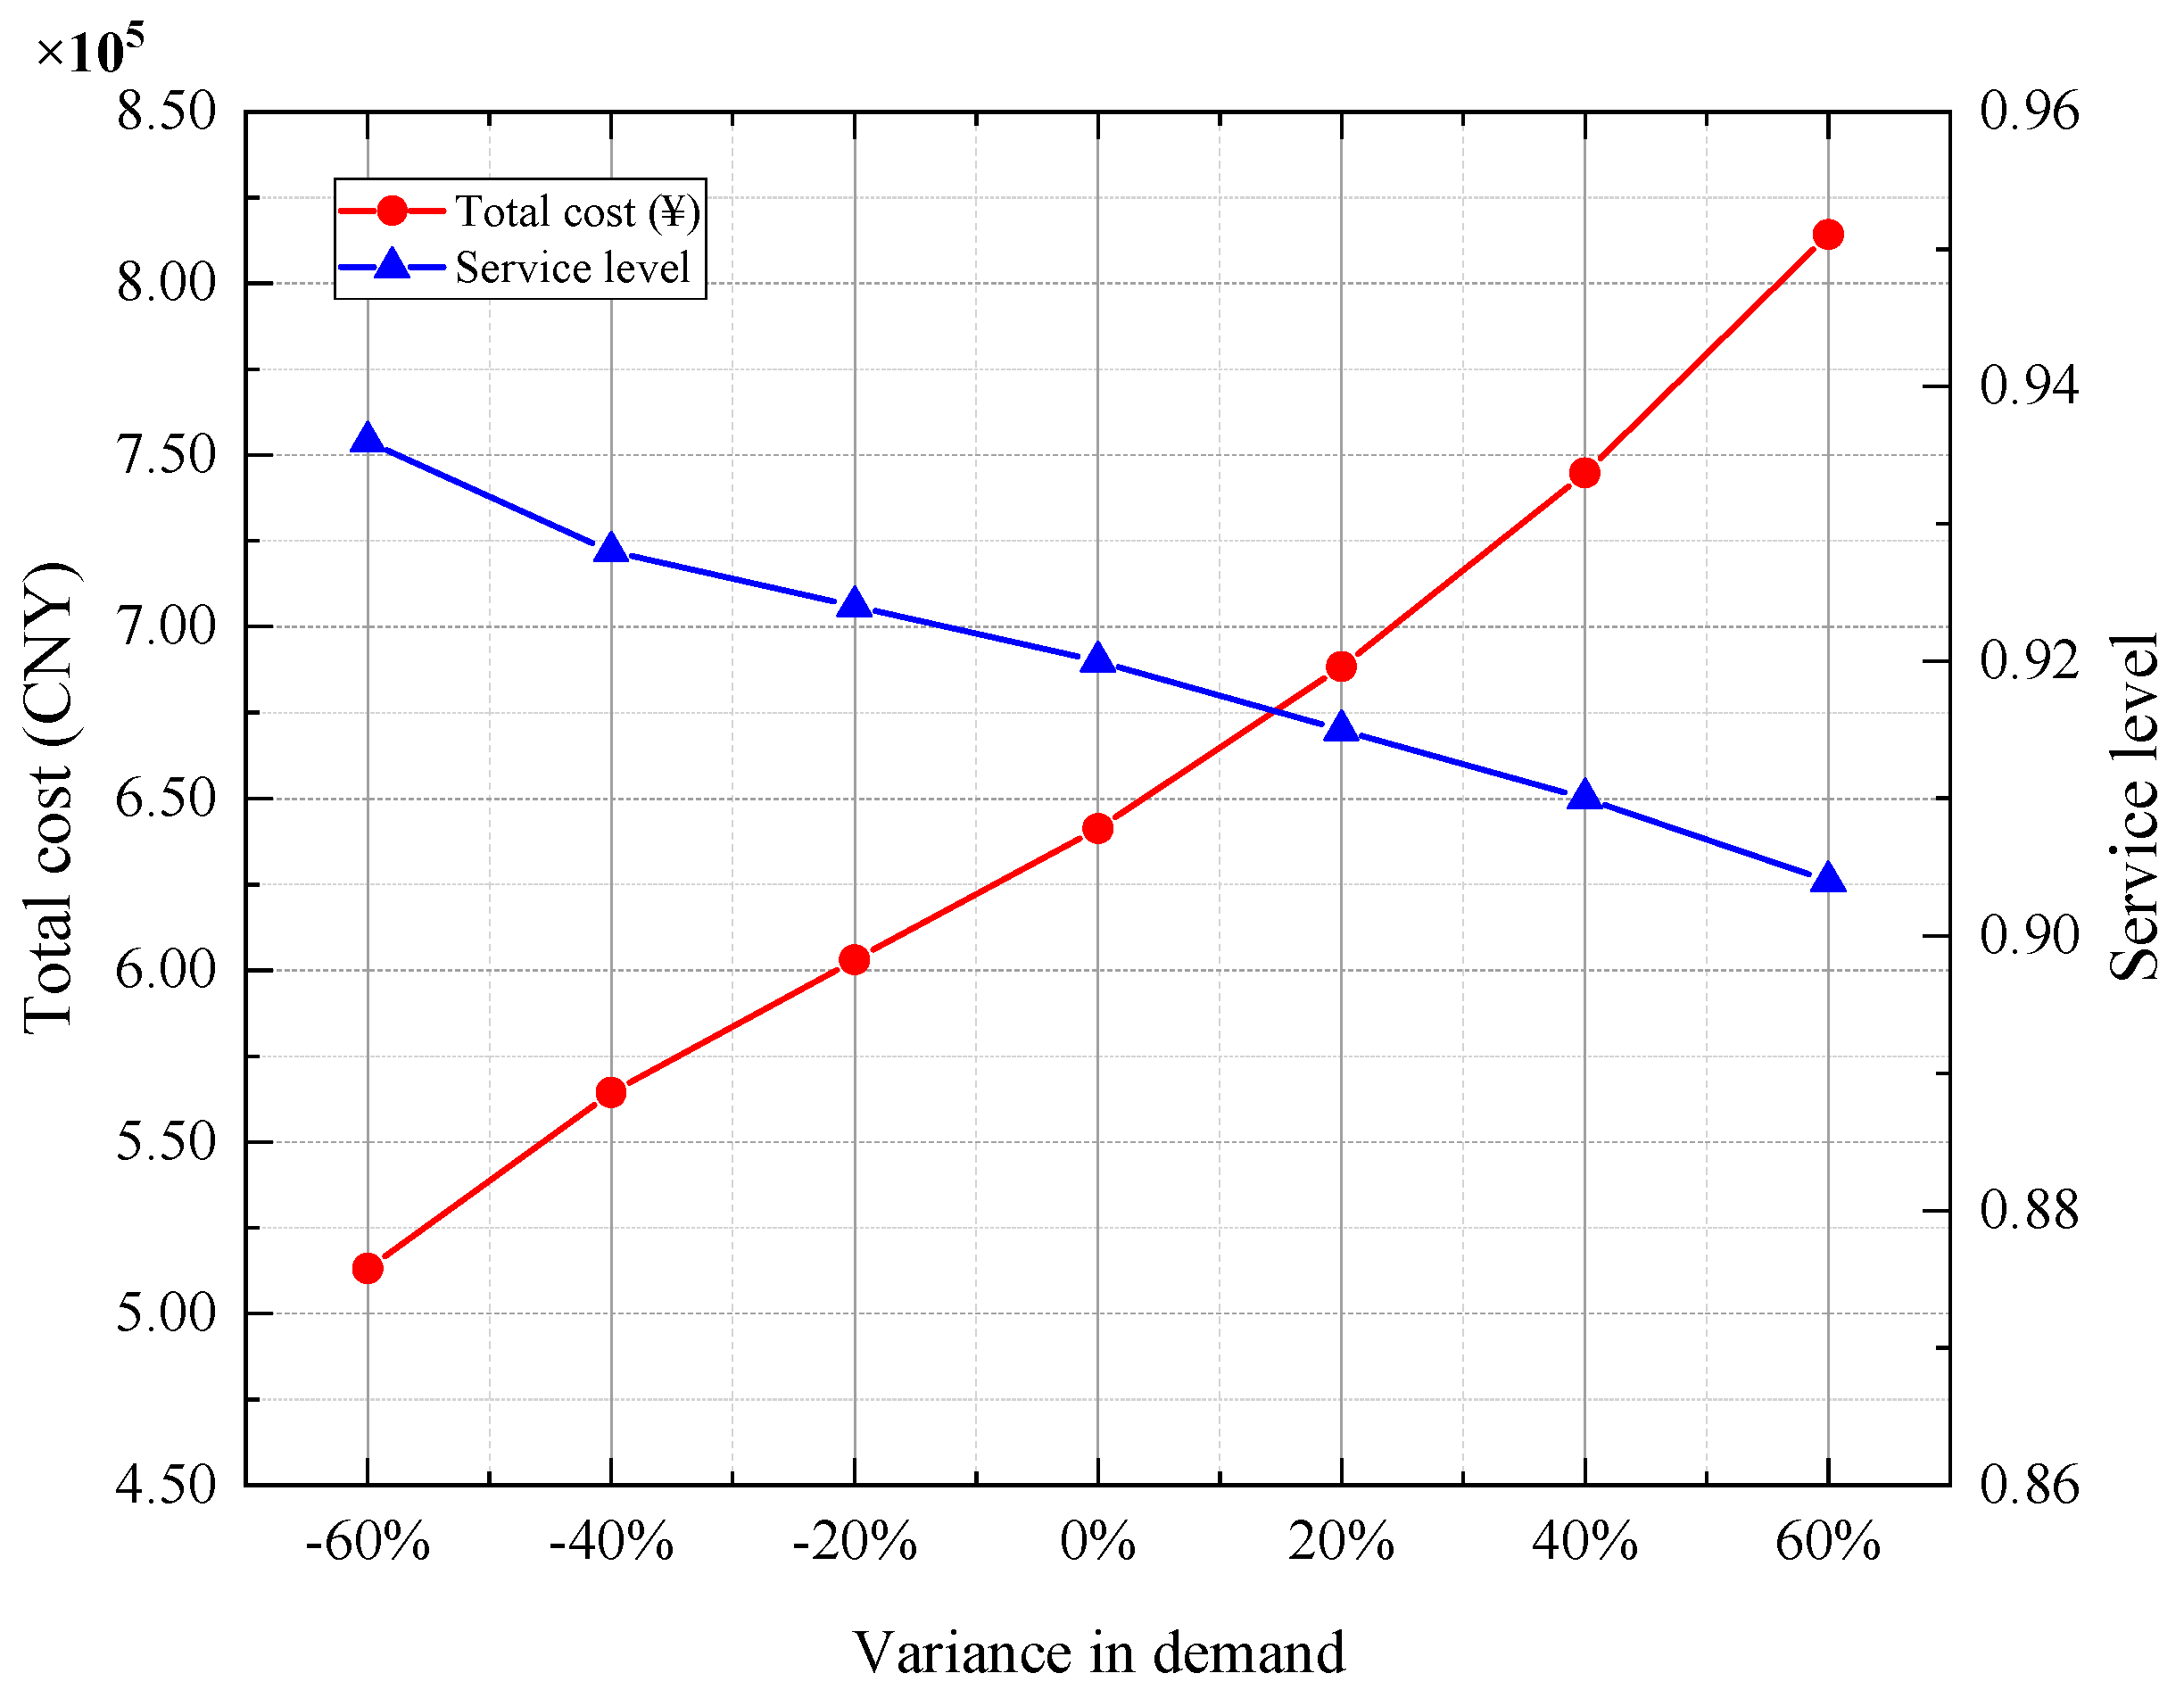
6.2. The Effects of the Demand Variation

To evaluate the robustness of the proposed supply chain network under demand volatility, a sensitivity analysis was conducted by simulating demand fluctuations ranging from −60 to +60%. This analysis was centered around the compromise solution S6, which serves as the benchmark for assessing the trade-offs between cost and service levels. This study examines how total costs and service levels respond to extreme shifts in demand, thereby testing the model’s ability to balance economic efficiency with operational reliability. The findings are presented in Table 8 and illustrated in Figure 3.
As illustrated in Table 8 and Figure 3, the proposed supply chain model reveals a steady increase in total costs, rising from 513,146.15 to ¥814,215.12, in response to demand variations ranging from −60 to +60%. Throughout this range, service levels remain stable within a narrow band of 0.936 to 0.904. The slight degradation in service (3.42% at +60% demand) highlights the network’s ability to manage demand fluctuations through adaptive strategies, even as operational costs increase accordingly.
The sensitivity analysis examines how the supply chain responds to fluctuations in demand, focusing on cost scalability and service stability. With well-structured network configurations, total costs increase linearly as demand rises, primarily due to proportional increases in production volumes, IoT energy consumption, and the use of mixed fleet operations. Despite these cost increases, service levels remain remarkably stable, declining slightly from 0.936 to 0.904 (a reduction of 3.42%) during extreme demand shifts. This robustness is supported by dynamic rerouting algorithms that prioritize EVs for time-sensitive urban deliveries while allocating CVs to handle high-volume routes during periods of increased demand. At the same time, IoT-driven inventory redistribution helps mitigate risks of perishability, even under volatile demand.

6.3. The Effects of the Product Shelf Lives Variation

To assess the robustness of the proposed model under different product shelf life conditions, a sensitivity analysis was performed by varying the shelf life parameter ( τ ) from 3 to 21 periods. The results are presented in Table 9 and illustrated in Figure 4. This analysis was based on the compromise solution S6 ( η 1 = 0.6, η 2 = 0.4), which serves as the baseline for comparing the trade-offs between cost and service level.
The results indicate a nonlinear relationship between the extension of shelf life and the reduction in costs. As the shelf life increases from 3 to 21 periods, total costs initially decrease sharply (from 719,373.13 to ¥605,125.22). This reduction is primarily due to lower spoilage rates and a decreased frequency of replenishment cycles, which help ease the pressures of inventory holding and transportation. At the same time, service levels improve steadily (from 0.902 to 0.940) as extended shelf life reduces quality degradation, allowing for more flexible routing and delivery schedules. However, after reaching τ = 15, the cost savings plateau (from 606,412.98 to ¥605,125.22), suggesting diminishing returns from further improvements in shelf life.
The model demonstrates strong performance in maintaining consistent service levels within a tolerance range of 0.038 (0.902–0.940), despite significant variations in shelf life. This resilience is attributed to the dynamic inventory redistribution enabled by IoT technologies and the optimization of mixed fleets, which help to effectively balance the risks associated with perishability and delivery efficiency. For instance, products with shorter shelf lives ( τ   = 3–7) necessitate precise coordination of EVs routes to ensure timely deliveries. In contrast, products with longer shelf lives ( τ ≥ 15) allow for more economical bulk transportation CVs, without compromising product quality. These findings illustrate the model’s effectiveness in achieving a balance between economic and service objectives across various perishability conditions, providing valuable insights for industries that handle products with differing stability levels.

7. Conclusions and Future Research Directions

This study presents a multi-objective model for designing sustainable supply chain networks for perishable products. It incorporates IoT technology and a mixed fleet of EVs and CVs. The model focuses on striking a balance between minimizing total costs and maximizing service levels, providing a comprehensive framework to improve economic efficiency, environmental sustainability, and operational reliability. Insights gained from a real-world case study and sensitivity analyses demonstrate the model’s robustness and flexibility under different conditions, offering valuable implications for both academic research and industry practices.

7.1. Theoretical Implications

This study makes a twofold contribution to the field of sustainable supply chain management. First, it addresses a gap in existing research by introducing a novel location-inventory-routing model that simultaneously considers the three pillars of sustainability. This comprehensive approach enhances our theoretical understanding of multidimensional optimization in supply chains for perishable products. Second, the integration of IoT technologies with mixed vehicle fleets introduces methodological innovations that demonstrate how real-time monitoring and the coordination of diverse vehicles can reduce the risks associated with perishability, while also lowering carbon emissions.

7.2. Managerial Implications

The results of this study provide practical insights for companies managing supply chains of perishable products, particularly in industries such as food, pharmaceuticals, and agriculture.
  • Managers can achieve a balance between economic efficiency and sustainability by carefully evaluating the trade-offs between minimizing costs and maximizing service levels. This approach ensures optimal operational performance while also meeting sustainability goals. The integration of IoT technologies for real-time monitoring, along with the use of mixed fleets of EVs and CVs, enhances operational efficiency, reduces waste, and lowers carbon emissions. This not only supports business goals but also aligns with broader sustainability efforts.
  • Managers should prioritize costs and service levels while maintaining a reasonable quality balance. Placing too much emphasis on quality beyond a certain point can lead to diminishing returns, higher costs, and decreased service efficiency. By thoughtfully adjusting their focus on quality and delivery, managers can enhance operational performance and resource utilization. This approach ensures that the supply chain maintains a competitive edge in both cost-effectiveness and service level.
  • To achieve supply chain resilience in the face of fluctuations, businesses can effectively manage cost variability while sustaining high service levels during periods of demand volatility. When confronted with significant changes in demand, managers can maintain operational stability by dynamically rerouting and optimizing inventories.
  • Extending shelf life can significantly lower costs and enhance service levels. However, after a certain point, the benefits begin to level off, suggesting diminishing returns. Managers should aim to optimize shelf life to find a balance between cost efficiency and service quality. Furthermore, understanding the trade-offs between short and long shelf lives can help in developing more targeted logistics strategies, ultimately improving cost control and operational efficiency.

7.3. Limitations and Future Research

This study has several limitations. First, the model assumes deterministic factors such as demand, shelf life, and environmental conditions, which may not fully reflect real-world dynamics. In reality, the demand for perishable products is influenced by various factors, including seasonality, disruptions, and price changes. Additionally, shelf life can vary with environmental conditions, and events like inclement weather or traffic delays may affect delivery times. Future work could address these uncertainties by utilizing stochastic programming methods, such as chance-constrained or two-stage stochastic models. Second, the model uses a linear function to represent product quality degradation, which may not adequately capture more complex or nonlinear behaviours, such as microbial growth in food. Incorporating more detailed spoilage models could enhance the accuracy of the analysis. Third, the model does not take into account reverse logistics, such as packaging reuse or product recalls. Including these considerations could help reduce waste and promote resource efficiency. Finally, although the NSGA-II algorithm performs effectively in generating Pareto solutions, future research could explore combining metaheuristic algorithms with machine learning methods—such as reinforcement learning for dynamic routing—to improve computational performance, particularly in real-time applications.

Author Contributions

Conceptualization, L.P.; methodology, L.P.; software, L.P.; validation, L.P., M.S. and X.L.; formal analysis, L.P. and X.L.; investigation, L.P.; resources, M.S. and X.L.; data curation, L.P.; writing—original draft preparation, L.P.; writing—review and editing, L.P., M.S. and X.L.; visualization, L.P.; supervision, M.S.; project administration, L.P. and M.S.; funding acquisition, X.L. All authors have read and agreed to the published version of the manuscript.

Funding

This research was funded by the Teaching Reform Research Project of Xiangtan Institute of Technology (No. 24JG15).

Institutional Review Board Statement

Not applicable.

Informed Consent Statement

Not applicable.

Data Availability Statement

Data are contained within this article.

Conflicts of Interest

The authors declare no conflicts of interest.

References

  1. Rezaali, Z.; Ghodratnama, A.; Amiri-Aref, M.; Tavakkoli-Moghaddam, R.; Wassan, N. Lagrangian relaxation method for solving a new time-dependent production–distribution planning model. Expert Syst. Appl. 2024, 255, 124669. [Google Scholar] [CrossRef]
  2. Biuki, M.; Kazemi, A.; Alinezhad, A. An integrated location-routing-inventory model for sustainable design of a perishable products supply chain network. J. Clean. Prod. 2020, 260, 120842. [Google Scholar] [CrossRef]
  3. Moshtagh, M.S.; Zhou, Y.; Verma, M. Optimal markdown policies for perishable products with fixed shelf life. Int. J. Prod. Res. 2025, 1–31. [Google Scholar] [CrossRef]
  4. Liu, A.J.; Zhu, Q.Y.; Xu, L.; Lu, Q.; Fan, Y.Q. Sustainable supply chain management for perishable products in emerging markets: An integrated location-inventory-routing model. Transp. Res. Part E-Logist. Transp. Rev. 2021, 150, 102319. [Google Scholar] [CrossRef]
  5. Shafiee, M.; Zare-Mehrjerdi, Y.; Govindan, K.; Dastgoshade, S. A causality analysis of risks to perishable product supply chain networks during the COVID-19 outbreak era: An extended DEMATEL method under Pythagorean fuzzy environment. Transp. Res. Part E-Logist. Transp. Rev. 2022, 163, 102759. [Google Scholar] [CrossRef]
  6. Sinha, A.K.; Anand, A. Optimizing supply chain network for perishable products using improved bacteria foraging algorithm. Appl. Soft Comput. 2020, 86, 105921. [Google Scholar] [CrossRef]
  7. Yuvaraj, M.; Basu, R.J.; Prabhu, B.V.; Boppana, S.B.; Kumar, C.G. Design of multi-echelon multi-fruit supply chain network considering multi-compartment reefer trucks to ensure food security. Br. Food J. 2024, 127, 1756–1787. [Google Scholar] [CrossRef]
  8. Song, L.Y.; Wu, Z.Q. An integrated approach for optimizing location-inventory and location-inventory-routing problem for perishable products. Int. J. Transp. Sci. Technol. 2023, 12, 148–172. [Google Scholar] [CrossRef]
  9. Christensen, F.M.M.; Solheim-Bojer, C.; Dukovska-Popovska, I.; Steger-Jensen, K. Developing new forecasting accuracy measure considering Product’s shelf life: Effect on availability and waste. J. Clean. Prod. 2021, 288, 125594. [Google Scholar] [CrossRef]
  10. Jin, X.Y.; Guo, L.Z.; Wang, Y.F.; Huang, W.T.; Wang, X. Flexible PEI functionalized CO 2 sensing system designed for climacteric fruit cold chain quality monitoring. Chem. Eng. J. 2025, 505, 159680. [Google Scholar] [CrossRef]
  11. Bhat, M.A.; Rather, M.Y.; Singh, P.; Hassan, S.; Hussain, N. Advances in smart food authentication for enhanced safety and quality. Trends Food Sci. Technol. 2025, 155, 104800. [Google Scholar] [CrossRef]
  12. Taj, S.; Imran, A.S.; Kastrati, Z.; Daudpota, S.M.; Memon, R.A.; Ahmed, J. IoT-based supply chain management: A systematic literature review. Internet Things 2023, 24, 100982. [Google Scholar] [CrossRef]
  13. Ben-Daya, M.; Hassini, E.; Bahroun, Z. Internet of things and supply chain management: A literature review. Int. J. Prod. Res. 2019, 57, 4719–4742. [Google Scholar] [CrossRef]
  14. Nagarajan, S.M.; Deverajan, G.G.; Chatterjee, P.; Alnumay, W.; Muthukumaran, V. Integration of IoT based routing process for food supply chain management in sustainable smart cities. Sustain. Cities Soc. 2022, 76, 103448. [Google Scholar] [CrossRef]
  15. Tsang, Y.P.; Wu, C.H.; Lam, H.Y.; Choy, K.L.; Ho, G.T.S. Integrating Internet of Things and multi-temperature delivery planning for perishable food E-commerce logistics: A model and application. Int. J. Prod. Res. 2021, 59, 1534–1556. [Google Scholar] [CrossRef]
  16. Chen, W.R.; Zhang, D.Z.; Van Woensel, T.; Xu, G.M.; Guo, J. Green vehicle routing using mixed fleets for cold chain distribution. Expert Syst. Appl. 2023, 233, 120979. [Google Scholar] [CrossRef]
  17. Tsao, Y.C.; Ai, H.T.T. Remanufacturing electric vehicle battery supply chain under government subsidies and carbon trading: Optimal pricing and return policy. Appl. Energy 2024, 375, 124063. [Google Scholar] [CrossRef]
  18. Farooq, A.; Cora, Ö. Current Status and Future Perspectives for Mobility Options Toward Sustainable Transportation With a Focus on Fuel Cells. Wiley Interdiscip. Rev. Energy Environ. 2024, 13, e539. [Google Scholar] [CrossRef]
  19. Yang, W.; Ma, J.H.; Fan, A.; Zhang, J.Y.; Pan, Y.C. Effectiveness of policies for electric commercial vehicle adoption and emission reduction in the logistics industry. Energy Policy 2024, 188, 114116. [Google Scholar] [CrossRef]
  20. Babagolzadeh, M.; Shrestha, A.; Abbasi, B.; Zhang, Y.H.; Woodhead, A.; Zhang, A.M. Sustainable cold supply chain management under demand uncertainty and carbon tax regulation. Transp. Res. Part D Transp. Environ. 2020, 80, 102245. [Google Scholar] [CrossRef]
  21. Cai, J.H.; Jiang, L.; Hu, X.Q.; Ma, X.Y. Supply chain contract design considering carbon tax policy under demand information asymmetry. Manag. Decis. Econ. 2024, 45, 1363–1378. [Google Scholar] [CrossRef]
  22. Kordasiabi, M.C.; Gholizadeh, H.; Khakifirooz, M.; Fathi, M. Robust-heuristic-based optimisation for an engine oil sustainable supply chain network under uncertainty. Int. J. Prod. Res. 2023, 61, 1313–1340. [Google Scholar] [CrossRef]
  23. Zhang, G.T.; Cheng, P.Y.; Sun, H.; Shi, Y.Y.; Zhang, G.Q.; Kadiane, A. Carbon reduction decisions under progressive carbon tax regulations: A new dual-channel supply chain network equilibrium model. Sustain. Prod. Consum. 2021, 27, 1077–1092. [Google Scholar] [CrossRef]
  24. Foroozesh, N.; Karimi, B.; Mousavi, S.M.; Mojtahedi, M. A hybrid decision-making method using robust programming and interval-valued fuzzy sets for sustainable-resilient supply chain network design considering circular economy and technology levels. J. Ind. Inf. Integr. 2023, 33, 100440. [Google Scholar] [CrossRef]
  25. Sogandi, F.; Shiri, M. Metaheuristic algorithms for a sustainable saffron supply chain network considering government policies and product quality under uncertainty. J. Comput. Des. Eng. 2023, 10, 1892–1929. [Google Scholar] [CrossRef]
  26. Fathi, M.R.; Zamanian, A.; Khosravi, A. Mathematical modeling for sustainable agri-food supply chain. Environ. Dev. Sustain. 2024, 26, 6879–6912. [Google Scholar] [CrossRef]
  27. Goodarzian, F.; Navaei, A.; Ehsani, B.; Ghasemi, P.; Muñuzuri, J. Designing an integrated responsive-green-cold vaccine supply chain network using Internet-of-Things: Artificial intelligence-based solutions. Ann. Oper. Res. 2023, 328, 531–575. [Google Scholar] [CrossRef] [PubMed]
  28. Mohammadi, T.; Sajadi, S.M.; Najafi, S.E.; Taghizadeh-Yazdi, M. Multi Objective and Multi-Product Perishable Supply Chain with Vendor-Managed Inventory and IoT-Related Technologies. Mathematics 2024, 12, 679. [Google Scholar] [CrossRef]
  29. Liu, Y.H.; Shi, X.L. Cold chain distribution network design with heterogeneous fleet under carbon reduction policy application effect. Transp. Plan. Technol. 2024, 1–24. [Google Scholar] [CrossRef]
  30. Leng, L.L.; Jin, Q.L.; Chen, T.; Wan, A.P.; Wang, Z. Energy-conserving cold chain with ambient temperature, path flexibility, and hybrid fleet: Formulation and heuristic approach. Int. J. Prod. Res. 2025, 63, 26–50. [Google Scholar] [CrossRef]
  31. Foroozesh, N.; Karimi, B.; Mousavi, S.M. Green-resilient supply chain network design for perishable products considering route risk and horizontal collaboration under robust interval-valued type-2 fuzzy uncertainty: A case study in food industry. J. Environ. Manag. 2022, 307, 114470. [Google Scholar] [CrossRef] [PubMed]
  32. Acevedo-Chedid, J.; Soto, M.C.; Ospina-Mateus, H.; Salas-Navarro, K.; Sana, S.S. An optimization model for routing-location of vehicles with time windows and cross-docking structures in a sustainable supply chain of perishable foods. Oper. Manag. Res. 2023, 16, 1742–1765. [Google Scholar] [CrossRef]
  33. Bortolini, M.; Galizia, F.G.; Mora, C.; Botti, L.; Rosano, M. Bi-objective design of fresh food supply chain networks with reusable and disposable packaging containers. J. Clean. Prod. 2018, 184, 375–388. [Google Scholar] [CrossRef]
  34. Govindan, K.; Jafarian, A.; Khodaverdi, R.; Devika, K. Two-echelon multiple-vehicle location-routing problem with time windows for optimization of sustainable supply chain network of perishable food. Int. J. Prod. Econ. 2014, 152, 9–28. [Google Scholar] [CrossRef]
  35. Diabat, A.; Jabbarzadeh, A.; Khosrojerdi, A. A perishable product supply chain network design problem with reliability and disruption considerations. Int. J. Prod. Econ. 2019, 212, 125–138. [Google Scholar] [CrossRef]
  36. Khazaeli, S.; Jabalameli, M.S.; Sahebi, H. Bi-objective model for multi-level supply chain by focusing on quality of agricultural products: A case study. Kybernetes 2024, 53, 3484–3521. [Google Scholar] [CrossRef]
  37. Seydanlou, P.; Jolai, F.; Tavakkoli-Moghaddam, R.; Fathollahi-Fard, A.M. A multi-objective optimization framework for a sustainable closed-loop supply chain network in the olive industry: Hybrid meta-heuristic algorithms. Expert Syst. Appl. 2022, 203, 117566. [Google Scholar] [CrossRef]
  38. Tolgari, F.S.; Zarrinpoor, N. A robust reverse pharmaceutical supply chain design considering perishability and sustainable development objectives. Ann. Oper. Res. 2024, 340, 981–1033. [Google Scholar] [CrossRef]
  39. Jouzdani, J.; Govindan, K. On the sustainable perishable food supply chain network design: A dairy products case to achieve sustainable development goals. J. Clean. Prod. 2021, 278, 123060. [Google Scholar] [CrossRef]
  40. Heidari, A.; Khalilzadeh, M.; Pamucar, D.; Ecer, F. Accelerating Benders Decomposition for sustainable food closed-loop supply chain network under uncertainty: A case study. Kybernetes 2025, 41. [Google Scholar] [CrossRef]
  41. Golestani, M.; Moosavirad, S.H.; Asadi, Y.; Biglari, S. A Multi-Objective Green Hub Location Problem with Multi Item-Multi Temperature Joint Distribution for Perishable Products in Cold Supply Chain. Sustain. Prod. Consum. 2021, 27, 1183–1194. [Google Scholar] [CrossRef]
  42. Seyedzadeh, Z.; Jabalameli, M.S.; Dehghani, E. Towards a sustainable viticultural supply chain under uncertainty: Integration of data envelopment analysis, artificial neural networks, and a multi-objective optimization model. Sci. Total Environ. 2025, 970, 178980. [Google Scholar] [CrossRef]
  43. Wang, C.N.; Nhieu, N.L.; Chung, Y.C.; Pham, H.T. Multi-Objective Optimization Models for Sustainable Perishable Intermodal Multi-Product Networks with Delivery Time Window. Mathematics 2021, 9, 379. [Google Scholar] [CrossRef]
  44. Meidute-Kavaliauskiene, I.; Yildirim, F.; Ghorbani, S.; Cincikaite, R. The Design of a Multi-Period and Multi-Echelon Perishable Goods Supply Network under Uncertainty. Sustainability 2022, 14, 2472. [Google Scholar] [CrossRef]
  45. Mohamed, N.H.; Khan, S.; Jagtap, S. Modernizing Medical Waste Management: Unleashing the Power of the Internet of Things (IoT). Sustainability 2023, 15, 9909. [Google Scholar] [CrossRef]
  46. Mosallanezhad, B.; Gholian-Jouybari, F.; Cárdenas-Barrón, L.E.; Hajiaghaei-Keshteli, M. The IoT-enabled sustainable reverse supply chain for COVID-19 Pandemic Wastes (CPW). Eng. Appl. Artif. Intell. 2023, 120, 105903. [Google Scholar] [CrossRef] [PubMed]
  47. Salehi-Amiri, A.; Jabbarzadeh, A.; Hajiaghaei-Keshteli, M.; Chaabane, A. Utilizing the Internet of Things (IoT) to address uncertain home health care supply chain network. Expert Syst. Appl. 2022, 208, 118239. [Google Scholar] [CrossRef]
  48. Tavana, M.; Sohrabi, M.; Rezaei, H.; Sorooshian, S.; Mina, H. A sustainable circular supply chain network design model for electric vehicle battery production using internet of things and big data. Expert Syst. 2024, 41, e13395. [Google Scholar] [CrossRef]
  49. Sorooshian, S.; Khiavi, S.F.; Karimi, F.; Mina, H. Link between sustainable circular supply chain and Internet of Things technology in electric vehicle battery manufacturing industry: A business strategy optimization for pickup and delivery. Bus. Strategy Environ. 2024, 33, 8211–8232. [Google Scholar] [CrossRef]
  50. Ekren, B.Y.; Mangla, S.K.; Turhanlar, E.E.; Kazancoglu, Y.; Li, G. Lateral inventory share-based models for IoT-enabled E-commerce sustainable food supply networks. Comput. Oper. Res. 2021, 130, 105237. [Google Scholar] [CrossRef]
  51. Govindan, K.; Salehian, F.; Kian, H.; Hosseini, S.T.; Mina, H. A location-inventory-routing problem to design a circular closed-loop supply chain network with carbon tax policy for achieving circular economy: An augmented epsilon-constraint approach. Int. J. Prod. Econ. 2023, 257, 108771. [Google Scholar] [CrossRef]
  52. Goodarzian, F.; Wamba, S.F.; Mathiyazhagan, K.; Taghipour, A. A new bi-objective green medicine supply chain network design under fuzzy environment: Hybrid metaheuristic algorithms. Comput. Ind. Eng. 2021, 160, 107535. [Google Scholar] [CrossRef]
  53. Tsao, Y.C.; Balo, H.T.; Lee, C.K.H. Resilient and sustainable semiconductor supply chain network design under trade credit and uncertainty of supply and demand. Int. J. Prod. Econ. 2024, 274, 109318. [Google Scholar] [CrossRef]
  54. Jochem, P.; Doll, C.; Fichtner, W. External costs of electric vehicles. Transp. Res. Part D Transp. Environ. 2016, 42, 60–76. [Google Scholar] [CrossRef]
  55. Hammam, A.H.; Nayel, M.A.; Mohamed, M.A. Optimal design of sizing and allocations for highway electric vehicle charging stations based on a PV system. Appl. Energy 2024, 376, 124284. [Google Scholar] [CrossRef]
  56. Zhang, S.Y.; Guan, C.L.; Qiu, Y.G.; Wu, N.J. Multi-objective route optimization of urban cold chain distribution using electric and diesel powered vehicles. Res. Transp. Bus. Manag. 2023, 49, 100969. [Google Scholar] [CrossRef]
  57. Soysal, M.; Belbag, S.; Sel, Ç. A closed vendor managed inventory system under a mixed fleet of electric and conventional vehicles. Comput. Ind. Eng. 2021, 156, 107210. [Google Scholar] [CrossRef]
  58. Xu, X.; Li, F.; Wu, T.; Huang, X.R.; Guan, X.L.; Zheng, T.Y.; Shen, L. Location-routing optimization problem of pharmaceutical cold chain logistics with oil-electric mixed fleets under uncertainties. Comput. Ind. Eng. 2025, 201, 110932. [Google Scholar] [CrossRef]
  59. Leng, L.L.; Wang, Z.; Wan, A.P.; Zhao, Y.W.; Liu, Y.Z.; Zuo, Q. Joint impacts of ambient temperature, path flexibility, and hybrid fleet on energy-conserving supply chain network. J. Clean. Prod. 2023, 423, 138685. [Google Scholar] [CrossRef]
  60. Goli, A.; Tirkolaee, E.B.; Golmohammadi, A.M.; Atan, Z.; Weber, G.W.; Ali, S.S. A robust optimization model to design an IoT-based sustainable supply chain network with flexibility. Cent. Eur. J. Oper. Res. 2023, 1–22. [Google Scholar] [CrossRef]
  61. Deb, K.; Pratap, A.; Agarwal, S.; Meyarivan, T. A fast and elitist multiobjective genetic algorithm: NSGA-II. IEEE Trans. Evol. Comput. 2002, 6, 182–197. [Google Scholar] [CrossRef]
  62. Zhang, L.; Yuan, N.; Wang, J.; Li, J.Z. Research on location-inventory-routing optimization of emergency logistics based on multiple reliability under uncertainty. Comput. Ind. Eng. 2025, 200, 110826. [Google Scholar] [CrossRef]
  63. Roshani, A.; Gholamian, M.R.; Arabi, M. Integrating the triple bottom line of sustainability, resilience strategies, and product perishability consideration to design a pharmaceutical supply chain network: A COVID-19 case study. Rairo-Oper. Res. 2024, 58, 5121–5158. [Google Scholar] [CrossRef]
  64. Gholian-Jouybari, F.; Hajiaghaei-Keshteli, M.; Smith, N.R.; Calvo, E.Z.R.; Mejía-Argueta, C.; Mosallanezhad, B. An in-depth metaheuristic approach to design a sustainable closed-loop agri-food supply chain network. Appl. Soft Comput. 2024, 150, 111017. [Google Scholar] [CrossRef]
  65. Navaei, A.; Taleizadeh, A.A.; Goodarzian, F. Designing a new sustainable Test Kit supply chain network utilizing Internet of Things. Eng. Appl. Artif. Intell. 2023, 124, 106585. [Google Scholar] [CrossRef]
  66. Sadati-Keneti, Y.; Sebt, M.V.; Tavakkoli-Moghaddam, R.; Rahbari, M.; Jafari, M.J. Risk assessment in the supply chain of hazardous materials with carbon cap and trade mechanism: Multi-objective red deer algorithm. Ann. Oper. Res. 2023, 1–41. [Google Scholar] [CrossRef]
Figure 1. Pareto solutions obtained by NSGA-II.
Jtaer 20 00137 g001
Figure 2. Illustrates the trends of total costs and service levels in relation to quality weight.
Jtaer 20 00137 g002
Figure 3. The total cost and service level under varying demands across different scenarios.
Jtaer 20 00137 g003
Figure 4. The total cost and service levels under varying shelf life across different scenarios.
Jtaer 20 00137 g004
Table 1. Summary of the literature on the subject.
AuthorsPerishabilitySustainabilityDecisionsIoTMixed Fleets
EcEnSo-QualitySo-DeliveryLIR
[2]
[37]
[38]
[39]
[40]
[4]
[41]
[25]
[42]
[43]
[44]
[26]
[45]
[47]
[48]
[49]
[60]
[28]
[27]
[16]
[56]
[57]
[58]
[29]
[59]
[30]
This study
Ec denotes the economic dimension, En represents the environmental aspect, So-Quality refers to social sustainability in terms of product quality, and So-Delivery pertains to social sustainability related to delivery timeliness or reliability. L stands for location, I represents inventory, and R indicates routing decisions.
Table 2. Mathematical Notations.
SymbolDefinition
m Manufacturer   index   for   m M
n Production   Capacity   Index   for   Manufacturers   n N
j DC   index   j J
l C ustomer   index   l L
q Quality   level   index   q Q , where 0 represents the freshest product
r IoT   technology   type   index   r R , where 0 indicates that no IoT technology is deployed
v Vehicles type index v V
k Vehicle   size   categories   index   k K
i , i Travel arc index A = i , i : i J : i L i , i : i , i L : i i i , i : i L : i J
t Period index t T
Parameters:
a m Fixed   production   costs   at   manufacturer   m
b m Unit   production   costs   at   manufacturer   m
C m . Production   capacity   of   manufacturer   m
Φ r Deployment   costs   associated   with   implementing   IoT   technology   of   type   r in the system
ς r Average   energy   consumption   required   for   processing ,   recording ,   and   transmitting   data   using   IoT   technology   of   type   r
Θ Price of one unit of energy
f j Fixed   operating   costs   of   DC   j
h j q Unit   inventory   holding   cost   per   period   at   DC   j   with   quality   level   q
τ Shelf life of perishable product
H j Inventory   capacity   of   DC   j
T v k Fixed   transportation   costs   for   vehicle   v   with   size   k per trip
t v k Variable   transportation   cost   per   unit   distance   for   vehicle   v   of   size   k
D m j Transportation   distance   from   manufacturer   m   to   DC   j
D i i T ransportation   distance   from   node   i   to   node   i
ϖ v k Capacity   limitation   of   vehicle   v   with   size   k
d l t Demand   at   customer   l   during   period   t
α m Fixed   production   carbon   emissions   at   manufacturer   m
β m Unit   production   carbon   emissions   at   manufacturer   m
ϑ Carbon emissions per unit of consumed energy
ζ j Fixed   carbon   emissions   of   DC   j
π j q Unit   inventory   holding   carbon   emissions   per   period   at   DC   j   with   quality   level   q
ε m j v Unit   transportation   carbon   emissions   for   vehicle   v   with   size   k
ϵ Unit   carbon   tax   price
ρ l Time   of   serving   customer   l
τ i i Time   of   trip   on   arc   i , i
μ l , σ l Time   window   of   customer   l
e j Earliest   departure   from   DC   j
l j Latest   arrival   at   DC   j
θ , λ , G A sufficiently large number
Decision Variables:
w m t 1   if   p m n t > 0 ; 0, otherwise
x j s 1   if   DC   j operates; 0, otherwise
χ r 1   if   IoT   technology   of   type   r is deployed in the system; 0 otherwise
y m j v k t 1   if   vehicle   v   with   size   k   are   used   from   manufacturer   m   to   DC   j   during   period   t ; 0, otherwise
z i i v k t 1   if   arc   i , i   is   traversed   by   vehicle   v   with   size   k   during   period   t ; 0, otherwise
u l v k t 1   if   customer   l   is   visited   by   vehicle   v   with   size   k   during   period   t ; 0, otherwise
δ l v k r t 1   if   vehicle   v   with   size   k   visits   customer   l   without   the   designated   time   window   during   period   t ,   and   IoT   technology   of   the   type   r is utilized; 0, otherwise
p m n t Production   quantity   of   manufacturer   m   during   period   t
I j q t Inventory   level   with   quality   q   of   DC   j   at   the   end   of   period  
s m j v k t Transportation   quantity   from   manufacturer   m     to   DC   j   by   vehicle   v   with   size   k   during   period   t
ω j v k q t Loaded   quantity   of   perishable   products   with   quality   q   at   DC   j   by   vehicle   v   with   size   k   during   period   t
ϱ i i v k t Loaded   quantity   through   arc   i , i   by   vehicle   v   with   size   k   during   period   t
ψ l v k q r t Quantity   of   perishable   products   with   quality   q   delivered   by   vehicle   v   of   size   k   to   customer   l   during   period   t ,   under   the   deployment   of   IoT   technology   type   r
φ j v k t Departure   time   of   vehicle   v   with   size   k   from   DC   j   during   period   t
ϕ j v k t Return   time   of   vehicle   v   with   size   k   from   DC   j   during   period   t
γ l v k t Arrival   time   of   vehicle   v   with   size   k   from   DC   j   during   period   t
Table 3. Customer demand and time windows (Partial).
Number(Longitude, Latitude)Time Window (a.m.)Demand (kg) Per Period (1–5)
1st2nd3rd4th5th
C 1(112.989, 28.123)[8:00, 8:50]278.94 302.09 282.97 275.57 273.62
C 2(112.927, 28.153)[8:20, 9:40]272.01 298.60 282.34 293.19 294.78
C 3(113.943, 28.175)[7:00, 7:45]227.01 190.16 221.50 230.48 202.35
C 4(112.977, 28.192)[8:00, 8:50]296.48 321.37 308.60 304.63 308.71
C 5(112.995, 28.171)[7:30, 8:20]240.24 262.10 265.92 246.29 259.15
C 6(113.969, 28.179)[8:00, 8:50]268.83 282.21 261.24 277.18 274.39
C 7(113.007, 28.187)[7:20, 7:55]257.99 253.38 267.58 267.38 257.66
C 8(113.032, 28.203)[6:45, 7:15]308.46 310.55 295.12 316.70 298.04
C 9(112.972, 28.200)[8:00, 9:30]209.79 176.90 206.26 179.25 190.80
C 10(112.889, 28.217)[6:30, 7:30]295.32 282.44 293.29 292.45 295.54
Table 4. Manufacturer-to-DC distances (km).
DistancesDC 1DC 2DC 3DC 4DC 5
M 1344327358366351
M 2458474438444457
Table 5. DC-to-customer distances (km, Partial).
DistancesC 1C 2C 3C 4C 5C 6C 7C 8C 9C 10
DC 119.21 30.31 28.89 15.17 11.34 17.86 13.45 13.00 17.65 34.77
DC 221.77 34.84 28.09 14.98 13.18 16.69 14.59 11.36 17.62 21.41
DC 38.93 14.90 21.63 15.71 18.05 14.31 17.44 20.85 16.23 23.96
DC 49.48 23.52 24.13 10.10 8.43 10.82 7.98 5.04 11.16 23.27
DC 511.67 15.60 25.35 9.51 8.80 9.97 6.16 5.73 10.51 24.66
Table 6. Comparative analysis of Pareto solutions.
MetricS1 (Cost-Optimal)S6 (Compromise)S14 (Service-Optimal)
Total Cost (¥)615,229.03641,223.15686,847.03
Service Level0.7750.9200.996
CO2 Emissions (tons)40.3137.6335.98
EVs Utilization (%)29%43%78%
Advanced IoT Deployed (%)64%87%99%
Expected quality level3.51.20.1
Expected on-time delivery rate81.63%93.33%99.64%
Table 7. Variance in total cost and service level with different quality weight coefficients.
η 1 Total Cost (¥)Service Level
0654,603.880.789
0.1647,426.920.829
0.2642,223.750.861
0.3639,151.160.886
0.4638,148.310.904
0.5639,181.560.915
0.6641,223.150.920
0.7647,354.80.916
0.8654,642.150.906
0.9663,843.930.893
1.0675,233.590.879
Table 8. Variance in total cost and service level against demand.
Variance in DemandTotal CostService Level
−60%513,146.150.936
−40%564,285.830.928
−20%602,993.590.924
0%641,223.150.920
20%688,370.520.915
40%744,844.960.910
60%814,215.120.904
Table 9. Variance in total cost and service level based on product shelf life.
Variance in Product Shelf LifeTotal CostService Level
3719,373.130.902
5677,050.80.911
7641,223.150.92
9623,953.520.928
11613,313.840.934
13607,824.260.937
15606,412.980.939
17605,629.950.939
19605,125.710.940
21605,125.220.940
Disclaimer/Publisher’s Note: The statements, opinions and data contained in all publications are solely those of the individual author(s) and contributor(s) and not of MDPI and/or the editor(s). MDPI and/or the editor(s) disclaim responsibility for any injury to people or property resulting from any ideas, methods, instructions or products referred to in the content.

