Article

Development and Validation of a Framework on Consumer Satisfaction in Fresh Food E-Shopping: The Integration of Theory and Data

School of Economics and Management, TianGong University, Tianjin 300387, China
*
Author to whom correspondence should be addressed.
J. Theor. Appl. Electron. Commer. Res. 2025, 20(2), 114; https://doi.org/10.3390/jtaer20020114
Submission received: 20 March 2025 / Revised: 18 May 2025 / Accepted: 22 May 2025 / Published: 26 May 2025

Abstract

:
Consumer satisfaction critically determines the operational sustainability of fresh food e-commerce platforms, yet integrated investigations combining multi-source data remain scarce. This study develops a theory–data fusion framework to identify key satisfaction drivers in China’s fresh e-commerce sector. Utilizing Python-based crawlers, we extracted 1252 online reviews of Aksu apples from a certain fresh produce e-commerce platform alongside 509 validated questionnaires. Through systematic literature synthesis, three core dimensions—perceived value (price–performance balance), platform experience (interface usability), and perceived quality (freshness assurance)—were operationalized into measurable indicators. The final structural equation model reveals that perceived value, platform experience, and perceived quality all have significant positive impacts on consumer satisfaction. This study pioneers a methodological paradigm integrating computational text mining (Octopus Collector + SPSS Pro) with traditional psychometric scales, achieving superior model fit (RMSEA = 0.023, CFI = 0.981). These findings empower platforms to implement a precision strategy. The validated framework provides a theoretical basis for omnichannel consumer research while addressing the data-source bias prevalent in prior studies.

1. Introduction

Fresh food e-commerce refers to online platforms specializing in the sale of perishable agricultural products through cold chain logistics and instant delivery systems [1,2]. These platforms are integral to contemporary society. Data from Whale Staff [3] indicate that the combined online sales of major fresh food e-commerce platforms (e.g., Jindong, Tmall, and Taobao) reached approximately 64 million units and CNY 3.9 billion in February 2024, marking a 30% increase from 2023. This growth rate significantly exceeds that of the broader e-commerce sector, underscoring the substantial potential and dynamism of the fresh food e-commerce market [4,5]. Concurrently, the evolution of these platforms has not only enhanced consumer convenience and efficiency in shopping [6,7] but also spurred the modernization and transformation of the agricultural sector [8,9]. However, fresh food e-commerce platforms face challenges such as market competition [10], supply chain management, and the diversification of consumer demands [2,6]. As consumer satisfaction directly determines repurchase intention and platform loyalty in this high-frequency purchase sector [11], understanding its multidimensional drivers becomes critical for sustaining competitive advantages. As technology progresses and living standards rise [12], consumer demands have evolved from basic sustenance to encompass safety, social interaction, esteem, and self-actualization [13,14,15]. FRESHIPPO (FRESHIPPO is Alibaba’s integrated fresh food supply chain brand, combining online retail, offline supermarkets, and logistics to ensure rapid delivery of perishables.) [16] has garnered a user base with its high-frequency, low-cost, direct-from-orchard model, while Qian Da Ma (Qian Da Ma, a community-based fresh food chain, is renowned for its “no overnight meat” policy and daily inventory clearance strategy. It participated in drafting China’s national standard Agricultural Socialization Service—Community Fresh Store Service Specifications (GB/T 44591—2024), reflecting its industry influence). [17] has established an industry standard with its “no overnight meat” policy. Thus, the ability of fresh food e-commerce platforms to accurately discern and address consumer needs is crucial for achieving a competitive edge.
Consumer satisfaction is a critical construct in e-commerce platform research. Previous studies have provided valuable insights into consumer preferences and satisfaction in the fresh food e-commerce sector. Chinese consumers prefer fresh produce, particularly meat, eggs, vegetables, fish, and seafood [18]. Key product attributes—including nutritional content, certified natural ecological value, origin [19,20], food safety compliance [21], eco-certification [22], and sensory properties [23]—substantially influence consumer satisfaction [24]. Platform factors, including information and system service quality, also play a significant role [25]. Furthermore, product quality [26], pricing, ease of use, reliability [27], responsiveness, service convenience, and personal norms contribute to satisfaction levels [2]. During the COVID-19 pandemic, food safety became a paramount concern for consumers [28]. Additionally, logistical reliability, humanized delivery [29], health commitments, consistent service efforts, and empathic engagement strategies emerged as crucial factors affecting satisfaction in fresh food e-commerce [30]. These findings underscore the complexity and multidimensional nature of factors influencing consumer satisfaction in this domain. However, most existing studies rely on a single data source, with few integrating offline questionnaires and online review data. Existing studies exhibit two key limitations in investigating consumer satisfaction: First, heavy reliance on single data sources—either survey self-reports or online reviews—fails to reconcile stated preferences with actual behavioral data, risking common method bias [31]. Second, the theory–data dichotomy persists, where theoretical models inadequately explain emerging phenomena like pandemic-induced safety concerns [28], while data-driven approaches lack theoretical anchoring. This paper pioneers a novel mixed-methods approach that combines offline questionnaires (N = 509) with big data analytics of 1252 online reviews. This integration enables cross-validation of findings while capturing both stated preferences from surveys and revealed preferences from behavioral data [32,33]. The methodology improves research findings by investigating consumer satisfaction on e-commerce platforms through merging these two data sources, thereby addressing the single-source bias prevalent in existing studies.
This study contributes to current literature by proposing a roadmap to develop an integrated framework with theory and data. Prior studies on customer behavior have struggled between theory-first and empirical-first approaches for a long time. On one hand, the theory-first (TF) methodology is initiated with a literature review, seeking to identify moderators, mediators, extensions, and applications of established effects, often focusing on determining the direction of causal effects [32]. On the other hand, the empirical-first (EF) approach is stimulated by real-world data, enabling the discovery of novel research questions unconstrained by existing theory [32]. To systematically investigate factors influencing customer behavior in the context of online shopping, the dichotomy between theory and data must be reconciled through an integrated framework. This approach ensures that theory provides interpretability for the findings, while data bolsters the relevance and immediacy of the discussion and its implications.
The objective of this study is to construct and validate a consumer satisfaction framework specifically tailored for fresh food e-commerce platforms. The structure of the subsequent sections of this paper is as follows: Section 2 presents a literature review, precedes the preprocessing of data obtained from online crawlers, and culminates in model development based on the aforementioned findings; Section 3 delineates the questionnaire design and the formulation of hypotheses; Section 4 carries out the empirical analysis; Section 5 discusses the results and implications; Section 6 summarizes this study’s conclusions and limitations and suggests directions for future research.

2. Research Background and Model Development

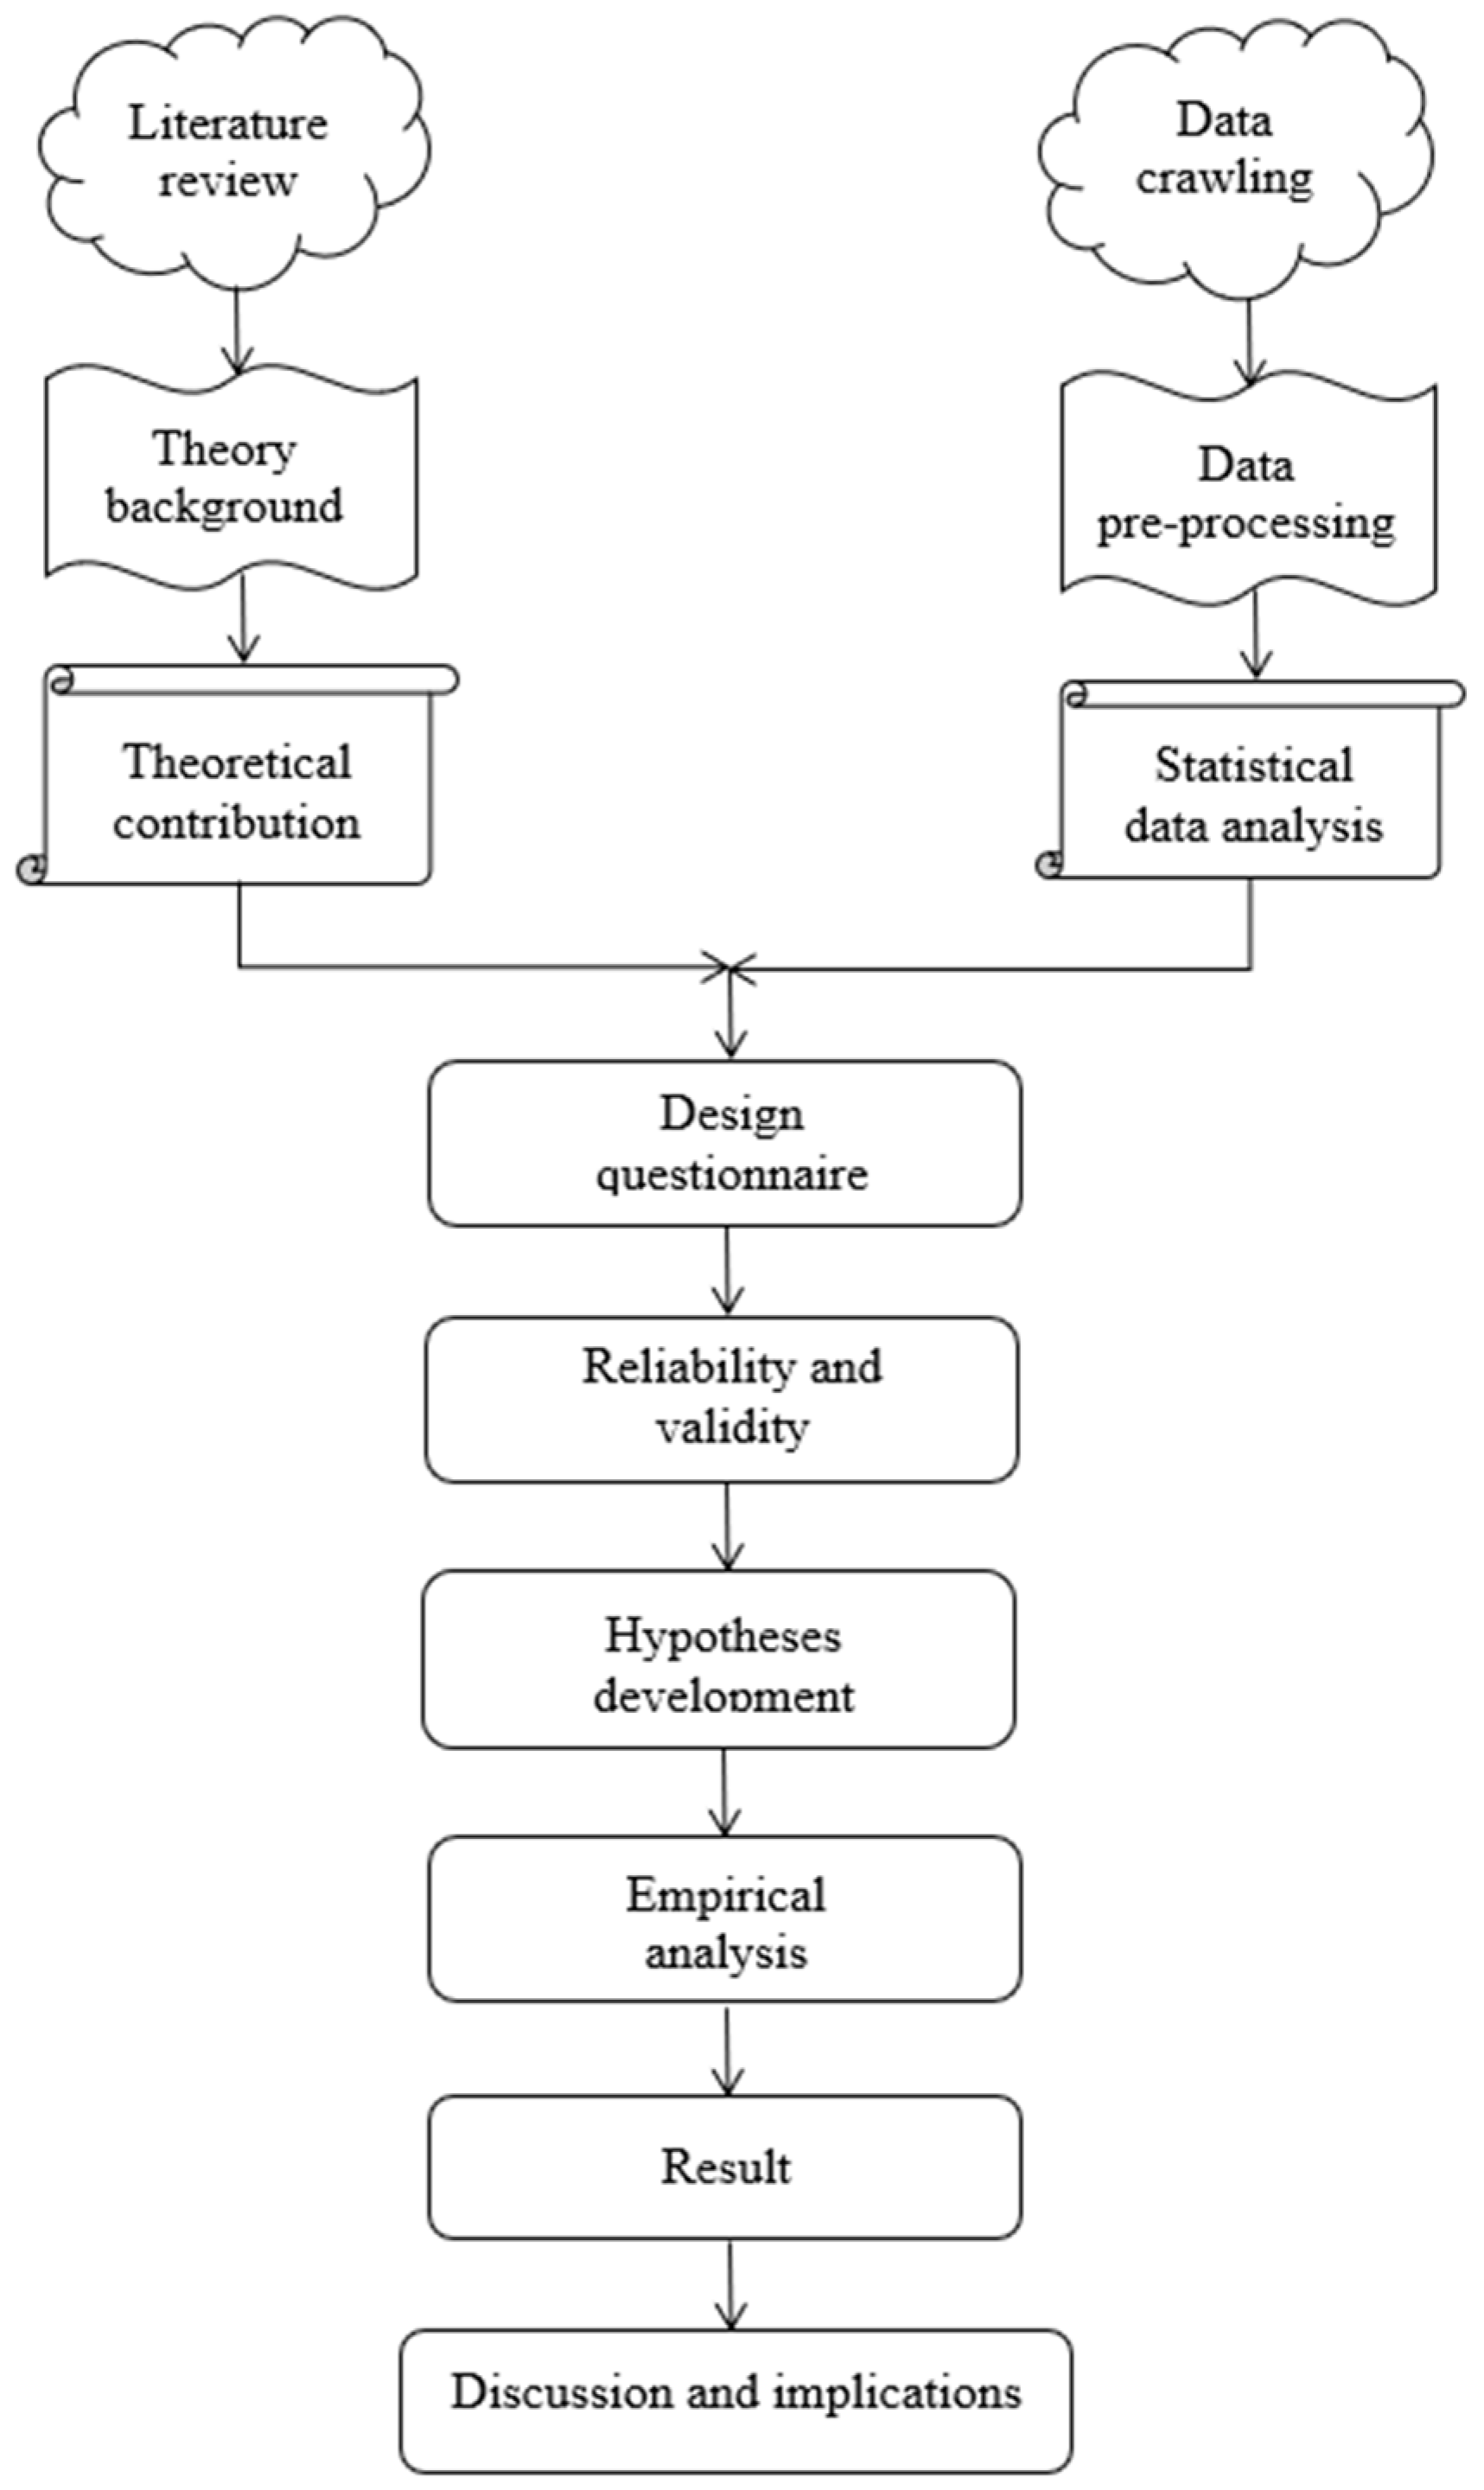
Our roadmap towards an integrated framework is depicted in Figure 1. This study distinguishes itself from prior research. Initially, the satisfaction model and its theoretical underpinnings are elucidated through a literature review, during which the determinants of customer satisfaction are identified. Concurrently, word frequency analysis and statistical processing are conducted on user comment data extracted from online sources. Subsequently, by aligning the factors gleaned from theoretical literature with offline user comment data, a questionnaire is formulated, and reliability and validity analyses are performed to establish the hypotheses of this study. Ultimately, conclusions are drawn from the empirical analysis of the proposed roadmap.
The concept of “integration” in our study title serves as an analogical framework to characterize the interactive relationship between theoretical foundations and empirical evidence. Our analytical framework integrates two dimensions: (1) theoretical constructs grounded in academic literature and (2) empirical patterns identified through semantic analysis of consumer narratives. This two-way interaction mechanism overcomes the constraints of purely deductive or inductive methodologies, providing a comprehensive perspective for understanding consumer satisfaction. In rapidly evolving sectors like fresh food e-commerce, where rigid predefined models often fail to capture market dynamics, the continuous dialogue between theoretical postulation and data calibration significantly enhances the explanatory power of research frameworks.

2.1. Literature Review

2.1.1. Theoretical Foundations of Consumer Satisfaction and Loyalty

Philip Kotler, a pioneer in the field of marketing [34], posited that customer satisfaction reflects the mental state of consumers who feel either pleased or dissatisfied with the actual outcomes of a product when compared to their expectations [35]. Customer satisfaction typically denotes consumers’ post-purchase evaluation grounded in cognitive-affective appraisal processes [36]. Customer satisfaction is inherently dynamic [37]. Although consumers are influenced by both objective and subjective factors, their attitudes toward the same products and services may fluctuate in response to environmental changes and shifts in personal perceptions. Consumer satisfaction is not static; it can vary even when the characteristics of a product brand remain unchanged [38]. Therefore, it is crucial for companies to understand customers’ ongoing needs and tendencies [39] while continuously adapting to market fluctuations and evolving consumer psychology in order to enhance customer satisfaction and maintain a competitive advantage. In addition to focusing on product quality and service levels [40], organizations must also stay attuned to consumer feedback and expectations. This vigilance allows for appropriate adjustments and improvements that ensure customer satisfaction remains consistently high [41].
While this study primarily focuses on satisfaction drivers, the satisfaction–loyalty nexus remains theoretically critical. The expectation–disconfirmation paradigm [36] establishes satisfaction as a prerequisite for loyalty, where cumulative positive experiences foster both attitudinal commitment (preference) and behavioral loyalty (repurchase). Customer loyalty constitutes a dual-dimensional construct encompassing both attitudinal commitment (psychological preference) and behavioral persistence (repeat purchase) [42]. Within the fresh food e-commerce context, loyalty manifests through platform stickiness (frequency of repurchases) and advocacy behaviors (word-of-mouth recommendations). Although loyalty is regarded as a natural outcome of satisfaction, this study focuses more on identifying the antecedent drivers to guide the pre-loyalty strategies for intervention measures.

2.1.2. Comparative Analysis of Classic Satisfaction Models

The American Customer Satisfaction Index (ACSI) establishes satisfaction as a core driver of loyalty through perceived quality, expectations, and value [43]. The European Customer Satisfaction Index (ECSI) extends this framework by emphasizing corporate image as a mediator between satisfaction and loyalty [44]. The Chinese Customer Satisfaction Index (CCSI), tailored to China’s consumer-centric market, prioritizes perceived quality and post-purchase behavior [45]. While these models share a hierarchical structure linking antecedents (e.g., quality, value) to outcomes (loyalty), their cultural and contextual adaptations highlight the need for a hybrid approach in fresh food e-commerce research. Our model synthesizes ACSI’s causal-chain logic, ECSI’s mediation emphasis, and CCSI’s quality centricity, while integrating emergent dimensions from user-generated data (e.g., platform experience) to reflect digital consumption dynamics.

2.1.3. Perceived Value

Perceived value is defined as “the consumer’s overall assessment of the utility of a product based on perceptions of what is received and what is given” [46]. It is achieved by weighing the benefits that customers can identify against the costs of obtaining the product or service [47]. High perceived value typically indicates that customers evaluate the product or service favorably, which subsequently enhances customer satisfaction [48]. Customers are more inclined to experience satisfaction with a product or service when their perceived benefits outweigh the costs incurred [49]. Research has demonstrated that service quality positively influences perceived value, which in turn further impacts customer satisfaction [50]. For instance, the service quality of intellectual property (IP) intermediaries, which are defined as platforms facilitating brand-certified agricultural product transactions [51], manifests through four dimensions: (1) interaction quality, reflecting responsiveness and empathy in customer service [52]; (2) output quality, involving accuracy in order fulfillment such as freshness consistency [25,53]; (3) IT quality, covering system reliability and interface usability [54]; and (4) integration quality, requiring seamless coordination between suppliers and logistics [2,55]. These dimensions collectively enhance customers’ perceived functional value (utilitarian benefits like cost-effectiveness) and affective value (emotional benefits like trust), thereby increasing overall satisfaction [56].
Perceived value serves as a dominant mediator in the relationship between service quality and customer satisfaction, where service quality primarily enhances satisfaction by elevating customers’ perceived value [57,58]. This unidirectional causal chain is empirically supported in fresh food e-commerce contexts: functional value (e.g., cost-effectiveness) mediates the effects of output quality and interaction quality on satisfaction, while affective value (e.g., trust) mediates IT quality and integration quality’s impacts [56]. A secondary feedback loop exists post-purchase: satisfaction retrospectively amplifies perceived value through cognitive reappraisal [59]. For instance, satisfied customers who repurchase or recommend products [60] reinforce their perceived value via social validation [61]. However, this reverse effect (satisfaction → value) is context-dependent and subordinate to the primary mediation.

2.1.4. Platform Experience

Platform experience encompasses the overall perception users have when engaging with a specific platform. This includes various elements such as interface design, interaction fluency, functional utility, content quality, responsiveness, personalization levels, and safety and security measures, among other factors [62]. A positive platform experience can render the usage process enjoyable, convenient, and efficient [63]. An aesthetically pleasing website interface that is clear, user-friendly, and fast significantly enhances customer access and engagement [64]. Providing objective, accurate, comprehensive, and timely information about products or services helps to prevent misleading or deceptive practices while fostering customer trust. Ensuring transaction security along with offering multiple payment options and effective order management features can mitigate perceived risks for customers and enhance their satisfaction during transactions.
A favorable platform experience contributes to increased user satisfaction [65], which in turn encourages more frequent use of the platform, creating a positive feedback loop. Satisfied users are more inclined to become loyal patrons of the platform; they are also likely to engage in word-of-mouth promotion that attracts new users. Conversely, a subpar platform experience diminishes user satisfaction, leading to churn rates increasing while potentially inciting negative word-of-mouth publicity detrimental to the platform’s reputation.

2.1.5. Perceived Quality

Product quality serves as a crucial criterion for consumers in assessing the value of a product, directly influencing their purchasing decisions and overall satisfaction [66]. High-quality products are capable of fulfilling customer needs and delivering positive experiences, thereby enhancing customer satisfaction [67]. Such products offer stable and reliable performance, minimize failure rates and maintenance costs, extend product lifespan, and alleviate customers’ perceived risks. The recognition of high-quality products by customers often translates into loyalty towards the company [68], which subsequently bolsters the company’s brand image and competitiveness through word-of-mouth communication [69].

2.2. Data Crawling and Preprocessing

Data crawler technology is widely used in data collection on major public websites due to its accuracy and efficiency [70]. This technology automatically captures publicly available information on web pages and stores and processes it as needed [71]. During this process, we pay special attention to the legal origin of the data and the protection of user privacy [72].
Specifically, user reviews of Aksu apples were crawled from the public comment section of Jing Fresh (a leading Chinese fresh food e-commerce platform, [Jingxiansheng Akso Apples 5-pound Pack] Jingxiansheng Apples from Xinjiang Akso, net weight 5 pounds, fruit diameter 85–90 mm. Fresh fruits [Market Prices, Quotes, Prices, Reviews]—JD.com (jd.com)) using Octopus Collector, a web scraping tool compliant with the platform’s robots.txt protocol. During the crawling process, we made sure that the collected data were obtained entirely based on public channels and did not involve any personal sensitive information, such as names, contact information, addresses, and other private content [73,74]. At the same time, we strictly de-identified the crawled comment data to ensure that they could not be directly traced back to specific users, thus fully protecting user privacy.
We used Octopus Collector to collect review data and further implement word segmentation processing, word frequency analysis, and word cloud visualization to visually display the service indicators of fresh e-commerce platforms that consumers are more concerned about [75,76].
In this study, Octopus Collector was used to obtain the data of user reviews of Jing xian Sheng Aksu apples on 12 March 2024 from a large online shopping platform. Initially, 1252 data were crawled, and after filtering and eliminating invalid data, 1046 valid reviews were obtained. The data include user comment ID, product name, evaluation star rating, evaluation content, number of likes, number of comments, time of follow-up comments, follow-up comment content, and product attributes.

2.2.1. Sentiment Analysis of Comments

Sentiment analysis of captured user reviews was conducted using Octopus Collector, with sentiment scores ranging from −50 to 50. The analysis showed 84% positive, 11% neutral, and 5% negative. By looking at the sentiment analysis graph, it can be seen that the sentiment scores range from −50 to 50. A score closer to 50 indicates a higher level of user satisfaction and vice versa. According to Figure 2, the review sentiment scores are mainly centered on 0 and above, which indicates that most of the users are satisfied with the Aksu apples.

2.2.2. Analyzing the Text of Good Reviews

Consumers’ concern for product quality is reflected in the reviews, showing satisfaction with taste, freshness, and cost-effectiveness. Consumers are willing to share their love for apples and their willingness to recommend them. To show the positive consumer reviews of Aksu apples, this study screens high-frequency words and generates histograms.
Figure 3 shows that the words that consumers use more frequently, such as “very good”, “pretty good”, “satisfactory”, “worthwhile”, etc., reflecting that the product meets consumers’ needs and is attractive and worth buying. Furthermore, lexical descriptors such as “fresh” (core attribute), intensifier-modified terms (e.g., “very sweet”), and evaluative adjectives (“cheap”, “tasty”) epistemologically manifest consumers’ multidimensional perception patterns, as evidenced through our sentiment-embedded text-mining framework.
The words “sound” and “sufficient” show customers’ expectations and anticipation of the product. Taken together, consumers’ positive ratings show a high level of satisfaction with Aksu apples and indicate that they are willing to continue to buy them and actively recommend them to others, highlighting the level of customer satisfaction with the product.

2.3. Model Development

The linkage between satisfaction and loyalty has been extensively theorized in classic models such as the American Customer Satisfaction Index (ACSI), European Customer Satisfaction Index (ECSI), and Chinese Customer Satisfaction Index (CCSI). ACSI posits that satisfaction directly drives loyalty through reduced complaints and enhanced perceived value [43], while ECSI emphasizes the mediating role of corporate image [44]. CCSI further integrates perceived quality as a core antecedent, reflecting China’s consumer-centric market dynamics [45].
As depicted in Figure 1, our roadmap synthesizes theoretical constructs (CCSI dimensions) with data-driven insights from text mining. For instance, literature-derived variables like perceived quality were operationalized using review keywords (e.g., “fresh” and “tasty” in Figure 3), while platform experience emerged from sentiment analysis of interface-related terms. This dual approach ensures theoretical rigor while capturing real-world consumer concerns.
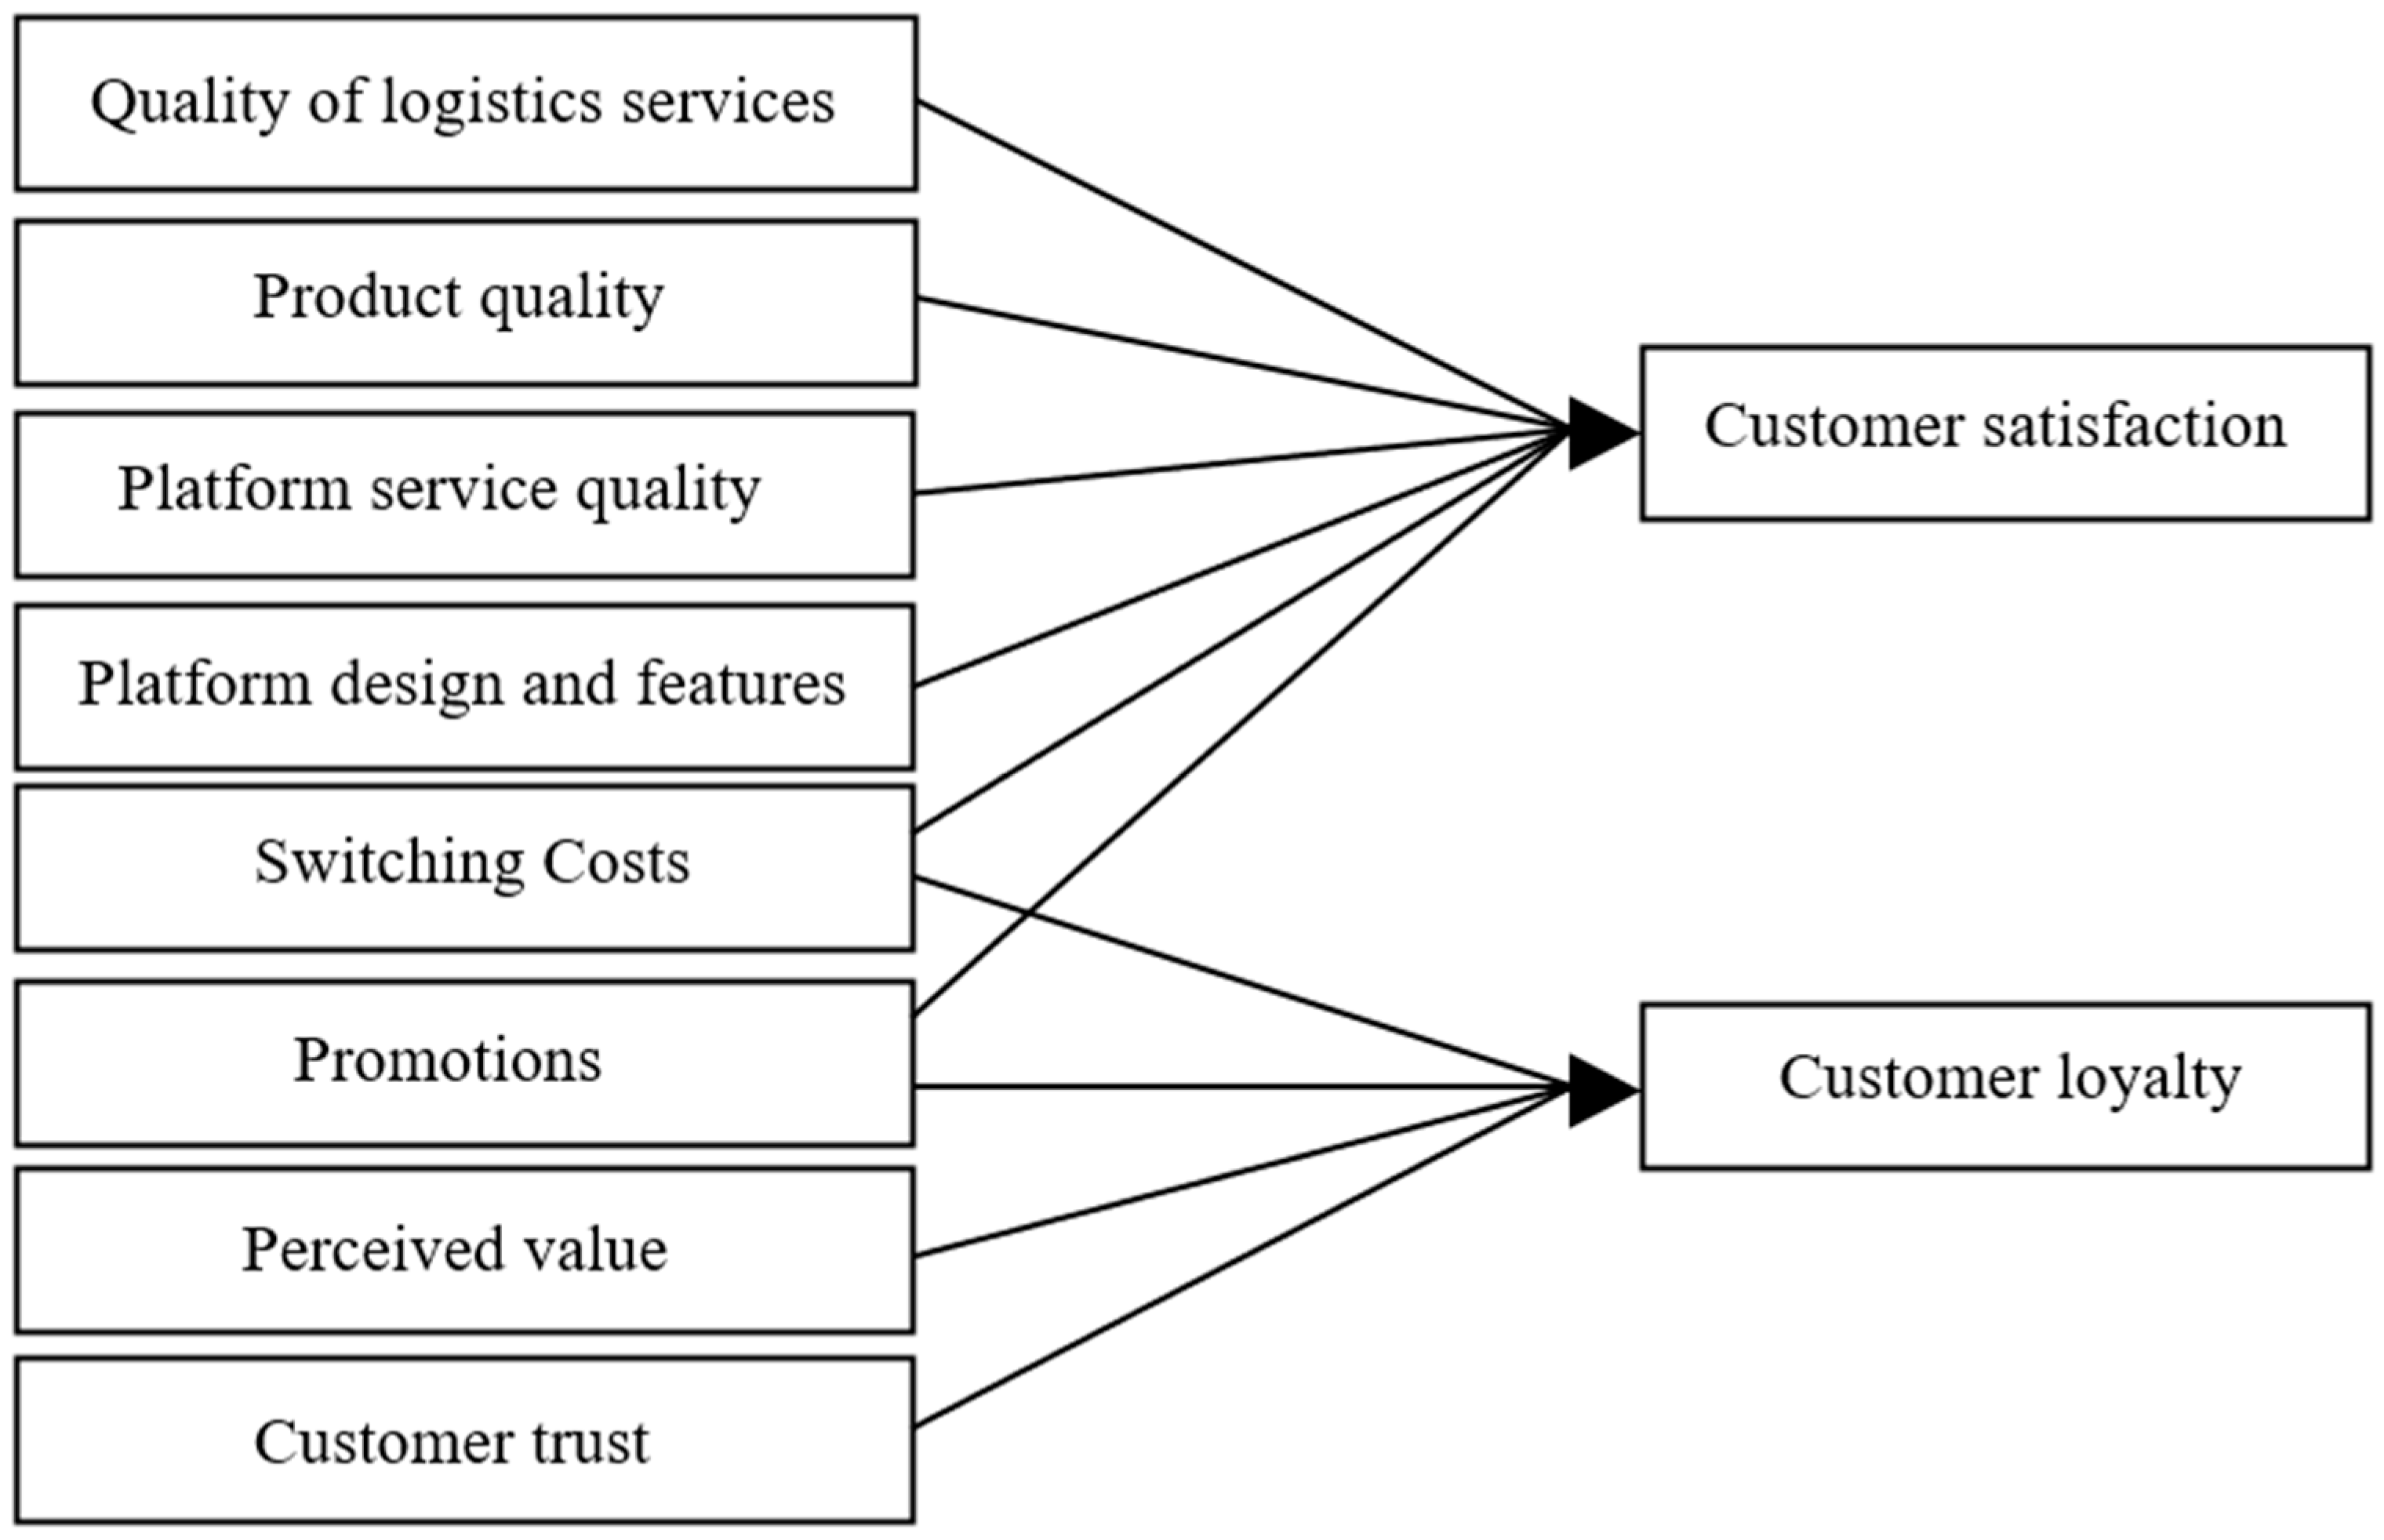
Based on the statistical analysis of consumer reviews and literature materials, the concerns of consumers regarding Aksu apples can be classified into the following ten parts. From the perspective of logistics service quality, consumers pay attention to delivery speed and handling of emergencies. In terms of product quality, consumers are concerned about safety, freshness, brand, and taste. Platform service quality includes customers’ evaluations of problem solving. Platform design includes interface clarity. By analyzing switching costs, discounts and promotions, perceived value, customer trust, satisfaction, and loyalty, we deeply explore consumers’ demands and evaluations of products and services, providing guidance for enhancing customer experience.
Through the analysis, sorting, and summarization of the results in this chapter, it provides a basis for determining satisfaction-related questions in the design of the survey data questionnaire and the selection of models. The model constructed in this paper includes 10 primary dimensions, illustrated in Figure 4. These dimensions comprehensively reflect consumers’ multi-faceted demands and attitudes towards products and platforms. By comprehensively drawing on the ACSI, ECSI, and CCSI models and conducting word frequency analysis on customer reviews through data crawling, we were able to construct the theoretical model we hypothesize, as shown in Figure 4.

3. Questionnaire Analysis and Hypotheses Development

Traditional satisfaction studies often predefine hypotheses based on theoretical models (e.g., ACSI). However, our integrated framework necessitates a phased hypothesis development process. Initial hypotheses were implicitly guided by the literature (Section 2.1) and data-mined dimensions (Section 2.2). The final hypotheses (Section 3.2) were explicitly formulated after principal component analysis (PCA) reclassified variables into four consolidated dimensions (Figure 5). This approach aligns with exploratory sequential mixed methods [77], where quantitative data refine theoretically informed constructs. By adapting our model through data-driven insights, we reduce confirmation bias and strengthen practical relevance, particularly in emerging markets like fresh food e-commerce where empirical benchmarks remain scarce. This iterative refinement process ensures methodological alignment with the dynamic nature of agricultural e-commerce systems.

3.1. Questionnaire Analysis

This part will focus on the design and implementation of the survey. It will include descriptive statistics, reliability and validity analysis, and principal component analysis.

3.1.1. Descriptive Statistics

To ensure the timeliness and validity of the survey results, we specifically selected consumers who have recently purchased fruit on fresh e-commerce platforms [78]. The survey was conducted in Tianjin, China, from 15 April to 20 April 2024. A random sampling method was employed to recruit participants who had purchased fruits on fresh e-commerce platforms within the past three months. In compliance with China’s Personal Information Protection Law (PIPL) [79], the survey did not collect sensitive demographic data (e.g., residential address or settlement type) to protect respondent privacy.
Of the total 509 survey respondents, a slightly higher percentage (50.5%) were male, the primary age group was 26–35 years old (22.2%), the most common education level was a bachelor’s degree (34.0%), the most common monthly income was RMB 5000–8000 (47.7%), and the most common occupation was that of a business employee or manager (36.3%). Table 1 shows the demographic characteristics of the respondents.

3.1.2. Statistical Characteristics of Purchasing Behavior

Of the 509 survey respondents, the vast majority (507, or 99.6%) have had the experience of purchasing fruits from fresh produce e-commerce platforms. In terms of purchase frequency, 159 (31.2%) of them purchased one to three times per month. Purchase concerns showed that a slightly higher proportion of respondents (59.1%) had product quality as their main concern. Table 2 presents the characteristics of respondents’ purchasing behavior.

3.1.3. Reliability Analysis

In this paper, the online tool SPSS Pro (https://www.spsspro.com) was used to conduct a reliability analysis of 10 measurement variables. According to Table 3, the initial Cronbach’s alpha values for sub-dimensions ranged from 0.426 to 0.681, suggesting item refinement needs, while the overall scale (α = 0.927) confirmed high internal consistency. Thus, exploratory factor analysis (EFA) was adopted in the next step.

3.1.4. Validity Analysis

According to Kaiser’s criteria, KMO values were used to assess the structural validity of the questionnaire. KMO values above 0.8 indicate high validity, above 0.7 is better reliability, above 0.6 is acceptable, and below 0.6 is not recommended for low validity [80]. The validity of the questionnaire can be assessed by applying SPSS for factor analysis and combining the KMO value and Bartlett’s spherical test. Please refer to the specific results in Table 4.
Comprehensive validity analysis showed that the KMO values of the 10 variables exceeded 0.5, with an overall KMO value of 0.956, and the significance probability of Bartlett’s test of sphericity was less than 0.05, indicating that the questionnaire had good structural validity. However, the results of the combined reliability and validity analyses showed that the questionnaire questions did not adequately reflect the actual situation, and further optimization of the designed model was recommended.

3.1.5. Exploratory Factor Analysis

As can be seen in Table 5, components 1–4 explain 41.863 percent of the data.
By looking at the rotated component matrix, the model was reclassified into four categories: perceived value relates to customer feelings; platform experience relates to customer satisfaction with the platform; perceived quality relates to the customer’s experience of the products and services upon arrival; and customer satisfaction relates to the maintenance of the relationship between the platform and the customer. The reclassified model is clearer and more accurate, which helps to further understand and optimize the research results.
The items were logically reclassified into four groups based on principal component analysis (PCA), options with loadings below 0.4 were removed, and the model was reclassified into four first-level dimensions [80].

3.2. Hypotheses Development

Our roadmap (Figure 1) operationalizes a mixed-methods framework that triangulates theoretical constructs with empirical data. Phase 1 (theoretical foundation) derives satisfaction determinants from the literature (ACSI/ECSI/CCSI) and identifies gaps through comparative analysis. Phase 2 (data-driven insights) employs web scraping and sentiment analysis to extract user concerns from online reviews, ensuring real-world relevance. Phase 3 (model synthesis) aligns theoretical variables (e.g., perceived quality) with data-mined dimensions (e.g., platform experience) to design a hybrid questionnaire. Phase 4 (validation) utilizes principal component analysis (PCA) to refine the model structure based on survey responses (as shown in Figure 6), enabling hypothesis formulation grounded in both theory and empirical patterns. This iterative process ensures that our hypotheses (Section 3.2) are neither purely deductive nor inductive but emerge from a dialectical integration of top-down and bottom-up approaches. According to the new theoretical model, this paper makes the following assumptions:
H1: 
Perceived value has a significant positive impact on customer satisfaction.
H2: 
Platform experience has a significant positive impact on customer satisfaction.
H3: 
Perceived quality has a significant positive impact on customer satisfaction.
The new model is shown in Figure 5.

4. Results

This part mainly includes the reliability and validity analysis of the new model, CFA model fit test, descriptive statistics and normality test, correlation analysis, SEM model fit test, multiple regression analysis, and finally draws a conclusion.

4.1. Reliability and Validity Analysis

4.1.1. Reliability Analysis

According to the data in Table 6, the Cronbach’s alpha values of each scale are all around 0.7, indicating that they have good reliability. In conclusion, the data from the questionnaires used in this paper demonstrated good reliability, are reliable and stable, and are suitable for further testing [80].

4.1.2. Validity Analysis

Factor analysis was conducted using the online tool SPSS Pro with KMO values and Bartlett’s sphericity test (please refer to the following Table 7). Based on the results of the validity analysis, the KMO values of these 10 variables all exceeded 0.7. This indicates that the scale (compared with Table 4) has relatively high acceptability, and the questions can better reflect the actual situation. The validity test was passed; therefore, the data collected through this questionnaire are valid.

4.2. Structural Equation Model Analysis

4.2.1. CFA Model Fit Test

From the results of the model fitness test in Table 8, the CMIN/DF (chi-squared degrees of freedom ratio) is 1.269, which is in the ideal range, and the RMESA (root mean square of error) is 0.023, which is excellent. The IFI, TLI, and CFI indicators are all more than 0.9, which is at an excellent level. Therefore, the comprehensive analysis results show that the CFA model of customer satisfaction has a good fit.
After confirming the goodness of fit of the CFA model for the customer satisfaction scale, the convergent validity (AVE) and construct reliability (CR) of the dimensions were further assessed. First, the standardized factor loadings of the measurement items on the corresponding dimensions were calculated based on the established CFA model. Then, the AVE and CR values for each dimension were calculated. According to the criteria, AVE needs to reach 0.5 and CR needs to reach 0.7 or more to indicate good convergent validity and construct reliability.
Analysis of Table 9 shows that after the validity test of the customer satisfaction scale, the AVE value of each dimension did not reach 0.5 and the CR value was more than 0.7, while Fornell and Larcker [80] argued that 0.5 is not an absolute criterion, and that at an AVE of slightly less than 0.5 and a combined reliability (CR) of more than 0.6, the scale can still be considered to have good convergent validity. In summary, all dimensions demonstrate strong combinatorial validity and convergent reliability. Therefore, the comprehensive analysis results indicate that the CFA model of customer satisfaction has a good fit, as shown in Figure 6.

4.2.2. Descriptive Statistics and Normality Tests

Table 10 demonstrates the results of the descriptive statistical analyses and normality tests for the factors used in this study. The mean values ranged between 3 and 4 using a positive scale of 1 to 5. The results show that the study participants’ cognitive and behavioral levels in terms of customer satisfaction are above the medium level.
According to Kline’s [80] criterion, the skewness coefficient within an absolute value of 3 and the kurtosis coefficient within an absolute value of 8 indicate that the data are approximately normally distributed. Analysis of Table 10 shows that the skewness and kurtosis coefficients of the question items in this study are within the criteria, indicating that the data are approximately normally distributed.

4.2.3. Correlation Analysis

The correlation among the constructs was examined using Pearson correlation analysis. The results, presented in Table 11, demonstrate a significant correlation between all constructs, with each achieving significance at the 99% level. The correlation coefficients, r, were all greater than 0, indicating that the constructs showed a positive association. This analysis assumes that the data are approximately normally distributed, which was confirmed by the skewness and kurtosis values being within acceptable ranges (see Table 10). The significant positive correlations suggest that higher scores in one construct (e.g., perceived value) tend to coincide with higher scores in others (e.g., platform experience), providing preliminary support for their interrelated roles in influencing customer satisfaction. Notably, the correlation coefficients (r < 0.7) do not indicate severe multicollinearity concerns, ensuring the robustness of subsequent structural equation modeling (SEM) analyses.

4.2.4. SEM Model Fitness Tests

Without the inclusion of covariates, the results of hypothesis testing concerning the path relationships in the SEM model for factors influencing customer satisfaction are presented in Table 12. According to the analysis results displayed in Table 12, perceived value exhibits a significant positive effect on customer satisfaction (β = 0.414, p < 0.01), thereby supporting hypothesis H1. Additionally, platform experience also demonstrates a significant positive impact on customer satisfaction (β = 0.263, p < 0.01), which supports hypothesis H2. Furthermore, perceived quality has a substantial positive influence on customer satisfaction (β = 0.493, p < 0.01), thus corroborating hypothesis H3. The structural relationships among these variables were presented in a visual way in the analysis of structural equation model, as shown in Figure 7.
According to Table 13, the adjusted R-square is 0.542, which indicates that the explained variables account for 54.2 percent of the total variables. This means that three factors such as perceived value, platform experience, and perceived quality explain 54.2% of the variation in customer satisfaction. This result further supports the regression effect. In addition, the VIF values in the multiple regression analysis ranged from 1–5, indicating that there was no significant covariance between the variables.
As shown in Table 13, the standardized regression coefficients for the subscale items measuring perceived value, platform experience, and perceived quality demonstrate statistically significant positive effects (β > 0, p < 0.05). This suggests that perceived value, platform experience, and perceived quality have a significant positive effect on customer satisfaction, supporting the validity of hypotheses H1, H2, and H3.

5. Discussion and Implications

5.1. Main Effect

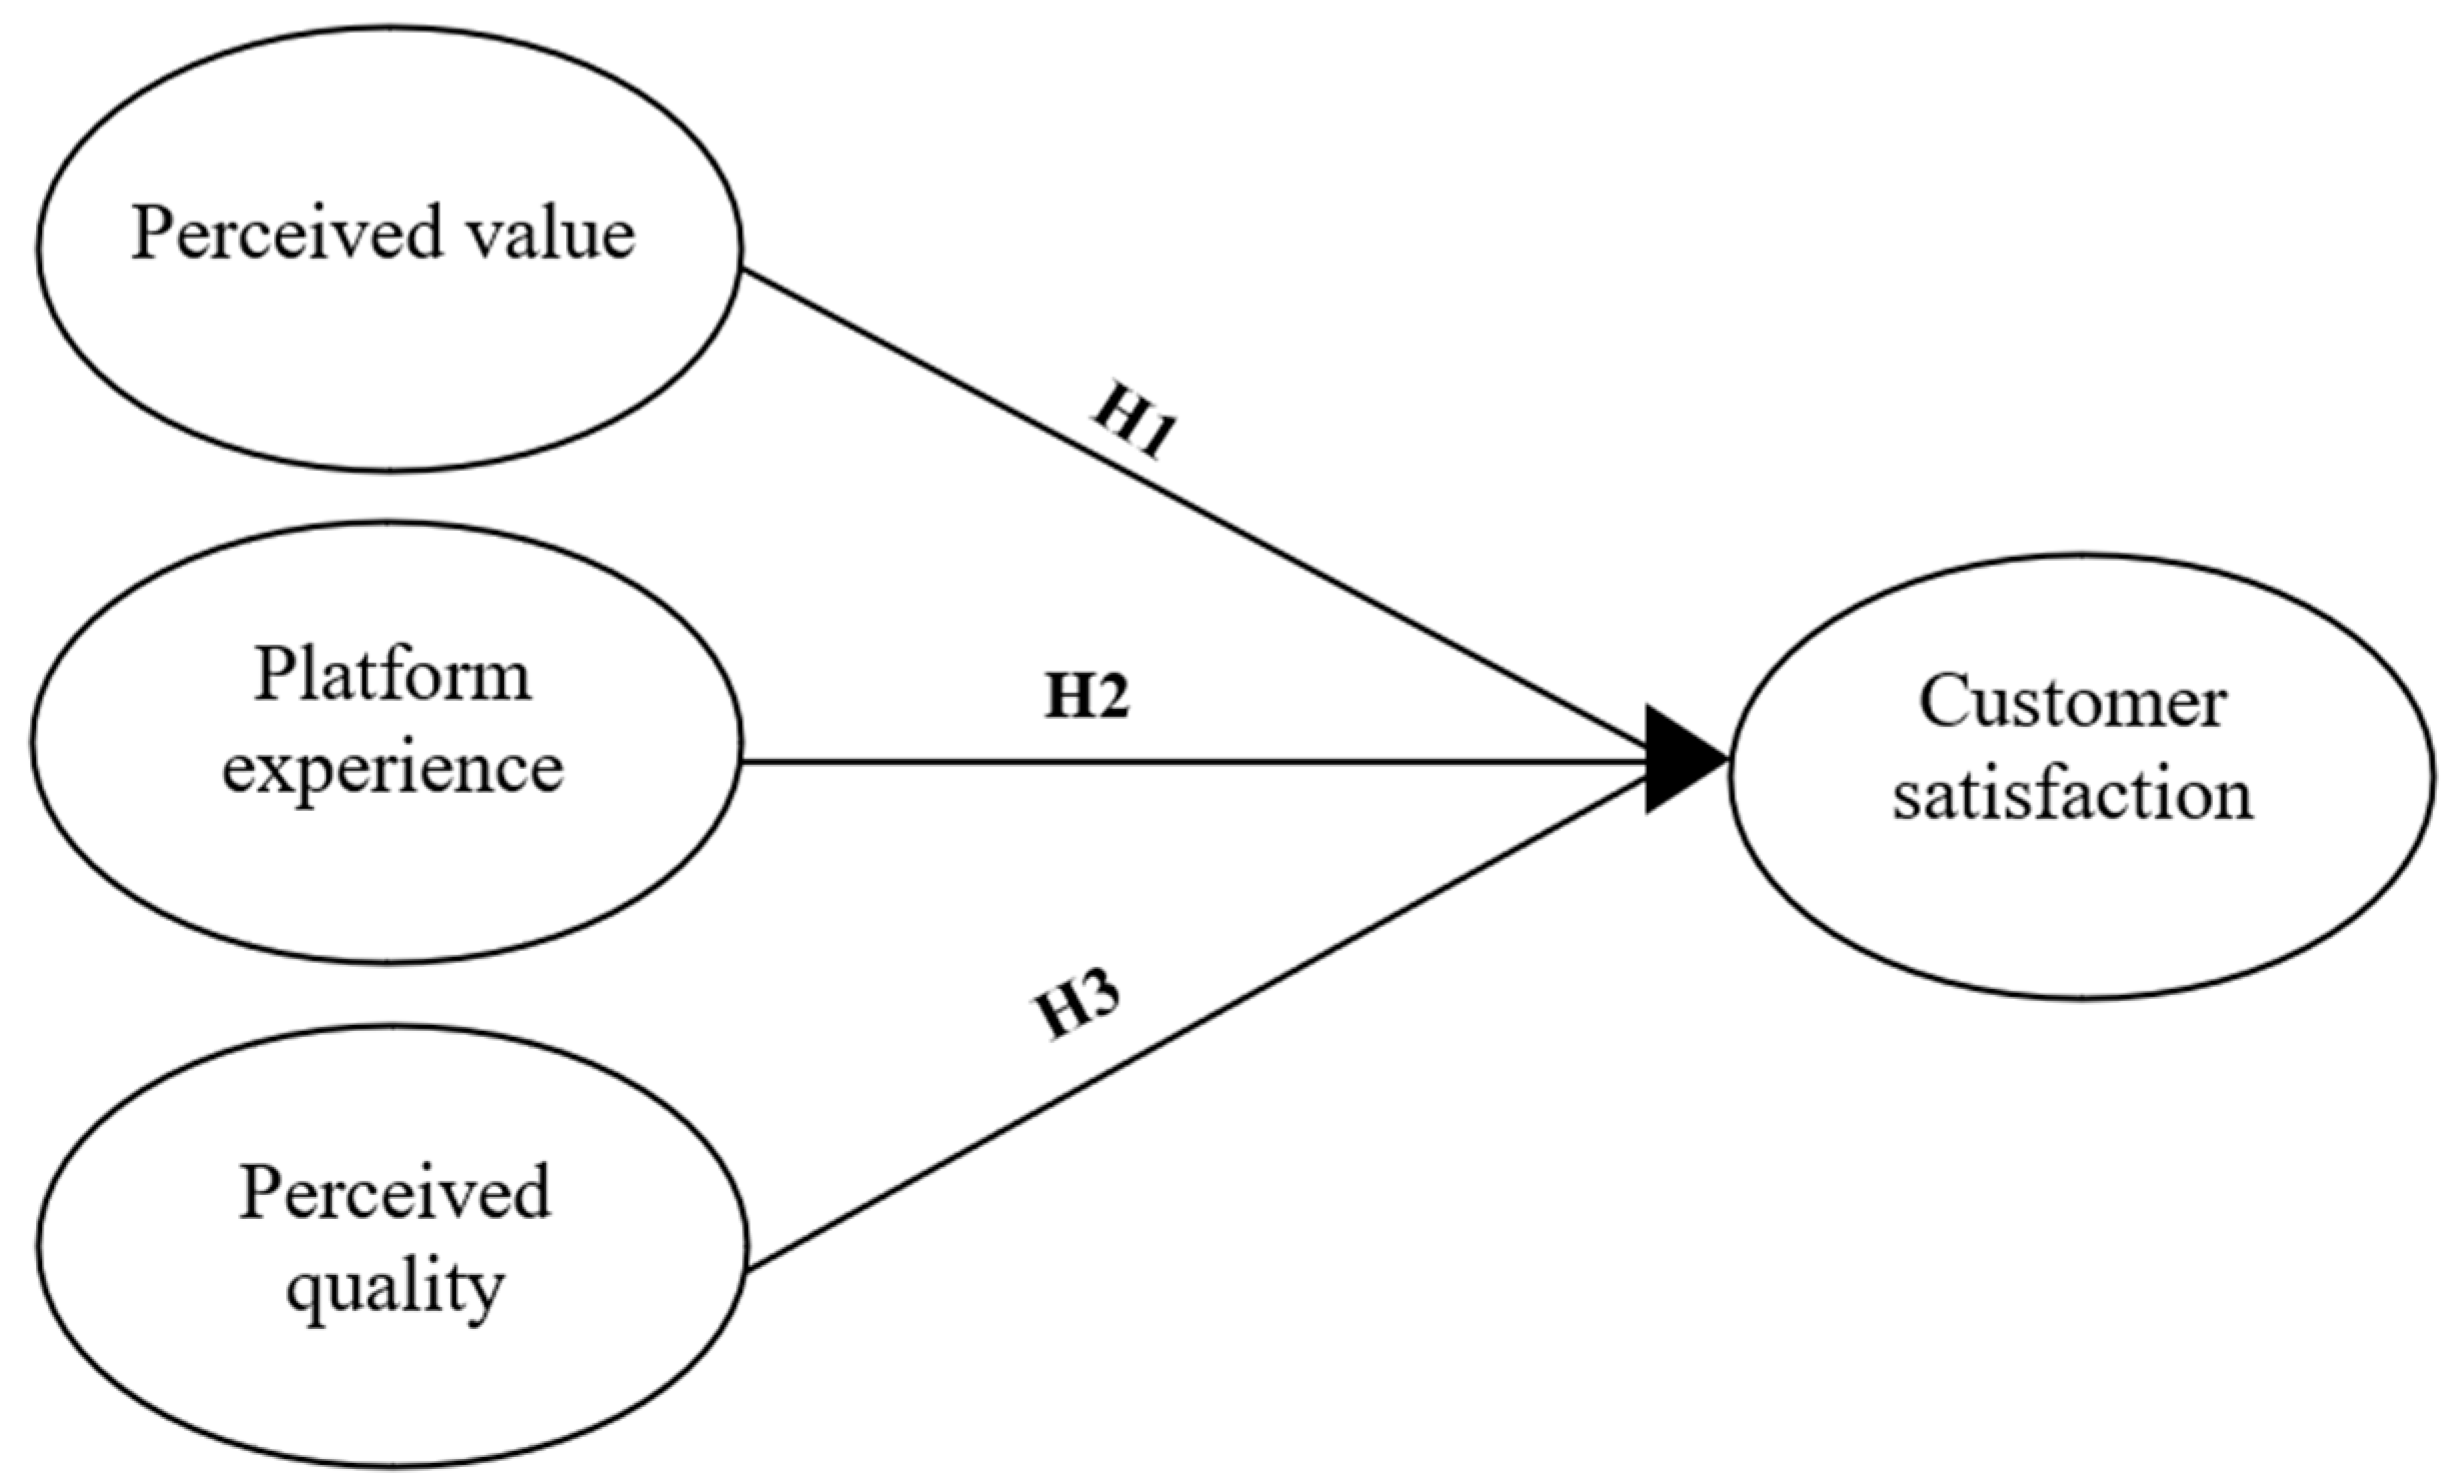
The findings of this study reveal that perceived value, platform experience, and perceived quality exert positive influences on customer satisfaction. This research offers empirical evidence that consumers conduct a comprehensive assessment of the value-for-money proposition associated with a product or service throughout their purchasing journey. In the context of the fresh food e-commerce sector, consumers exhibit concern not merely for the product price [81] but also for factors such as quality [2], freshness, nutritional value, and ancillary services like expedited delivery and superior packaging [82].
H1 posits that perceived value exerts a positive and significant influence on consumer satisfaction. It is observed that consumer satisfaction escalates when e-commerce platforms provide fresh produce that is both high-quality and cost-effective [83,84]. To remain competitive in the market, fresh food e-commerce platforms need to engage and retain consumers through promotional activities, membership programs, and enhanced brand development, thereby augmenting customer-perceived value [2]. Concurrently, enhancing the transparency of product information, including details on direct sourcing and organic certifications, is essential to ensure that customers perceive value for money.
Secondly, H2 verified that platform experience is an important factor influencing consumer satisfaction. This variable is determined by external variables such as system design characteristics, user characteristics, and task characteristics [85]. In the digital era, consumers are also increasingly demanding convenience [86], interactivity, and personalization in the shopping process [23,87]. Therefore, e-commerce platforms can improve consumers’ sense of ease of use and reduce barriers and inconveniences in the shopping process by providing customized service interfaces, fast order processes, and convenient shopping experiences. At the same time, personalized recommendation services are provided to push relevant products based on users’ purchase history and preferences to improve shopping efficiency and satisfaction [29,88,89]. In addition, companies should strengthen after-sales service [90], such as responding quickly to customer inquiries and providing convenient return and exchange services.
Finally, H3 confirms that strengthening perceived quality management is a key factor in improving consumer satisfaction. Surveys show that product quality and freshness are the two aspects consumers are most concerned about in the fresh food e-commerce space [91]. Consumers are more inclined to buy products with a strict quality control system [92], including whether the goods sold comply with relevant standards [93]. Strictly controlling the quality of products to ensure the freshness [94], safety, and taste of the fresh produce sold can better meet consumer expectations [95,96], and product quality can be ensured from the source by establishing its own supply chain system and cooperating with high-quality suppliers [97]. In addition, logistics and distribution capabilities should be strengthened to ensure that products are delivered to customers in a timely manner and in good condition [98]. At the same time, consumer satisfaction should be enhanced through continuous improvement and innovation.

5.2. Theoretical Implications

This study advances consumer satisfaction research by integrating classic satisfaction models (ACSI/ECSI/CCSI) with data-driven text mining, a novel synthesis that addresses the limitations of purely deductive or inductive approaches. Prior studies often rely on predefined theoretical constructs (e.g., ACSI’s perceived quality) or isolated text analytics of user reviews. This research innovatively integrates offline questionnaire data, where consumers highlight price sensitivity, with online review data, which reveals that logistics speed significantly influences satisfaction. Such integration not only augments this study’s comprehensiveness but also bolsters the reliability of the findings, offering a more nuanced direction for optimization in e-commerce platforms and assisting them in enhancing user experience to gain a competitive edge.
This study provides valuable insights and empirical evidence for future research in related domains. Firstly, the methodology of integrating multi-source data deserves further exploration and application, particularly in the realm of consumer behavior studies. By amalgamating data from various sources, researchers can attain a more holistic and intricate comprehension of consumer requirements and behavioral tendencies. Secondly, online user review analysis, as an emerging technique in data mining, holds substantial promise for application. This study utilizes big data analytics to scrutinize user reviews, underscoring the considerable potential of such data in understanding consumer behavior, identifying market trends, and refining operational strategies. Fresh food e-commerce platforms should capitalize on big data and artificial intelligence technologies to thoroughly extract user information, accurately identify customer needs, and offer personalized services along with targeted marketing. The investigation of its application scenarios and efficacy across different sectors remains a vital area for further research. Lastly, this study emphasizes the significance of bridging theory with practice. It is only through a robust integration of theoretical insights with empirical evidence that more scientifically sound and rational conclusions, coupled with actionable recommendations, can be formulated.

5.3. Managerial Implications

This study offers several insights into pertinent management practices. Firstly, it has been determined that perceived value is a pivotal variable in enhancing consumer satisfaction. Consequently, merchants should endeavor to augment consumers’ perceived value. By tailoring actions to product characteristics and platform features, merchants could implement targeted and persuasive measures, such as enhancing product quality and refining platform design, to fulfill consumers’ functional shopping needs and thereby boost their utility value. Additionally, merchants should bolster pre-sale and post-sale services, promptly address consumer issues, dispel doubts about the platform or products, and render shopping more comfortable and convenient, allowing consumers to derive psychological satisfaction from the shopping experience. Concurrently, efforts should be made to cultivate emotional value. For instance, by optimizing the response speed of pre-sales consultation (such as through intelligent customer service systems) and the after-sales service system (such as the worry-free return and exchange policy), the risk perception of consumers can be reduced, thereby enhancing their psychological utility.
Secondly, our analysis reveals that product quality and platform attributes are significant determinants of elevated consumer satisfaction. Consumers place the highest priority on the quality of fresh products, particularly their freshness and nutritional value. Consequently, companies must strengthen the supervision and management of the fresh product production process to ensure health and nutritional integrity, eschew artificial additives, and embrace environmentally sustainable production and packaging methods. In terms of the platform, information quality is paramount, succeeded by system and service quality. Enterprises should therefore refine platform page design, ensure the accuracy and timeliness of platform information updates, simplify the consumer search process, and introduce personalized features catering to various consumer groups. These measures are designed to augment customer satisfaction and loyalty, thereby conferring a sustainable competitive edge to the platform. Furthermore, it is necessary to meet the logistics of the emergency-handling demands of consumers. This requires the platform to establish an elastic supply chain mechanism. For instance, through regional warehouse layout and real-time logistics monitoring, the delivery time can be shortened. In addition, solutions should be proactively pushed out during abnormal events (such as weather delays) to maintain trust.

6. Conclusions

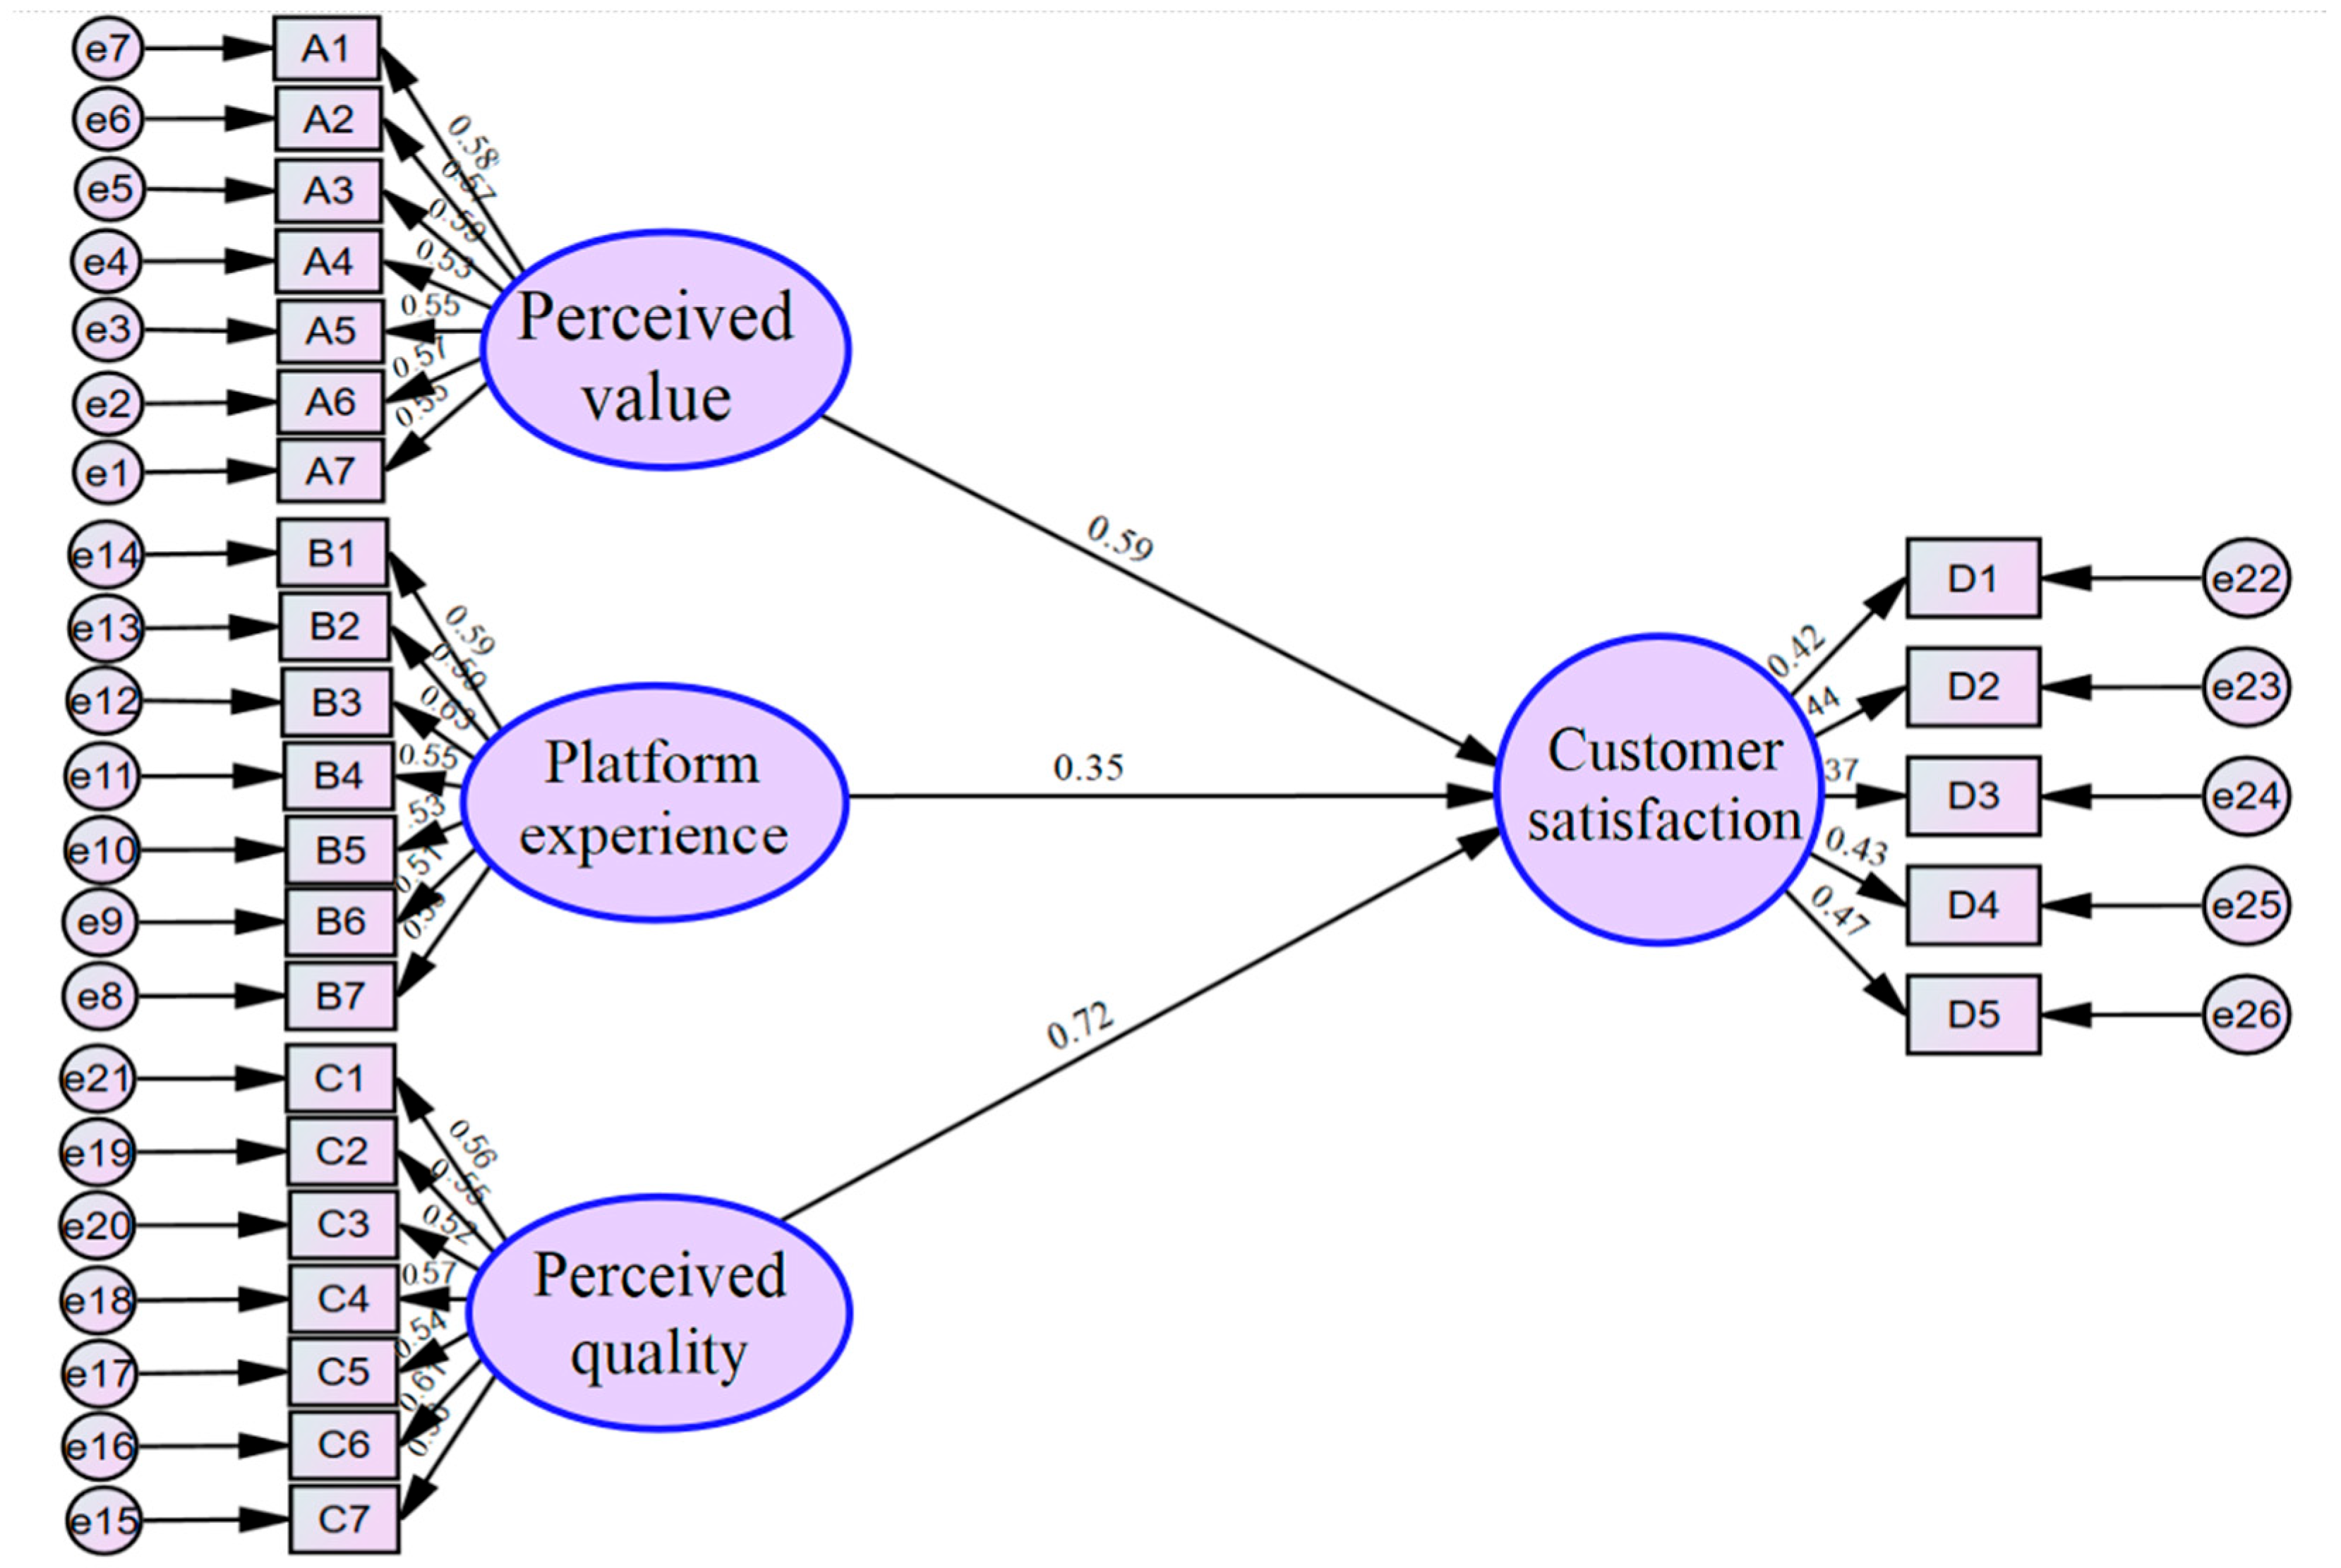
This study contributes significantly to our understanding of consumer satisfaction in the field of fresh food e-commerce by examining the role of perceived value, platform experience, and perceived quality. Our findings reveal a nuanced interplay between these variables, demonstrating that all three dimensions exert statistically significant positive effects on customer satisfaction (β = 0.414, 0.263, and 0.493, respectively; p < 0.01). By integrating multi-source data—including 509 validated questionnaires and 1252 online reviews—our framework bridges the theory–data dichotomy prevalent in prior studies, offering a replicable methodology for hybrid analysis in emerging markets.
By integrating data from multiple sources and sophisticated data-mining techniques (e.g., online user review analysis), we emphasize the importance of a holistic analysis of consumer behavior. Theoretically, this study emphasizes the need for future research to apply multi-source data methods and big data analytics to enhance the understanding of consumer needs and preferences and identify market trends. In terms of management, our study provides actionable insights: merchants should improve product quality, especially freshness and nutritional value, improve platform design, and enhance pre-sale and after-sale services in order to increase perceived value and enhance customer satisfaction and loyalty. In summary, our comprehensive framework integrates theoretical insights and empirical evidence to provide scientifically sound conclusions and feasible recommendations for researchers and practitioners in the rapidly evolving field of fresh food e-commerce. Future research should build on these foundations to further refine our understanding and develop innovative strategies.
The limitations of this study are manifested in three aspects: Firstly, the questionnaire design primarily focused on measuring “Product quality” and “Product prices”; therefore, other potential consumer concerns (e.g., data privacy, delivery flexibility) were not systematically explored. Secondly, the research conclusions are based on single-time-point data from the Chinese market (509 questionnaires and 1252 online comments), and the limited volume of online reviews may constrain the robustness of text-mining results, as larger datasets are typically recommended for such analyses. Additionally, their cross-cultural universality needs to be verified through comparisons of samples from multiple countries. Finally, the long-term transmission path of enterprise innovation mechanisms on satisfaction has not been fully tracked. Future research should (1) construct dynamic panel models to identify time-varying effects; (2) expand to emerging markets (e.g., Southeast Asia) and mature markets (e.g., the European Union) for cross-regional comparisons; and (3) explore collaborative evolution mechanisms between organizational innovation and consumer behavior changes.

Author Contributions

Conceptualization, Y.R., Y.Q. and J.L.; methodology, Y.R., Y.Q. and J.L.; software, Y.R. and Y.Q.; validation, Y.R., Y.Q. and J.L.; formal analysis, Y.R., Y.Q. and J.L.; investigation, Y.R. and Y.Q.; resources, Y.R. and F.Z.; data curation, J.L.; writing—original draft preparation, Y.R., Y.Q. and J.L.; writing—review and editing, Y.R., Y.Q. and F.Z.; visualization, Y.Q. and J.L.; supervision, Y.R. and F.Z.; project administration, Y.R. and F.Z.; funding acquisition, Y.R. All authors have read and agreed to the published version of the manuscript.

Funding

This research was funded by the National Natural Science Foundation of China (NSFC), grant numbers 72261147706 and 72171166.

Institutional Review Board Statement

The study was conducted in accordance with the Declaration of Helsinki, and approved by the Tian Gong University’s Academic Committee (date of approval 17 April 2025).

Informed Consent Statement

Informed consent was obtained from all subjects involved in the study.

Data Availability Statement

Data will be shared on request.

Conflicts of Interest

The authors declare no conflicts of interest.

References

  1. Liu, X.; He, Y.; Hooshmand Pakdel, G.; Li, S. Dynamic optimization of e-commerce supply chains for fresh products with blockchain and reference effect. Technol. Forecast. Soc. Change 2025, 214, 124040. [Google Scholar] [CrossRef]
  2. Liu, M.; Jia, W.; Yan, W.; He, J. Factors influencing consumers’ repurchase behavior on fresh food e-commerce platforms: An empirical study. Adv. Eng. Inform. 2023, 56, 101936. [Google Scholar] [CrossRef]
  3. Staff, W. Report on Future Development Trends of Fresh Food E-Commerce (Fresh Comprehensive E-Commerce Market Data Analysis). 2024. Available online: https://blog.csdn.net/jingcanmou_data/article/details/136907222 (accessed on 20 June 2024). (In Chinese).
  4. Zhao, K.; Shi, H.; Zhang, Y.Y.; Sheng, J. Fresh Produce E-Commerce and Online Shoppers’ Purchase Intention. Chin. Econ. 2021, 54, 415–429. [Google Scholar] [CrossRef]
  5. Wang, X.; Almajed, R. Distribution Route Planning of Fresh Food E-commerce Based on Ant Colony Algorithm. In Tenth International Conference on Applications and Techniques in Cyber Intelligence (ICATCI 2022); Abawajy, J.H., Xu, Z., Atiquzzaman, M., Zhang, X., Eds.; Springer International Publishing: Cham, Switzerland, 2023; pp. 211–219. [Google Scholar]
  6. Wang, S. Study on Cold Chain Logistics Operation and Risk Control of Fresh e-Commerce Products. Adv. Multimed. 2022, 2022, 7272370. [Google Scholar] [CrossRef]
  7. Fu, X.; Avenyo, E.; Ghauri, P. Digital platforms and development: A survey of the literature. Innov. Dev. 2021, 11, 303–321. [Google Scholar] [CrossRef]
  8. Wang, Y.; Yang, A.; Li, Y.; Yang, Q. Effect of e-commerce popularization on farmland abandonment in rural China: Evidence from a large-scale household survey. Land Use Policy 2023, 135, 106958. [Google Scholar] [CrossRef]
  9. Sahil, S. The Impact Of Digital Transformation On Retail Management And Consumer Behavior. IOSR J. Bus. Manag. 2024, 26, 6–14. [Google Scholar] [CrossRef]
  10. Gao, D.; Yu, K.; Zhang, X.; Jiang, Z.; An, H. Research on Hema Fresh Agricultural Products E-commerce Operation Strategy. Front. Humanit. Soc. Sci. 2023, 3, 154–159. [Google Scholar] [CrossRef]
  11. Pu, M.; Cui, L.; He, S. The factors influencing customer loyalty in fresh food e-commerce based on fuzzy sets of qualitative comparative analysis. J. Ind. Manag. Optim. 2025, 21, 1673–1685. [Google Scholar] [CrossRef]
  12. Wang, J.; Xu, S.; Zhang, S.; Sun, C.; Wu, L. Research on the Impact of Consumer Experience Satisfaction on Green Food Repurchase Intention. Foods 2023, 12, 4510. [Google Scholar] [CrossRef]
  13. Xing, J.; Zhang, J.; Wang, X. Understanding the Chinese online fresh agricultural market through the extended technology acceptance model: The moderating role of food safety trust. Asia Pac. J. Mark. Logist. 2024, 36, 1576–1594. [Google Scholar] [CrossRef]
  14. Loh, D.; Wrathall, J.; Schapper, J. The Maslow Revival: Maslow’s Hierarchy of Needs as a Motivational Theory; Monash University, Faculty of Business and Economics, Department of Management: Melbourne, Australia, 2000. [Google Scholar] [CrossRef]
  15. Lester, D. Maslow’s hierarchy of needs and personality. Personal. Individ. Differ. 1990, 11, 1187–1188. [Google Scholar] [CrossRef]
  16. Observer, B. FRESHIPPO Launches “High-Frequency, Low-Priced Strategy” with 25 Stores in Shanghai. Available online: https://zhuanlan.zhihu.com/p/27299145 (accessed on 14 April 2024). (In Chinese).
  17. News, Y.E. Auntie Qian, Who Doesn’t Sell Overnight Meat, Guards Everyone’s Happiness with Freshness. Available online: https://m.thepaper.cn/baijiahao_18619108#:~:text=2012%E5%B9%B4%EF%BC%8C%E9%92%B1%E5%A4%A7,%E9%B2%9C%E8%A1%8C%E4%B8%9A%E4%B8%80%E7%82%AE%E8%80%8C%E7%BA%A2%E3%80%82 (accessed on 13 April 2024). (In Chinese).
  18. Wang, O.; Simon, S. Consumer adoption of online food shopping in China. Br. Food J. 2018, 120, 2868–2884. [Google Scholar] [CrossRef]
  19. Marion, H.; Luisa, M.; Sebastian, R. Adoption of Geographical Indications and origin-related food labels by smes—A systematic literature review. Clean. Circ. Bioeconomy 2023, 4, 100041. [Google Scholar] [CrossRef]
  20. Thøgersen, J. How does origin labelling on food packaging influence consumer product evaluation and choices? A systematic literature review. Food Policy 2023, 119, 102503. [Google Scholar] [CrossRef]
  21. Luo, X.; Xu, X.; Chen, H.; Bai, R.; Zhang, Y.; Hou, X.; Zhang, F.; Zhang, Y.; Sharma, M.; Zeng, H.; et al. Food safety related knowledge, attitudes, and practices (KAP) among the students from nursing, education and medical college in Chongqing, China. Food Control 2019, 95, 181–188. [Google Scholar] [CrossRef]
  22. Grunert, K.G.; Aachmann, K. Consumer reactions to the use of EU quality labels on food products: A review of the literature. Food Control 2016, 59, 178–187. [Google Scholar] [CrossRef]
  23. De Canio, F.; Fuentes-Blasco, M. I need to touch it to buy it! How haptic information influences consumer shopping behavior across channels. J. Retail. Consum. Serv. 2021, 61, 102569. [Google Scholar] [CrossRef]
  24. Lin, J.; Li, T.; Guo, J. Factors influencing consumers’ continuous purchase intention on fresh food e-commerce platforms: An organic foods-centric empirical investigation. Electron. Commer. Res. Appl. 2021, 50, 101103. [Google Scholar] [CrossRef]
  25. Wang, H.H.; Han, X.; Jiang, Y.; Wu, G. Revealed consumers’ preferences for fresh produce attributes in Chinese online markets: A case of domestic and imported apples. PLoS ONE 2022, 17, e0270257. [Google Scholar] [CrossRef]
  26. Bowen, A.; Grygorczyk, A. Chapter 17—Consumer eating habits and perceptions of fresh produce quality. In Postharvest Handling, 4th ed.; Florkowski, W.J., Banks, N.H., Shewfelt, R.L., Prussia, S.E., Eds.; Academic Press: San Diego, CA, USA, 2022; pp. 487–515. [Google Scholar] [CrossRef]
  27. Font-i-Furnols, M.; Guerrero, L. Consumer preference, behavior and perception about meat and meat products: An overview. Meat Sci. 2014, 98, 361–371. [Google Scholar] [CrossRef] [PubMed]
  28. Pu, X.; Chai, J.; Qi, R. Consumers’ Channel Preference for Fresh Foods and Its Determinants during COVID-19—Evidence from China. Healthcare 2022, 10, 2581. [Google Scholar] [CrossRef] [PubMed]
  29. Miao, M.; Jalees, T.; Zaman, S.I.; Khan, S.; Hanif, N.-u.-A.; Javed, M.K. The influence of e-customer satisfaction, e-trust and perceived value on consumer’s repurchase intention in B2C e-commerce segment. Asia Pac. J. Mark. Logist. 2022, 34, 2184–2206. [Google Scholar] [CrossRef]
  30. Yang, Y.; Ma, Y.; Wu, G.; Guo, Q.; Xu, H. The Insights, “Comfort” Effect and Bottleneck Breakthrough of “E-Commerce Temperature” during the COVID-19 Pandemic. J. Theor. Appl. Electron. Commer. Res. 2022, 17, 1493–1511. [Google Scholar] [CrossRef]
  31. Podsakoff, P.M.; MacKenzie, S.B.; Lee, J.-Y.; Podsakoff, N.P. Common method biases in behavioral research: A critical review of the literature and recommended remedies. J. Appl. Psychol. 2003, 88, 879–903. [Google Scholar] [CrossRef] [PubMed]
  32. Golder, N.P.; Marnik, G.D.; An, J.T.; Harald, J.v.H.; Darren, S.U.K.; Joseph, W.A. Learning from Data: An Empirics-First Approach to Relevant Knowledge Generation. J. Mark. 2022, 87, 319–336. [Google Scholar] [CrossRef]
  33. Lall, D. Mixed-Methods Research. Indian J. Contin. Nurs. Educ. 2021, 22, 143–147. [Google Scholar] [CrossRef]
  34. Ellitan, L.; Sonbay, R.R. Keterkaitan antara Service Quality, Customer Satisfaction, Customer Loyalty dan Perceived Value: Kasus Handphone Merk Samsung di Surabaya. JIIP—J. Ilm. Ilmu Pendidik. 2022, 5, 4813–4822. [Google Scholar] [CrossRef]
  35. Karmugil, S.; Kannapa, R. A study on customer satisfaction towards retail stores in Tiruchirappalli town. Int. J. Adv. Res. Manag. Soc. Sci. 2015, 4, 69–78. [Google Scholar]
  36. Oliver, R.L. A Cognitive Model of the Antecedents and Consequences of Satisfaction Decisions. J. Mark. Res. 1980, 17, 460–469. [Google Scholar] [CrossRef]
  37. Song, Y.; Liu, K.; Guo, L.; Yang, Z.; Jin, M. Does hotel customer satisfaction change during the COVID-19? A perspective from online reviews. J. Hosp. Tour. Manag. 2022, 51, 132–138. [Google Scholar] [CrossRef]
  38. Rizky, M.E.; Hariasih, M.H. Consumer Loyalty: Brand Perception, Trust, Product Quality, and the Mediating Role of Customer Satisfaction. Acad. Open 2023, 9. [Google Scholar] [CrossRef]
  39. Hashem, A.; Emad, J.; Hosein, E. Investigate the Relationship between Consumer Personality Congruence with the Brand, Brand Identity and Post-Purchase Behavioral Intentions. Bus. Strateg. 2016, 12, 17–40. [Google Scholar]
  40. Sukma, A.S.; Monalisa, H.; Putri, S.T.H.; Nurbaiti, N. Analisis Strategi Rumah Makan Padang Sinar Dalam Memenuhi Customers Expectations. J. Ekon. Manaj. Pariwisata Dan Perhotelan 2023, 3, 39–49. [Google Scholar] [CrossRef]
  41. Ayu, J.; Yani, D.S. A Decision Support System for Evaluation Service Quality by Fuzzy SERVQUAL: A Case Study of a Modern Riteil. J. Ris. Ilmu Tek. 2023, 1, 163–174. [Google Scholar] [CrossRef]
  42. Dick, A.S.; Basu, K. Customer Loyalty: Toward an Integrated Conceptual Framework. J. Acad. Mark. Sci. 1994, 22, 99–113. [Google Scholar] [CrossRef]
  43. Fornell, C.; Johnson, M.D.; Anderson, E.W.; Cha, J.; Bryant, B.E. The American Customer Satisfaction Index: Nature, Purpose, and Findings. J. Mark. 1996, 60, 7–18. [Google Scholar] [CrossRef]
  44. Grigoroudis, E.; Siskos, Y. Customer Satisfaction Evaluation: Methods for Measuring and Implementing Service Quality; Springer: Berlin/Heidelberg, Germany, 2010; Volume 139. [Google Scholar]
  45. Xue, B.; Wen, L. The China Customer Satisfaction Index Evaluation Basic Model’s Improvement. Inf. Sci. 2008, 26, 704–707. [Google Scholar]
  46. Zeithaml, V.A. Consumer Perceptions of Price, Quality, and Value: A Means-End Model and Synthesis of Evidence. J. Mark. 1988, 52, 2–22. [Google Scholar] [CrossRef]
  47. Hu, W.; Liang, T.; Cheng, Y. Prediction of Perceived Utility of Consumer Online Reviews Based on LSTM Neural Network. Mob. Inf. Syst. 2021, 2021, 5482662. [Google Scholar] [CrossRef]
  48. Huber, M.; Kleinaltenkamp, M. A typology of business usage center members. Ind. Mark. Manag. 2020, 85, 21–31. [Google Scholar] [CrossRef]
  49. Chen, H.-W. Improving supply quality through the store-initiated returns in wholesale supply chains. Int. J. Prod. Econ. 2023, 261, 108891. [Google Scholar] [CrossRef]
  50. Jiang, Y.; Balaji, M.S.; Jha, S. Together we tango: Value facilitation and customer participation in Airbnb. Int. J. Hosp. Manag. 2019, 82, 169–180. [Google Scholar] [CrossRef]
  51. Maia, A.; Zurab, M.; Sopiko, M. Marketing Study of Customer Loyalty in Georgia and Its Impact on Hospitality Business: Case of Imereti Region. Eur. J. Mark. Econ. 2023, 6, 86–92. [Google Scholar] [CrossRef]
  52. Parasuraman, A.; Zeithaml, V.; Berry, L. SERVQUAL: A multiple-item scale for measuring consumer perceptions of service quality. J. Retail. 1988, 64, 12–40. [Google Scholar]
  53. Brady, M.K.; Cronin, J.J. Some New Thoughts on Conceptualizing Perceived Service Quality: A Hierarchical Approach. J. Mark. 2001, 65, 34–49. [Google Scholar] [CrossRef]
  54. Venkatesh, V.; Bala, H. Technology Acceptance Model 3 and a Research Agenda on Interventions. Decis. Sci. 2008, 39, 273–315. [Google Scholar] [CrossRef]
  55. Ramanathan, U.; Gunasekaran, A. Supply chain collaboration: Impact of success in long-term partnerships. Int. J. Prod. Econ. 2014, 147, 252–259. [Google Scholar] [CrossRef]
  56. Jasin, M.; Firmansyah, A.; Anisah, H.U.; Junaedi, I.W.R.; Haris, I. The effects of customer satisfaction, perceived service quality, perceived value, and brand image on customer loyalt. Uncertain Supply Chain Manag. 2023, 11, 763–768. [Google Scholar] [CrossRef]
  57. El-Adly, M.I. Modelling the relationship between hotel perceived value, customer satisfaction, and customer loyalty. J. Retail. Consum. Serv. 2019, 50, 322–332. [Google Scholar] [CrossRef]
  58. Sirdeshmukh, D.; Singh, J.; Sabol, B. Consumer Trust, Value, and Loyalty in Relational Exchanges. J. Mark. 2002, 66, 15–37. [Google Scholar] [CrossRef]
  59. Festinger, L. A Theory of Cognitive Dissonance; Stanford University Press: Redwood City, CA, USA, 1957; p. 291. [Google Scholar]
  60. Cheng, M.C.; Chang, C.-T.; Hsieh, T.-P. An Inventory Model with Advertisement- and Customer-Relationship-Management-Sensitive Demand for a Product’s Life Cycle. Mathematics 2023, 11, 1555. [Google Scholar] [CrossRef]
  61. Cialdini, R.B. Influence: Science and Practice, 3rd ed.; HarperCollins College Publishers: New York, NY, USA, 1993; p. 253. [Google Scholar]
  62. Fithoni, A.; Widyanto, I.P.; Prasetya, D. The effect of service quality, price, and location on customer satisfaction at alib car wash in muara bulian. Int. J. Multidiscip. Res. Lit. 2023, 2, 241–360. [Google Scholar] [CrossRef]
  63. Harisandi, P.; Hurriyati, R.; Dirgantari, P.D.; Jalaludin, E. The Influence of Islamic Bank Customer Experience and Perception on Brand Equity and Customer Satisfaction Customer Satisfaction. Int. J. Educ. Narrat. 2023, 1, 376–388. [Google Scholar] [CrossRef]
  64. Ansyah, A.S.S.; Masruri, M.Z.; Rochimah, S. Usability Testing of User Experience and User Interface Design on Mobile Map Applications: A Comparative Study of User Perception and Interaction. In Proceedings of the 2023 14th International Conference on Information & Communication Technology and System (ICTS), Surabaya, Indonesia, 4–5 October 2023; pp. 7–12. [Google Scholar]
  65. Vasilieva, E.V.; Khisyukov, E.R. Approach research of user experience of various target audiences’ interaction with the portal interface. E-Management 2023, 6, 61–72. [Google Scholar] [CrossRef]
  66. Jiang, M.; Lin, X.; Zhou, X.; Qiao, H.-f. Research on Supply Chain Quality Decision Model Considering Reference Effect and Competition under Different Decision-Making Modes. Sustainability 2022, 14, 10338. [Google Scholar] [CrossRef]
  67. Sukarsa, A.; Phina, D.; Anggraini, D.R.; Nugraha, J.J.; Rivansky, K.A.; Ardianto, E. The Effect of Price and Perceived Quality Dimensions on Customer Satisfaction. PERWIRA—J. Pendidik. Kewirausahaan Indones. 2022, 5, 55–65. [Google Scholar] [CrossRef]
  68. Salim, M.; Rodhiah, R. The Effect of Perceived Quality, Customer Satisfaction, Corporate Image, Customer Experience on Customer Loyalty. Bp. Int. Res. Crit. Inst. 2021, 5, 2422–2432. [Google Scholar] [CrossRef]
  69. Noviana, I.P.T.; Oktavia, D. The Effect of Product Quality and Customer Perceived Value on Repurchases with Intervening Satisfaction. Mark. Bus. Strategy 2023, 1, 35–45. [Google Scholar] [CrossRef]
  70. Wang, L.; Chen, W.; Wang, H. Data Visualization Analysis for Job Recruitment Based on Big Data. In Proceedings of the 8th International Conference on Cyber Security and Information Engineering, New York, NY, USA, 22–24 September 2023; pp. 78–83. [Google Scholar] [CrossRef]
  71. Beril, Y.; David, R.J. Comparison of Customer Reviews for Local and Chain Restaurants: Multilevel Approach to Google Reviews Data. Cornell Hosp. Q. 2022, 64, 63–73. [Google Scholar] [CrossRef]
  72. Xu, H.; Li, K.; Fan, G. An Improved Strategy of Distributed Network Crawler Based on Hadoop and P2P. Adv. Intell. Syst. Comput. 2018, 842, 849–855. [Google Scholar] [CrossRef]
  73. Kaul, I.; Breier, A.; Miller, A.C.; Paul, S.M.; Brannan, S.K. Gaining trust through transparency: The EMERGENT-2 trial—Authors’ reply. Lancet 2024, 404, 524. [Google Scholar] [CrossRef] [PubMed]
  74. Jacobson, J.; Gruzd, A.; Hernández-García, Á. Social media marketing: Who is watching the watchers? J. Retail. Consum. Serv. 2020, 53, 101774. [Google Scholar] [CrossRef]
  75. Zhang, M.; Sun, L.; Li, Y.; Wang, G.A.; He, Z. Using supplementary reviews to improve customer requirement identification and product design development. J. Manag. Sci. Eng. 2023, 8, 584–597. [Google Scholar] [CrossRef]
  76. Hou, J.; Liu, W.; Cao, Y.; Wang, S.; Tang, O. Evaluating service quality of express logistics service based on online reviews using LDA-LSTM. J. Manag. Sci. Eng. 2024, 9, 308–327. [Google Scholar] [CrossRef]
  77. Creswell, J.W.; Plano Clark, V.L. Designing and Conducting Mixed Methods Research; Sage Publications, Inc.: Thousand Oaks, CA, USA, 2007; p. 275. [Google Scholar]
  78. Yilmaz, M.K.; Altunay, L.H.T. Marketing insight from consumer reviews: Creating brand position through opinion mining approach. Telemat. Inform. Rep. 2023, 11, 100094. [Google Scholar] [CrossRef]
  79. Personal Information Protection Law of the People’s Republic of China page. Available online: https://www.gov.cn/xinwen/2021-08/20/content_5632486.htm (accessed on 15 April 2025). (In Chinese)
  80. McCormick, K.; Salcedo, J. Front Matter. In SPSSreg Statistics for Data Analysis and Visualization; John Wiley & Sons: Hoboken, NJ, USA, 2017. [Google Scholar] [CrossRef]
  81. Zheng, Q.; Chen, J.; Zhang, R.; Wang, H.H. What factors affect Chinese consumers’ online grocery shopping? Product attributes, e-vendor characteristics and consumer perceptions. China Agric. Econ. Rev. 2020, 12, 193–213. [Google Scholar] [CrossRef]
  82. McCarthy, B.; Kapetanaki, A.B.; Wang, P. Completing the food waste management loop: Is there market potential for value-added surplus products (VASP)? J. Clean. Prod. 2020, 256, 120435. [Google Scholar] [CrossRef]
  83. Islam, T.; Islam, R.; Pitafi, A.; Hameed; Liang, X.; Rehmani, M.; Irfan, M.; Mubarak, M.S. The impact of corporate social responsibility on customer loyalty: The mediating role of corporate reputation, customer satisfaction, and trust. Sustain. Prod. Consum. 2021, 25, 123–135. [Google Scholar] [CrossRef]
  84. Cao, K.; Xu, Y.; Qiang, W.; Wang, J.; Liu, C. Optimal channel and logistics service selection strategies in the e-commerce context. Electron. Commer. Res. Appl. 2021, 48, 101070. [Google Scholar] [CrossRef]
  85. Liu, Y.; Fu, Y.; Liang, Z.; Yu, L. Factors influencing the adoption of public mobile libraries in China: A stimulus–response perspective. Electron. Libr. 2023, 42, 37–59. [Google Scholar] [CrossRef]
  86. Zhuang, Q.; Xu, W.; Yang, D.; Wei, N. Multimedia Analysis of Digital Museum User Interface Based on Goal-Oriented Theory and Information Fusion and Intelligent Sensing. J. Sens. 2022, 2022, 9656817. [Google Scholar] [CrossRef]
  87. Heidenstrøm, N.; Hebrok, M. Towards realizing the sustainability potential within digital food provisioning platforms: The case of meal box schemes and online grocery shopping in Norway. Sustain. Prod. Consum. 2022, 29, 831–850. [Google Scholar] [CrossRef]
  88. Do, Q.; Liu, W.; Fan, J.; Tao, D. Unveiling Hidden Implicit Similarities for Cross-Domain Recommendation. IEEE Trans. Knowl. Data Eng. 2021, 33, 302–315. [Google Scholar] [CrossRef]
  89. Jia, R.; Li, R.; Yu, M.; Wang, S. E-commerce purchase prediction approach by user behavior data. In Proceedings of the 2017 International Conference on Computer, Information and Telecommunication Systems (CITS), Dalian, China, 21–23 July 2017; pp. 1–5. [Google Scholar]
  90. Shokouhyar, S.; Shokoohyar, S.; Safari, S. Research on the influence of after-sales service quality factors on customer satisfaction. J. Retail. Consum. Serv. 2020, 56, 102139. [Google Scholar] [CrossRef]
  91. Lombart, C.; Millan, E.; Normand, J.M.; Verhulst, A.; Labbé-Pinlon, B.; Moreau, G. Effects of physical, non-immersive virtual, and immersive virtual store environments on consumers’ perceptions and purchase behavior. Comput. Hum. Behav. 2020, 110, 106374. [Google Scholar] [CrossRef]
  92. Jin, S.; Zhou, L. Consumer interest in information provided by food traceability systems in Japan. Food Qual. Prefer. 2014, 36, 144–152. [Google Scholar] [CrossRef]
  93. Bai, S.; Zhang, X.; Han, C.; Yu, D. Research on the Influence Mechanism of Organic Food Attributes on Customer Trust. Sustainability 2023, 15, 6733. [Google Scholar] [CrossRef]
  94. Dutta, D.; Sit, N. Application of natural extracts as active ingredient in biopolymer based packaging systems. J. Food Sci. Technol. 2022, 60, 1888–1902. [Google Scholar] [CrossRef]
  95. Khouryieh, M.; Khouryieh, H.; Daday, J.; Shen, C. Consumers’ perceptions of the safety of fresh produce sold at farmers’ markets. Food Control 2019, 105, 242–247. [Google Scholar] [CrossRef]
  96. Molina, K.A.; Corrêa, R.C.G.; Prieto, A.M.; Pereira, C.; Barros, L. Bioactive Natural Pigments’ Extraction, Isolation, and Stability in Food Applications. Molecules 2023, 28, 1200. [Google Scholar] [CrossRef] [PubMed]
  97. Yik, M.H.-Y.C.; Wong, V.; Wong, T.-H. HerBChain, a blockchain-based informative platform for quality assurance and quality control of herbal products. J. Tradit. Complement. Med. 2021, 11, 598–600. [Google Scholar] [CrossRef] [PubMed]
  98. Liu, L.; Wang, H.; Xing, S. Optimization of distribution planning for agricultural products in logistics based on degree of maturity. Comput. Electron. Agric. 2019, 160, 1–7. [Google Scholar] [CrossRef]
Figure 1. Research roadmap.
Jtaer 20 00114 g001
Figure 2. Sentiment analysis chart.
Jtaer 20 00114 g002
Figure 3. Frequency distribution of good reviews.
Jtaer 20 00114 g003
Figure 4. Theoretical model diagram.
Jtaer 20 00114 g004
Figure 5. The improved theoretical model diagram.
Jtaer 20 00114 g005
Figure 6. Customer satisfaction scale CFA model diagram.
Jtaer 20 00114 g006
Figure 7. SEM analysis model of factors influencing customer satisfaction.
Jtaer 20 00114 g007
Table 1. Social demographic description (N = 509).
ItemOptionFrequencyPercentage (%)
GenderMale25750.5
Female25249.5
Age18 years and under5410.6
18–25 years8817.3
26–35 years11322.2
36–45 years9218.1
46–55 years5911.6
56–65 years8917.5
66 and over142.8
Educational attainmentHigh school and below10220
Tertiary17033.4
Undergraduate17334
Master’s degree and above6412.6
Income levelUSD 3000 and below8917.5
USD 3000–50006813.4
USD 5000–800024347.7
USD 8000–10,0007915.5
USD 10,000 and above305.9
OccupationAcademic researcher316.1
Institutional/professional staff489.4
Business employees/managers18536.3
Professionals and technicians (e.g., doctors/teachers/lawyers/sports/journalists, etc.)14328.1
Freelancers438.4
Retirees458.8
Other142.8
Table 2. Statistics of sample purchasing behavior.
ItemOptionFrequencyPercentage (%)
Any experience in purchasing fruits from fresh food e-commerce platformsYes50799.6
None20.4
Purchase frequencyLess than once a month12925.3
1–3 times per month15931.2
4–5 times per month15229.9
More than 5 times per month6913.6
Purchase concernsProduct quality30159.1
Product prices20840.9
Table 3. Questionnaire reliability analysis.
VariableNumber of QuestionsCoefficients
Quality of logistics services20.486
Product quality40.570
Platform quality of service40.618
Platform design and features20.465
Switching costs30.536
Promotions20.426
Perceived value30.569
Customer trust30.554
Customer satisfaction30.540
Customer loyalty50.681
Total310.927
Table 4. Questionnaire validity analysis.
VariableNumber of QuestionsKMOSig
Quality of logistics services20.500<0.01
Product quality40.668<0.01
Platform quality of service40.699<0.01
Platform design and features20.500<0.01
Switching costs30.618<0.01
Promotions20.500<0.01
Perceived value30.617<0.01
Customer trust30.616<0.01
Customer satisfaction30.617<0.01
Customer loyalty50.774<0.01
Total310.956<0.01
Table 5. Rotating load sum of squares.
Rotational Load Sum of Squares
ComponentTotalPercentage of VarianceCumulative %
13.38410.91710.917
23.37110.87421.791
33.27910.57632.367
42.9439.49541.863
Extraction method: principal component analysis
Table 6. Model reliability analysis.
VariableNumber of QuestionsCoefficients
Perceived value70.765
Platform experience70.765
Perceived quality70.767
Customer satisfaction50.717
Total260.915
Table 7. Model validity analysis.
VariableNumber of QuestionsKMOSig
Perceived value70.856<0.010
Platform experience70.855<0.010
Perceived quality70.851<0.010
Customer satisfaction50.794<0.010
Total260.9540.000
Table 8. Model fit test.
IndicatorReference StandardActual Results
CMIN/DF a1–3 excellent, 3–5 good1.269
RMESA b<0.050 is excellent, <0.080 is good0.023
IFI c>0.900 is excellent, >0.800 is good0.981
TLI d>0.900 is excellent, >0.800 is good0.979
CFI e>0.900 is excellent, >0.800 is good0.981
Note: a: chi-squared degrees of freedom ratio; b: root mean square of error; c: incremental fit index; d: Tucker–Lewis index; e: comparative fit index.
Table 9. Convergent validity and combined reliability tests for each dimension.
Pathway RelationshipEstimateAVE aCR b
A1<---Perceived value0.5800.3200.767
A2<---Perceived value0.562
A3<---Perceived value0.620
A4<---Perceived value0.511
A5<---Perceived value0.564
A6<---Perceived value0.567
A7<---Perceived value0.552
B1<---Platform experience0.5910.3200.766
B2<---Platform experience0.568
B3<---Platform experience0.634
B4<---Platform experience0.564
B5<---Platform experience0.533
B6<---Platform experience0.517
B7<---Platform experience0.544
C1<---Perceived quality0.5690.3180.765
C2<---Perceived quality0.549
C3<---Perceived quality0.526
C4<---Perceived quality0.552
C5<---Perceived quality0.543
C6<---Perceived quality0.604
C7<---Perceived quality0.598
Note: a: average variance extracted; b: composite reliability.
Table 10. Descriptive statistics of each dimension and normality test results of measurement items.
DimensionMeasurement
Question Item
M aSD bSkewnessKurtosisOverall MOverall SD
Perceived valueA13.4201.207−0.581−0.6203.3970.794
A23.3801.215−0.546−0.709
A33.3601.257−0.506−0.802
A43.4401.232−0.532−0.681
A53.4101.245−0.493−0.760
A63.3901.232−0.556−0.723
A73.3901.223−0.539−0.692
Platform
experience
B13.4701.176−0.658−0.4143.4510.769
B23.4701.219−0.529−0.695
B33.401.228−0.489−0.774
B43.4201.197−0.551−0.649
B53.4601.209−0.590−0.564
B63.4501.164−0.589−0.502
B73.4901.160−0.511−0.569
Perceived qualityC13.4301.196−0.598−0.5473.3980.777
C23.4701.211−0.602−0.580
C33.4901.158−0.616−0.404
C43.4501.210−0.557−0.635
C53.3301.222−0.476−0.752
C63.3301.205−0.454−0.723
C73.2901.235−0.454−0.789
Note: a: mean; b: standard deviation.
Table 11. Pearson’s correlation analysis between dimensions.
DimensionPerceived ValuePlatform ExperiencePerceived Quality
Perceived value1
Platform experience0.676 **1
Perceived quality0.685 **0.681 **1
Note: ** significant correlation at the 0.01 level (two-tailed).
Table 12. SEM model path relationship test results.
EstimateS.E. aC.R. bp-Value
Perceived value--->Customer satisfaction0.4140.6306.589***
Platform experience--->Customer satisfaction0.2630.5105.145***
Perceived quality--->Customer satisfaction0.4930.7007.068***
Note: a: standard error; b: critical ratio. *** significant correlation at the 0.001.
Table 13. Regression analysis of customer satisfaction.
Non-Standard Regression CoefficientsStandardized Regression Coefficientsp-ValueVIFR-SquareAdjusted R-Square
DimensionConstant term 0.5610.542
Perceived valueA40.0730.1060.0021.334
A50.0500.0740.0391.422
A60.0930.1350.0001.444
A70.0590.0850.0181.426
Platform experienceB20.0590.0850.0181.416
B50.0610.0880.0131.378
B60.0760.1040.0031.328
B70.0600.0820.0211.387
Perceived qualityC20.0620.0880.0121.357
C50.1000.1450.0001.399
C60.0870.1240.0011.549
C70.0460.0670.0701.506
Disclaimer/Publisher’s Note: The statements, opinions and data contained in all publications are solely those of the individual author(s) and contributor(s) and not of MDPI and/or the editor(s). MDPI and/or the editor(s) disclaim responsibility for any injury to people or property resulting from any ideas, methods, instructions or products referred to in the content.

