1. Introduction
The shift in marketing focus from a product-oriented to a consumer-oriented paradigm has been particularly rapid over the last decade due to the growing interest in business intelligence and customer relationship management (CRM). Marketing decisions play a significant role in the current customer-oriented environment, which generates the need for a simple and integrated framework for systematically managing available customer data. Since modern consumers are educated and sophisticated, a marketing strategy that meets their requirements becomes necessary [
1].
One of the measures determining the success of a direct marketing campaign is the ratio of the customers who respond to the campaign, which is precisely the issue addressed by customer response models. The models for predicting these customers are based on dividing the potential customers into respondents and non-respondents, i.e., the group more likely to respond to a direct marketing campaign than the group with a lower response probability. In this regard, modelling the customer response is an important direct marketing activity. Identifying consumers with a higher response probability can reduce marketing costs and increase the campaign’s profitability. The marketing resources can be specifically allocated to active customers with a high potential value to the company.
For example, the Ebedi Microfinance Bank utilised a customer response model to avert unnecessary spending that would have been incurred by sending promotional offers to non-respondents [
2]. With predictive analytics, RedBalloon’s total channel customer acquisition cost was reduced by 25% in less than a month [
3], while Harley-Davidson increased sales in New York by 2930% [
4]. Moreover, other customer-centric data-mining methods are widely and successfully used in companies such as Amazon, Netflix, and Alibaba [
5].
However, the share of customers who respond to the campaign with purchases is usually small, i.e., often, the response rate in campaigns is very low, and even around 1% can be considered successful. Since the data in the customer databases are unbalanced, designing an effective response model is one of the direct marketing challenges [
6].
The class imbalance problem in direct marketing is usually solved by using one of the following three approaches: data-based approaches [
7,
8], algorithm-based approaches [
9], or cost-based approaches [
10]. Namely, the data-based approach balances classes using resampling techniques; algorithm-based solutions are based on specifically modified algorithms, while cost-based approaches allocate different misclassification costs to different class examples [
11]. These approaches have significant limitations. First, in the data-based approach, the resampling does not propose an optimal class distribution, and the criteria for selecting the instances for the resampling are unclear. Second, algorithm-level approaches require substantial algorithm knowledge. Third, cost-based solutions require additional learning costs and the in-depth exploration of effective cost setups.
Following the trends of direct mailing, with the development of social media and other Internet channels, and the possibility of placing campaigns on websites or social media in the form of posts and ads, a new field appeared to explore the effectiveness of these channels [
12]. On the one hand, the abundance of user data available on these platforms allows for more precise selection and targeting in a direct marketing campaign to effectively identify respondents [
13]. Effective marketing campaigns are especially relevant for social media since they play a significant role in brand development.
Response models for direct online campaigns involving web metrics are increasingly relevant nowadays, as indicated by newer research studies [
14,
15,
16]. The problem of class imbalance is especially pronounced because the response rate is lower due to the large number of user accesses without response (website browsing, which does not end with a purchase). Even though some authors consider clicking on the offer link (website visit) as a response, only a completed purchase is considered a response in this research, leading to an extremely low response rate. Considering the importance of the respondents’ prediction in the online direct marketing campaign and its efficiency, this paper proposes a customer response model based on the balanced Support Vector Machine (SVM) method. The proposed approach overcomes the abovementioned issues by using a balanced SVM as a data pre-processor, efficiently removing the noise and class overlapping while balancing the data.
It was shown in the literature that the SVM method [
17] successfully resolves overlapping and unbalanced classes [
18,
19] by creating a hyperplane between the examples belonging to different classes, which can discriminate the class to the maximum distance, regardless of the number of instances available to learn from for any class [
20]. Hence, SVM resolves data noise, i.e., class overlapping, and complements the minor class with the most relevant examples by moving the margin to the closest and thus most similar examples of the major class and categorising them into smaller classes [
21]. In line with that, to balance the data and provide higher classification accuracy, SVM as a pre-processor of data was applied. In the case of extreme class imbalance, as we have in our data, the SVM is also biased towards the major class [
7]. Therefore, during the training of the SVM pre-processor, the mentioned undersampling was applied, i.e., the balanced SVM was used as a pre-processor.
This research’s main contribution is investigating the efficiency of balanced SVM data pre-processing on a dataset from online direct marketing campaigns with an extremely low response rate of 0.41%. A lower response rate is expected in the case of an online direct marketing campaign due to a larger number of website visits. A similar approach was shown in [
20], where the authors used standalone SVM pre-processing, but on a dataset with a significantly higher response rate of 6%, as well as in [
21], where the ensemble (Bagging) SVM pre-processing was used, but for a customer segmentation problem. Additionally, an advantage of this study is the inclusion of web metrics as predictors.
Considering the previously stated information, the main goal of this paper is to define a customer response model that overcomes the minor class misclassification problem. Therefore, considering the minor class problem in direct marketing databases, a balanced SVM is used as a pre-processor that refines the data, i.e., separates and balances the classes. This method has been confirmed in previous research as effective in class imbalance and linear inseparability. However, to the best of our knowledge, it is applied to improve customer response prediction for the first time in this research.
Following the above, this paper aims to give a precise answer to the following research question (RQ): Does the balanced SVM pre-processing increase the predictive performance of the customer response models?
To answer the RQ, empirical testing of the proposed method on real-world data and its validation on a publicly available dataset will be used. The real data were taken from a company that sells online sports equipment. Data from their online campaigns on social networks have been refined and prepared in a form suitable for predicting the customer’s response. RapidMiner software was used for empirical testing of the proposed methods.
Following the introduction, this paper is structured as follows: a concise literature review is presented in
Section 2, describing the previous research regarding customer response modelling using predictive analytics. The data and methods used in this paper are presented in
Section 3 and
Section 4, followed by the results of the empirical testing in
Section 5 and
Section 6. The seventh section discusses the obtained results and conclusions.
2. Literature Review
Digital marketing enables companies to reach far more potential customers over online channels for a lower cost than traditional marketing channels. Online channels also generate detailed customer data that allow the companies to shape customised and targeted messages and deliver them through various channels [
22]. However, digital marketing faces the problem of an unknown conversion rate, which also existed in traditional direct mail.
In the online environment, the imbalanced data problem is even more present. For example, when potential customers visit the company website, each visit is called a session. The number of sessions that results from the completed purchase is significantly smaller than the total number of sessions [
23], which causes a class imbalance. Consequently, the class imbalance problem leads to biased results of the predictive model since the model is trained using a small number of positive examples. Such biased models usually have a poor classification performance, as the model often classifies all test examples as the dominant class (e.g., negative purchase) [
24].
On the other hand, developing predictive analytics, social media, and the available data make the customer response modelling process more precise. Instead of pure managerial judgment in choosing the targeted segments, decision-makers can utilise the data and analytics to identify their respondents much more efficiently while treating the class imbalance issue.
Daneshmandi and Ahmadzadeh [
6] proposed a new approach to the class imbalance problem in their research. They showed a higher prediction accuracy in the hybrid ANN model obtained. To create a hybrid model, the authors applied a Bagging Neural Network (BNN) on an output of k-means clustering, then aggregated the results. The obtained sensitivity result for the hybrid model was 89%, and the area under the curve (AUC) result was 0.985, compared to the standalone BNN with a sensitivity of 55% and an AUC equal to 0.88. Hence, the authors proposed the hybrid techniques as more efficient than basic classifiers. This approach was tested on a dataset with a response rate of 19.81%.
Similarly, Asare-Frempong and Jayabalan [
25] used Multilayer Perceptron Neural Network (MPNN), Decision Tree (DT), Logistic Regression (LR), and Random Forest (RF) classifiers for the prediction of the customer response to direct bank marketing. Their results highlight the predictive abilities of the RF classifier, which obtained the highest total accuracy of 86.8% and an AUC of 0.927. In their study, the obtained true positive rate was 90.2% for an imbalanced set with 11.63% respondents, which were undersampled in a 1:1 ratio before applying the models.
Kang et al. [
26] designed a customer response model using clustering, balanced undersampling, and ensemble (CUE), aiming to solve the class imbalance problem of respondents, pairing it with several classification algorithms for prediction-logistic regression, multilayer perceptron neural network, k-nearest neighbour (k-NN) classification, and SVM. The authors used the undersampling method for the non-respondents from each cluster to avoid the loss of information relevant for classification, which can occur when applying random undersampling. Their CUE approach balanced respondents and non-respondents with no random undersampling, the synthetic minority oversampling technique (SMOTE), and one-sided selection. Additionally, the authors found that SVM was the best model under imbalanced circumstances. However, the authors focused on data-balancing methods and did not show the accuracy results for the respondent segment in more depth, but only an overall model accuracy.
Kim et al. [
7] used three Direct Marketing Education Foundation (DMEF) datasets (1, 2, and 4) to test their approach, with response rates of 27.42%, 2.46%, and 9.42%, respectively. They applied two random undersampling rules (2:1 and 1:1) to balance the data. For the dataset with the highest class imbalance (DMEF2) without data balancing, SVM achieved the best result for sensitivity (7.3%) and total accuracy (95.3%). At the same time, DT, LR, and NN obtained 0% sensitivity, showing the main issue in classifying imbalanced data—all models were biased towards the major class. After 2:1 undersampling, SVM achieved the best classification performance with 23.8% sensitivity. At the same time, its efficiency was reduced after 1:1 undersampling, where it obtained the smallest sensitivity rate of 9.5%, compared to DT, LR, and NN with 41.1%, 56.5%, and 62.9%, respectively.
On a real-life direct marketing dataset from a Portuguese bank with an 11.2% response rate, Migueis et al. [
8] applied the RF method on oversampled (SMOTE) and undersampled datasets (EasyEnsemble). The authors achieved the best results with undersampling, and the RF-AUC amounted to 0.989, in contrast to the oversampled and original dataset results of 0.945 in both cases. These results obtained by RF were compared to LR, NN, and SVM, and the RF still outperformed the other techniques. However, the undersampling significantly improved the results using RF as a classifier. In other cases, it was shown that it is not a universally suitable method for treating the class imbalance problem.
Marinakos and Daskalaki [
27] tackled the class imbalance problem by comparing statistical, distance-based, induction, and Machine Learning classification algorithms, using the publicly available dataset with an 11.7% response rate to a direct marketing offer. The best performance was obtained by combining the cluster-based undersampling technique, and the k-NN true positive (TP) rate was 88%, while SVM achieved a TP rate of 71%. The authors stated that, regardless of the chosen algorithm, cluster-based undersampling and SMOTE obtained a similar result of TP ≈ 70%.
Farquad and Bose [
20] tested SVM as a data pre-processor together with sampling techniques (100% oversampling, 200% oversampling, 25% undersampling, 50% undersampling, and SMOTE), aiming to solve the class imbalance problem, using a dataset from an insurance company with a 6% response rate. After pre-processing and replacing the target variable with SVM predictions, a modified dataset was used to train MLP, LR, and RF models. Similar to our study, the authors focused on the sensitivity metric—the proportion of TP. The results show that the proposed balancing approach improves the classification performance in every case. For example, MLP, LR, and Random Forest obtained the following sensitivity results on the original unbalanced data: 5.88%, 1.26%, and 7.14%, respectively, while, in combination with SVM pre-processing, the results were as follows: 65.31%, 63.03%, and 63.03%, respectively. This study’s best performance was obtained using the 25% undersampled data in an RF model, which achieved a sensitivity of 71.01%.
Several recent papers treat this issue regarding online direct marketing campaigns and overall online purchase prediction using web log data. For instance, Lee et al. [
14] explored machine learning models and potential effective data sampling methods for predicting online consumer behaviour for the visitors of a Google Merchandise Store. The authors found that the eXtreme Gradient Boosting (XGB) algorithm is most effective for predicting purchase conversion of online consumers, while oversampling with the SMOTE algorithm was shown to be the best method to solve the data imbalance issue. They obtained the following results: accuracy—74.17%, sensitivity—73.92%, and AUC—0.791. However, it is important to state that the dataset used contained data for all website visits, not just direct marketing campaigns. The conversion rate in this dataset was 2.29%.
Similarly, Chaudhuri et al. [
15] used a dataset from an online e-commerce platform to predict purchasing behaviour, and they compared machine learning (ML) to deep learning (DL) ‘algorithms’ performance. Their results show that DL techniques (an evolved variant of Artificial Neural Networks) exhibit better performance than ML algorithms—the best model obtained an accuracy of 89%, a sensitivity of 96%, and an AUC of 0.89. However, the authors stated that the DL algorithm is significantly more resource-intensive than ML algorithms.
Pejić Bach et al. [
28] used the k-means cluster analysis and the CHAID decision tree to predict churn in telecommunication. The ratio of the churned customers was 36.2%, indicating an unbalanced dataset. Therefore, the hybrid approach was used in which the customer database was first divided into homogenous clusters using demographic and behavioural attributes. Second, the clusters were analysed using chi-squared according to the churn level. Third, CHAID decision trees were developed separately for each cluster, with churn as the goal variable. The accuracy of the database was 79.5, while the sensitivity for the churned customers was only 49.5. On the other hand, when the CHAID decision tree was developed for the cluster with the highest churn ratio, the accuracy was lower than the whole database (68.7% compared to 79.5%). The sensitivity for the customers that churned was significantly improved (81.4% compared to 49.5%).
The summary of relevant papers treating customer response modelling from this section is given in
Table 1, which presents the methods used in previous customer response model studies. In cases where the paper showed several methods and results, the model with the best performance was chosen.
The lowest response rate in the previously used datasets was 2.29% (conversion rate) [
14], while the highest was 27.42% [
7], which is significantly higher than the response rate in this study.
Based on the analysis of previous research presented in
Table 1, this paper’s main contribution is defined as the investigation of the efficacy of balanced SVM data pre-processing on a dataset from online direct marketing campaigns with an extremely low response rate of 0.41%.
Previous research used datasets with a higher response rate, e.g., in [
20], the authors employed standalone SVM pre-processing on a dataset with a substantially higher response rate of 6%, as well as in [
21], where ensemble (Bagging) SVM pre-processing was used, but for a customer segmentation problem.
The inclusion of web metrics as predictors is also the benefit of our study.
3. Data
One of the main characteristics of online direct marketing campaigns is asking the customer to take a specific and quantifiable action, such as clicking on a link to a website, purchasing a product online, redeeming a discount code, etc. This feature of online direct marketing makes customer responses traceable and measurable, enabling high-volume customer databases [
29]. To make these data useful, companies can build customer response models to help identify the customers who will, with high probability, respond to the following campaign. Additionally, such analyses can inform campaign profitability and help make relevant marketing decisions.
A dataset was obtained from a leading sports distributor from Montenegro for the empirical testing of the proposed customer response model.
The dataset contained e-commerce website visits from sponsored social media posts for four months, from October 2018 until January 2019. For the observed period, 9660 unique website users followed a link from a targeted Instagram or Facebook post, making them potential customers as they expressed interest in the presented offer. The total number of completed sessions was 33,662 during six online direct marketing campaigns on social media.
The final dataset resulted from merging several databases: the company’s product database, Google Analytics, and Facebook Business Manager, followed by pre-processing and preparing the dataset for the customer response model analysis.
The dataset contained the following attribute groups:
A description of the attributes in this dataset is given in
Table 2.
The model presented in this paper predicted whether the potential customer would respond to the campaign, using the previous purchasing history and product and web log data. Only a completed purchase was taken as a response in this customer response model.
The dataset was split into training and test datasets to conduct the predictive procedure. On average, data for visitors who spent less than 30 s in a session were excluded. The dataset consisted of the history of web and purchasing behaviour of visitors to the leading sports distributor’s website, which launched six campaigns, with 33,662 sessions.
The training dataset used to train the model contained the history of web and purchasing behaviour of 9660 website visitors from Campaign 1 to Campaign 4 and an indicator of their response to the next Campaign 5 (only 40 customers directly responded to the offer, i.e., purchased in this campaign, which resulted in a response rate of only 0.41%).
The set for model validation and testing contained the same data categories as the training set for 7929 visitors from Campaign 1 to Campaign 5 and the response indicating whether a customer responded to Campaign 6 (there were 40 responses in this campaign as well), not including new visitors who first appeared in Campaign 5 or Campaign 6.
4. Methods
As can be observed from the data description, the response rate to this marketing campaign was 0.41%, which is extremely low, indicating a high level of class imbalance. To treat this problem, which disables classifying algorithms from recognising examples of the positive (minor) class, a combination of random undersampling and Support Vector Machine (SVM) classification was applied.
In its most basic form, random undersampling randomly removes the examples of the major class from the database. A 1:1 undersampling (the same number of examples as in the minor class) was conducted on the training set while generating the Balanced SVM (B-SVM) pre-processor.
The SVM method [
17] effectively tries to resolve overlapping and unbalanced classes [
18,
19] by creating a hyperplane between the examples belonging to different classes, which can discriminate the class to the maximum distance, regardless of the number of instances available to learn from [
20]. As a result, SVM eliminates data noise, i.e., class overlap, and complements the minor class with the most relevant examples by moving the margin to the closest, and hence most similar, examples of the major class and putting them into the smaller class [
21]. As a result, SVM was used as a data pre-processor to balance the data and deliver greater classification accuracy. The SVM is biased towards the major class in cases of high class imbalance, as was present in the used dataset [
7]. As a result, the specified undersampling was used during the training of the SVM pre-processor, i.e., balanced SVM was used as a pre-processor.
The following classifiers were tested on such pre-processed data: LR [
30], Gradient Boosted Trees (GBT) [
31], RF [
32], k-NN [
33], and DT [
34].
Although the name contains the word regression, LR is a classification method. The most popular LR models have binary outcomes, and this technique involves predicting the likelihood of a discrete outcome given the input variables. The purpose of the k-nearest neighbour approach is to locate the closest neighbours of a given query point so we can apply a class label to that point. The k-NN technique assumes that comparable entities exist nearby. The DT method divides the dataset by attribute values, so subgroups contain as many instances of one class as possible. During inductive division, a model in the form of a tree is formed, based on which the method itself is named. The Gradient Boosting Trees algorithm selects the next DT model that minimises the residual error of the previous group of DT models. In this way, by minimising the residual error, subsequent models will favour the correct classification of previously misclassified cases [
35].
On the other hand, the RF algorithm uses Bagging (also known as Bootstrap aggregation, where random data samples are selected in the training set so that individual data can be selected in multiple samples, then models are trained on these samples, and their outputs are aggregated) and random selection of attributes to create a larger number of decision trees in the training phase. In this regard, it represents an extension of the basic idea of individual DT classifiers in such a way as to create a larger number of classification decision trees. Thus, the last two methods combine the ensemble meta-algorithm with the DT classifier.
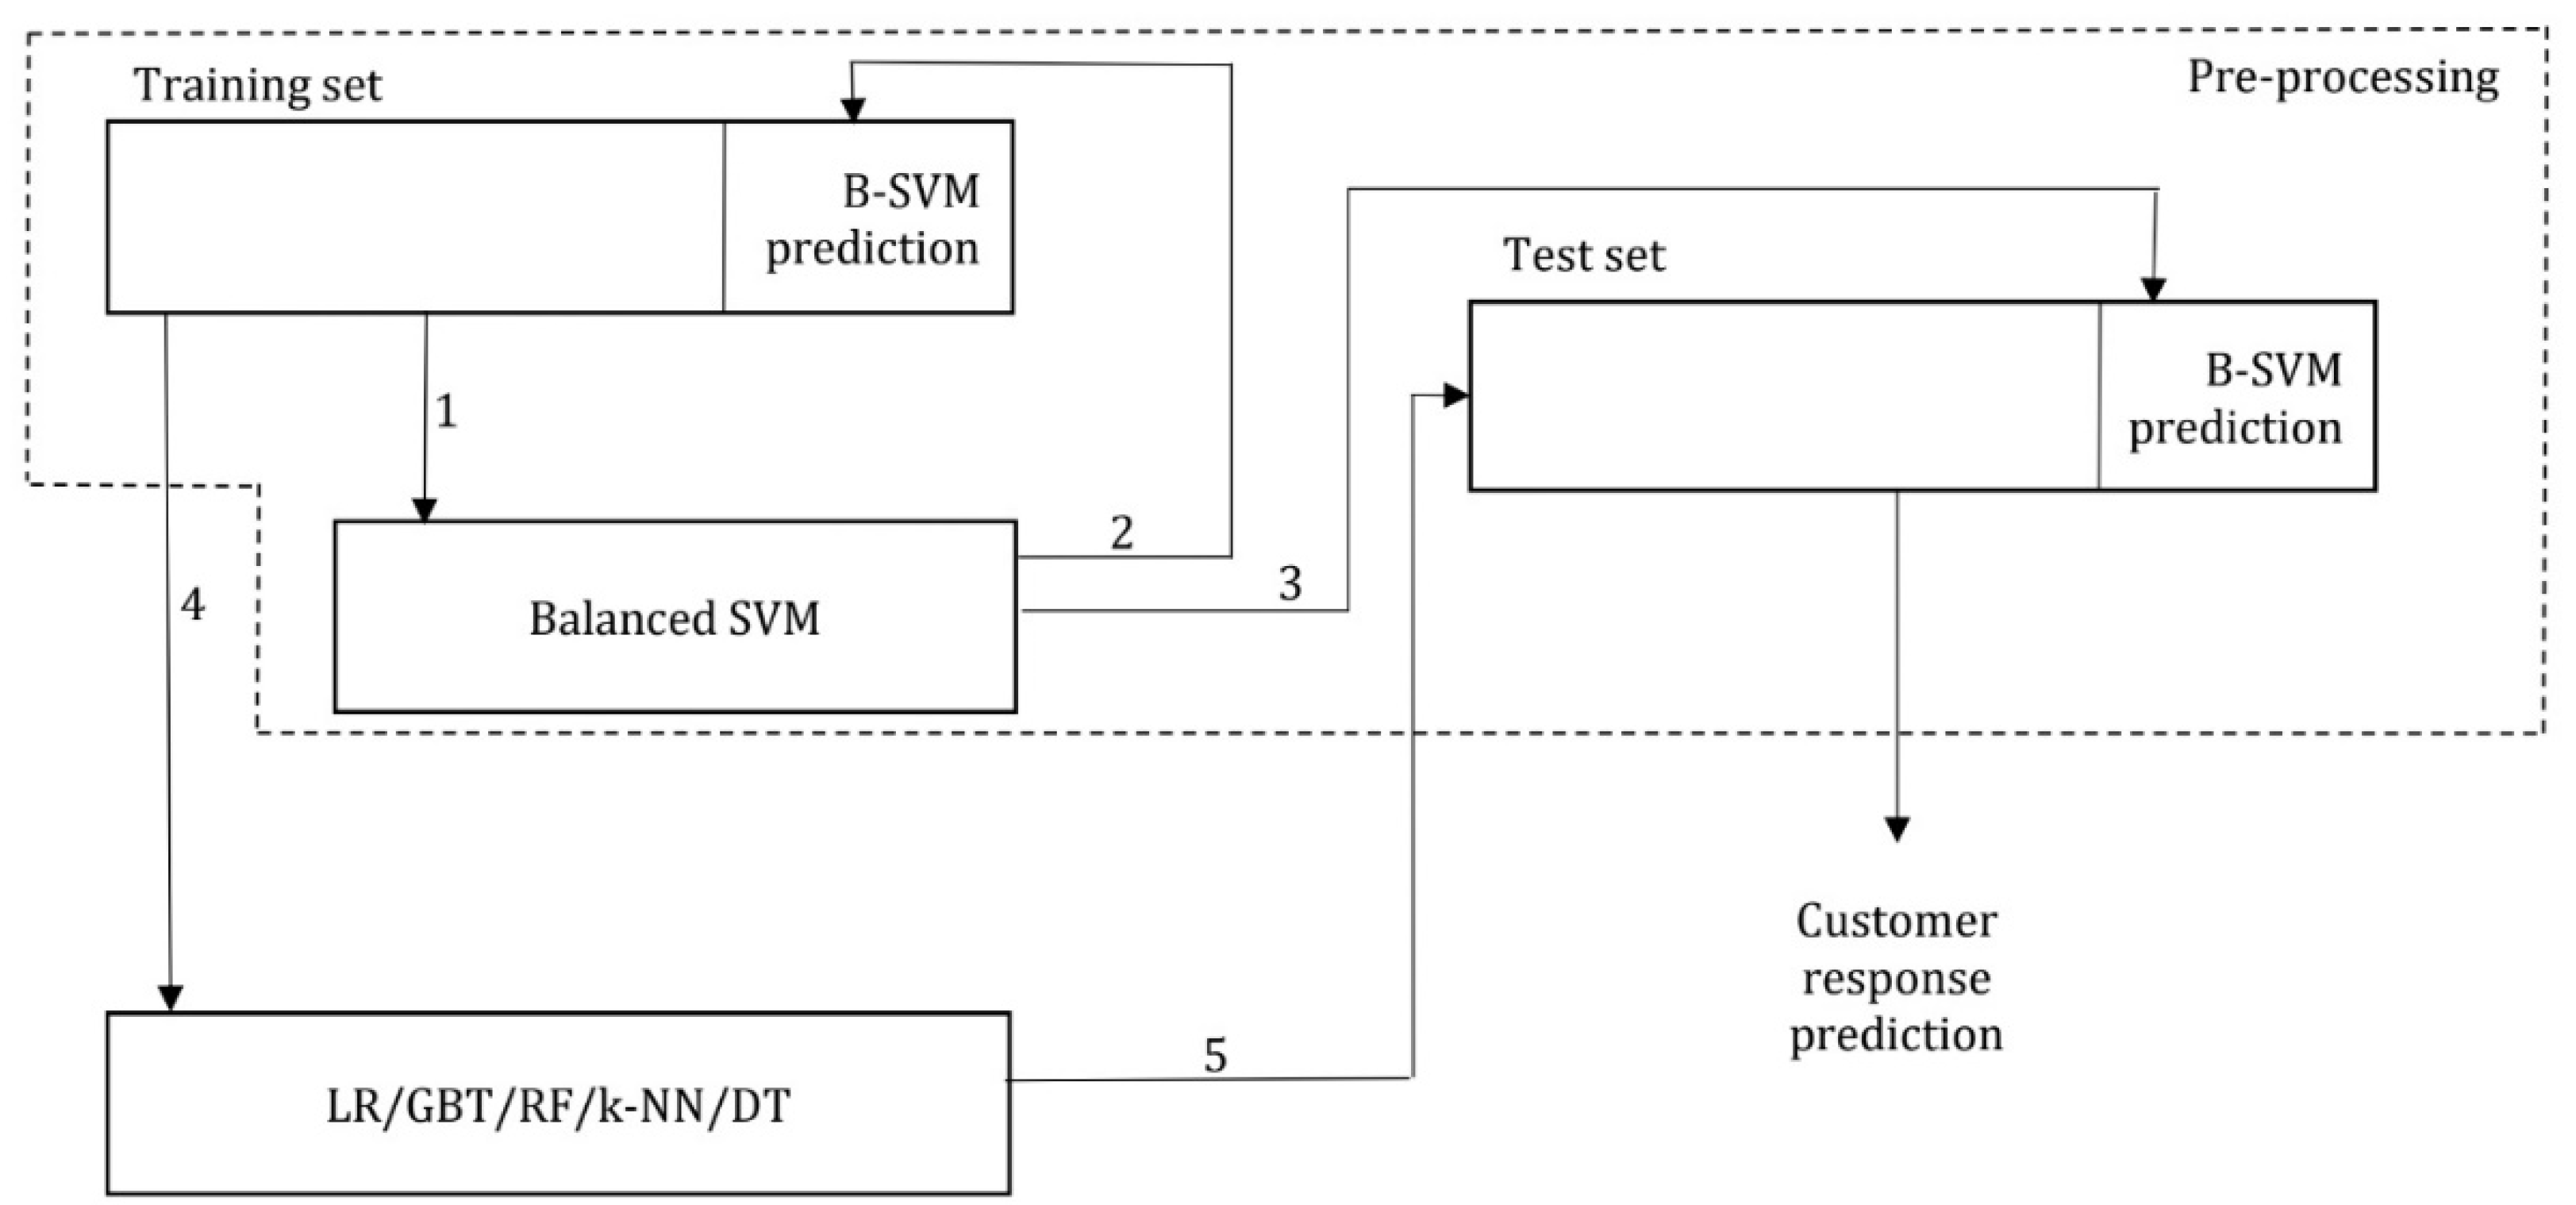
The applied predictive procedure is shown in
Figure 1.
The proposed predictive procedure consisted of the following steps (steps 1, 2, and 3 include data pre-processing, and customer response prediction is realised in steps 4 and 5):
Step 1—B-SVM is trained using the original imbalanced dataset. The model with the best predictive performance is obtained in the k-fold cross-validation procedure.
Step 2—Trained B-SVM is applied to the training dataset, and its class label is replaced with B-SVM prediction. In this process, a minor class of non-respondents is supplemented with similar examples from the major (respondents) class, and class balancing is achieved.
Step 3—Trained B-SVM is applied to the test dataset, and its class label is replaced with B-SVM prediction. This results in proclaiming customers from the test dataset who are as similar to respondents as possible.
Step 4—Several classifiers, such as DT, LR, GBT, RF, and k-NN, are trained on the modified (balanced) dataset from Step 2. The models with the best predictive performances are chosen in k-fold cross-validation.
Step 5—Trained classifiers are applied to the test dataset. The B-SVM prediction measures predictive performances instead of the original class label.
The model performance measures used in this paper are AUC, Accuracy, Sensitivity, and Fallout. AUC is often used in the literature to show the separability degree between classes [
25,
36,
37]. Accuracy, Sensitivity, and Fallout were calculated using the values from the confusion matrix presented in
Table 3 (equations given below the table).
5. Results
Table 4 presents the prediction performance for all tested classifiers: LR, GBT, RF, k-NN, and DT, both before data pre-processing and balancing and after B-SVM pre-processing.
Each classifier underwent cross-validation on an initial and pre-processed training set and was then applied to test data. The table shows the results obtained from the test data. When these findings are compared to the capabilities of independent classifier approaches, it is evident that this method surpasses them in class balancing or solutions to minor class problems.
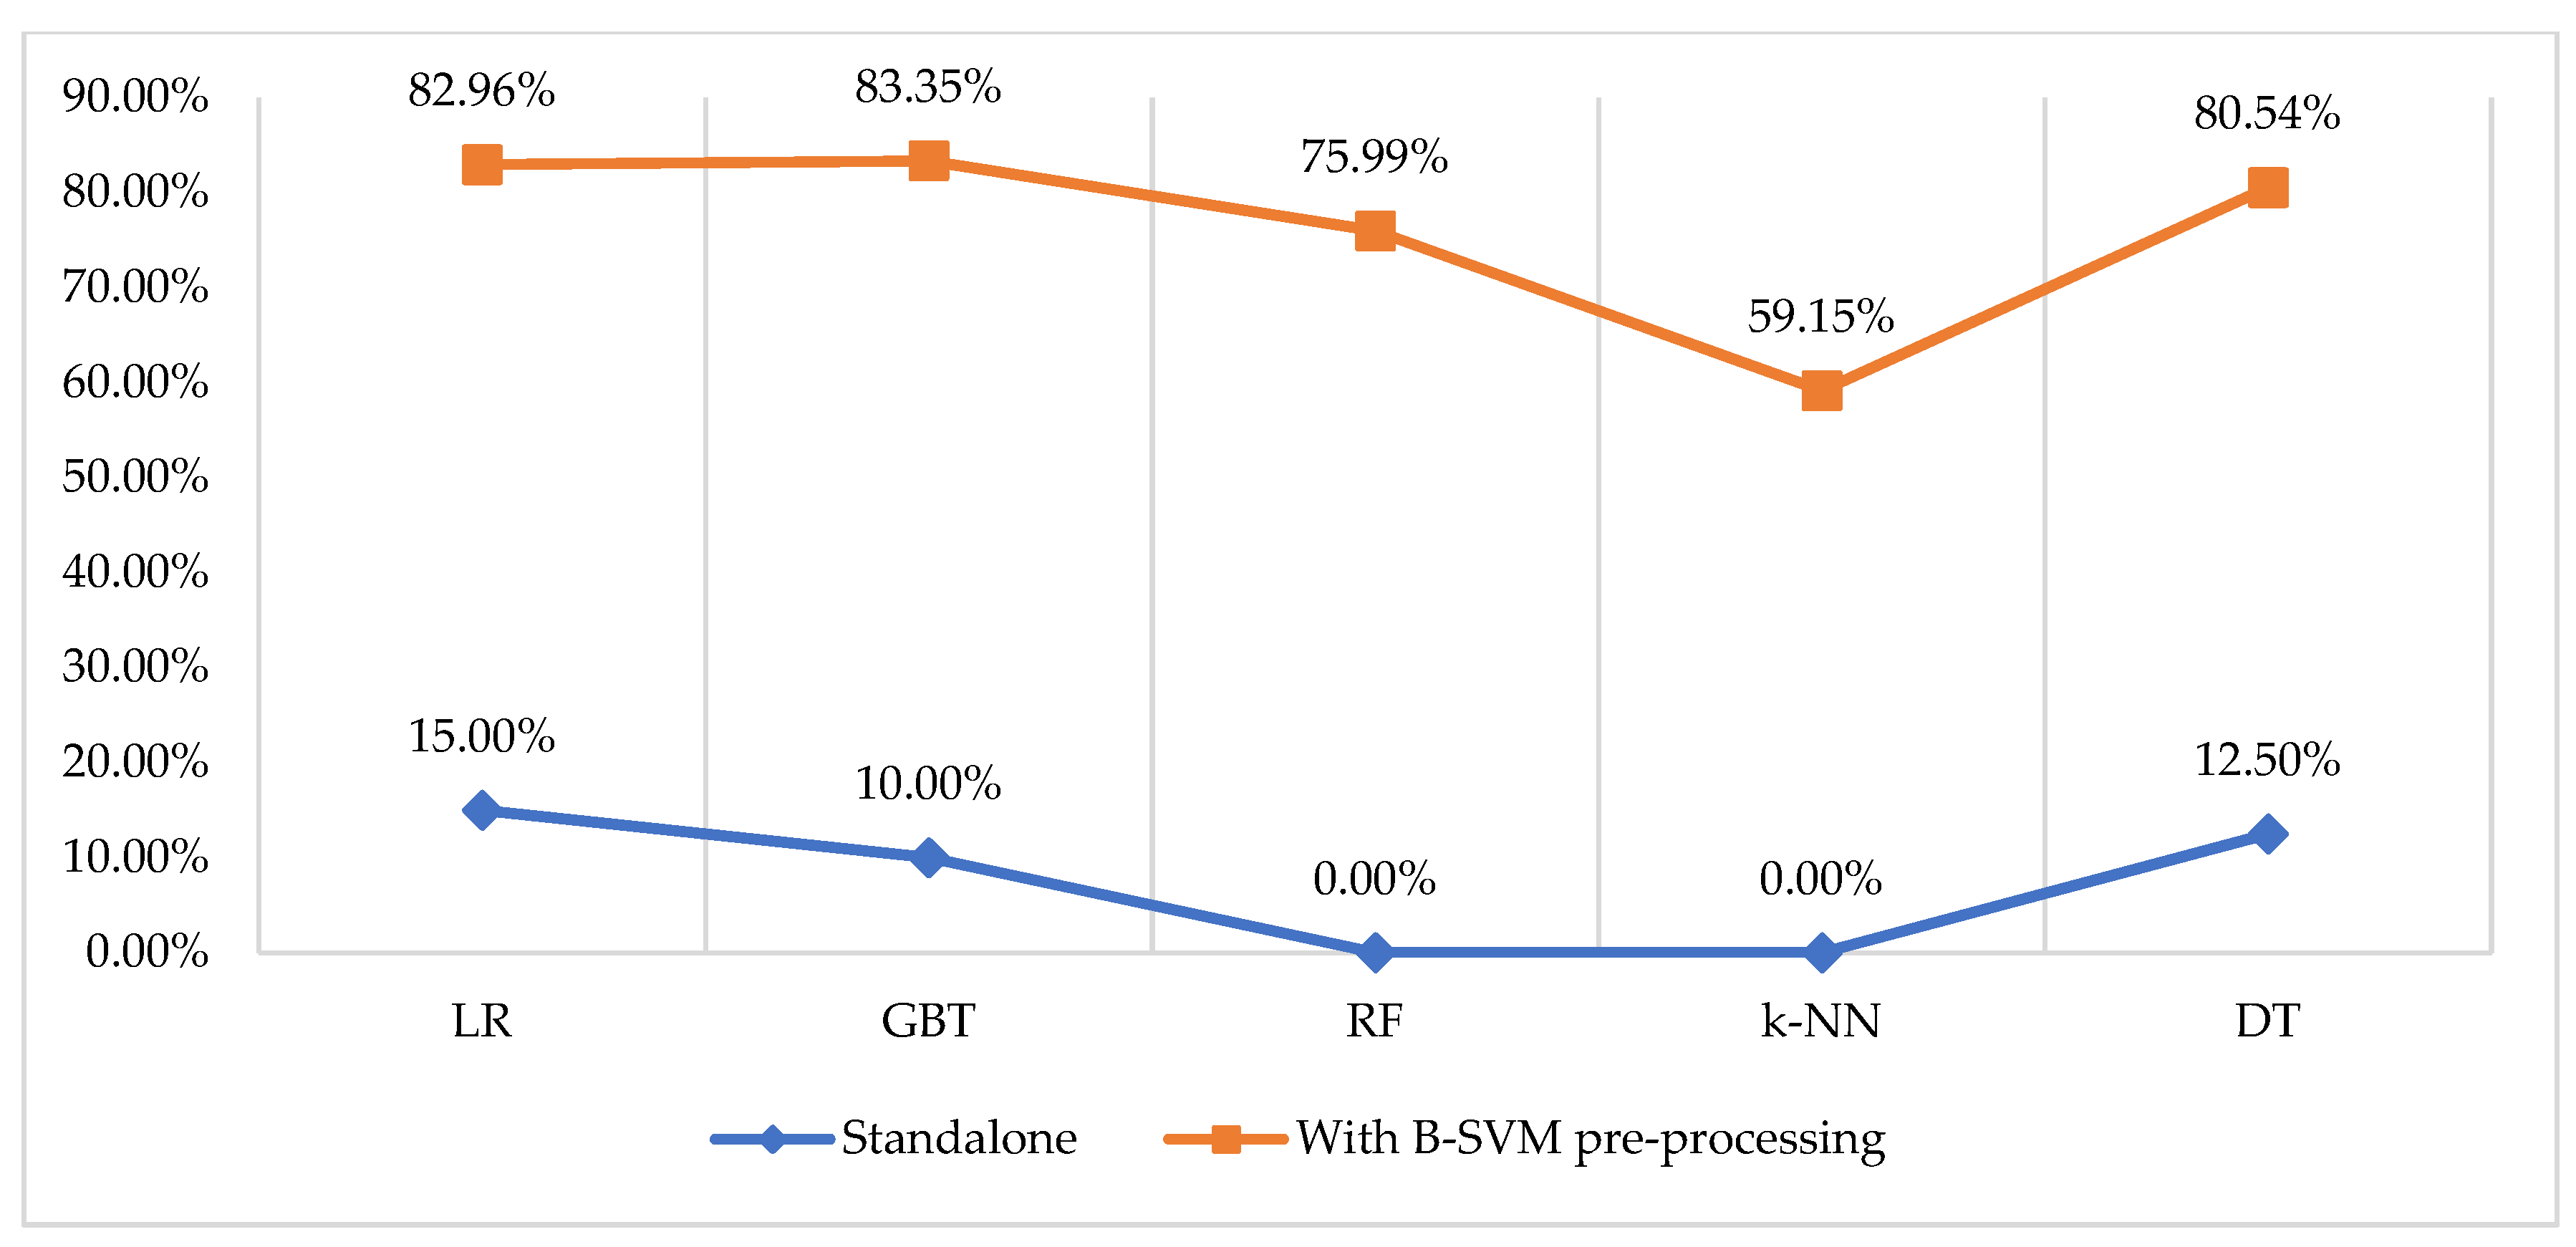
Table 4 shows that sensitivity and AUC were improved across all models after data pre-processing using the B-SVM approach. For instance, RF obtained 0% sensitivity before data balancing, while B-SVM+RF obtained 75.99%. In addition, the AUC metric for some models was relatively low: 0.539 and 0.608 for k-NN and DT, respectively, which is too close to a model not being able to distinguish between the positive and negative classes efficiently. The lowest AUCs in the B-SVM models are 0.831 (B-SVM+k-NN) and 0.954 (B-SVM+LR), indicating excellent model performance.
High accuracy levels across all standalone models result from model bias towards the positive class. Hence, considering the relevance of correctly identifying those customers who will respond to a direct marketing campaign, i.e., true positives, in this study, the focus is on the sensitivity metric, not overall accuracy. From
Table 4, it can be seen that Balanced SVM+GBT achieved the best performance regarding sensitivity: 83.35%. This result indicates potential improvement in future campaign profitability, as the company can precisely target a group of customers with a high probability of a response. For example, Standalone GBT would only correctly identify 10.00% of such potential customers in this dataset. Additionally, B-SVM+LR, a model with the second-best sensitivity performance, would target 82.96% of potential customers with a high response rate likelihood.
The sensitivity levels before and after data pre-processing are shown in
Figure 2.
Another important metric for planning a direct marketing campaign and its budget is the fallout metric. As the fallout result shows a percentage of customers who would be targeted and not respond to the offer, it is crucial to have this metric as low as possible. Hence, Balanced SVM+DT, with a fallout metric of 8.16%, suggests that this percentage of customers would be misclassified as respondents. This is of the utmost importance to keep in mind, especially for those companies facing marketing budget restraints. This study shows that the marketing budget would be efficiently allocated.
6. Model Validation on a Public Dataset
The proposed approach for customer response modelling was validated on a publicly available dataset. The dataset used for model validation was the Direct Marketing Education Foundation 3 (DMEF3).
This dataset consists of 106,284 customers’ transaction data from a catalogue sales company for 12 years, from 1983 to 1995. The dataset includes customer data (ID, day and year of entry in the database, time on file), RFM attributes (number of months since last order, sales amounts and number of orders by product classes, total sales amount, dummy recency variables formed based on the number of months since the last order, and recency quantiles 1–20).
The dependent variable was the number of orders. We transformed it into binomial, i.e., the number of orders greater than or equal to 1 (respondents) was coded with 1 and non-respondents with 0.
Following the procedure from [
38], the present moment was set to 1 August 1990, which resulted in training and test datasets of approximately the same size. The response to the offer in the target period was used as a dependent variable. The response rate in this dataset was 5.4%. The results are shown in
Table 5. It can be observed that B-SVM leads to a significant improvement in model performances, similar to the first dataset. After the data pre-processing and balancing, the sensitivity metric amounted to 95% or over in all models. Additionally, in the case of B-SVM+GBT and B-SVM+RF, the models obtained 100% sensitivity. On the other hand, the fallout was reduced in all B-SVM models to less than 0.3%.
After pre-processing, the AUC in all tested models was close to 1, meaning that the models had a perfect ability to differentiate between the classes of respondents and non-respondents. Moreover, overall accuracy in all B-SVM models was around 99%.
In terms of obtained sensitivity metrics, the B-SVM+GBT model achieved the best performance on this dataset and the Sports Retailer dataset, presented in
Table 4. The obtained sensitivity was 83.35% in the first dataset, while in the DMEF3 dataset, the model achieved 100% sensitivity. On the other hand, the weakest results were obtained using the B-SVM+k-NN for both datasets. Namely, on the Sports Retailer dataset, the sensitivity score of this model was 59.15%, while for the DMEF3 dataset, it amounted to 95.84%.
However, B-SVM pre-processing, with notable improvements across all models, proved to be a powerful technique for data balancing, and the model was successfully validated on this dataset. It has also been confirmed that advanced classifiers with an ensemble meta-algorithm give better results than classical ones on pre-processed data. Better model performances on this dataset are due to a higher response rate. The customer database contains the purchasing behaviour history for 12 years, while the first dataset included data for several campaigns and six months. This validation has shown that this approach can be used in online and offline direct marketing campaign management.
7. Discussion, Implication, and Conclusions
7.1. Summary of the Research
The necessity of selecting relevant customers for efficient direct marketing has grown significantly. Saturated markets and competitive pressures lower customer response and drive marketing expenses [
39]. A result of this issue requires improved response models with a finely tailored approach, allowing businesses to invest in direct marketing with proper and efficient customer selection. As the profitability of the direct marketing campaign is largely determined by the number of respondents, i.e., how many consumers respond to the placed offer, identifying target customers is one of the most significant steps in planning the campaign. The selection of potential customers must be optimised to achieve varied company objectives and maximise campaign profitability.
This research aimed to address the problem of class imbalance in customer response modelling, which is one of the most prevalent issues when using machine learning algorithms in direct marketing and campaign management. This issue is especially present for online customers, whose response rate can be very low due to the large number of website visits that do not result in a completed transaction. The balanced SVM method was used as a pre-processor to discover a solution for the severely imbalanced data.
The proposed approach for customer response modelling was designed to test whether the existing methods for customer response modelling in direct marketing (i.e., predicting customer response to a direct marketing campaign) could be improved, as well as to reduce misclassification for the respondents’ segment, i.e., to propose the solution to the problem of class imbalance on a dataset with an extremely low response rate of 0.41%.
According to the results described in the preceding sections, the proposed approach exhibits excellent predictive performance. Combined with ensemble classifiers, this approach best predicts potential online buyers. The key contribution of this research is that the suggested approach better addresses the problem of class imbalance that occurs while classifying clients in direct marketing than methods presented in earlier studies. Specifically, there was a lower misclassification of the minority class than in earlier results. Moreover, data pre-processing automates the class balancing technique, and the complete application is streamlined.
The model’s reliability was confirmed by applying it to data from the real world. Based on the history of purchasing behaviour from five previous campaigns, customers’ response in the sixth campaign was predicted with high accuracy. Moreover, the models were validated on a different set of data from a different industry and with different data in the customer base, which confirms the robustness of the model, i.e., reliability of the proposed approach.
As customers increasingly become e-commerce users and online shoppers, decision-makers in marketing can focus on creating customised content and improving their targeting systems based on the proposed approach, which reflects the practical significance of the proposed method. With this in mind, tailored social media advertisements may be a powerful tool for connecting with customers online. With correct targeting, the process may acquire new and retain old customers.
7.2. Theoretical Implications
Comparing this paper’s results with those from previous studies, it can be stated that the proposed approach surpasses the predictive performances of previous studies in customer response modelling while still working on a dataset with the smallest response rate. In the previous papers with the smallest observed response rates, Lee et al. [
14] and Kim et al. [
7] displayed a sensitivity level of 73.92% and 23.8%, respectively, as indicated in
Table 1. The best-analysed result, achieved in a study by Asare-Frempong, and Jayabalan [
25], obtained 90.2% sensitivity and 0.927 AUC with a response rate of 11.63%, using a balanced RF. Our results on the Sports Retailer dataset underperformed in the sensitivity levels with 83.35% but achieved a higher AUC of 0.950, using a B-SVM+GBT. However, the response rate in our study was significantly lower. On the DMEF3 dataset, the model achieved a sensitivity and an AUC of 100% and 0.999, respectively, outperforming all previous studies. Chaudhuri et al. [
15] also obtained a high sensitivity of 96% and an AUC of 0.89. Still, there is no indication of the response (or conversion) rate in the used dataset in their paper.
This study reveals that using the B-SVM approach in conjunction with classification techniques improves the predictive ability of the models for predictive customer classification. The findings revealed that the B-SVM efficiently pre-processes the data, resolving noise and class imbalance. B-SVM reduces noise in the data, i.e., class overlapping, and complements the minor class with the most relevant instances by shifting the margin to the closest, and hence most comparable, examples of the larger class and categorising them into the smaller class of respondents. In that way, the minor class is supplemented with a group of highly probable respondents. Companies can target a wider group of potential respondents without wasting marketing budgets on a random or subjective choice.
Thus, this paper contributes in several ways to the existing literature on customer response modelling. First, a customer targeting model has been proposed that identifies respondents from the customer base and those very likely to be, recognising their similarity to respondents. Second, the proposed model had better predictive performance than models from previous studies. Third, the model was validated based on online and offline customers, which can be applied in both cases. Fourth, the possibilities of balanced SVM methods for data purification and balancing in customer response modelling with extremely low response rates have been confirmed. Fifth, the results of advanced and classical classifiers on a pre-processed dataset were compared, and the advantages of advanced ones, in this context, were empirically confirmed. Finally, due to undersampling, the time and technological complexity in the implementation of data pre-processing was reduced, and the application of the proposed method was simplified.
7.3. Managerial Implications
All models after pre-processing showed significant performance improvements. The results can be used in direct marketing decision making and campaign management to precisely and accurately target potential customers. Thus, for example, the best classifier targeted only 10% of respondents without pre-processing, and after pre-processing, as many as 83.35% of very probable respondents. This means that, under our method, 7.3 times more possible respondents were identified, leading to a significant increase in the campaign’s profitability. At the same time, there were less than 10% of incorrectly targeted customers, meaning there will be little wasted campaign cost. By doing so, companies can customise the offer and target those customers with a high probability of a response, cost-effectively and profitably. Saturated markets lead to customers being targeted by numerous offers they are not interested in. Therefore, this approach can help companies target only customers who find the offer relevant.
In line with this, Stone and Jacobs [
40] state that a very creative and original offer may result in a low response rate if the targeting is not done correctly. In contrast, a badly structured and moderately creative offer to the proper target group can lower, but not eliminate, the intended customer response. Hence, decision-makers in direct marketing can benefit from this approach since it allows for more accurate targeting, less message waste, and more profitable campaigns.
Predicting the response to a campaign is particularly important for creating a direct marketing strategy for all campaigns and offers individually. In this way, with information from the model, the company will allocate marketing resources to consumers with the highest probability of response. Adapting marketing activities to defined segments that differ in interests, profitability, value for the company, or other characteristics makes the overall direct marketing strategy more effective [
41]. Additionally, with the development of social networks, which have made it possible to target customers more precisely than ever before, this process gains even more importance to invest marketing resources effectively. In this regard, the customers should be targeted exclusively with relevant advertisements, which could indicate that the company understands their needs and works hard towards maintaining the relationship with them. Namely, considering that some of the applied methods (such as DT, for example) at the output give explicit rules for classifying customers into respondents and non-respondents that are semantically rich and describe these segments, marketers can learn a lot from them about purchasing customer habits and can adjust the offer adequately. So, for example, if it can be seen from the rules that the respondents prefer a certain type or category of products, the following ads can be adapted following this discovery. In addition, decision-makers can recognise the characteristics of customers who are likely to be respondents and, based on them, direct the next ad to those similar to them and thus attract new customers.
Another positive aspect of our method for direct marketing practitioners is its simplicity. Because automated data balancing is employed, there is no need to perform complicated resampling operations. Furthermore, marketing managers are not required to understand the specifics of the learning algorithm or to employ extra specialists or external experts.
7.4. Limitations and Future Research Directions
However, this study also has several drawbacks and limitations. First, due to random undersampling, pre-processing of data may lead to the loss of information that is important for the model to identify respondent-like customers better. Second, the dataset used refers to a short period of several months, so the seasonality of the data was not taken into account. Moreover, the model predicts customers’ behaviour after the transaction and not during the trade itself, which could be more useful in recommending or stimulating the customer.
In line with these limitations, future research could test pre-processing techniques that combine clustering of the major class, ensemble, and undersampling, similar to those in [
26], to provide a more representative sample for this class and to reduce the possibility that some non-respondents similar to respondents are neglected and lost due to random undersampling. Moreover, the method should be tested on other datasets that cover a longer period and multiple campaigns to analyse the impact of data seasonality. It would be interesting to examine the possibilities of the proposed method as part of a recommendation system that would predict customer response during an online shopping session.
Additionally, other digital direct marketing strategy development aspects can be an interesting area for future research, combined with optimising the targeting process.


