Abstract
Customer churn prediction is very important for e-commerce enterprises to formulate effective customer retention measures and implement successful marketing strategies. According to the characteristics of longitudinal timelines and multidimensional data variables of B2C e-commerce customers’ shopping behaviors, this paper proposes a loss prediction model based on the combination of k-means customer segmentation and support vector machine (SVM) prediction. The method divides customers into three categories and determines the core customer groups. The support vector machine and logistic regression were compared to predict customer churn. The results show that each prediction index after customer segmentation was significantly improved, which proves that k-means clustering segmentation is necessary. The accuracy of the SVM prediction was higher than that of the logistic regression prediction. These research results have significance for customer relationship management of B2C e-commerce enterprises.
1. Introduction
Customers are one of the most important assets of an enterprise, and they play a very important role in improving the market competitiveness and performance of the enterprise [1]. Amid fierce market competition, customers can easily choose among numerous products or service providers [2]. Studies show that the cost of developing a new customer is often higher than the cost of retaining an old customer [3]. If an enterprise maintains a good relationship with customers for a long time, it will gain more profits from existing customers. If the customer retention rate increases by 5%, the net present value of the enterprise will increase by 25–95% [4]. When the customer churn rate is reduced by 5%, the average profit margin of an enterprise will increase by 25–85% [5,6]. In order to maintain market advantages, it has become important for enterprises to determine how to make use of existing customer resources and avoid the loss of existing customers [7].
Customer churn prediction techniques can be used to identify customers that may be lost. Then, marketing strategies can be improved according to the forecast results. Retention of existing customers can effectively prevent performance loss [8]. Datta et al. proposed a framework for customer churn management that comprised data acquisition, business understanding, feature selection, a construction model, and a validation model [9], this literature described CHAMP (CHurn Analysis, Modeling, and Prediction), an automated system, and offered specific guiding methods for researching customer churn management, which is significant. Jain et al. showed that in the highly competitive telecom market, companies must analyze corporate behaviors to determine customer loss and take effective measures to retain existing customers [10]. Research on churn prediction was carried out in the telecom, banking, retail, and other industries. For example, in the prediction of telecom customer churn, Coussement et al. examined the customers’ calling behavior, customer and operator’s interaction behavior, package subscription, account information, calling information, and demographic characteristics [11]. Loss prediction was performed through algorithms, such as the logit model, simple linear regression, k-nearest neighbors, decision tree, and artificial neural network [11,12,13]. For the customer churn prediction, credit card information, transaction information, and abnormal usage information have been used to predict customer churn through the logit model and decision tree algorithm [14,15]. Online shopping is a common consumer shopping mode. E-commerce enterprises constantly launch new products; market conditions are constantly changing, and many e-commerce enterprises face the serious problem of customer loss [11].
However, most of the studies on customer churn prediction are concentrated in the telecom, banking, retail, and other industries, and there are few studies on customer churn prediction in B2C e-commerce. Customers in the telecommunications and banking industries need to sign contracts with enterprises, which means the customers are contractually bound. These enterprises can accurately identify customer churn. Online shopping customers do not need to sign contracts with enterprises. The shopping behavior of non-contractual customers is complicated, and the loss state is vague. E-commerce enterprises often find it difficult to judge when and why their customers are lost and whether it is worth retaining them. In addition, the shopping behavior dataset of B2C e-commerce customers contains two types of data. The first type of data is the demographic data of customer groups, such as age, gender, address, contact information, nationality, and social class. E-commerce enterprises can easily obtain the data directly from their database. The other kind of data is customer shopping behavior data, including shopping time, purchase preparation, shopping intention, and attitude toward products [16], this literature (Kotler and Keller) points out the research methods and direction for researchers studying customer relationship management and plays an important role in classifying data attributes. The behavioral data of B2C e-commerce customers are characterized by longitudinal timeliness and multidimensional variables, and such data are usually stored independently in the business database managed by enterprises [17,18]. B2C shopping websites have an extensive variety and quantity of customer data, including customer behavior information, such as shopping time, clicking on product pages, collecting goods, adding to a shopping cart, and shopping frequency. These information variables may have a better ability to predict customer churn. In the previous works on forecasting customer churn in e-commerce, longitudinal behavior data and longitudinal timeliness of customers are often ignored [19,20,21].
E-commerce enterprise managers can use big data and cloud computing to analyze and model consumer behavior data by extracting all kinds of information as well as carrying out customer churn prediction research. This paper builds on existing research and uses B2C e-enterprise, non-contractual customers, as the research object to analyze data and information on shopping behavior. The k-means algorithm was used for customer segmentation, and the random forest was used to select variable characteristics. Finally, a machine learning algorithm was used to construct an erosion prediction model, and the empirical results are discussed. This paper aims to provide B2C e-commerce enterprises with a complete solution for customer segmentation and churn prediction and help enterprise managers realize customer relationship management that utilizes artificial intelligence technologies. The ultimate goal is to formulate reasonable and effective customer retention strategies and reduce operating costs for enterprises.
The rest of this paper is organized into five parts. The next section is the literature review. Section 3 describes the research methods, including the introduction of the basic principles of support vector machine (SVM) and logistic regression (LR). Section 4 presents the empirical methodology, including data pretreatment, customer segmentation based on k-means, feature selection based on random forest, and prediction evaluation indicators. Section 5 presents the experimental results and discussion. Section 6 is the conclusion.
2. Literature Review
The forecasting methods of customer churn can be summarized into three types: forecasting methods based on traditional statistical analysis, prediction methods based on machine learning, and prediction methods based on combinatorial classifiers. The prediction methods based on traditional statistical analysis mainly include linear discriminant analysis, the naive Bayesian model, cluster analysis, and logistic regression. For example, Pınar et al. used a naive Bayes classifier to predict customer churn of a telecom company in 2011. Their results showed that the average call duration of customers was strongly correlated with customer churn [22]. Renjith et al. predicted e-commerce customer churn by logistic regression and proposed a personalized customer retention strategy using machine learning [23]. Caignya et al. combined logistic regression and a decision tree to predict customer churn in the telecom industry [24]. In these studies, traditional statistical analysis methods were used for prediction, and the prediction model had strong interpretability. However, these methods have a limitation while dealing with big data and multidimensional variable data; the prediction performance was not obvious in these cases.
Prediction methods based on machine learning mainly include decision trees, the support vector machine, and artificial neural networks, among others. For example, Neslin et al. stated that decision trees are widely used in practical customer churn prediction. The decision tree algorithm can be applied as the basic model of loss prediction [25]. Zhang et al. used the C5.0 decision tree to predict the loss of postal short message service of telecom enterprises. The results showed that the C5.0 decision tree prediction model had high accuracy [26]. Farquad et al. predicted the churn of bank credit card customers and proposed a hybrid method to extract rules from the support vector machine [27]. Gordini et al. predicted the loss of B2B e-commerce customers, and the results showed that the support vector machine had a good prediction performance in processing noisy, unbalanced, and non-linear B2B e-commerce data [7]. Tian et al. predicted the churn of telecom customers, extracted appropriate variables from the original data with a two-layer neural network and proposed a churn prediction model based on an artificial neural network. The results showed that the prediction effect of this method was better than that of the decision tree and naive Bayes classifier [28]. Yu et al. studied the prediction of telecom customer churn, used iterative particle classification optimization and particle fitness calculation to train the prediction model, and proposed a BP neural network based on particle classification optimization. The results showed that their method improved the accuracy of churn prediction [29].
The prediction methods based on combinatorial classifiers integrate several weak classifiers and form a strong classifier. Commonly used combinative classifier methods include AdaBoost, XGBoost, and random forest. For example, Wu et al. studied the e-commerce customer churn prediction problem by balancing positive and negative class data by adjusting the sampling ratio, reducing the size of the dataset, and improving the classification accuracy of the classifier by combining the AdaBoost algorithm. The results showed that Adaboost had a good prediction effect [30]. For datasets with time characteristics, such as that of telecom industry customers, Ji et al. proposed a hybrid feature selection algorithm based on XGBoost. The algorithm chose features from two angles to select the most important characteristic to predict customer churn while removing redundant features. The experimental results showed that this method had a good prediction performance [31]. Ahmed et al. studied the prediction of customer churn in the telecom industry and proposed a prediction model based on a combinatorial heuristic algorithm [32]. Ying et al. performed an in-depth study on the duality of bank customers and adopted integrated LDA and boosting methods to predict customer churn and achieved good prediction results [33]. Zhang et al. used CART and the adaptive boosting integrated model to predict telecom customer churn. The results showed that their method had high prediction accuracy [34].
In summary, researchers have used various forecasting methods to conduct in-depth research on the churn of contractual customers in the telecom industry, banking industry, and B2B e-commerce enterprises. Previous works have also discussed the advantages of various methods, thus making valuable contributions to the research on churn prediction of contractual customers. Customer loss of B2C e-commerce enterprises is concerning. Such customers’ shopping behavior is multidimensional, and their shopping intentions and tendencies are personalized. Therefore, using the characteristics of customer data, this work studies the loss of non-contractual customers of B2C e-commerce enterprises.
3. Research Methods
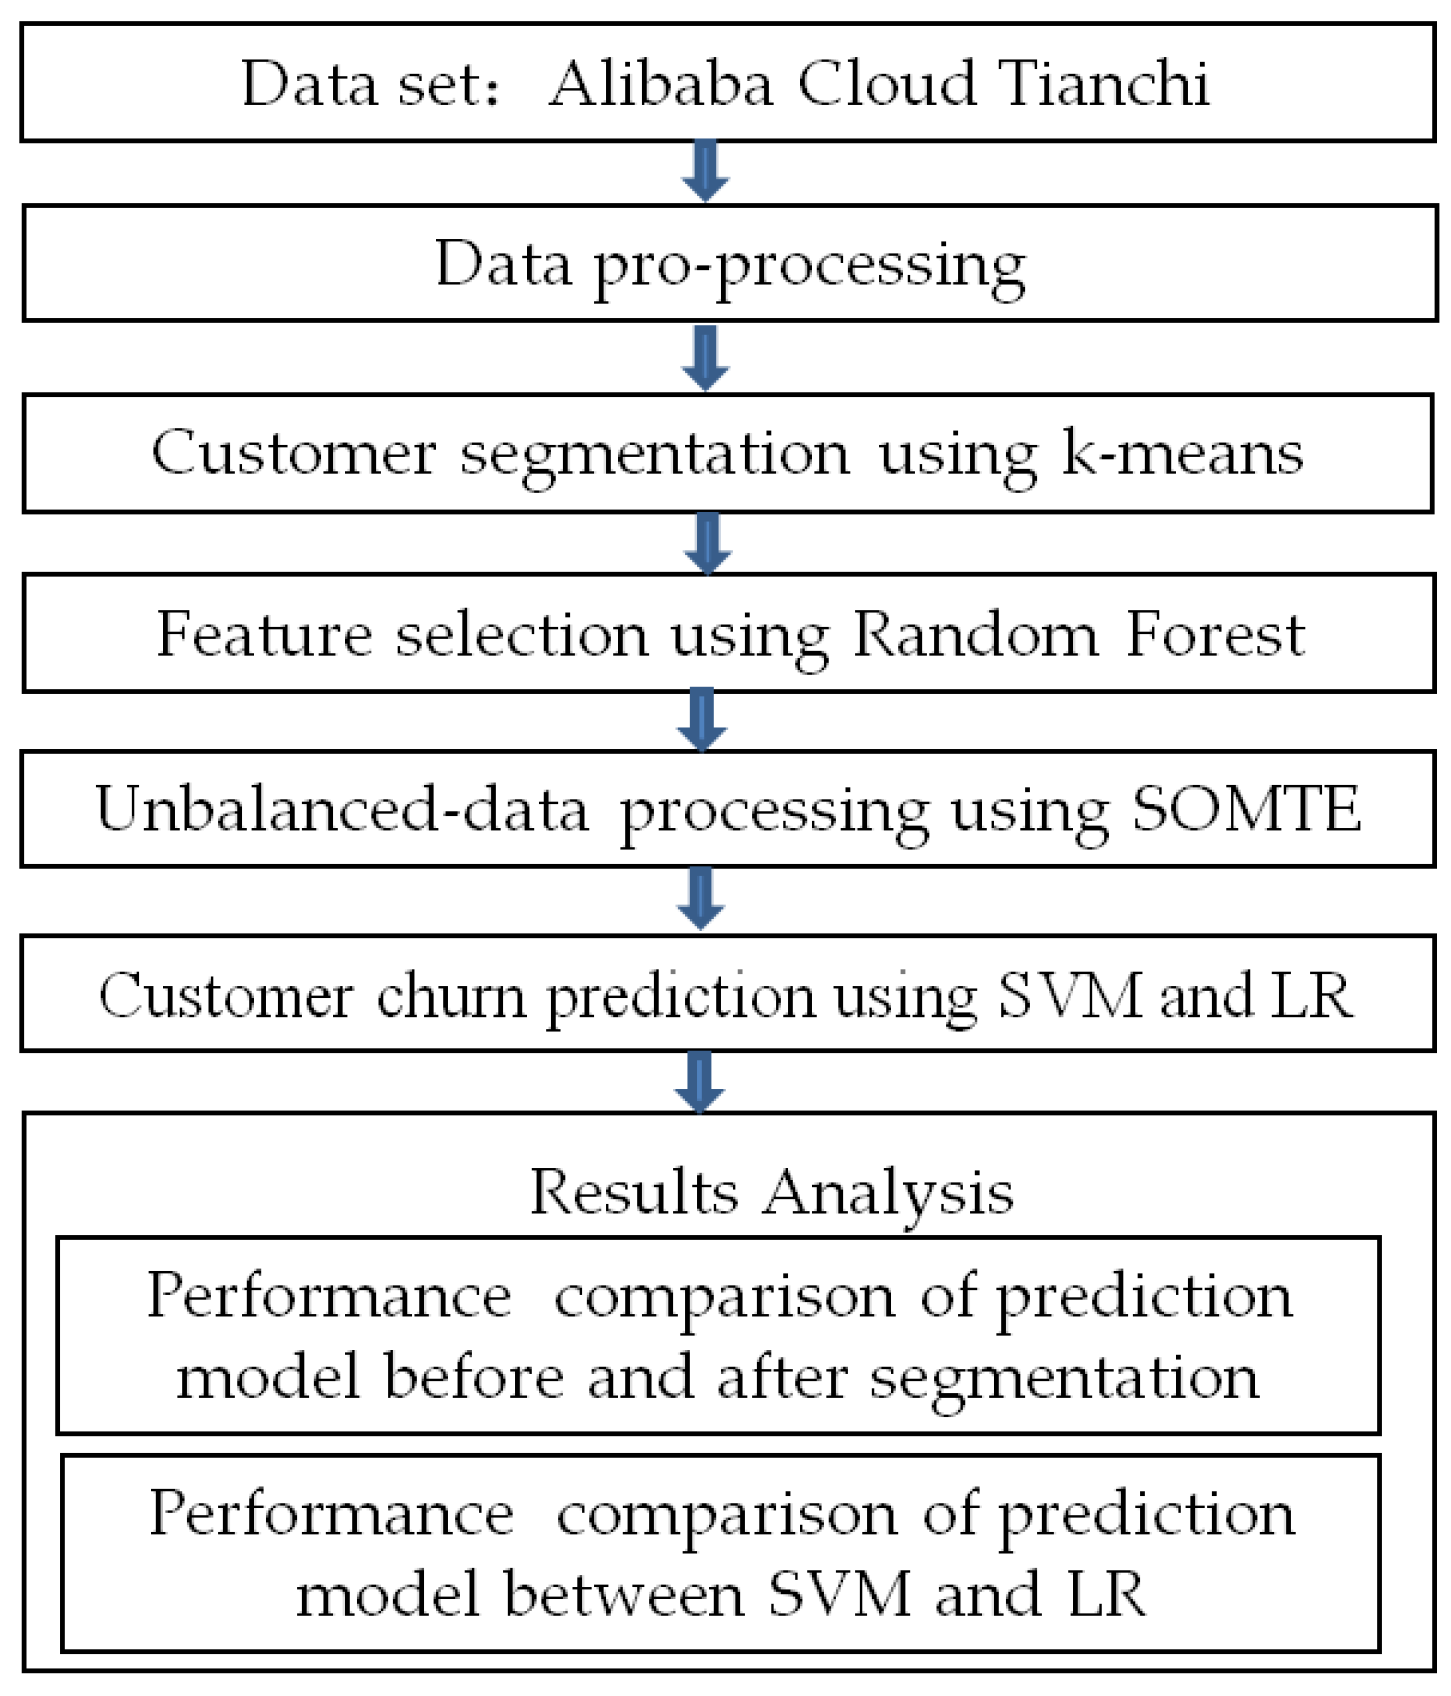
E-commerce customers have two possible behaviors: customer churn and customer non-churn. Therefore, customer churn prediction is a binary classification problem. Online shopping has its own characteristics in terms of shopping time and behavior. Taking shopping time and behavioral tendency into full consideration may play an important role in judging customer loss. In this research, there are two important steps- customer segmentation and churn prediction. The clustering algorithm and prediction model that are expected to be adopted are important tasks that must be determined. The chosen clustering algorithm is dependent on the type of data and the purpose of clustering. In the literature on customer segmentation from the last five years, the customer segmentation method via k-means has been adopted in the e-commerce [35,36], retail [37,38], finance [39,40], and telecommunications industries [41,42]. This algorithm can help process large-scale data and exhibits simple calculation and high operation efficiency, and thus has been widely adopted in other industries [43]. In terms of prediction models, comparisons among prediction effects of different models for most literature are made by using a unified data set to determine the optimal one. In the literature on churn prediction [7], by comparing prediction models, such as LR, SVM, Neural Network, Decision Trees, and Random Forest, the research results show that the SVM model exhibited a positive prediction performance with a quick training speed. Therefore, considering the obvious advantages of the k-means and SVM algorithms, we chose the k-means and SVM as the main algorithms in this paper and made a comparative analysis through LR. On the basis of pre-processed data, this study first uses the k-means algorithm for the clustering subdivision of customers and then uses the LR algorithm and SVM algorithm to establish prediction models. The prediction accuracy and effectiveness of these two prediction models are investigated, and a comparative analysis is conducted. The research process is shown in Figure 1.
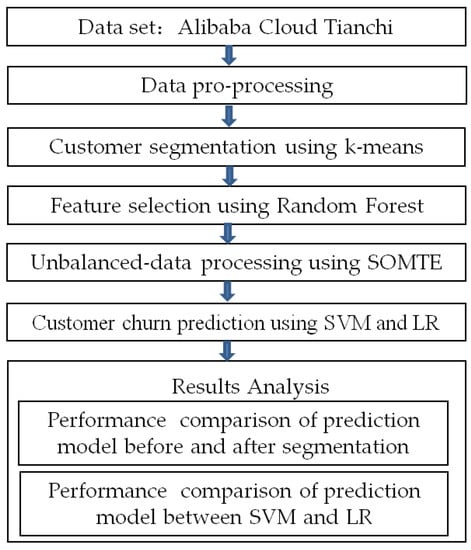
Figure 1.
The process of the SVM and LR models for customer churn prediction.
The following is a brief introduction to the algorithms of SVM and LR.
3.1. Support Vector Machines
Support vector machines are linear classifiers [44,45,46] that classify data by solving quadratic optimization problems to establish the optimal separation plane between datasets. SVM can also be applied to nonlinear classification problems by kernel function transformation. SVM transforms the original problem into a more solvable dual problem through the Lagrange multiplier method, which is mathematically expressed as:
Take partial derivatives of w and b, and set them to 0, yielding:
Substitute Equations (2) and (3) into Equation (1), and finally convert the original problem into the following objective function (4) for the solution:
SVM can simulate the nonlinear decision boundary well with the kernel function and also control overfitting.
The advantage of SVM is that it can improve the generalization ability and deal with high-dimensional data problems.
3.2. Logistic Regression
Logistic regression is a classical classification method [47,48]. It predicts the probability of the categories of the dataset of unknown categories through the dataset of the existing category labels. It can be expressed as P(Y|X) in the form of a conditional probability distribution. Take dichotomies as an example, where X is an n-dimensional vector and Y is 0 or 1. The mathematical expression of the prediction result is:
where the real values of the linear regression model z = WTx + b are transformed into values between [0, 1] by the sigmoid function. In other words, the result of a certain sample X calculated by Equation (5) or (6) is the probability that the sample point X belongs to a certain class. We can categorize them by setting thresholds. Generally, values calculated by the sigmoid function are classified as category 1 if they are greater than or equal to 0.5 and category 0 if they are not. The advantage of LR is that the results are easy to interpret and applicable to both continuous and categorical variables.
4. Empirical Study
4.1. Data Preparation
The original dataset was the dataset published by the Alibaba Cloud Tianchi platform [49] for scientific research and big data competitions. This dataset contains all the behavior data of 987,994 random users who have shopping activities between 23 November 2017 and 4 December 2017. The data set includes five categories of indicators, namely User ID, commodity ID, Item ID, Behavior Type, and Timestamp. Among them, there are four types of behaviors: PV (page view of an item’s detail page, equivalent to an item click), Buy (purchase an item), Cart (add an item to the shopping cart), and Fav (favorite an item). The original data were preprocessed and the time of shopping behavior was divided into two stages: the first six days as the observation period and the last six days as the verification period. A customer who bought more than once during the observation period and bought again more than once during the verification period is defined as a non-lost customer and is represented by 0. Customers who purchased more than once during the observation period and 0 times during the verification period were defined as lost customers and represented by 1. In the R statistical language, customers were first grouped according to User ID, then the purchase times of each customer in the observation period and verification period were calculated, and the customers that met the screening conditions were retained. Finally, 95,388 pieces of data of 8156 customers were retained, among which 7576 customers were lost, accounting for 92.8%. There were 580 non-lost customers, accounting for 7.2%. Customer data was unbalanced, so the data imbalance was addressed.
4.2. Data Preprocessing
Data preprocessing is a key step in customer churn prediction. First, the R language function as. POSIxCT was used to convert the timestamp of each piece of data in the original data into “year, month, day” and “hour, minute, second” in accordance with the time format. As the behavioral intention is implied in customer shopping transaction data and behavior may play an important role in the emergence of problems, behavioral intention as a potential factor is weakened or even ignored in traditional customer behavior analysis [50,51]. Therefore, to further study the intention of customers’ shopping behaviors in different time periods, this work divided the time when shopping behaviors occurred. Our definitions were 00:00 to 06:00 is Daybreak; 06:00 to 12:00 is AM; 12:00 to 18:00 is PM; and 18:00 to 00:00 is Night. Then, the shopping behavior of each customer in these four time periods was counted.
The behavioral data in the dataset are PV number, Buy number, Cart number, and Fav number. The behavioral data were further subdivided, and the data types were finally sorted, with 17 types of variables. Specifically, the items were Categories, Daybreak PV, Daybreak Buy, Daybreak Cart, Daybreak Fav, AM PV, AM Buy, AM Cart, AM Fav, PM PV, PM Buy, PM Cart, PM Fav, Night PV, Night Buy, Night Cart, and Night Fav.
4.3. K-Means and Customer Segmentation
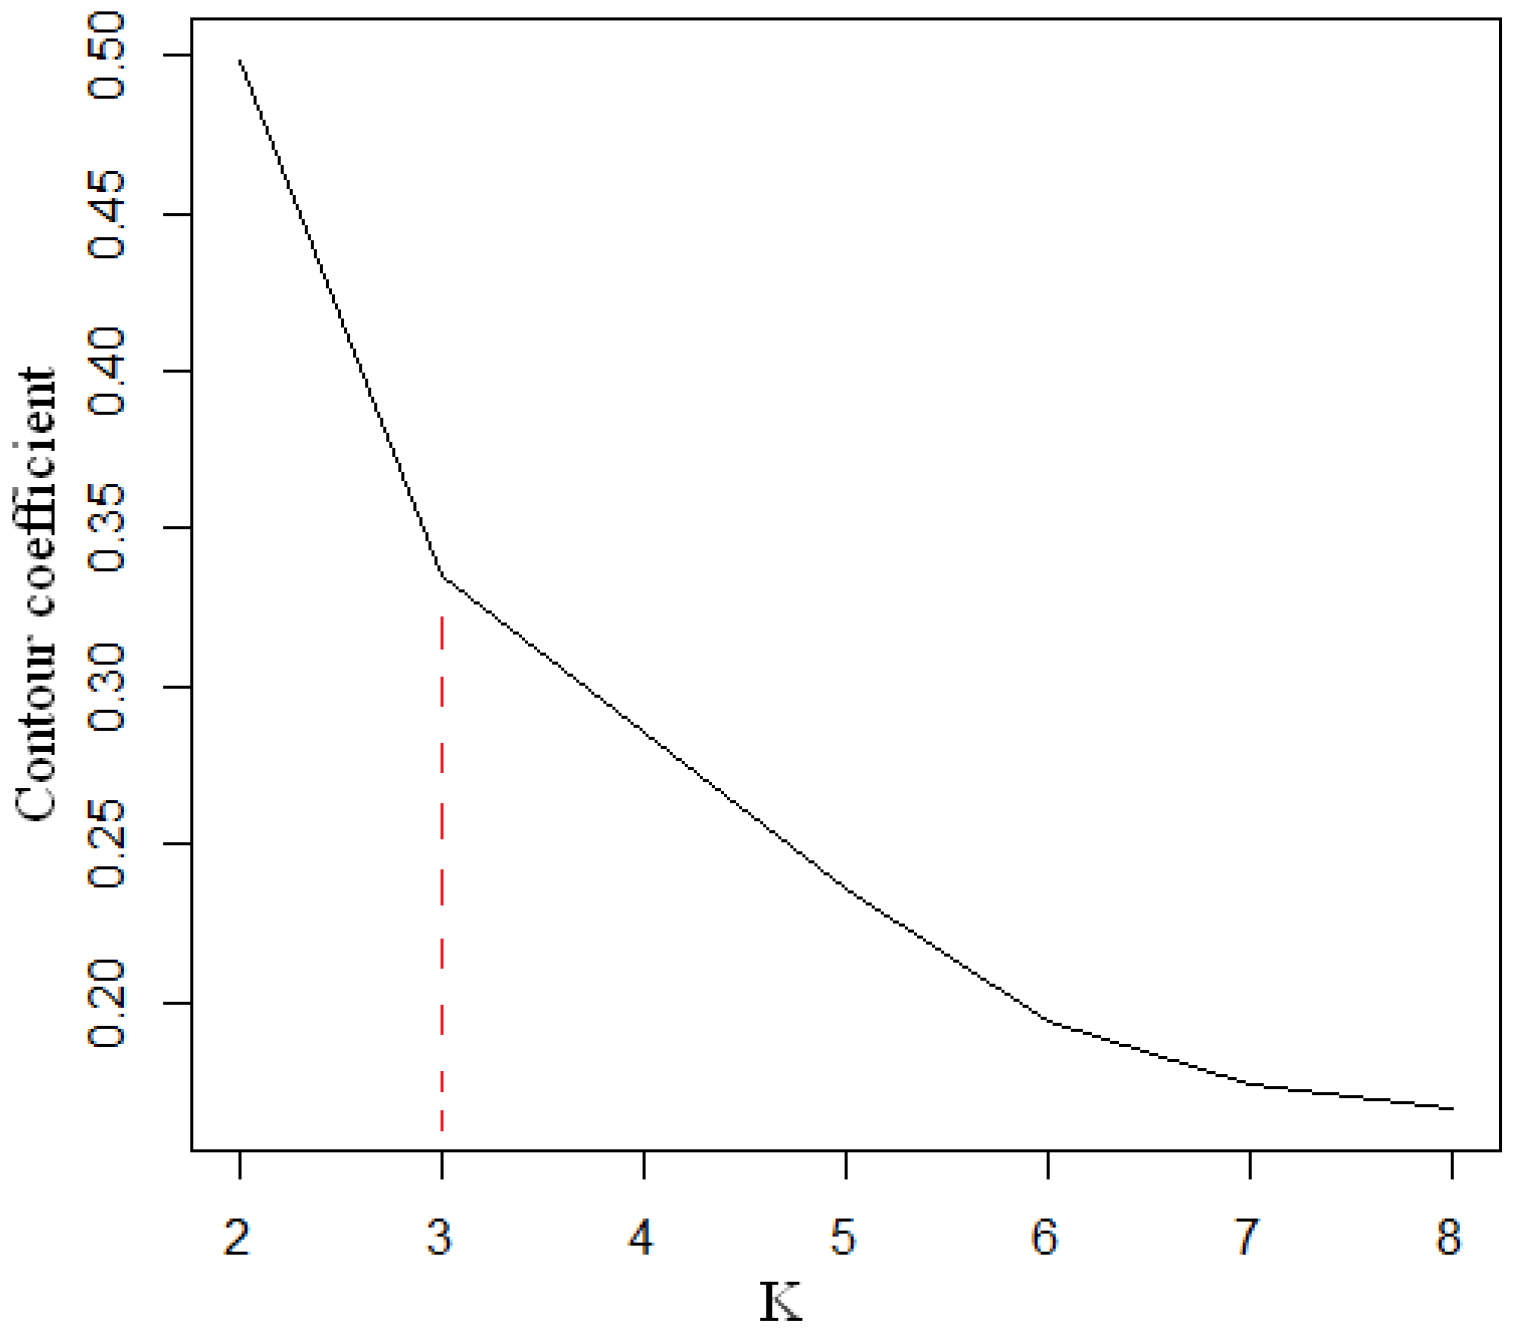
One of the tasks of customer churn management is to divide customer groups into various types according to their shopping behaviors, such as valuable core customers, which are loyal customers and easy-to-lose customers. To formulate targeted marketing strategies for customers, enterprises must subdivide customers. In this study, k-means was used for customer segmentation. As a classical algorithm of unsupervised clustering, k-means is similar to a fully automatic classification. The more similar the cluster is, the better the clustering effect will be. The algorithm is simple, easy to implement, and has good clustering performance, so it is widely used [52,53]. The variables of k-means clustering were the 17 variables mentioned above. For the given unlabeled sample data set, the cluster number K was determined in advance so that the samples in the cluster were distributed together as closely as possible and the distance between clusters was as large as possible. By enumerating K from 2 to 8, we obtained the relation between the contour coefficient and K (Figure 2).
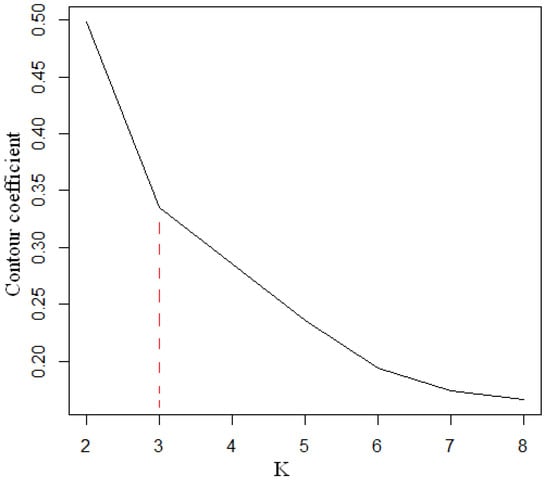
Figure 2.
Relationship between the contour coefficient and K.
As can be seen in Figure 2, we clustered data into three categories and observed the number of lost and non-lost samples of each cluster customer group. The clustering results are shown in Table 1.

Table 1.
Results of K-means classification.
As can be seen in Table 1, there were 4935 customers in Cluster I, among which non-churn customers were 484, accounting for 9.8% of the total number of Cluster I customers. There were 2697 customers in Cluster II, of which 83 were non-churn customers, accounting for 3.1% of the total number of Cluster II customers. There were 524 customers in Cluster III customers, of which 13 were non-churn customers, accounting for 2.5% of the total number of Cluster III customers. The customer churn rate of Cluster I was 90.2%, that of Cluster II customers was 96.9%, and that of Cluster III customers was 97.5%. Therefore, Cluster I customers were the core customer groups to be focused on.
4.4. Random Forest and Feature Selection
The customer churn data set contained many customer features, and not all variables were conducive to churn prediction performance. Excessive redundancy and irrelevant variables in the dataset may hinder the predictive performance of the model [54]. Therefore, feature selection was carried out next. Random forest is an effective feature selection algorithm with high classification accuracy, good robustness to noise and outliers, and strong generalization ability [55]. Therefore, random forest has been widely used in business management, economics, finance, biological sciences, and other fields. The number of variables in this study was high at 17, so the random forest algorithm was used to select feature variables. The key problem in feature selection is how to select the optimal number of features (M). The out-of-bag error (OOB error) was used to determine the number of features [56]. When each tree was constructed using the random forest, different bootstrap samples were used for the training set. Due to the characteristics of sampling, the OOB error was calculated. The calculation results of the OOB error are shown in Table 2.
Table 2.
OOB error.
By changing the number of randomly selected features each time, the difference of out-of-bag error rate was found to be very small, and the influence of feature number M was not large. When the number of features selected was 4 each time, the OOB error was relatively small. So, the random forest with the feature number M set to 4 was established and the importance of the variables was output, as shown in Table 3.
Table 3.
Importance of random forest variable selection.
The Gini index in the random forest can be used to judge the importance of features, and the importance of each variable can be judged by calculating the value of the Gini index. The larger the Gini value is, the stronger the importance of the variable is [57]. According to the results in Table 3, four variables were selected as the variables of loss prediction, namely, “Night Buy,” “PM Buy,” “Night PV,” and “PM PV”.
4.5. Data Balancing
Since there was an imbalance between the number of non-churn customers and churn customers (580 non-churn, 7576 churn), the data imbalance was remedied. One of the most commonly used techniques for processing unbalanced data is sampling, such as over-sampling and under-sampling [58]. In this experiment, the oversampling rate was 1:1, and the dataset was balanced by SMOTE [59]. The balanced dataset is shown in Table 4.
Table 4.
The balanced dataset.
4.6. Evaluation Metrics
The evaluation methods were mainly through the generation of the confusion matrix, and on this basis, the accuracy, recall rate, and accuracy were calculated. These three indicators were used to measure the prediction effect of the model. After drawing the receiver operating characteristic curve, the area under the receiver operating curve (AUC) was used for comprehensive evaluation [60,61].
Accuracy is the proportion between the positive and negative sample size and the total sample size that is accurate in the overall prediction. It mainly measures the accuracy of the overall predictions of the model.
Recall is the proportion of correctly predicted positive sample size to the actual number of positive samples, and it reflects the coverage of the model.
Precision is the proportion of the number of positive samples correctly predicted to the number of positive samples, mainly indicating the accuracy of the positive samples.
TP (true positive) and TN (true negative) indicate how many predictions were correct.
FP (false positive) and FN (false negative) indicate how many predictions were wrong.
5. Results and Analysis
After the data imbalance processing was completed, the balanced data were input into the SVM and LR models for prediction. Several iterations were performed until convergence was achieved. Ten-fold cross-validation was used to divide the data into 10 parts, nine of which were used as the training set and one as the test set. The average value of the predicted experimental results obtained from 10 experiments was used as the final evaluation result of the SVM and LR models.
The SVM and LR models were applied to the test set data to obtain the confusion matrix. Table 5 and Table 6, respectively, show the confusion matrices before and after subdivision, and Figure 2 and Figure 3, respectively, show the ROC curves predicted by the SVM and LR models before and after subdivision.
Table 5.
SVM confusion matrix before segmentation.
Table 6.
LR confusion matrix before segmentation.
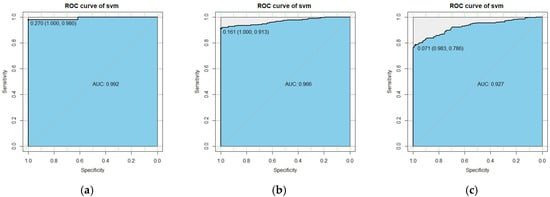
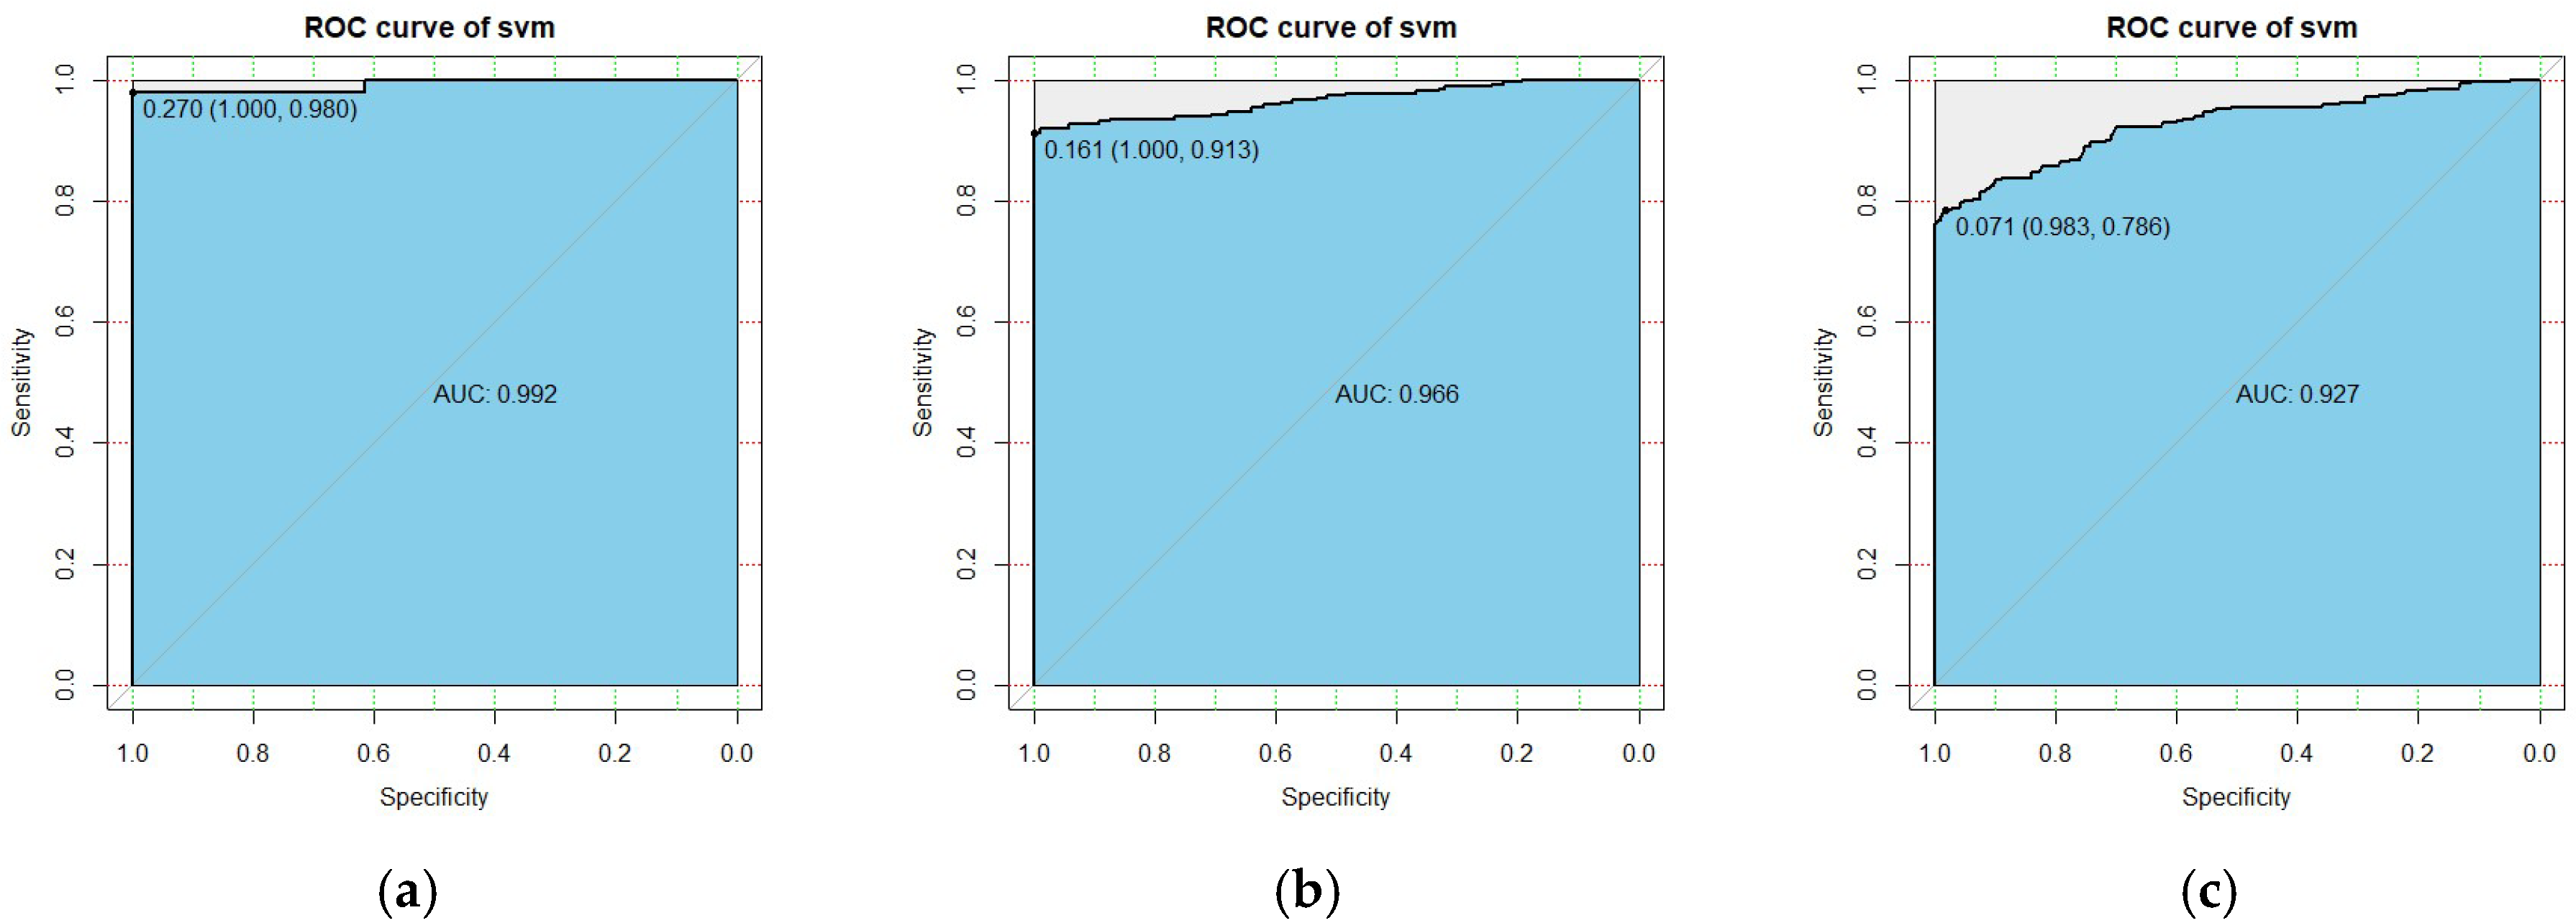
Figure 3.
The ROC curve of the SVM after segmentation. (a) Cluster I; (b) Cluster II; (c) Cluster III.
5.1. Customer Segmentation Analysis
Customer segmentation can help enterprises improve product marketing plans and re-formulate communication strategies with core customer groups. It matches products with customer preferences, which helps to re-plan products and speed up delivery [62]. In this paper, k-means were used to subdivide the sample data into three types. Table 1 summarizes the distribution of the number of customers of these three types. Most of the customers were concentrated in Cluster I. The number of Cluster I customers was 4935, accounting for 60.5% of the number of customers. The customer churn rate of Cluster I was 90.2%. Compared with the customers of Cluster II and Cluster III, the non-churn rate of this kind of customer was higher by 9.8%, and the number of customers of Cluster III was the least. With only 524 customers, Cluster III also had the highest attrition rate. This result means that Cluster I customers may be the core customers of enterprises, who should be paid more attention to while formulating marketing strategies and predicting customer churn measures. It also indicates the effectiveness of the k-means algorithm in customer segmentation. These insights are valuable for data analysis and customer churn modeling of B2C e-commerce enterprises.
5.2. Forecast Model Performance
We conducted comparative experiments on the SVM and LR models. Accuracy, recall, and precision values for each category were calculated according to the confusion matrix to evaluate the performance of the three categories in the dataset. Table 7 and Table 8 show the experimental results of the SVM and LR model predictions, respectively, after customer segmentation. It can be seen from Table 7 and Table 8 that the prediction accuracy of the SVM model for the three types of customers was higher than that of the LR model, and the prediction effect of the SVM model was good. However, to confirm the prediction quality, accuracy alone is sometimes misleading [63]. Therefore, when evaluating the prediction performance of the model, not only accuracy but also recall and precision should be observed, and the performance of the prediction model should be comprehensively determined according to the three performance indicators: accuracy, recall, and precision. In the experimental results of this paper, on average, the three indicators of the SVM model after customer segmentation were 0.9156, 0.9721, and 0.861, and those of the LR model were 0.9066, 0.9498, and 0.8533. Therefore, the prediction performance of the SVM model was better than that of the LR model.
Table 7.
SVM confusion matrix after segmentation.
Table 8.
LR confusion matrix after segmentation.
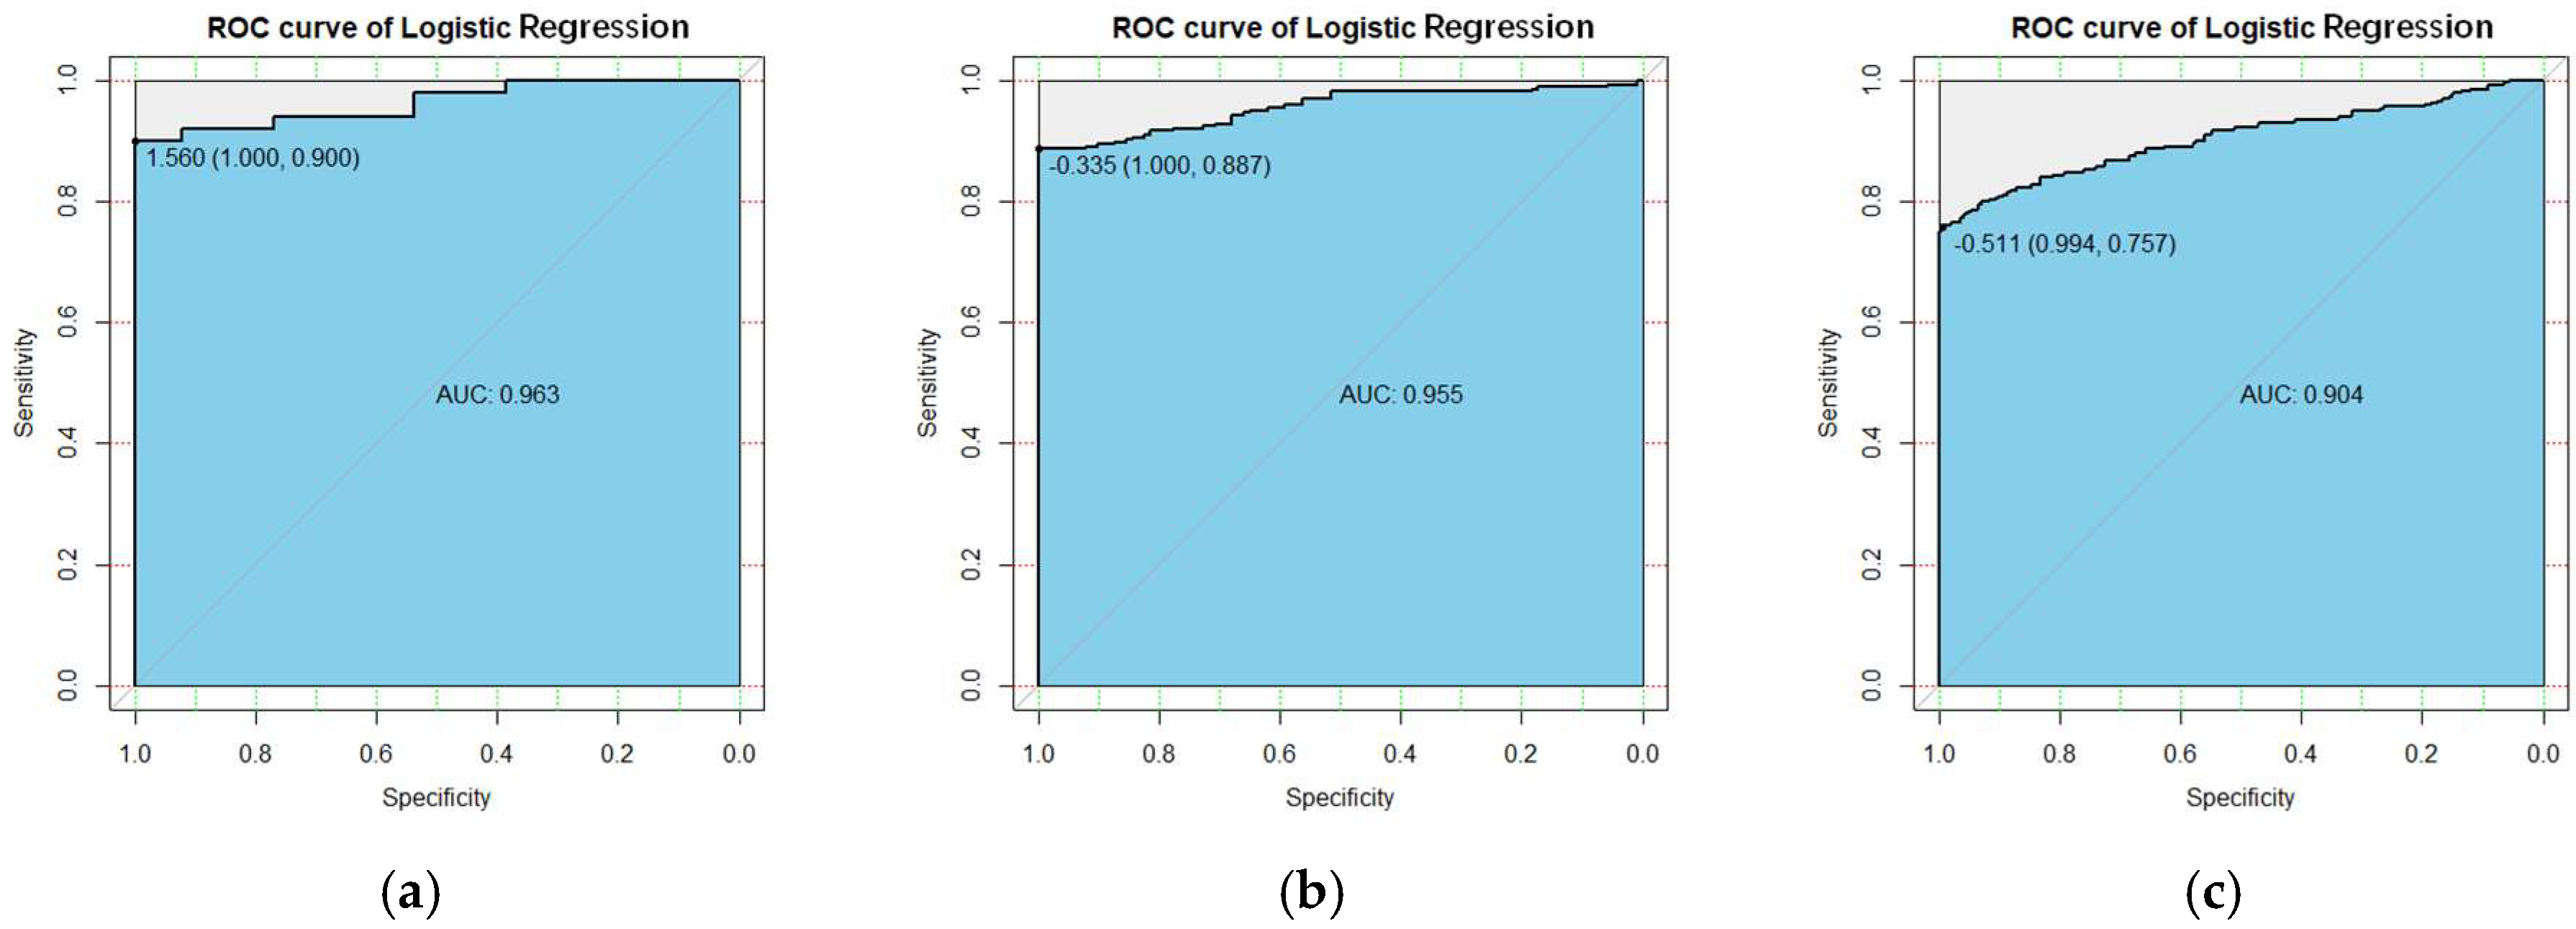
The generalization ability of a prediction model is an important aspect of whether the prediction performance of the model is satisfactory. Therefore, we used the ROC and AUC to evaluate the generalization ability of the model. ROC can easily detect the influence of arbitrary thresholds on the generalization performance of the learner [64,65]. Figure 3 shows the ROC corresponding to the SVM model after subdivision. It can be seen from Figure 3 that when the threshold values of Cluster I, Cluster II, and Cluster III were 0.27, 0.16, and 0.071, the sensitivity was 0.98, 0.913, and 0.786. The specificity was 1.0, 1.0, and 0.983, and the AUC was 0.992, 0.966, and 0.927. Similarly, the performance indicators of the LR model can be seen in Figure 4. These experimental data prove that the SVM model has good generalization ability and good prediction performance. We recommend using the SVM model for customer churn predictions in B2C e-commerce analyses.
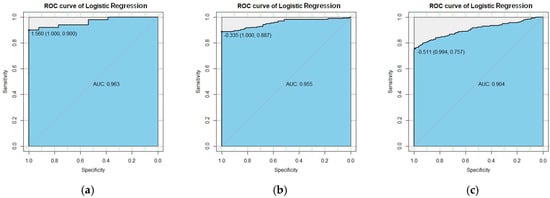
Figure 4.
The ROC curve of the LR after segmentation. (a) Cluster I; (b) Cluster II; (c) Cluster III.
6. Discussion
As mentioned in the first part of this paper, the behavioral data of B2C e-commerce customers is characterized by vertical timeliness and a variety of behavioral information (PV, Buy, Cart, and Fav). We take those shopping behaviors recorded with time periods (segments) as an important variable characteristic and segment the shopping time into four periods (Daybreak, AM, PM, and Night), which is a new opinion of this paper. Among the customer segmentation models, the classical RFM model is popular. The recency in the model takes the time information as the variable, i.e., the time variable. To study the impact time variables have on customer segmentation and churn prediction, Chang et al. [66] extended the time variable and offered an LRFM model based on RFM. L is defined as the number of time periods (such as days). The research results show that the number of time periods (L) is an important variable for customer churn prediction and can be used to evaluate customer loyalty. Rachid et al. [67] studied the LRFM model using a data set from online retailers (electronics, fashion, household appliances, and children’s products) and took the number of time periods as an important variable for churn prediction. The results show that customer shopping behaviors in different time periods (days) are quite different. In the literature of Wu et al. [30], the shopping periods of e-commerce customers were divided into three periods, i.e., day, night, and late night (not segmented into “hours”). The results show that the customer churn rates in different periods are different. Alboukaey et al. [41] proposed an RF-Daily model, in which the time variable was defined as daily dynamic behavior (not monthly dynamic behavior). The daily dynamic behavior and other variables form the multivariate time series. The results show that the churn prediction effect of the model is good, and the daily model is significantly better than the monthly one. Chen et al. [68] also extended the RFM model and proposed an LRFMP model, in which the Time Variable L represents the time between transactions. The results show that the time between transactions has a great impact on customer churn.
The time (period) variable described in this paper is divided into “hours”. In the prediction data set, excluding the variable of Categories, the data variables in this paper are composed of time variables (Daybreak, AM, PM and Night) and four behavior variables (PV, Buy, Cart, and Fav). Our model can be called RF-PBCF, and the empirical research shows that the Night and PM variables have a great impact on churn predictions. It can be seen from Table 3 that the importance of Night Buy and PM Buy variables ranks as the top two. Our results are fundamentally consistent with the results of the aforementioned literature, namely, the shopping time variable is key to churn prediction, which embodies a new value for this paper. Marketing managers are particularly interested in when customers shop because this time variable segmented into hours can provide operable information for them. They can then provide real-time and customized product promotions for customers during these time periods according to this operable information for the sake of continuous customer retention.
The literature on B2C e-commerce customer relationship management primarily focuses on researching customer churn prediction modeling [69,70,71]. One of the purposes of customer churn prediction for enterprises is to evaluate the effectiveness of customer retention measures and conduct targeted commodity promotion activities for retained customers. These marketing strategies should be operable, or enterprises should not only determine target customers according to the customer churn tendency but evaluate the practical effects of customer retention measures according to the practical situation [72]. This paper adopts the research method Classification before Prediction. The customers are first segmented into three types according to the k-means algorithm. After the type of customers is made clear, customer churn can then be predicted. The recent literature [73] emphasizes the importance of customer segmentation, which places customer segmentation as the first step, and is thus fundamentally consistent with our research method (Classification before Prediction). For e-commerce enterprises, our research method holds practical significance. For example, when an enterprise determines that Cluster I is the key customer group to be focused on, it can make a churn prediction for Cluster I customers through an appropriate algorithm, judge the churn tendency of Cluster I customers according to the prediction and evaluation indicators and then formulate appropriate marketing strategies. If the enterprise cannot judge such customers in time, no effective customer retention strategies will be carried out, and, accordingly, part of the Cluster I customers may be subject to churn. Therefore, the research method utilized in this paper fully takes into account customer retention. Our research results reflect practicality, which embodies another important value of this paper.
LR and SVM are compared to judge the prediction performance of the two models, which is consistent with the research methods and results of other literature. The prediction performance of SVM is better than that of LR [74,75,76]. When evaluating the prediction performance of a model, undoubtedly several performance indicators are always used. Our research adopts three indicators, namely Accuracy, Recall, and Precision, which are basically the same as those evaluation indicators mentioned in other literature [7,77,78]. However, we believe that the customer data of e-commerce enterprises is unique. Enterprises often change product information or upload a variety of evaluation information about consumption for the sake of customer retention, which is quite different from financial and telecommunication customer information. The training and testing times of various prediction models are quite disparate when dealing with customer data. As a matter of fact, when we use the SVM model to train customer data, the data training time for SVM is significantly reduced than that for LR. To retain customers, e-commerce enterprises need to predict customers in real time. Therefore, the operational efficiency of the models should be considered, which is mentioned in only a few pieces of literature [57].
6.1. Theoretical Implications
Our research results, to some extent, are enlightening for model development in B2C e-commerce customer churn predictions and customer relationship management in enterprises. We first made some contributions to the existing literature on customer segmentation and churn prediction models in the B2C e-commerce industry. In this paper, four variables that directly affect consumer shopping behaviors were selected based on various information from current online shopping websites as our data variables, and a new customer churn prediction model is thus developed. The variables of this model comprehensively reflect consumer shopping behavior and specific shopping times. New opinions have been proposed based on the methods for selecting variables, segmenting customers, and realizing variable quantity dimension reduction under the B2C e-commerce environment. Although a large number of shopping websites exist, not all variables have the same impact on customer churn. The previous researches [68] are a basis for this paper, helps us continue to expand the research scope and shows that shopping time (time period) is a key variable for prediction. Traditional R and F variables are not key for predictions. For customers who are most likely to choose other companies for consumption, the “Buy” and “PV” within the Night and PM periods are the most relevant variables for customer churn. Previous research on customer churn [69,70,71] has focused on the prediction performance of models. Although we have a limited understanding of the reasons for customer churn in the B2C e-commerce industry and enterprises, studying the impact of time variables (P, B, C and F) in this context helps prove the generalizability of the traditional RFM model. In addition, this paper, based on the research method segmentation before prediction, clarifies how to predict customer churn more accurately in the e-commerce industry, which is another achievement of this paper.
6.2. Implications for Practice
From a practical point of view, our research results are also significant. Developing a customer churn prediction model that meets the practical requirements of enterprises is obviously helpful for enterprise customer relationship management. Enterprises can have an insight into the causes of customer churn in accordance with the importance of consumption characteristics. Our research is helpful for B2C e-commerce marketing managers in optimizing enterprise marketing strategies and retaining customers through commodity promotion activities based on the results of the churn model (rather than the traditional churn prediction model) proposed in this paper. Traditional churn prediction models cannot fully achieve the business goal of maximizing customer retention, namely, how to minimize customer churn through the commodity recommendation system. Traditional churn prediction models focus more on the overall results, namely, whether customers will churn, but ignore the factors of customer retention in practical situations. For an enterprise, these may cause some problems in that online shopping customers usually have their own individual consumption habits and intentions. If the enterprise cannot adapt to customer consumption habits, a transfer of customers with consumption intention to other competitive companies will be caused. Traditional models often ignore the correlation between the number of churned customers and the retained ones to exclude some of them with shopping intention from retention activities. For example, some customers habitually, such as shopping at night, however, commodity promotion activities are not held at night. This problem can be solved by accurately identifying customer types and improving the customer churn model, i.e., the customer segmentation method and prediction model mentioned in this paper. Gattermann-Itschert et al. [78] studied the correlation between the number of churned customers and retention activities through a field experiment and proved the effectiveness of customer retention activities based on the churn prediction with practical evidence. The model proposed in this paper can help enterprises lock target customers easily. Enterprises can reduce not only customer churn but also marketing expenditures. The research results show that the combination of our customer segmentation and the prediction model is a feasible scheme for B2C e-commerce enterprises to deal with customer churn.
On the other hand, we support the analysis teams of enterprises adopting a prediction method that combines customer segmentation and churn prediction. Our research shows that the performances of these customer segmentation methods and prediction algorithms are similar to that of other methods, including the SVMauc prediction model [7], segmentation-based modeling approach [73], and multi-slicing technique [78]. The existing marketing literature detail that k-means customer segmentation is a valuable tool in all cases because there will always be some customer groups with different shopping behaviors. For example, the literature [79] shows that the customer churn rate of the time-based customer segmentation method is quite different from that of enterprise profitability (e.g., Money). Our research supports “segmentation first” as the first step in predictions, which is of practical guiding significance for enterprise customer retention. B2C e-commerce companies should understand that it is not impossible to fully utilize machine learning tools (technologies) in the customer recommendation system. Marketing managers need to constantly learn the application methods for various machine learning tools (technologies). The method mentioned in this paper is reliable and operable and allows an enterprise to judge which customers are liable to leave in time. Our research shows that marketing managers can easily optimize their customer retention strategies and product promotion activities by seeking target customer groups. Considering the operation efficiency of the model and the ability inherent in enterprise technical teams, the fruits of our method are consistent with previous literature [80,81]. The technical teams and managers at companies should not only consider prediction technologies, but also the ability and knowledge of the personnel or managers using machine learning technologies. In short, for enterprises, cooperation between people and technologies is always necessary for data processing and customer segmentation or model optimization and performance evaluation.
7. Conclusions
Customer churn predictions are very important in e-commerce. To maintain market competitiveness, B2C enterprises should make full use of machine learning in customer relationship management to predict the potential loss of customers and devise new marketing strategies and customer retention measures according to the prediction results. This will help establish efficient and accurate loss prediction for e-commerce enterprises.
This paper used customer behavior data of a B2C e-commerce enterprise to test the predictive ability of the SVM and LR models. To evaluate the prediction performance of the two models, the k-means algorithm was first used for clustering subdivision to classify into three types of customers, and then predictions were made for these three types of customers. Accuracy, recall, precision, and AUC were calculated. There were two motivations for our research. The first purpose was to study the effectiveness of customer segmentation and the prediction effect of the model before and after customer segmentation according to the longitudinal timeliness and multivariate variables of customer shopping behavior. The experimental results prove that the customer segmentation of each prediction index has a significant improvement. Therefore, k-means clustering segmentation is necessary. The second purpose was to compare the effects of the LR model’s prediction based on traditional statistics and the SVM’s prediction based on machine learning. The results prove that the accuracy of the SVM model prediction was higher than that of the LR model prediction. These research results have significance for customer relationship management of B2C e-commerce enterprises.
The results of this study also have some limitations. We used a real data set containing 987,994 customers under the B2C environment, namely, the selection of data is limited to a certain extent. Ideally, the research results should be verified by several data sets. The results of customer segmentation greatly impact the prediction performance of the model. In terms of the method, this paper only uses the k-means algorithm to segment and divide customer types, which may have limitations, because if two or more segmentation methods are compared, more convincing results may be obtained. In addition, we only use a small number of predictive variables, which makes the promotion of our results limited, because a lot of shopping information is presented on B2C websites, and some of it may be ignored.
Future research can be conducted from several aspects. First, we can collect and compare the customer behavioral data from several companies to further enhance the generalizability of our model. Second, considering customer retention is a durative task of the enterprises, it is necessary to continuously predict and evaluate the churn. It is crucial to carry out a segmentation considering the customer value and build a prediction model with value variables, in that all prediction modeling works and customer retention activities of enterprises aim at profit first.
Author Contributions
Conceptualization, X.X. and Y.H.; methodology, X.X. and Y.H.; software, X.X.; validation, X.X. and Y.H.; formal analysis, X.X. and Y.H.; investigation, X.X. and Y.H.; resources, X.X.; data curation, X.X.; writing—original draft preparation, X.X. and Y.H.; writing—review and editing, X.X. and Y.H.; visualization, X.X. All authors have read and agreed to the published version of the manuscript.
Funding
This research received no external funding.
Institutional Review Board Statement
Not applicable.
Informed Consent Statement
Informed consent was obtained from all subjects involved in the study.
Data Availability Statement
Not applicable.
Conflicts of Interest
The authors declare no conflict of interest.
References
- Bi, Q.Q. Cultivating loyal customers through online customer communities: A psychological contract perspective. J. Bus. Res. 2019, 103, 34–44. [Google Scholar] [CrossRef]
- Maria, O.; Bravo, C.; Verbeke, W.; Sarraute, C.; Baesens, B.; Vanthienen, J. Social network analytics for churn prediction in telco: Model building, evaluation and network architecture. Expert. Syst. Appl. 2017, 85, 204–220. [Google Scholar]
- Roberts, J.H. Developing new rules for new markets. J. Acad. Market. Sci. 2000, 8, 31–44. [Google Scholar] [CrossRef]
- Reichheld, F.F.; Sasser, W.E. Zero defeofions: Quoliiy comes to services. Harvard. Bus. Rev. 1990, 68, 105–111. [Google Scholar]
- Jones, T.O.; Sasser, W.E., Jr. Why satisfied customers defect. IEEE Eng. Manag. Rev. 1998, 26, 16–26. [Google Scholar] [CrossRef]
- Nie, G.; Rowe, W.; Zhang, L.; Tian, Y.; Shi, Y. Credit card chum forecasting by logistic regression and decision tree. Expert. Syst. Appl. 2011, 38, 15273–15285. [Google Scholar] [CrossRef]
- Gordini, N.; Veglio, V. Customers churn prediction and marketing retention strategies: An application of support vector machines based on the AUC parameter-selection technique in B2B e-commerce industry. Ind. Market. Manag. 2017, 62, 100–107. [Google Scholar] [CrossRef]
- Zorn, S.; Jarvis, W.; Bellman, S. Attitudinal perspectives for predicting churn. J. Res. Interact. Mark. 2010, 4, 157–169. [Google Scholar] [CrossRef]
- Datta, P.; Masand, B.; Mani, D.R.; Li, B. Automated cellular modeling and prediction on a large scale. Artif. Intell. Rev. 2000, 14, 485–502. [Google Scholar] [CrossRef]
- Jain, H.; Khunteta, A.; Srivastava, S. Churn prediction in telecommunication using logistic regression and logit boost. Procedia Comput. Sci. 2020, 167, 101–112. [Google Scholar] [CrossRef]
- Coussement, K.; Lessmann, S.; Verstraeten, G. A comparative analysis of data preparation algorithms for customer churn prediction: A case study in the telecommunication industry. Decis. Support Syst. 2017, 95, 27–36. [Google Scholar] [CrossRef]
- Masand, B.; Datta, P.; Mani, D.R.; Li, B. CHAMP: A prototype for automated cellular churn prediction. Data Min. Knowl. Disc. 1999, 3, 219–225. [Google Scholar] [CrossRef]
- Huang, Y.; Kechadi, T. An effective hybrid learning system for telecommunication churn prediction. Expert. Syst. Appl. 2013, 40, 5635–5647. [Google Scholar] [CrossRef]
- Larivière, B.; Van den Poel, D. Investigating the role of product features in preventing customer churn, by using survival analysis and choice modeling: The case of financial services. Expert. Syst. Appl. 2004, 27, 277–285. [Google Scholar] [CrossRef]
- Zięba, M.; Tomczak, S.K.; Tomczak, J.M. Ensemble boosted trees with synthetic features generation in application to bankruptcy prediction. Expert. Syst. Appl. 2016, 58, 93–101. [Google Scholar] [CrossRef]
- Kotler, P.; Keller, K. Marketing Management, 15th ed.; Pearson Education Ltd.: Edinburgh, UK, 2016; pp. 89–120. ISBN 10: 1-292-0926-29. [Google Scholar]
- Cao, L. In-depth behavior understanding and use: The behavior informatics approach. Inform. Sci. 2010, 180, 3067–3085. [Google Scholar] [CrossRef]
- Cao, L.; Yu, P.S. Behavior informatics: An informatics perspective for behavior studies. IEEE Intell. Inf. Bulletin. 2009, 10, 6–11. [Google Scholar]
- Orsenigo, C.; Vercellis, C. Combining discrete SVM and fixed cardinality warping distances for multivariate time series classification. Pattern Recogn. 2010, 43, 3787–3794. [Google Scholar] [CrossRef]
- Eichinger, F.; Nauck, D.D.; Klawonn, F. Sequence mining for customer behaviour predictions in telecommunications. In Proceedings of the Workshop on Practical Data Mining: Applications, Experiences and Challenges (ECML/PKDD), Berlin, Germany, 22 September 2006; pp. 3–10. [Google Scholar]
- Prinzie, A.; Van den Poel, D. Incorporating sequential information into traditional classification models by using an element/position-sensitive SAM. Decis. Support Syst. 2006, 42, 508–526. [Google Scholar] [CrossRef]
- Pınar, K.; Topcu, Y.I. Applying Bayesian Belief Network approach to customer chum analysis: A case study on the telecom industry of Turkey. Expert. Syst. Appl. 2011, 38, 7151–7157. [Google Scholar]
- Renjith, S. An integrated framework to recommend personalized retention actions to control B2C E-commerce customer churn. Intl. J. Eng. Trends Technol. 2015, 27, 152–157. [Google Scholar] [CrossRef]
- Caignya, A.D.; Coussementa, K.; Bockb, K.W.D. A new hybrid classification algorithm for customer churn prediction based on logistic regression and decision trees. Eur. J. Oper. Res. 2018, 269, 760–772. [Google Scholar] [CrossRef]
- Neslin, S.A.; Gupta, S.; Kamakura, W.; Lu, J.; Mason, C.H. Defection detection: Measuring and understanding the predictive accuracy of customer churn models. J. Mark. Res. 2006, 43, 204–211. [Google Scholar] [CrossRef]
- Zhang, Y. A Customer Churn Alarm Model based on the C5.0 Decision Tree-Taking the Postal Short Message as an Example. Stat. Inf. Forum. 2015, 30, 89–94. [Google Scholar]
- Farquad, M.A.H.; Ravi, V.; Raju, S.B. Churn prediction using comprehensible support vector machine: An analytical CRM application. Appl. Soft. Comput. 2014, 19, 31–40. [Google Scholar] [CrossRef]
- Tian, L.; Qiu, H.; Zheng, L. Telecom chum prediction modeling and application based on neural network. Comput. Appl. 2007, 27, 2294–2297. [Google Scholar]
- Yu, R.; An, X.; Jin, B.; Shi, J.; Move, O.A.; Liu, Y. Particle classification optimization-based BP network for telecommunication customer churn prediction. Neural Comput. Appl. 2018, 2, 707–720. [Google Scholar] [CrossRef]
- Wu, X.; Meng, S. E-commerce Customer Churn Prediction based on Customer Segmentation and AdaBoost. In Proceedings of the International Conference on Service Systems and Service Management (ICSSSM), Kunming, China, 24–26 June 2016. [Google Scholar]
- Ji, H.; Ni, F.; Liu, J. Prediction of telecom customer churn based on XGB-BFS feature selection algorithm. Comput. Technol. Dev. 2021, 31, 21–25. [Google Scholar]
- Ahmed, A.A.Q.; Maheswari, D. An enhanced ensemble classifier for telecom churn prediction using cost based uplift modeling. Intl. J. Inf. Technol. 2019, 11, 381–391. [Google Scholar]
- Ying, W.Y. Research on the LDA boosting in customer churn prediction. J. Appl. Stat. Manag. 2010, 29, 400–408. [Google Scholar]
- Zhang, W.; Yang, S.; Liu, T.T.; School, M. Customer churn prediction in mobile communication enterprises based on CART and Boosting algorithm. Chin. J. Manag. Sci. 2014, 22, 90–96. [Google Scholar]
- Wu, J.; Shi, L.; Lin, W.P.; Tsai, S.B.; Xu, G.S. An empirical study on customer segmentation by purchase behaviors using a RFM model and K-means algorithm. Math. Probl. Eng. 2020, 2020, 1–7. [Google Scholar] [CrossRef]
- Wu, J.; Shi, L.; Yang, L.P.; Niu, X.X.; Li, Y.Y.; Cui, X.D.; Tsai, S.B.; Zhang, Y.B. User Value Identification Based on Improved RFM Model and K-Means++ Algorithm for Complex Data Analysis. Wirel Commun. Mob.Com. 2021, 9982484, 1–8. [Google Scholar] [CrossRef]
- Li, Y.; Chu, X.Q.; Tian, D.; Feng, J.Y.; Mu, W.S. Customer segmentation using K-means clustering and the adaptive. Appl. Soft Comput. 2021, 113, 107924. [Google Scholar] [CrossRef]
- Christy, A.J.; Umamakeswari, A.; Priyatharsini, L.; Neyaa, A. RFM ranking-An effective approach to customer segmentation. J. King. Saud. Univ. Sci. 2021, 33, 1251–1257. [Google Scholar] [CrossRef]
- Abbasimehr, H.; Bahrini, A. An analytical framework based on the recency, frequency, and monetary model and time series clustering techniques for dynamic segmentation. Expert. Syst. Appl. 2021, 192, 116373. [Google Scholar] [CrossRef]
- Hosseini, M.; Shajari, S.; Akbarabadi, M. Identifying multi-channel value co-creator groups in the banking industry. J. Retail. Consum. Serv. 2022, 5, 102312. [Google Scholar] [CrossRef]
- Alboukaey, N.; Joukhadar, A.; Ghneim, N. Dynamic behavior based churn prediction in mobile telecom. Expert. Syst. Appl. 2020, 162, 113779. [Google Scholar] [CrossRef]
- Zhou, J.; Zhai, L.L.; Pantelous, A.A. Market Segmentation Using High-dimensional Sparse Consumers Data. Expert. Syst. Appl. 2020, 145, 113136. [Google Scholar] [CrossRef]
- Li, M.; Wang, Q.W.; Shen, Y.Z.; Zhu, T.Y. Customer relationship management analysis of outpatients in a Chinese infectious disease hospital using drug-proportion recency-frequency-monetary model. Int. J. Med. Inform. 2021, 147, 104373. [Google Scholar] [CrossRef]
- Vapnik, V.N. The Nature of Statistic Learning Theory, 2nd ed.; Springer: New York, NY, USA, 2000; pp. 138–141. ISBN 0387987800. [Google Scholar]
- Vapnik, V.N. Statistic Learning Theory; Wiley-Interscience: John & Wiley, Inc.: New York, NY, USA, 1998; pp. 375–383. ISBN 0417030031. [Google Scholar]
- Scholkopf, B.; Smolla, A. Learning with kernels-Support Vector Machines, Regularization, Optimization, and Beyond; The MIT Press: Cambridge, MA, USA; London, UK, 2002; pp. 189–222. ISBN 0262194759. [Google Scholar]
- Lee, S.; Lee, H.; Abbeel, P.; Andrew, Y.N. Efficient L1 regularized logistic regression. In Proceedings of the 21st National Conference on Artificial Intelligence (AAAI-06), Boston, MA, USA, 16 July 2006; Volume 1, pp. 401–408. [Google Scholar]
- Minka, T.P. Algorithms for Maximum-Likelihood Logistic Regression; Carnegie Mellon University Research Showcase: Technical Report (Mathematics); IEEE: Pittsburgh, PA, USA, 2003; pp. 1–15. [Google Scholar] [CrossRef]
- Alibaba Cloud Tianchi Data Sets. Available online: https://tianchi.aliyun.com/datase (accessed on 17 March 2021).
- Cao, L. Behavior Informatics and Analytics: Let Behavior Talk. In Proceedings of IEE International Conference on Data Mining Workshops (ICDM), Pisa, Italy, 15–19 December 2008; pp. 15–19. [Google Scholar]
- Stolfo, S.J.; Hershkop, S.; Hu, C.W.; Li, W.J.; Nimeskern, O.; Wang, K. Behavior-based modeling and its application to Email analysis. ACM T. Internet. Appl. 2006, 6, 187–221. [Google Scholar] [CrossRef] [Green Version]
- Pham, D.T.; Dimov, S.S.; Nguyen, C.D. Selection of K in K-means clustering. Mech. Eng. Sci. 2004, 219, 103–119. [Google Scholar] [CrossRef] [Green Version]
- Chen, N.; Chen, A.; Zhou, L. An Effective Clustering Algorithm in Large Transaction Databases. J. Sw. 2001, 12, 476–484. [Google Scholar]
- Verbeke, W.; Dejaeger, K.; Martens, D.; Hur, J.; Baesens, B. New insights into churn prediction in the telecommunication sector: A profit driven data mining approach. Eur. J. Oper. Res. 2012, 218, 211–229. [Google Scholar] [CrossRef]
- Breiman, L. Random forests. Mach. Learn. 2001, 45, 5–32. [Google Scholar] [CrossRef] [Green Version]
- Breiman, L. Bagging predictors. Mach. Learn. 1996, 24, 123–140. [Google Scholar] [CrossRef] [Green Version]
- Goldstein, B.A.; Polley, E.C.; Briggs, F.B.S. Random Forests for Genetic Association Studies. Stat. Appl. Genet. Mol. 2011, 10, 32. [Google Scholar] [CrossRef]
- Drummond, C.; Holte, R.C. C4. 5, class imbalance, and cost sensitivity: Why under-sampling beats over-sampling. In Proceedings of Workshop on Learning from Imbalanced Datasets II, ICML, Washington, DC, USA, 21 August 2003. [Google Scholar]
- Chawla, N.V.; Bowyer, K.W.; Hall, L.Q.; Kegelmeyer, W.P. SMOTE: Synthetic minority over-sampling technique. J. Artif. Intell. Res. 2002, 16, 321–357. [Google Scholar] [CrossRef]
- Provost, F. Analysis and visualization of classifier performance: Comparison under imprecise class and cost distributions. In Proceedings of the International Conference on knowledge Discovery and Data Mining (KDD), San Diego, CA, USA, 15–18 August 1999; pp. 43–48. [Google Scholar]
- Fan, X.; Ke, T. Enhanced maximum AUC linear classifier. In Proceedings of the International Conference on Fuzzy Systems and Knowledge Discovery (FSKD), Yantai, China, 10–12 August 2010; pp. 1540–1544. [Google Scholar]
- Brito, P.Q.; Carlos, S.; Sérgio, A.; Mote, A.; Byvoet, M. Customer segmentation in a large database of an online customized fashion business. Robot. Cim-int. Manuf. 2015, 36, 93–100. [Google Scholar] [CrossRef]
- Sturm, A.; Bob, L. Classification accuracy is not enough. J. Intell. Inf. Syst. 2013, 41, 371–406. [Google Scholar] [CrossRef] [Green Version]
- Ma, S.; Huang, J. Regularized ROC Method for Disease Classification and Biomarker Selection with Microarray Data. Bioinformatics 2005, 21, 4356–4362. [Google Scholar] [CrossRef] [PubMed]
- Song, X.; Ma, S. Penalized Variable Selection with U-Estimates. J. Nonparametr. Stat. 2010, 22, 499–515. [Google Scholar] [CrossRef] [PubMed]
- Chang, H.H.; Tsay, S.F. Integrating of SOM and K-mean in data mining clustering: An empirical study of CRM and profitability evaluation. J. Inform. Manag. 2004, 11, 161–203. [Google Scholar]
- Rachid, A.D.; Abdellah, A.; Belaid, B.; Rachid, L. Clustering Prediction Techniques in Defining and Predicting Customers Defection: The Case of E-Commerce Context. Int. J. Elect. Comput. Eng. 2018, 8, 2367–2383. [Google Scholar] [CrossRef]
- Chen, K.; Hu, Y.H.; Hsieh, Y.C. Predicting customer churn from valuable B2B customers in the logistics industry: A case study. Inf. Syst. E-Bus. Manage. 2015, 13, 475–494. [Google Scholar] [CrossRef]
- Buckinx, W.; Van den Poel, D. Customer base analysis: Partial defection of behaviourally loyal clients in a non-contractual FMCG retail setting. Eur. J. Oper. Res. 2005, 164, 252–268. [Google Scholar] [CrossRef]
- Migueis, V.L.; Van den Poel, D.; Camanho, A.S.; Cunha, J.F. Modeling partial customer churn: On the value of first product-category purchase sequences. Expert. Syst. Appl. 2012, 39, 11250–11256. [Google Scholar] [CrossRef]
- Miguéis, V.L.; Camanho, A.; Cunha, J.F. Customer attrition in retailing: An application of Multivariate Adaptive Regression Splines. Expert. Syst. Appl. 2013, 40, 6225–6232. [Google Scholar] [CrossRef]
- Ascarza, E. Retention Futility: Targeting High Risk Customers Might Be Ineffective. J. Mark. Res. 2018, 55, 80–98. [Google Scholar] [CrossRef] [Green Version]
- Caigny, D.A.; Coussement, K.; Verbeke, W.; Idbenjra, K.; Phan, M. Uplift modeling and its implications for B2B customer churn prediction: A segmentation-based modeling approach. Ind. Market. Manag. 2021, 99, 28–39. [Google Scholar] [CrossRef]
- Kim, S.; Shin, K.; Park, K. An application of support vector machines for customer churn analysis: Credit card case. In Proceedings of the First international conference on Advances in Natural Computation (ICNC), Changsha, China, 27–29 August 2005; pp. 636–647. [Google Scholar]
- Coussement, K.; Van den Poel, D. Churn prediction in subscription services: An application of support vector machines while comparing two parameter-selection techniques. Expert. Syst. Appl. 2008, 34, 313–327. [Google Scholar] [CrossRef]
- Kim, H.S.; Sohn, S.Y. Support vector machines for default prediction of SMEs based on technology credit. Eur. J. Oper. Res. 2010, 201, 838–846. [Google Scholar] [CrossRef]
- Schaeffer, S.E.; Sanchez, S.V.R. Forecasting client retention-A machine-learning approach. J. Retail. Consum. Serv. 2020, 52, 101918. [Google Scholar] [CrossRef]
- Gattermann-Itschert, T.; Thonemann, U.W. How training on multiple time slices improves performance in churn prediction. Eur. J. Oper. Res. 2021, 295, 664–674. [Google Scholar] [CrossRef]
- Sood, A.; Kumar, V. Analyzing client profitability across diffusion segments for a continuous innovation. J. Mark. Res. 2017, 54, 932–951. [Google Scholar] [CrossRef]
- Duan, Y.; Edwards, J.S.; Dwivedi, Y.K. Artificial intelligence for decision making in the era of big data-Evolution, challenges and research agenda. Int. J. Inform. Manag. 2019, 48, 63–71. [Google Scholar] [CrossRef]
- Dwivedi, Y.K.; Hughes, L.; Ismagilova, E.; Aarts, G.; Coombs, C.; Crick, T.; Duan, Y.; Dwived, R.; Edwards, J.; Eirug, A.; et al. Artificial intelligence (AI): Multidisciplinary perspectives on emerging challenges, opportunities, and agenda for research, practice and policy. Int. J. Inform. Manag. 2021, 57, 101994. [Google Scholar] [CrossRef]
Publisher’s Note: MDPI stays neutral with regard to jurisdictional claims in published maps and institutional affiliations. |
© 2022 by the authors. Licensee MDPI, Basel, Switzerland. This article is an open access article distributed under the terms and conditions of the Creative Commons Attribution (CC BY) license (https://creativecommons.org/licenses/by/4.0/).