1. Introduction
An online marketplace is a platform where multiple third-party companies provide services or commodities. The platform is essentially responsible for delivering the services that facilitate transactions between its users, namely, the buyers and sellers. These popular online platforms, such as Amazon or eBay, offer buyers the opportunity to make purchases on the same platform without leaving the site or application. These marketplaces gather and store several types of data about their users, one of which is the transaction data used to analyze the customer purchase behavior helping to improve marketing activities.
Market basket analysis (MBA) is a frequently used data mining method for such purposes. It discovers the relationship between two products that are frequently purchased together using a technique called association rules [
1,
2]. Although there have been significant contributions from an MBA point of view, there is a limitation on the method’s effectiveness [
3] because of its focus on only the binary relationship between two products. Researchers frequently apply the network science approach to established research fields to overcome its limitations [
4]. To address MBA’s binary relationship issue, researchers presented a network analysis [
5,
6,
7] approach that helps to analyze not just the relationship between two products but also a whole network of relationships among all products in the system.
In this research, we empirically study the transaction data of an online marketplace platform. We build a co-purchase network by connecting products if they are purchased by the same customer. We then analyze the network by discovering the product communities based on the customers’ co-purchase patterns. Certain products play a key role in the network by connecting otherwise isolated communities. Some products play a different role in the system by connecting highly connected products. We calculate two key centrality measures to discover such important products: eigenvector and betweenness centralities. Additionally, we include the total spending data to distinguish products monetarily. Despite various studies to discover the purchase patterns with a network approach, one of the concerns includes issues with community detection methods such as taking a heuristic path or a tendency to overfit the data. In this research, we employ the stochastic block modeling (SBM) method from the repertoire of community detection algorithms, a principled statistical inference method that groups the products based solely on their connections to discover latent product communities in the network.
This paper aims to segment the products by detecting the similarities in customers’ co-purchase patterns by extending the MBA. The main focus of this study is to determine the roles of the products in the network and utilize the findings for improving marketing activities such as product placement, cross-selling, or customer retention. Despite its many alternatives, SBM is a statistically principled method, making its results domain independent and less error prone. Thus, it is a scientific technology suitable for decision support systems for any kind of electronic commerce.
The rest of the paper is organized as follows.
Section 2 describes the related works and literature review, and
Section 3 discusses the theoretical background. The proposed method framework is presented in
Section 4. Furthermore, results are presented in
Section 5, and finally, the paper closes with a discussion and conclusion in
Section 6.
2. Related Works
Market basket analysis (MBA) is considered the most common way to understand co-purchase behavior both in the industry and in academia [
8,
9]. Agrawal et al. [
1] describe MBA as follows: for products X and Y, if the same customer purchased Y while buying X, there is an “association rule” between X and Y, indicating a potential purchase pattern. Liao et al. [
10] incorporate k-means clustering algorithm into the MBA to perform product segmentation. Their work presents managerial implications such as finding candidates for product bundling and new products to enter the market. In a recent study, Puka and Jedrusik [
11] similarly use MBA and extend the association rules by combining it with the complementarity concept called basket complementarity. However, the methods based on association rules focus on only the relationship between two products. Ding et al. [
7] point out the lack of network understanding “However, researchers have noticed that there are still many deficiencies in the market basket analysis, which deteriorates its effectiveness as a market analysis approach. One outstanding issue with market basket analysis stems from its focus solely on the ‘association rules’ between two products; in the real business context, however, there may be links between any products which form a group. Retailers are no longer satisfied by the analysis of binary relationships among products. They seek a whole picture of inter-product relationships, as traditional market basket analysis “is often difficult to isolate interesting relationships” [
12]. Ding et al. [
7] argue that “products that are not often purchased together may be used in similar scenarios, which are often overlooked or an implicit factor in the market basket analysis”.
Many researchers applied the network analysis idea to go beyond this binary approach and understand the entire set of relationships in the system.
Table 1 illustrates a comparison between nine representative studies that employ a community detection method on co-purchase data. In e-commerce literature, network understanding is generally introduced as an extension of MBA. To achieve that, researchers add basic network measures such as centrality to the traditional MBA [
6]. Many researchers go further and add community detection to the research [
12], which is an effort to split the network into groups based on the density of their connections. In addition, it is an established notion in network science that there is no single detection method that fits all situations summarized as “No Free Lunch Theory” [
13,
14], meaning that one should utilize the most appropriate detection method for the existing system. Modularity maximization is a heuristic method commonly used to detect communities in academia that tends to overfit the data and [
15] has a resolution limit that prevents it from detecting small communities in large networks [
16]. Nevertheless, it is the most common method that researchers employ.
Co-purchase networks generally have been studied to extend the standard MBA or to enhance recommendation systems. A considerable amount of literature has been published utilizing community detection methods to identify similar groups in the network [
6,
17,
18,
19]. However, much of the research has either applied problematic detection methods such as modularity maximization [
20] or focused on basic centrality measures or clustering behaviors to analyze the network [
6,
19,
21]. The study of Raeder and Chawla [
12] is one of the early examples of using network approach to extend MBA. They detect communities using modularity maximization and propose a measure named utility of community which is a value derived from the number of edges to determine the role of the products in the network. However, to reduce the data set, they utilize a questionable method by “pruning” the network, which compromises the integrity of the network structure. Kim et al. [
6] take a similar dataset of transaction data from a department store and model two different co-purchase networks. One connects two products if they appeared in the same ticket, and the other connects two products regardless of the time of purchase. They run the k-nearest neighbors algorithm to discover the communities and use degree centrality to detect the importance of the products. Our method involves eigenvector centrality an advanced version of degree centrality that not only reflects the number of connections of a product but also the number of connections of its neighbors. Videla-Cavieres and Rios [
5] aim to extend MBA by utilizing network analysis techniques proposing a method to analyze large networks containing more than a hundred thousand nodes. As in [
12] their method involves filtering edges to reduce the network to manageable sizes; however, removing edges of a network might compromise the underlying network structure. The present study covers the entire transaction data. Moreover, contrary to many studies [
5,
6] our method includes the co-purchases even if they take place only once.
Unlike the methods used in these studies, the SBM community detection method offers a probabilistic model, a principled statistical inference method [
22] that discovers communities based on connection patterns of the nodes. We present its theoretical background in the next section. In the co-purchase network context, connections represent customers’ purchases; therefore, the SBM method groups the products based on their buyers’ purchase patterns. The methods used in previous studies, such as modularity maximization and K-core decomposition lack such properties.
Only Ding et al. [
7] employ SBM among the studies seen in
Table 1. Additionally, they take a more holistic approach that analyzes the network both at a macro level (hierarchies of the products) and micro-level (brokerage role of the products.) Utilizing the recent advancements in the field, researchers use three different community detection methods, one of which is Hierarchical Stochastic Block Modelling [
23]. This holistic approach extends the binary perspective of the existing MBA, which focuses on the relationship of only two products to the whole network structure. Not all studies on co-purchase networks focus on MBA. For example, Gabardo et al. [
24] and Chattopadhyay et al. [
25] contribute to the co-purchase network research to improve product recommendation by bringing novel community detection methods based on overlapping communities and node similarity concepts, respectively. This research utilizes degree-corrected, hierarchical, weighted SBM which is a statistically principled method to discover product communities and ranks the products based on their monetary, betweenness and eigenvector attribute afterwards.
There are various methods to achieve product segmentation. Artificial neural networks are a recent example. Wang et al. [
26] use self-organizing map, an artificial neural network method to segment the products. Additionally, they incorporate recency, frequency, and monetary analysis into their research. Apart from co-purchase analysis, product segmentation can be performed based on demographic data. For instance, Lees et al. [
27] present demographic product segmentation in financial services using attributes such as gender, age, and socio-economic status. However, by discovering the product groups based only on customer purchase behavior, the present study performs a behavioral product segmentation.
4. Materials and Methods
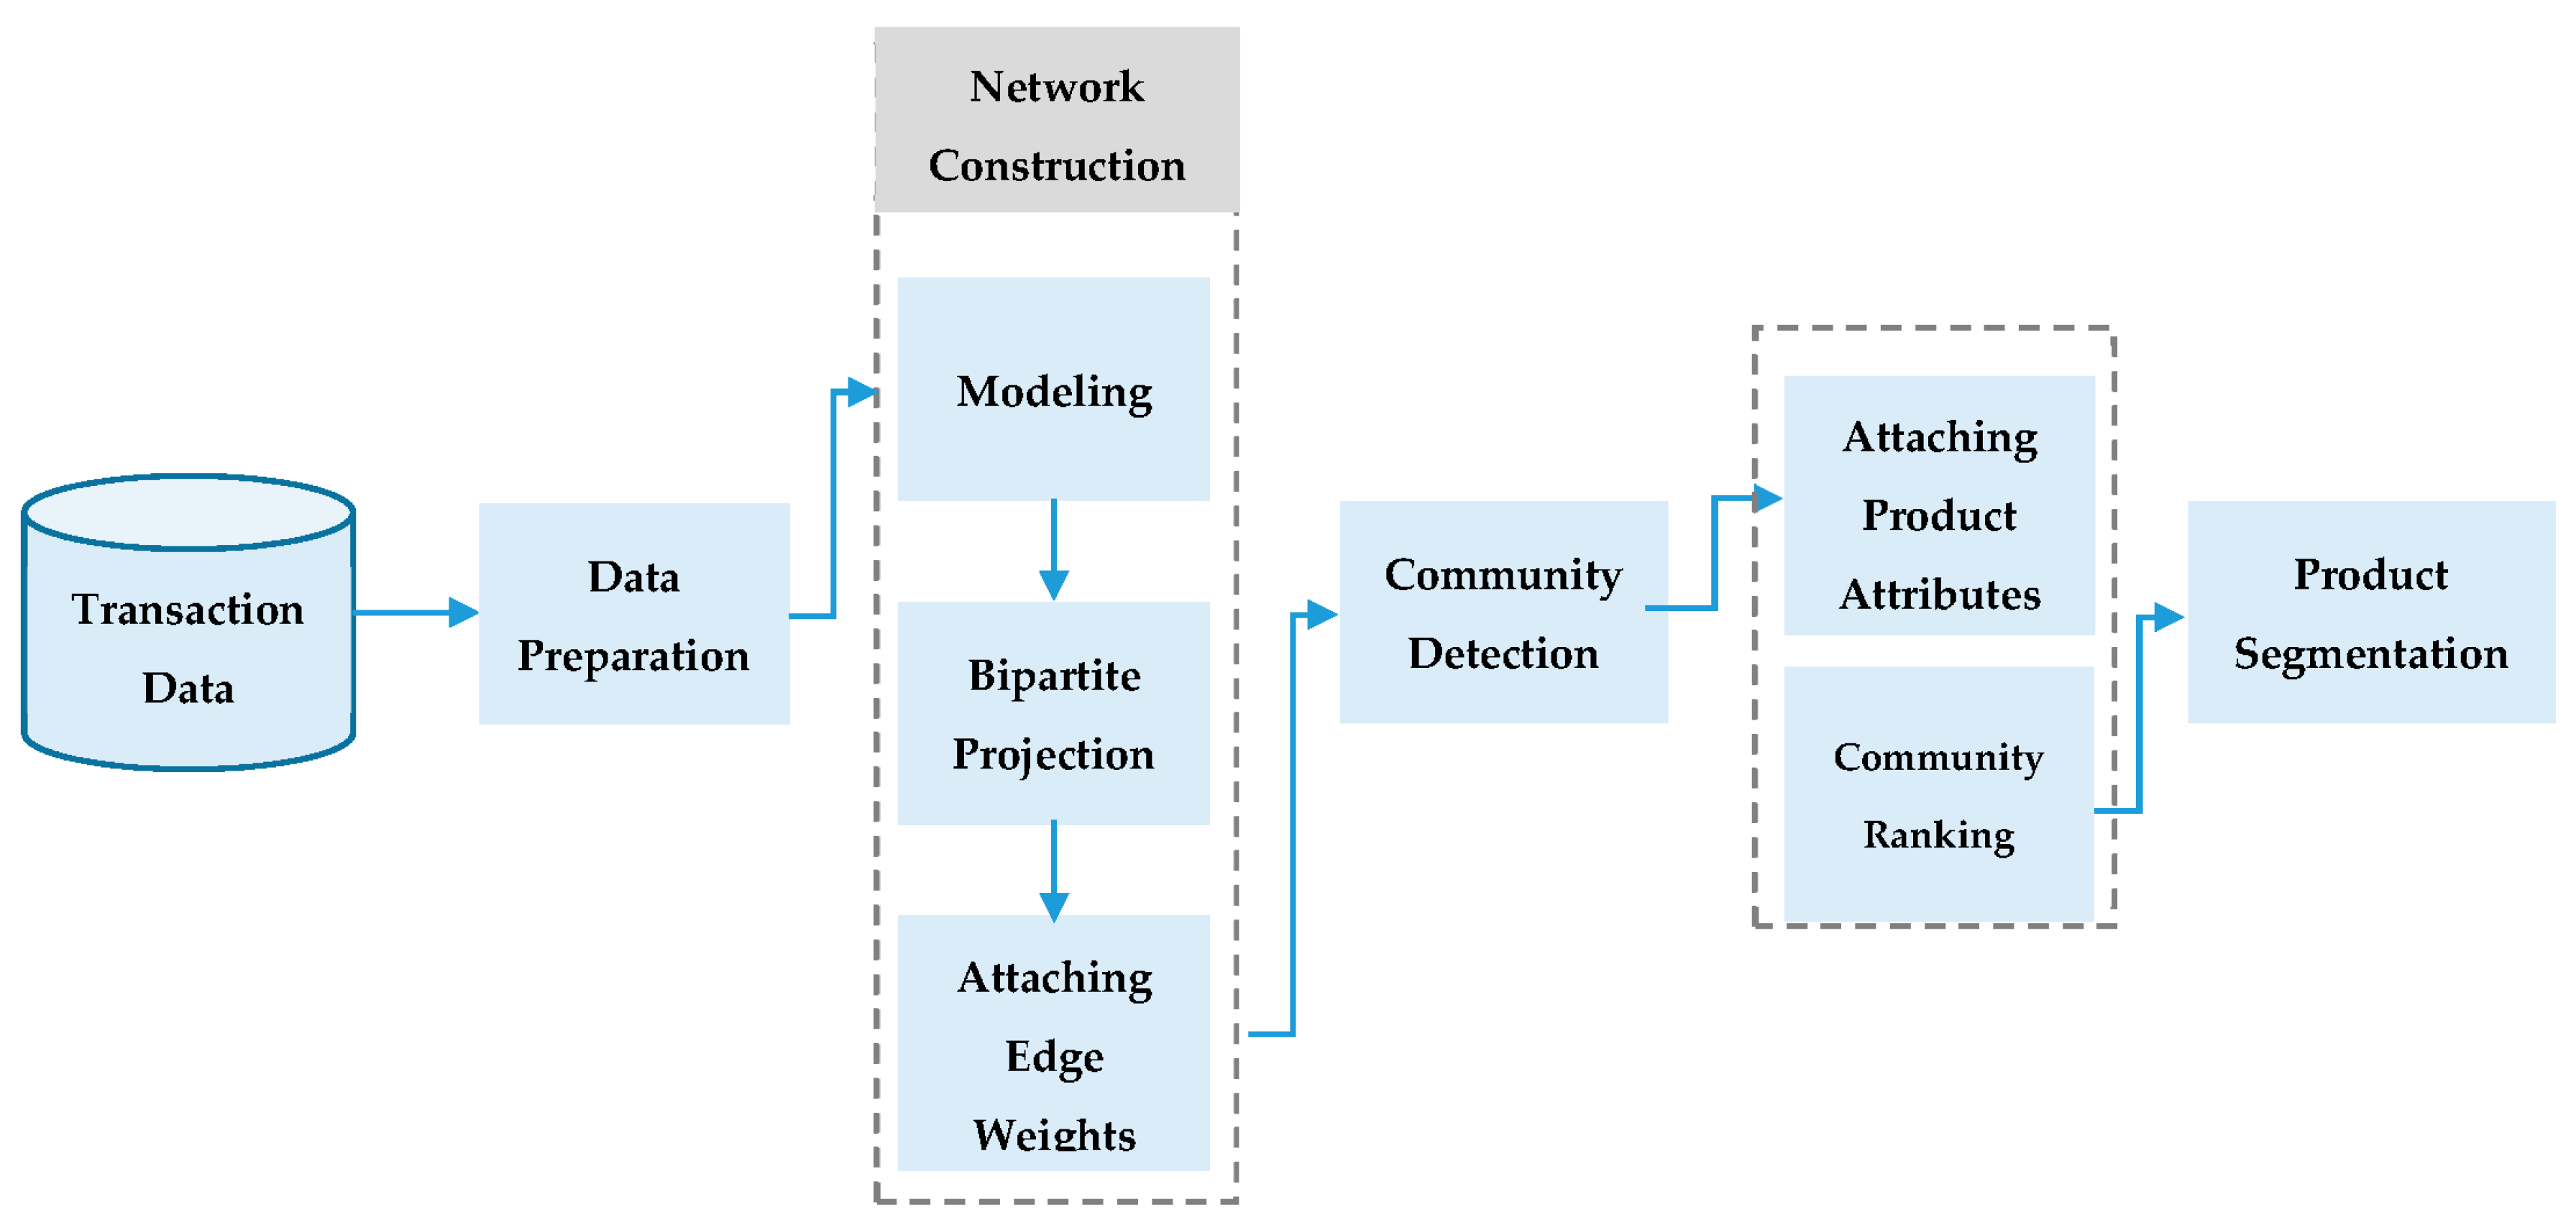
The proposed framework for product segmentation is presented in
Figure 2. It consists of three main steps: data preparation, network construction and community detection.
4.1. Constructing the Network
4.1.1. Data Preparation
The raw data set contains nearly 1.5-million transactions obtained from one of the leading online marketplace platforms in Turkey where sellers offer a wide range of products. The transactions took place between 620,767 buyers and 7516 sellers involving 412,419 products. Time span of the transactions is three consecutive months. The data contains details of the transactions such as price amount, date and category information along with buyer attributes such as age and gender. However, we did not incorporate the demographic information in the present study. Among transactions, a small number of shipping fees shown as products had to be removed. In this study, we worked on a portion of the transactions spanning a two-week time frame in May 2015, which contains 228,026 transactions that took place between 139,885 unique buyers and 107,689 unique products.
4.1.2. Modeling
The first step is building a network from the data set. There are many ways to construct a network and it starts with deciding which entities in the data set will become the nodes and what will constitute the relationship between those entities (edges). Making this decision is called modeling the network. As online marketplace platforms facilitate transaction between buyers and sellers, the accumulated transaction data contains such entities as buyers, sellers and products which are all suitable candidates for being nodes in a network.
The edges in the network represent the relationship between chosen nodes which can be a purchase between a seller and a buyer or a message from a buyer to a seller. One of the frequently studied models is co-purchase networks which will be our focus in this research. Co-purchase here, implies that two products are purchased by the same buyer. Therefore, in a co-purchase network two products are connected to each other only if both are purchased by the same buyer or buyers. In online markets this type of relationship is typically referred to as “the customer who bought this item also bought this item” in product recommendation.
4.1.3. From Bipartite to Projection
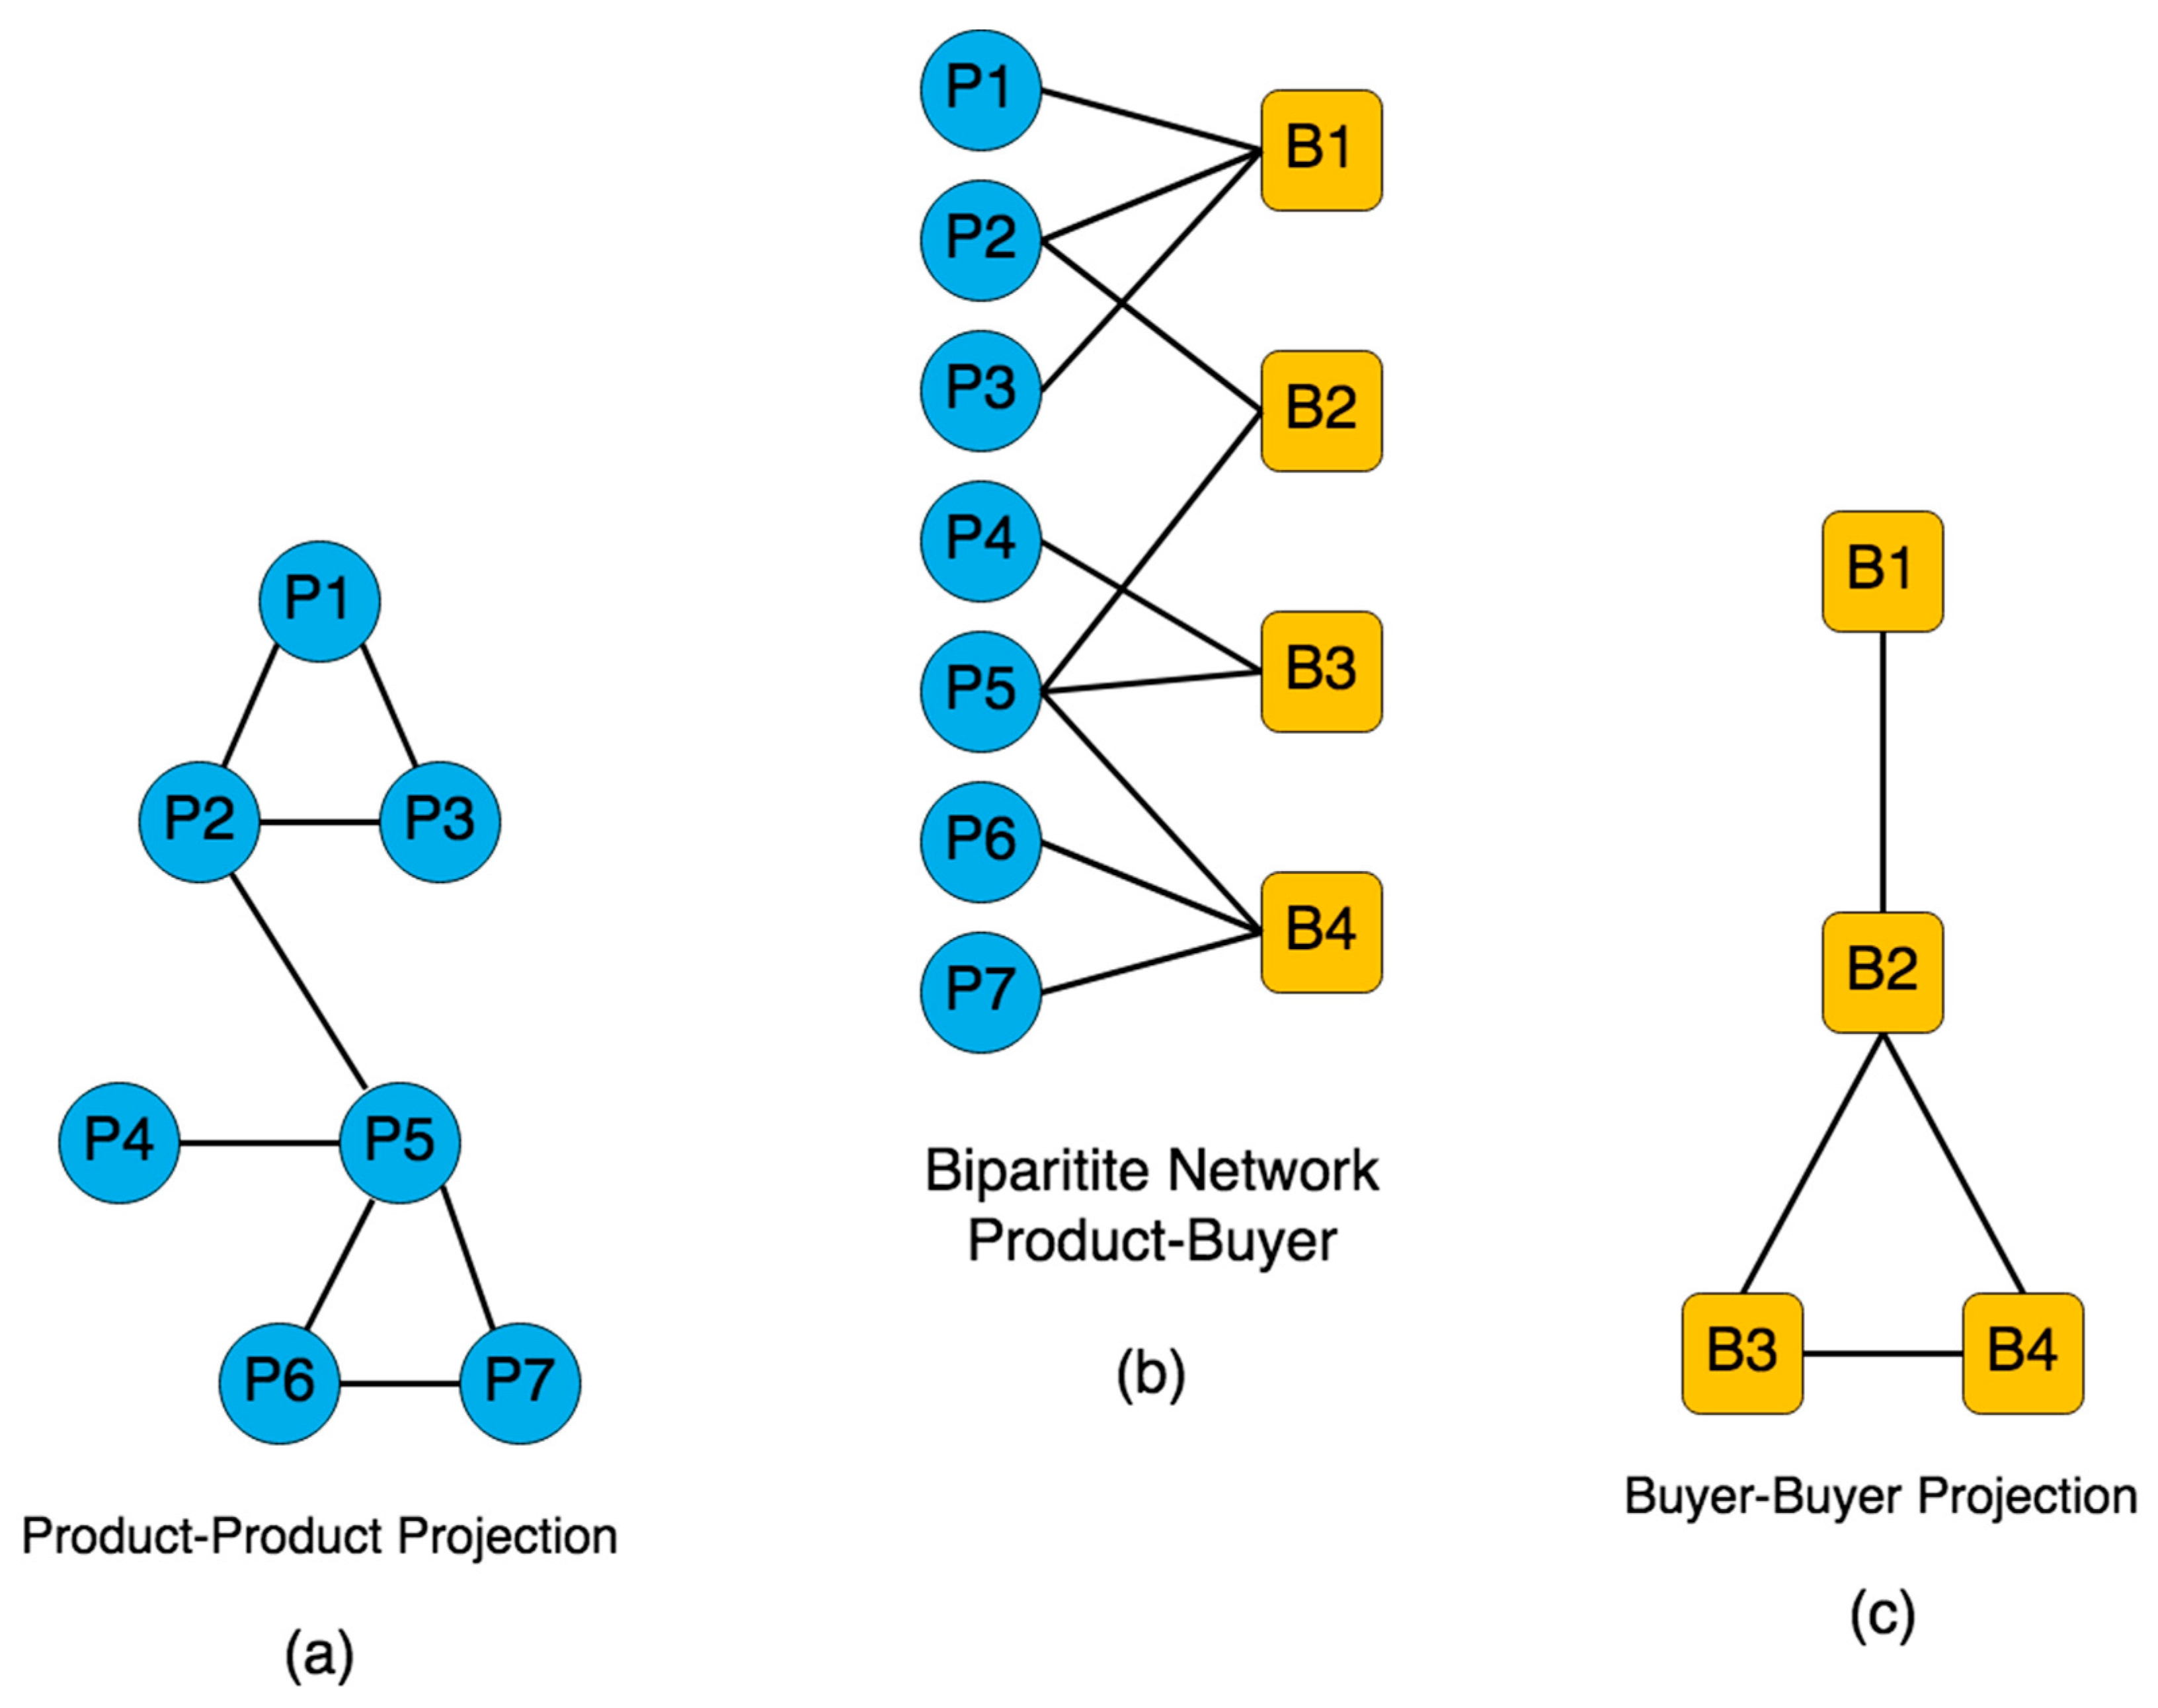
To link two co-purchased products, we should first create a bipartite network where there are two distinct types of nodes: buyers, and products. We draw an edge between a buyer and a product in this model if the buyer has purchased the product. In bipartite networks two types of nodes never link among themselves, they only connect with the opposing type.
Figure 3b shows a simple model of a product-buyer bipartite network along with two projections at both sides.
To generate a co-purchase network, we split the bipartite network into two undirected subnetworks called projections. One of the projections will be buyer to buyer network, where an edge between two buyers indicates two buyers who bought the same product (
Figure 3c). The other one will be the product-to-product projection, where an edge between two products means two products are bought by the same buyer or buyers. We discard the former one and work on the latter, the co-purchase network (
Figure 3a). Following a similar approach, one can choose other options such as product-seller bipartite network which can be split in two projections: product-product and a seller-seller networks. However, we will keep the scope of this research limited to previous co-purchase network illustrated in
Figure 3a.
4.1.4. Attaching Edge Weights
The product-product (co-purchase) network is undirected meaning the edges have no direction from one product to another and it is modeled in such a way that two products are connected only if they are purchased by the same buyer. However, several other buyers may also have bought the same two products together and such buyers most probably have varying attributes in terms of their platform value. Additionally, buyers are not the only actors in a marketplace platform, sellers also are an important part of the transaction. They have their own attributes that can contribute to the analysis of the complex system as well. We can assign such attributes to the network as node and edge attributes. Node attributes are attached to the products, and they indicate the value of the products e.g., price, category, number of transactions, etc. As for the buyers and sellers, the information indicating their value is attached to the connections between products. They are called the edge attributes (weights) which will play an important role in our analysis.
Figure 4 is a simple model showing how the attributes are attached to the network on both nodes and edges. A list of possible information that can be used as node or edge attributes extracted from the transaction data is shown in
Table 2. However, in this study we utilize only the monetary aspect which is the total amount of money spent for the co-purchase pairs (total spending), by aggregating total paid amounts of products at both ends of an edge. For instance, assuming two products P1 and P2 in
Figure 4 are co-purchased by several buyers, we sum up the total paid amounts for both products and attach this value as an edge weight in the co-purchase network. Instead of total spending, a different study can be carried out using frequency of the purchases as the edge weights that can reflect differently on the research findings.
Following the network construction, we focus on discovering the product communities where the products are grouped together, signaling a similarity. In
Figure 3a we can spot two communities at first glance (P1, P2, P3) and (P4, P5, P6, P7). Surely, we did not use an algorithm to detect those groups, we only performed a visual inspection. There are several community detection methods that can find the clustering of the nodes for us algorithmically. We will use a community detection algorithm chosen from a vast number of algorithms available where many of them detect different aspects of the network community structure depending on their ‘community’ definition.
4.2. Community Detection for Product Segmentation
For finding a good estimate for community detection a greedy algorithm based on merge-split Markov chain Monte Carlo (MCMC) is performed [
34]. We performed several runs with varying numbers of Monte Carlo sweeps and iterations on one-, two- and four-week co-purchase networks. We then plotted the entropy for each iteration to track the minimization process to find the optimum iteration number and decided to run the algorithm with 10 sweeps for 200 iterations.
4.3. Attaching Product Attributes
Up to now, the nodes have no attributes other than their product ids. We calculate betweenness and eigenvector centrality scores of each product in the network. Additionally, monetary attribute of each product is attached to the network. Naturally, the attributes exhibit varying ranges of values for instance, betweenness score always ranges between 0 and 1, whereas monetary attribute may range from 0.5 to thousands of TRY. To be able to compare their values we calculate the rank of each value using fractional ranking method. Furthermore, we normalize their ranks as percentage values. For instance, a product with 92% betweenness score means that if all the betweenness attributes are ordered from 0 to 100 this product takes the highest 92nd place.
4.4. Ranking the Communities
After calculating the attributes of all products, we aim to find how those attributes are distributed in each community and use this composition to label them. For instance, to label a community of hundred products, one should determine the prominent characteristic in the community. If the community’s mean betweenness attribute is significantly higher than other communities, we label this community as a high-betweenness community. If, however, the standard deviation of the attribute is not small then, one should not use this attribute to label the community. After labeling communities, we calculate the size of each community as an additional comparison parameter.
Using simple labels such as low, medium, and high instead of specifying the labels as percentages seems more suitable for comparison purposes. Moreover, the task of converting percentage values to three labels is not trivial, as the attributes may not be uniformly distributed over the communities to label mean percentages lower than 33% as low. To determine the transition thresholds of these levels, we plot the distribution of each attribute over the communities and look for appropriate percentage cutoff points. Due to the highly skewed distribution of community sizes, we split the sizes into three levels: small, medium, and large.
5. Results
The SBM algorithm discovered 309 product communities, and computation time took one hour 32 min to complete with 10 MCMC sweeps per iteration and 200 forced iterations in total. Attribute calculations took 32 min and calculating the buyer scores took an hour and 52 min using an Intel i5 CPU notebook with 12 GB of RAM.
Figure 5 shows the distribution of attribute percentages that helps us determine the cutoff thresholds, which we then use to label the community attributes as small, medium, or high as shown in
Table 3.
Examining the betweenness attribute in
Figure 5a, we observe that none of the communities have a mean percentage lower than 35%, and many communities lie between 35–55%. The rest are very low values, and they are almost equally distributed. The eigenvector centrality is close to a normal distribution (
Figure 5b). As for the monetary attribute (
Figure 5c), the range between 30% and 50% has the largest number of communities.
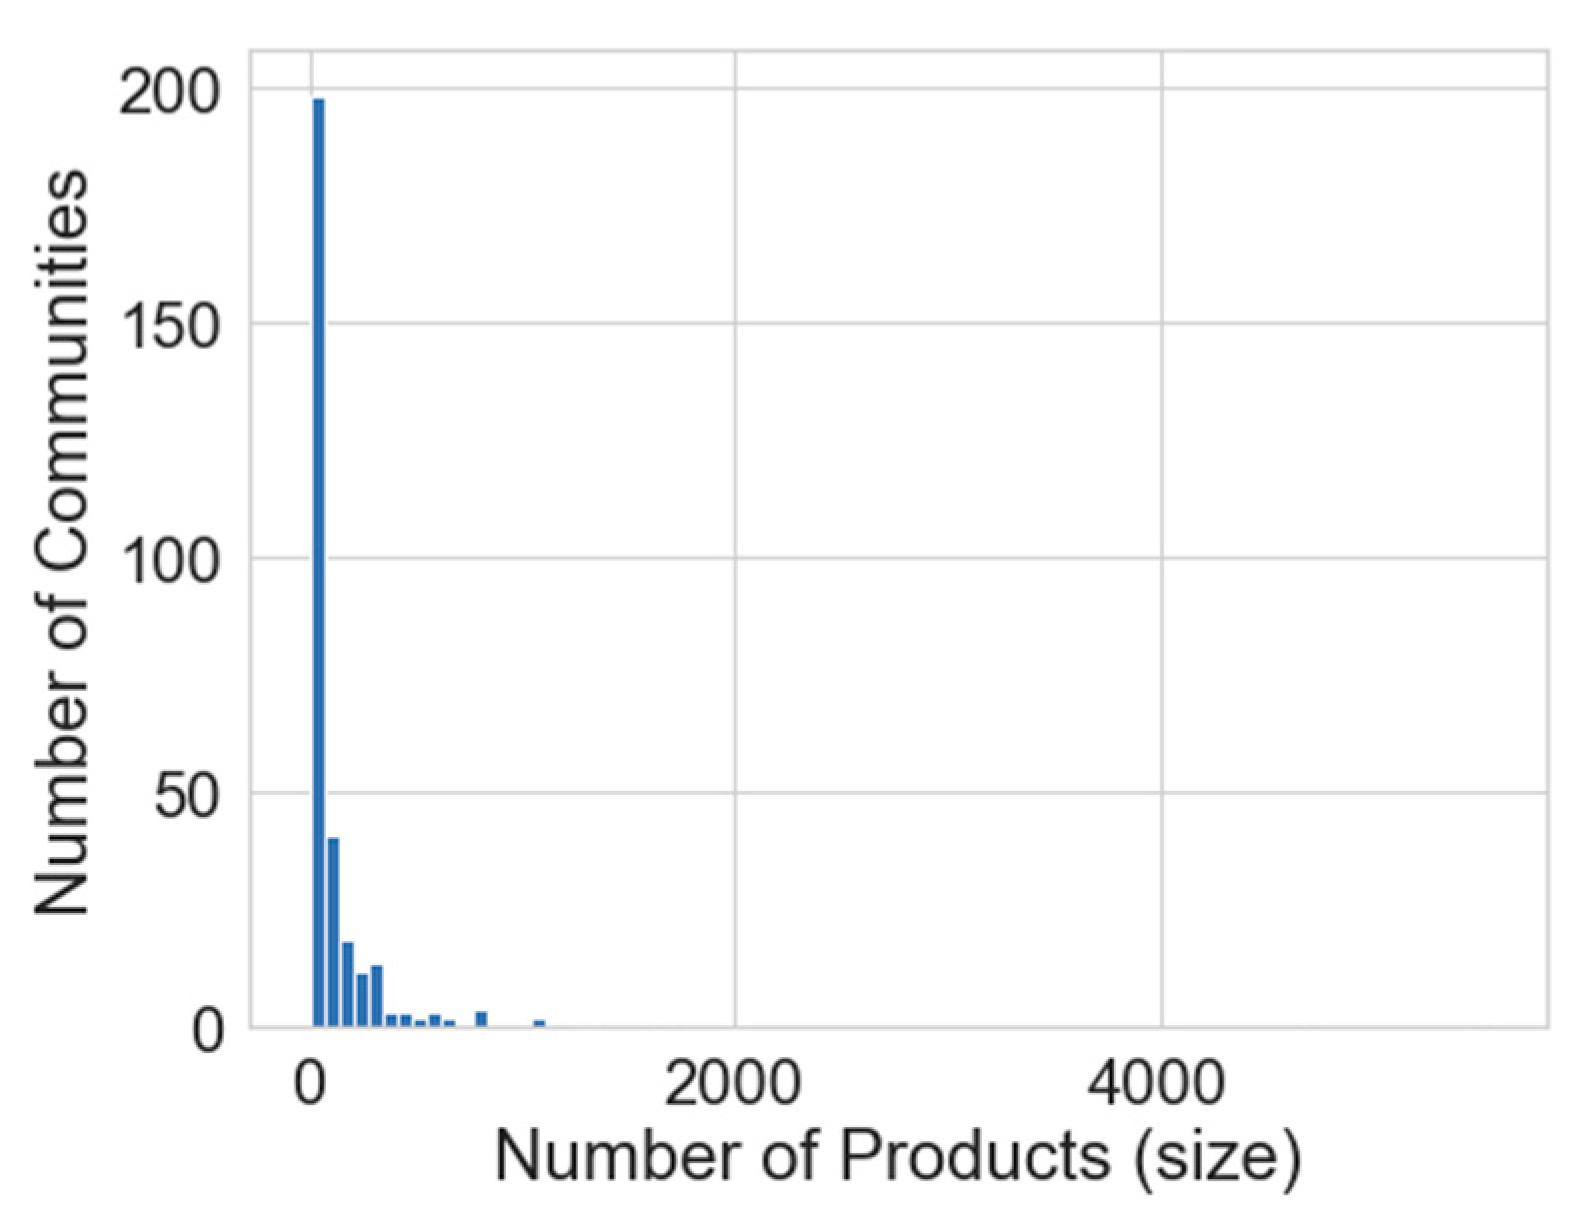
There is a community with 5543 products, another with 4683, and the following largest six communities contain between 1000 and 2000 products. We use the community size histogram to determine the cutoff thresholds for level labels; small, medium, large (
Figure 6).
Table 3 is a list of the cutoff points determined by examining their distributions.
Table 4 shows the breakdown of the number of community attributes which is determined by the thresholds given in
Table 3. Seventeen communities have high-level betweenness attributes. In other words, the average betweenness centrality of those products is more than 80% compared to the rest of the communities.
Table 5 is the correlation matrix of the community attributes. The betweenness attribute highly correlates with the monetary attribute.
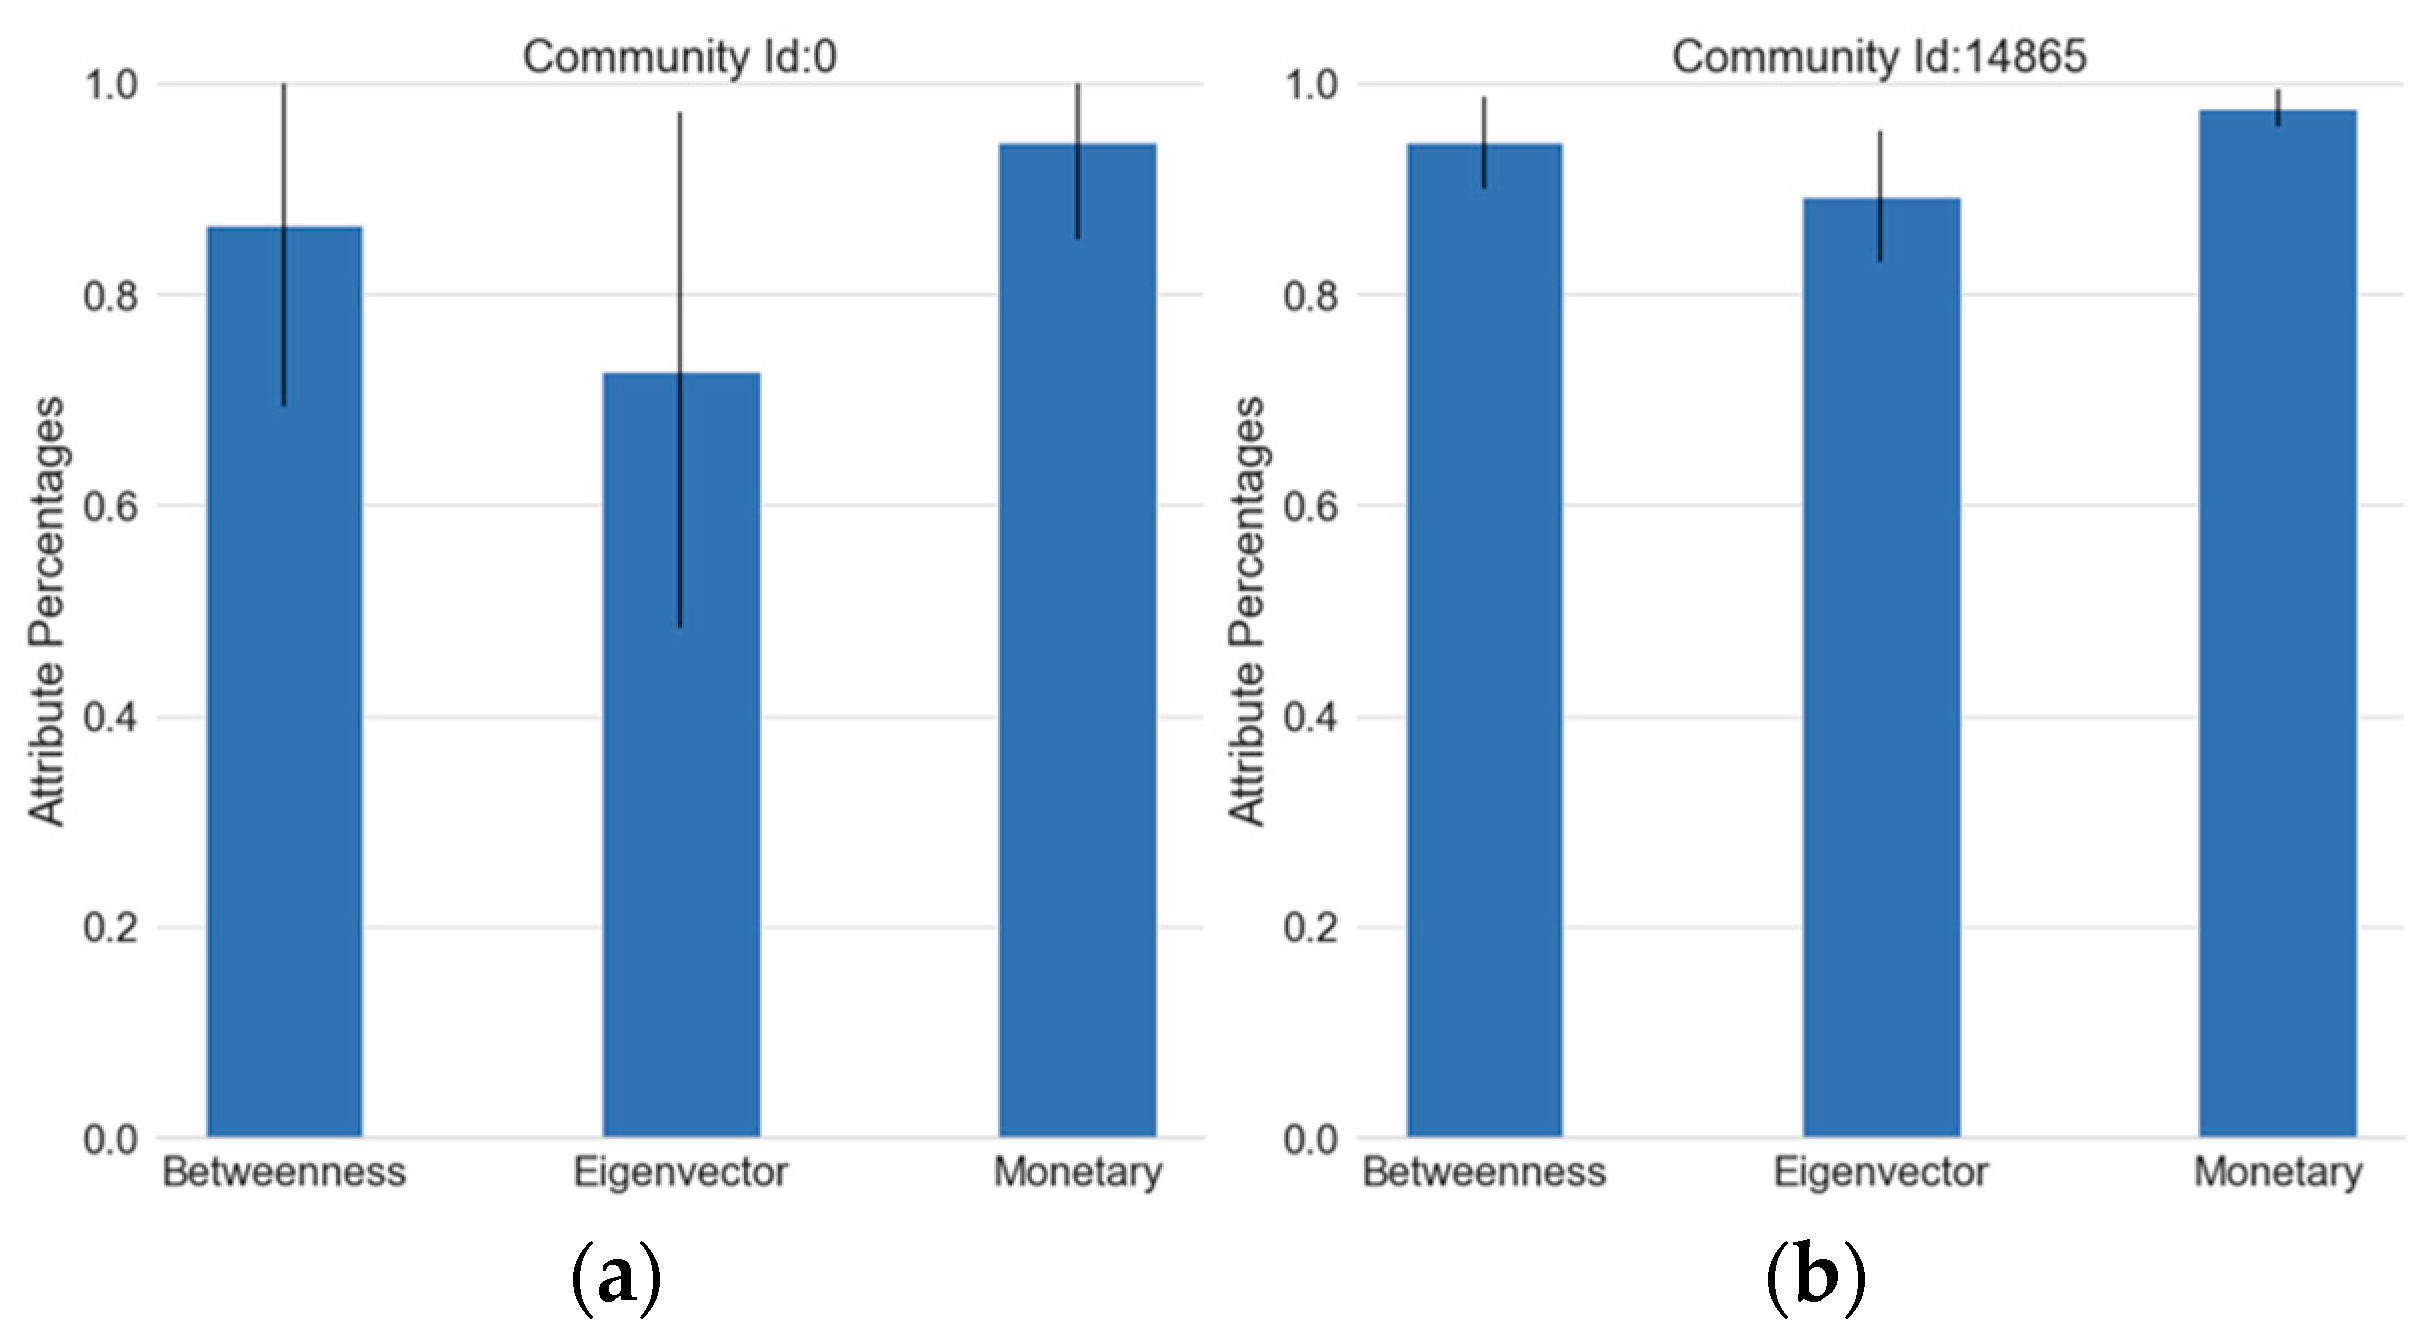
Figure 7 shows four representative communities with various sizes and characteristics. The details of the communities in
Figure 7 are shown in
Table 6, listing the mean of the attribute percentages with their standard deviations and the mean percentage levels. To elaborate, the average of (normalized to 1) betweenness values (mean betweenness for short) of the products in community (a) is 0.87. The standard deviation of the normalized betweenness (S.D. for short) values of the products for the same community is 0.17. After ranking the mean betweenness of this community, its level is determined as “high” compared to the rest of the communities. The community in
Figure 7a has high levels in all attributes, and there are 14 similar communities with various sizes. The community in
Figure 7b exhibits similar values with one difference; namely that the standard deviations are much smaller. One of the largest communities in the network (
Figure 7c) is an example of a monetary-dominant community. We assume an attribute as dominant if it has a high level while the other attributes are medium or low. Another example for dominant attributes is the community in
Figure 7d having high eigenvector values on average. There are no betweenness dominant communities in the network. All high betweenness level communities show high levels in other attributes as well.
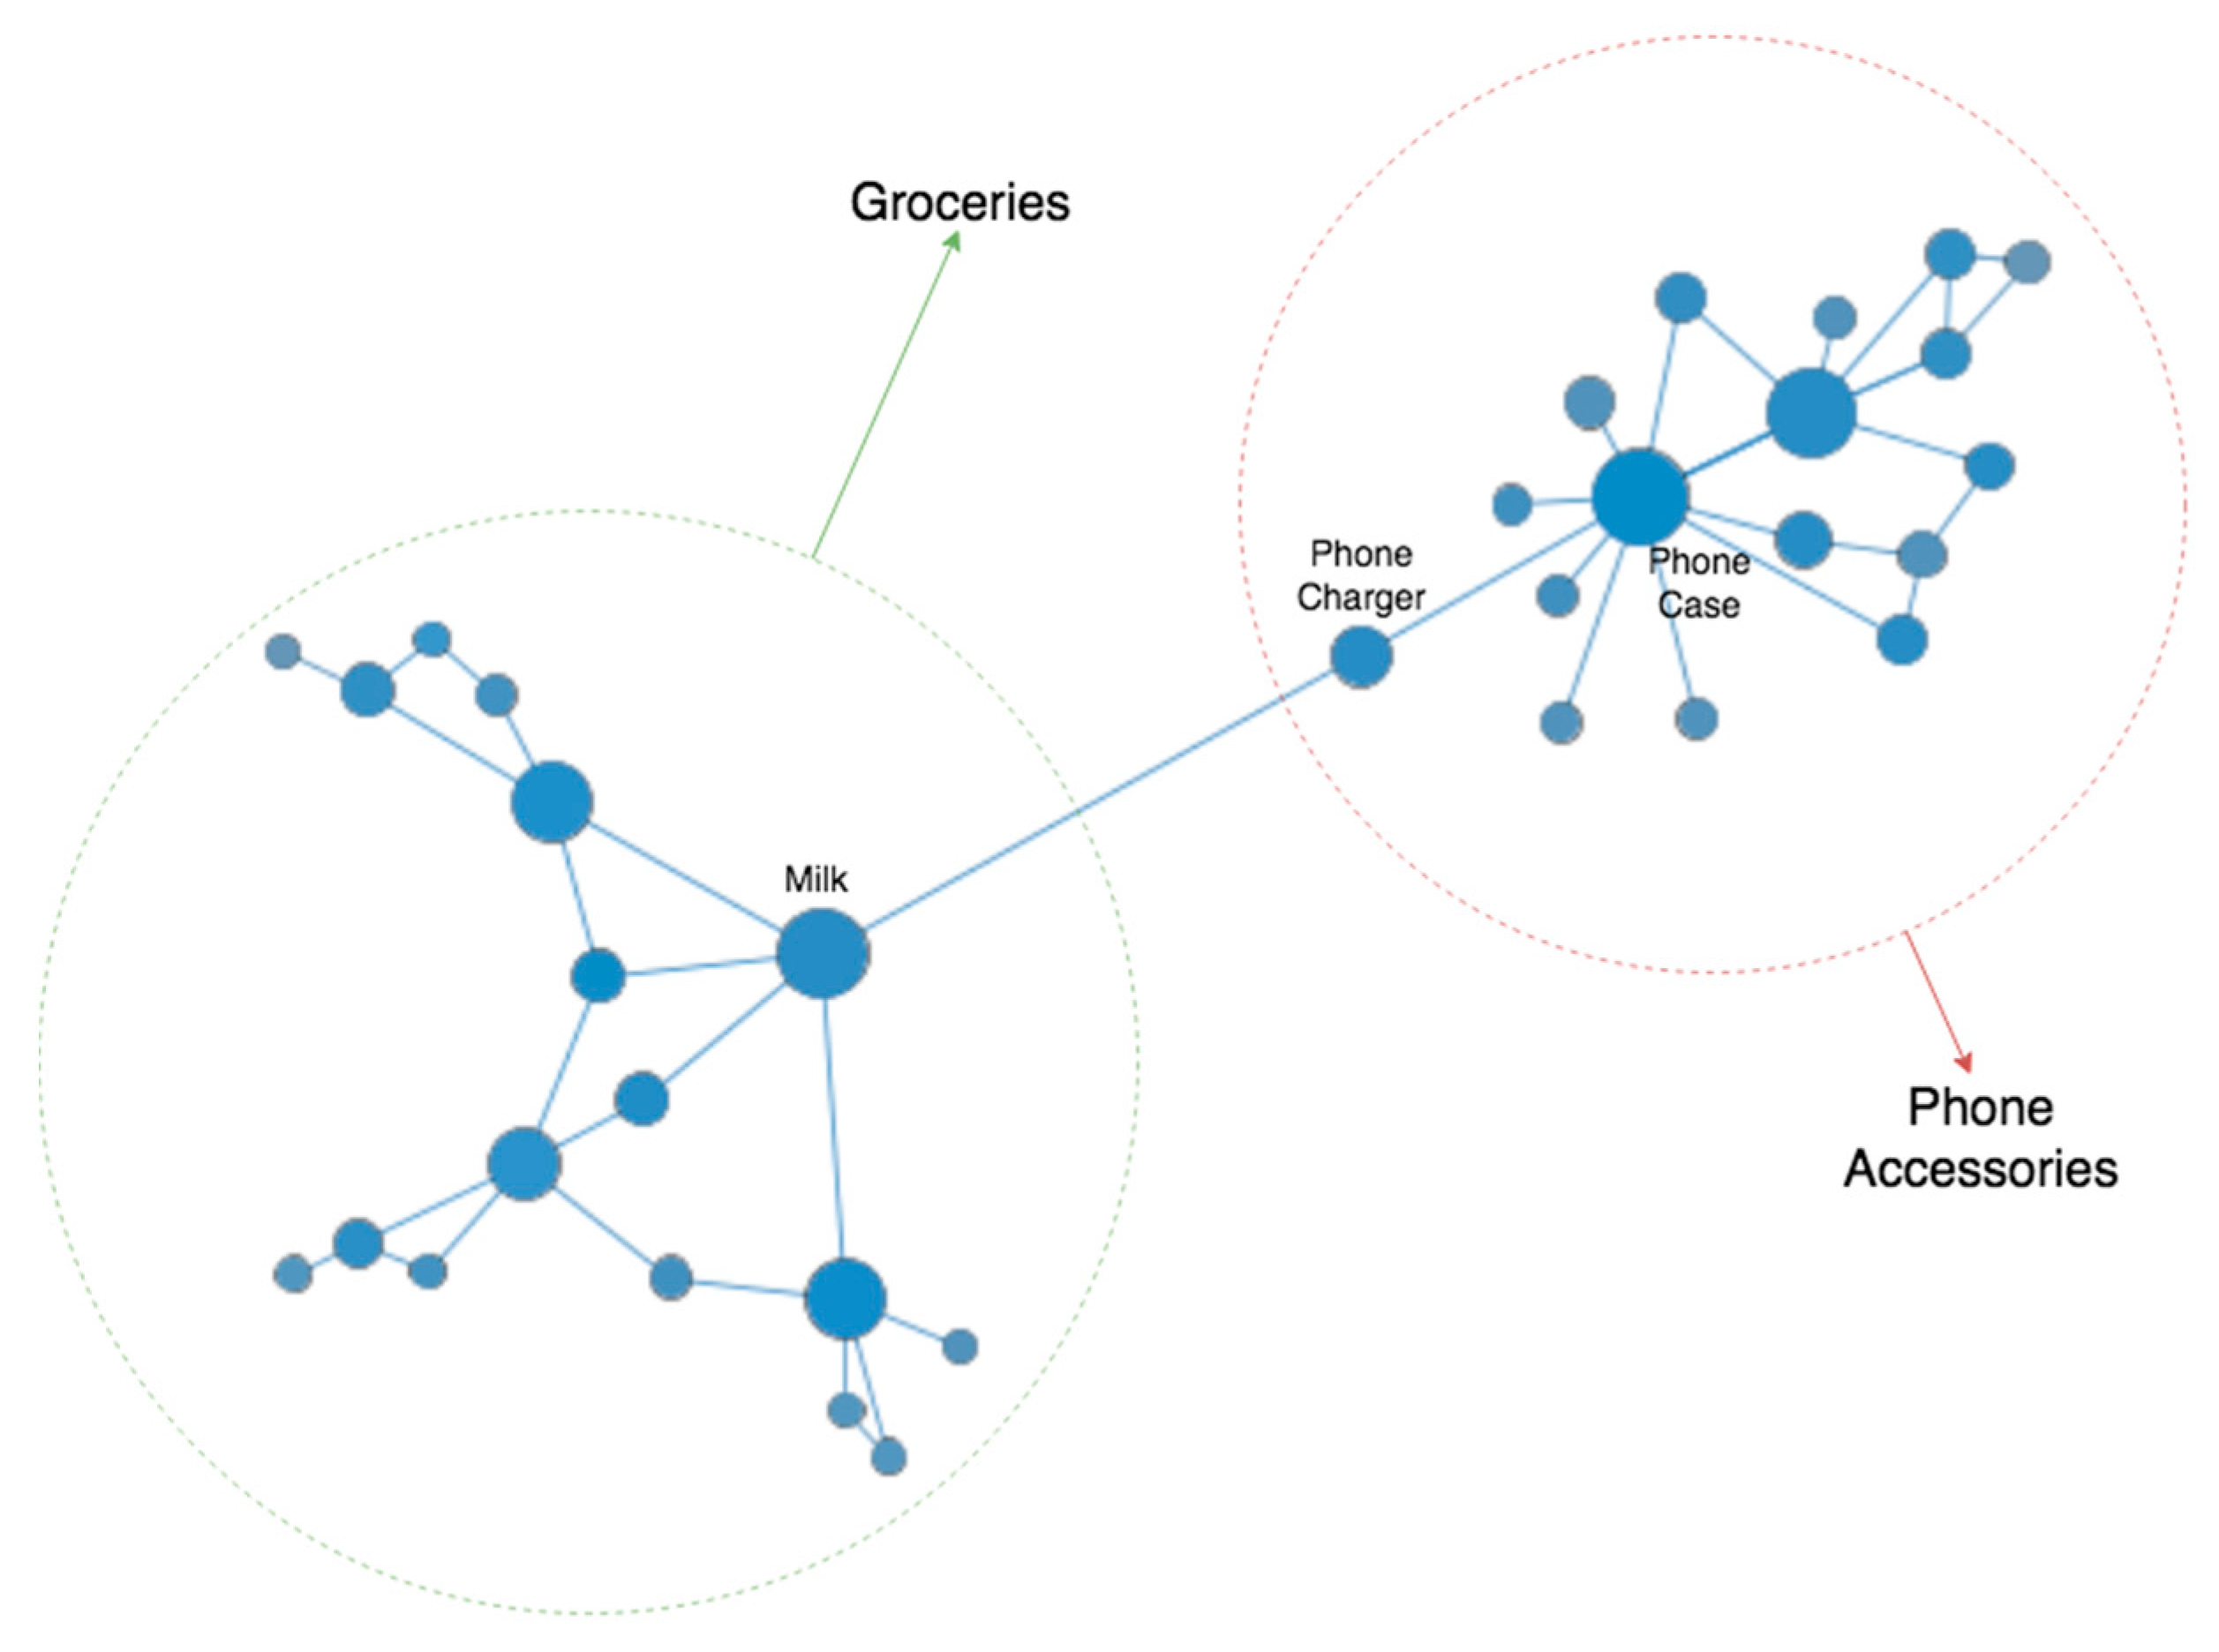
A section of co-purchase network is shown in
Figure 8 where there are two main product groups, groceries, and mobile phone accessories. Milk and phone case have high eigenvector centrality values whereas phone charger has high betweenness centrality value.
6. Discussion
In this study, we apply a network approach to MBA, extending it with recent community detection algorithms and ranking the discovered communities based on the centrality attributes of their products. We build a product network based on co-purchase relationships and discover the product communities depending on the purchase behavior of their mutual buyers. Traditionally, market basket analysis is carried out on products purchased in one basket or one shopping trip. However, in the online marketplace context, a modern version of a shopping trip is physically almost effortless, enabling buyers to make purchases throughout the day or week, suggesting a new perspective on adapting the basket concept to current customer practices. To address this issue, we broadened the scope of the basket to two weeks.
Modularity maximization community detection method can find communities in a network even if there are no underlying communities in the network. One of the features of the SBM is that it can detect whether the network has a community structure or not. The results show that the co-purchase network has several communities. The algorithm discovers 309 product communities, eight of which contain more than one thousand products. The first thing we notice is that they contain medium or high-level monetary products, which is expected as we used this monetary attribute as the edge weight of the SBM algorithm. The correlation matrix in
Table 5 supports this observation as we see that the highest correlating attribute with community size is the monetary attribute. Notice that although this correlation coefficient is the highest compared to other pairs (0.191), it is still a small value as the weight of SBM is not the only underlying factor in community detection.
The size of communities varies from a few products to thousands, as seen in
Figure 6. To segment a product, we determine the dominant attribute of its community if one attribute is distinctly higher than the others. The first example is one of the largest communities with 1175 products which exhibits high levels in all attributes (
Figure 7a). There are 14 such communities in the network. Following that, a small community with ten products also shows high levels in all attributes with minimal standard deviation values, increasing confidence in that measurement (
Figure 7b).
A monetary dominant community (
Figure 7c) indicates that high volumes of transactions took place for those products. However, their network centralities are not as significant as the others. They are high-volume products with low marketing value from a product recommendation perspective.
Faridizadeh et al. [
19] use the degree centrality metric to assess the topological significance of the product in the network and argue that products with a high degree centrality are focal points in the network, indicating that they act as complementary products. Furthermore, those products can be recommended in cross-selling or up-selling activities. In this study, we find the communities that contain products with high eigenvector centrality values. The community in (
Figure 7d) is an eigenvector-dominant community, which indicates that the products in this community are more topologically central. Eigenvector centrality indicates that a product is highly connected with other products. Unlike degree centrality, it shows neighboring products also have high connectivity. In a co-purchase network, this implies that they are star products frequently purchased with many other high degree products, making them good candidates for marketing efforts such as cross-selling, up-selling, and product placement.
Seventeen communities have high betweenness values. Except for two medium-level communities, all of which are high-level in eigenvector attributes as well. High-betweenness products connect two or more groups of products even if they are not highly connected. They serve as a gatekeeper between product groups. Ding et al. [
7] argue that gatekeeper products interact with other product communities and adding that “They can be used as an introductory product of the community to stimulate the trial of new customers through the joint promotion with other product communities.” [
7] In terms of business implications, their study concludes that segmenting products by their role in the network will help marketers to develop effective strategies in cross-marketing and new product launches. Using gatekeeper products, for instance, marketers can guide a customer interested in such a product towards a different group of products that are not directly related. In the network, we observe that phone chargers are frequently purchased with groceries. A phone charger can be recommended to a customer who purchases groceries. If the customer is interested in this recommendation, then a phone case or headphones recommendation follows. Thus, the phone charger plays the role of a gatekeeper between product groups guiding the customer from the groceries group to the phone accessories group.
7. Conclusions
This study discovered customers’ purchase patterns by examining product network communities using the stochastic block modeling (SBM), a principled method that uses Bayesian statistical inference. Being a probabilistic and generative model, SBM offers a superior solution to heuristics-based methods such as modularity maximization, which tends to overfit the data and suffers from discovering latent communities in large networks. This makes its results independent and less error prone. Thus, it is not only a scientific innovation but also a new scientific technology suitable for decision support systems for any kind of electronic commerce. This new scientific technology could be integrated into the existing decision support systems of market places online in a short period of time. Segmenting the products based on customer purchase patterns and their role in the network helps marketing managers improve marketing activities such as product recommendation, product placement, cross-selling, or customer retention.
As a limitation for our research, the stochastic nature of the SBM causes the output to vary with only a few products being assigned to different communities at each run of the algorithm. In this study, we used the monetary attribute as the edge weights for the SBM. We observed its effects in the results as the algorithm tended towards putting monetarily similar products in the same communities. As future work, frequency or recency information can be selected to observe the results, or all potential edge weights can be used to determine which fits best to the data. We hope our research contributes to e-commerce literature by employing a principled approach.


