
Eye Tracking and an A/B Split Test for Social Media Marketing Optimisation: The Connection between the User Profile and Ad Creative Components

 ,
,  ,
,  , , ,
, , ,  and
and
Abstract
:1. Introduction
- Are there differences between the target groups in terms of the creative components?
- Are small logos cost-effective elements in dental advertising?
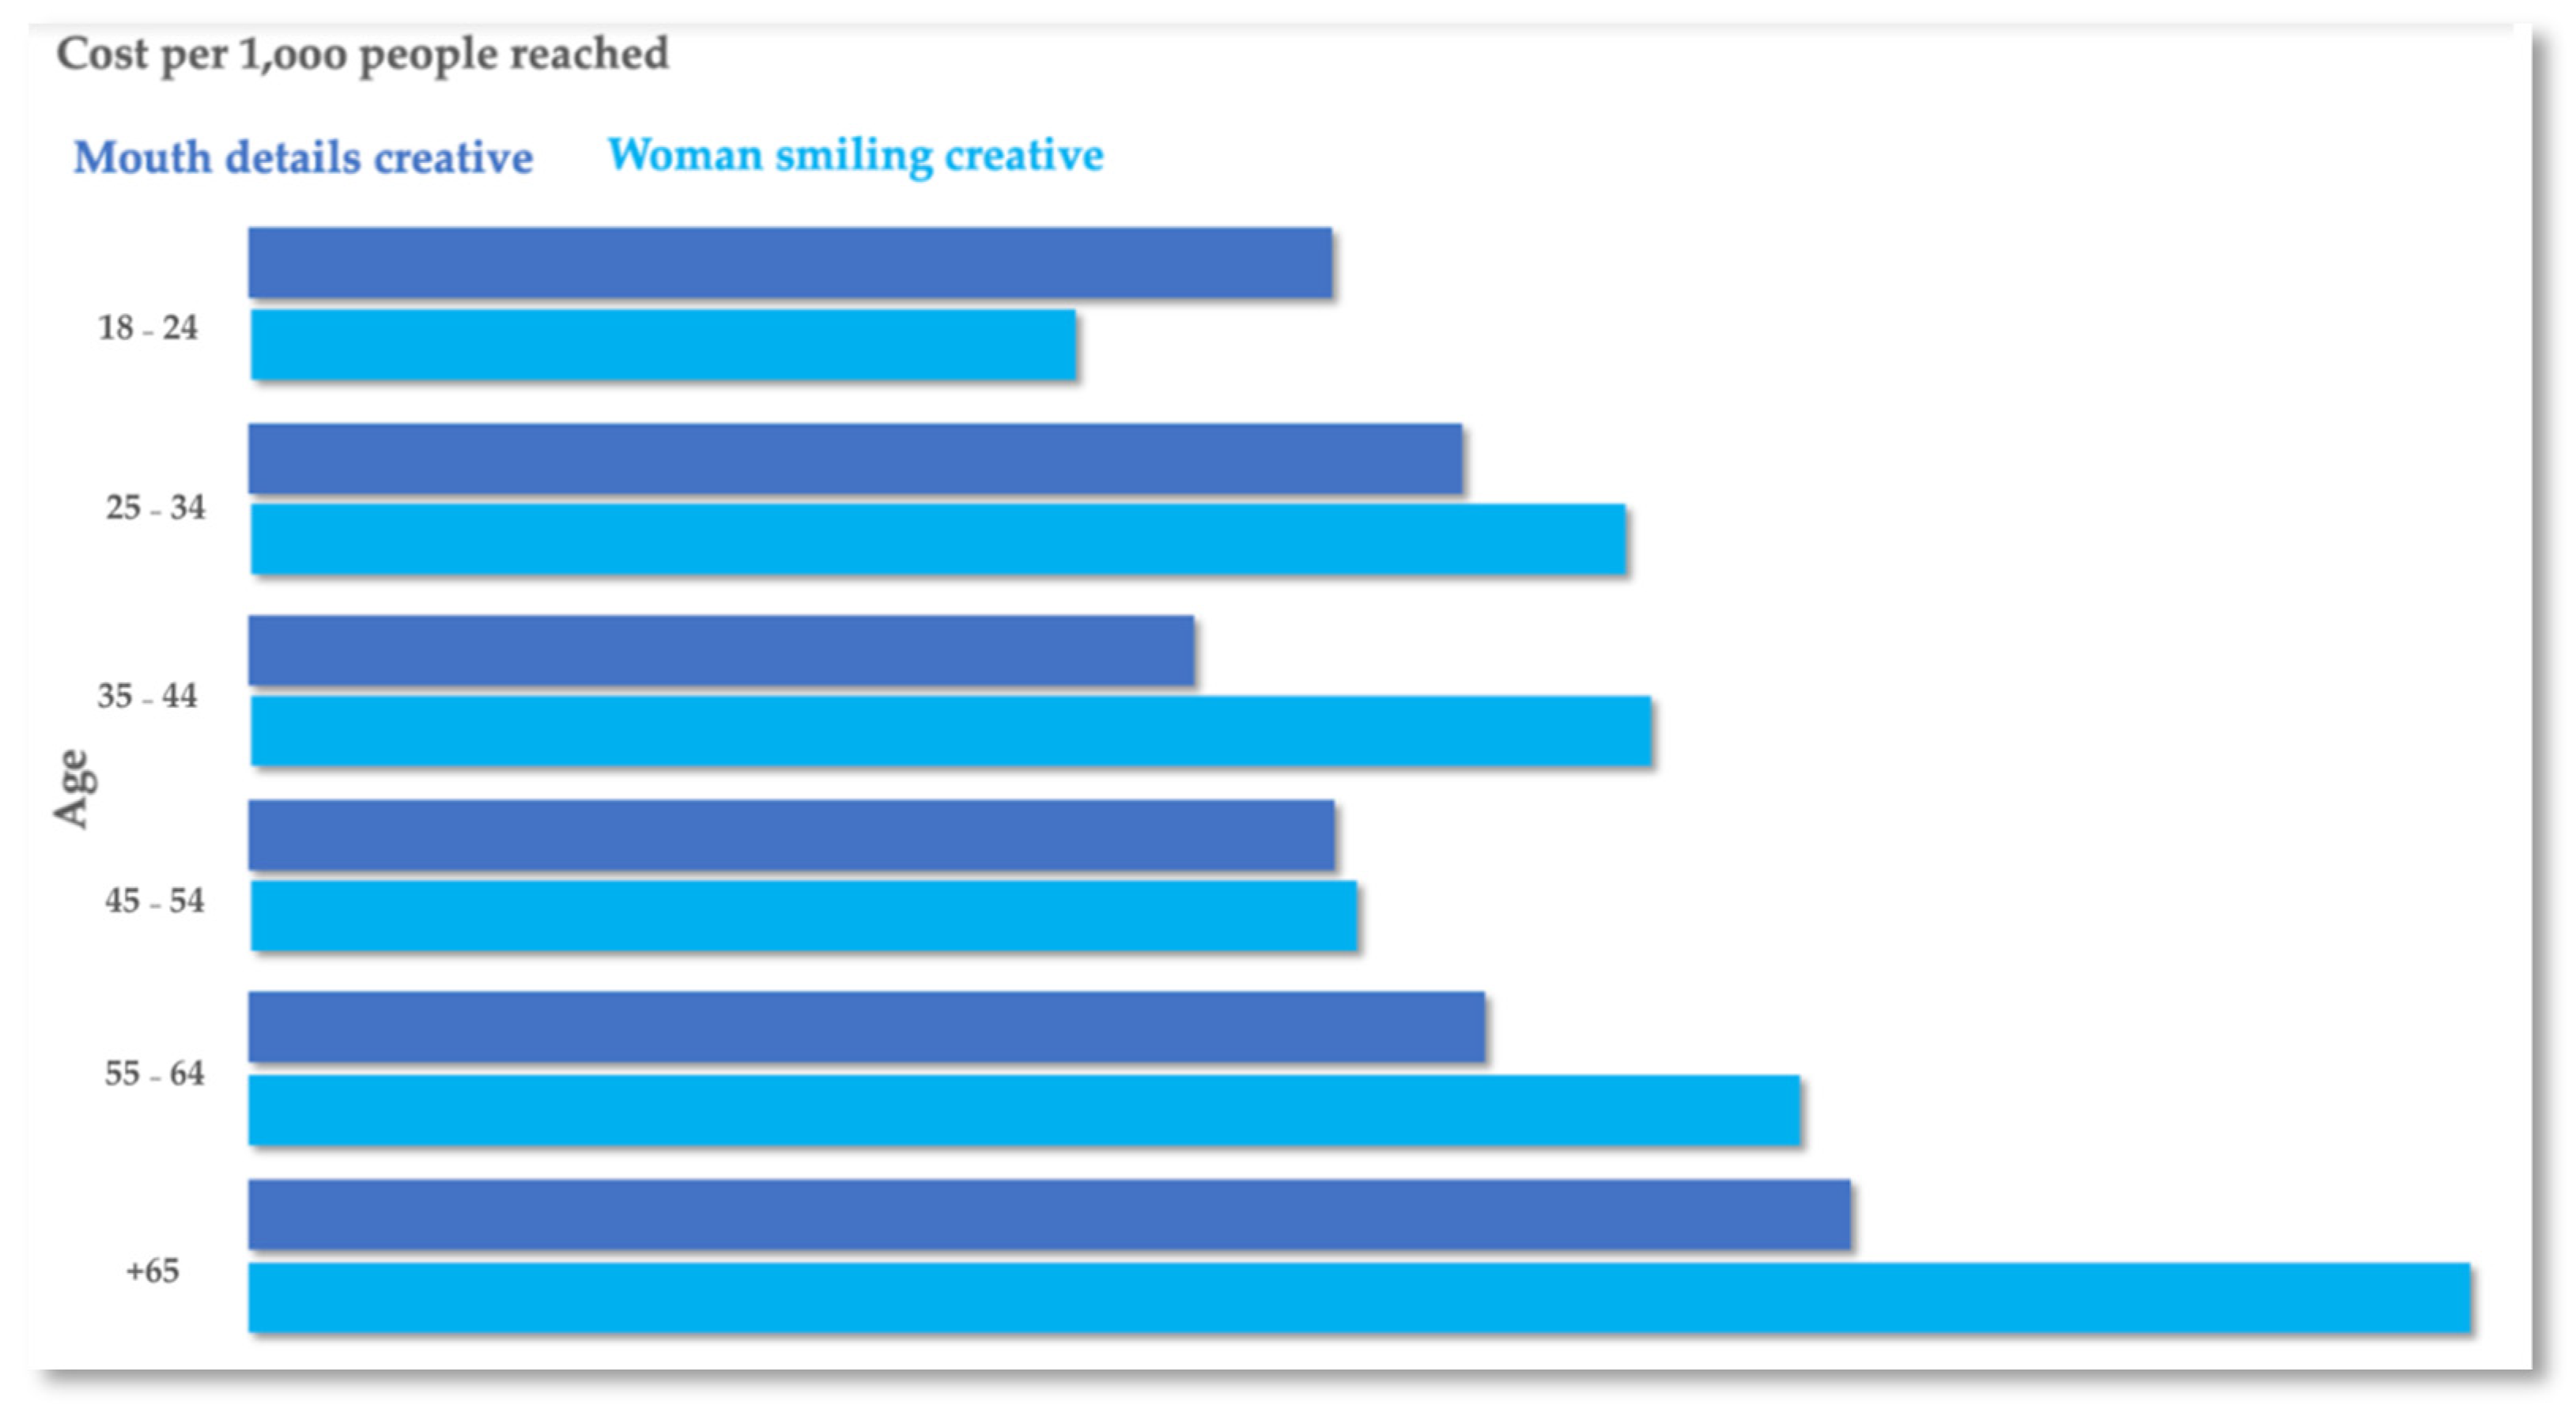
- Is it possible that smiling women’s pictures generate lower costs than mouth details?
- Is it viable that brand colours attract the audience in online marketing campaigns?
2. Literature Review
2.1. SMM and the Personalisation Concept
2.2. Online Controlled Experiments and External Validity
3. Materials and Methods
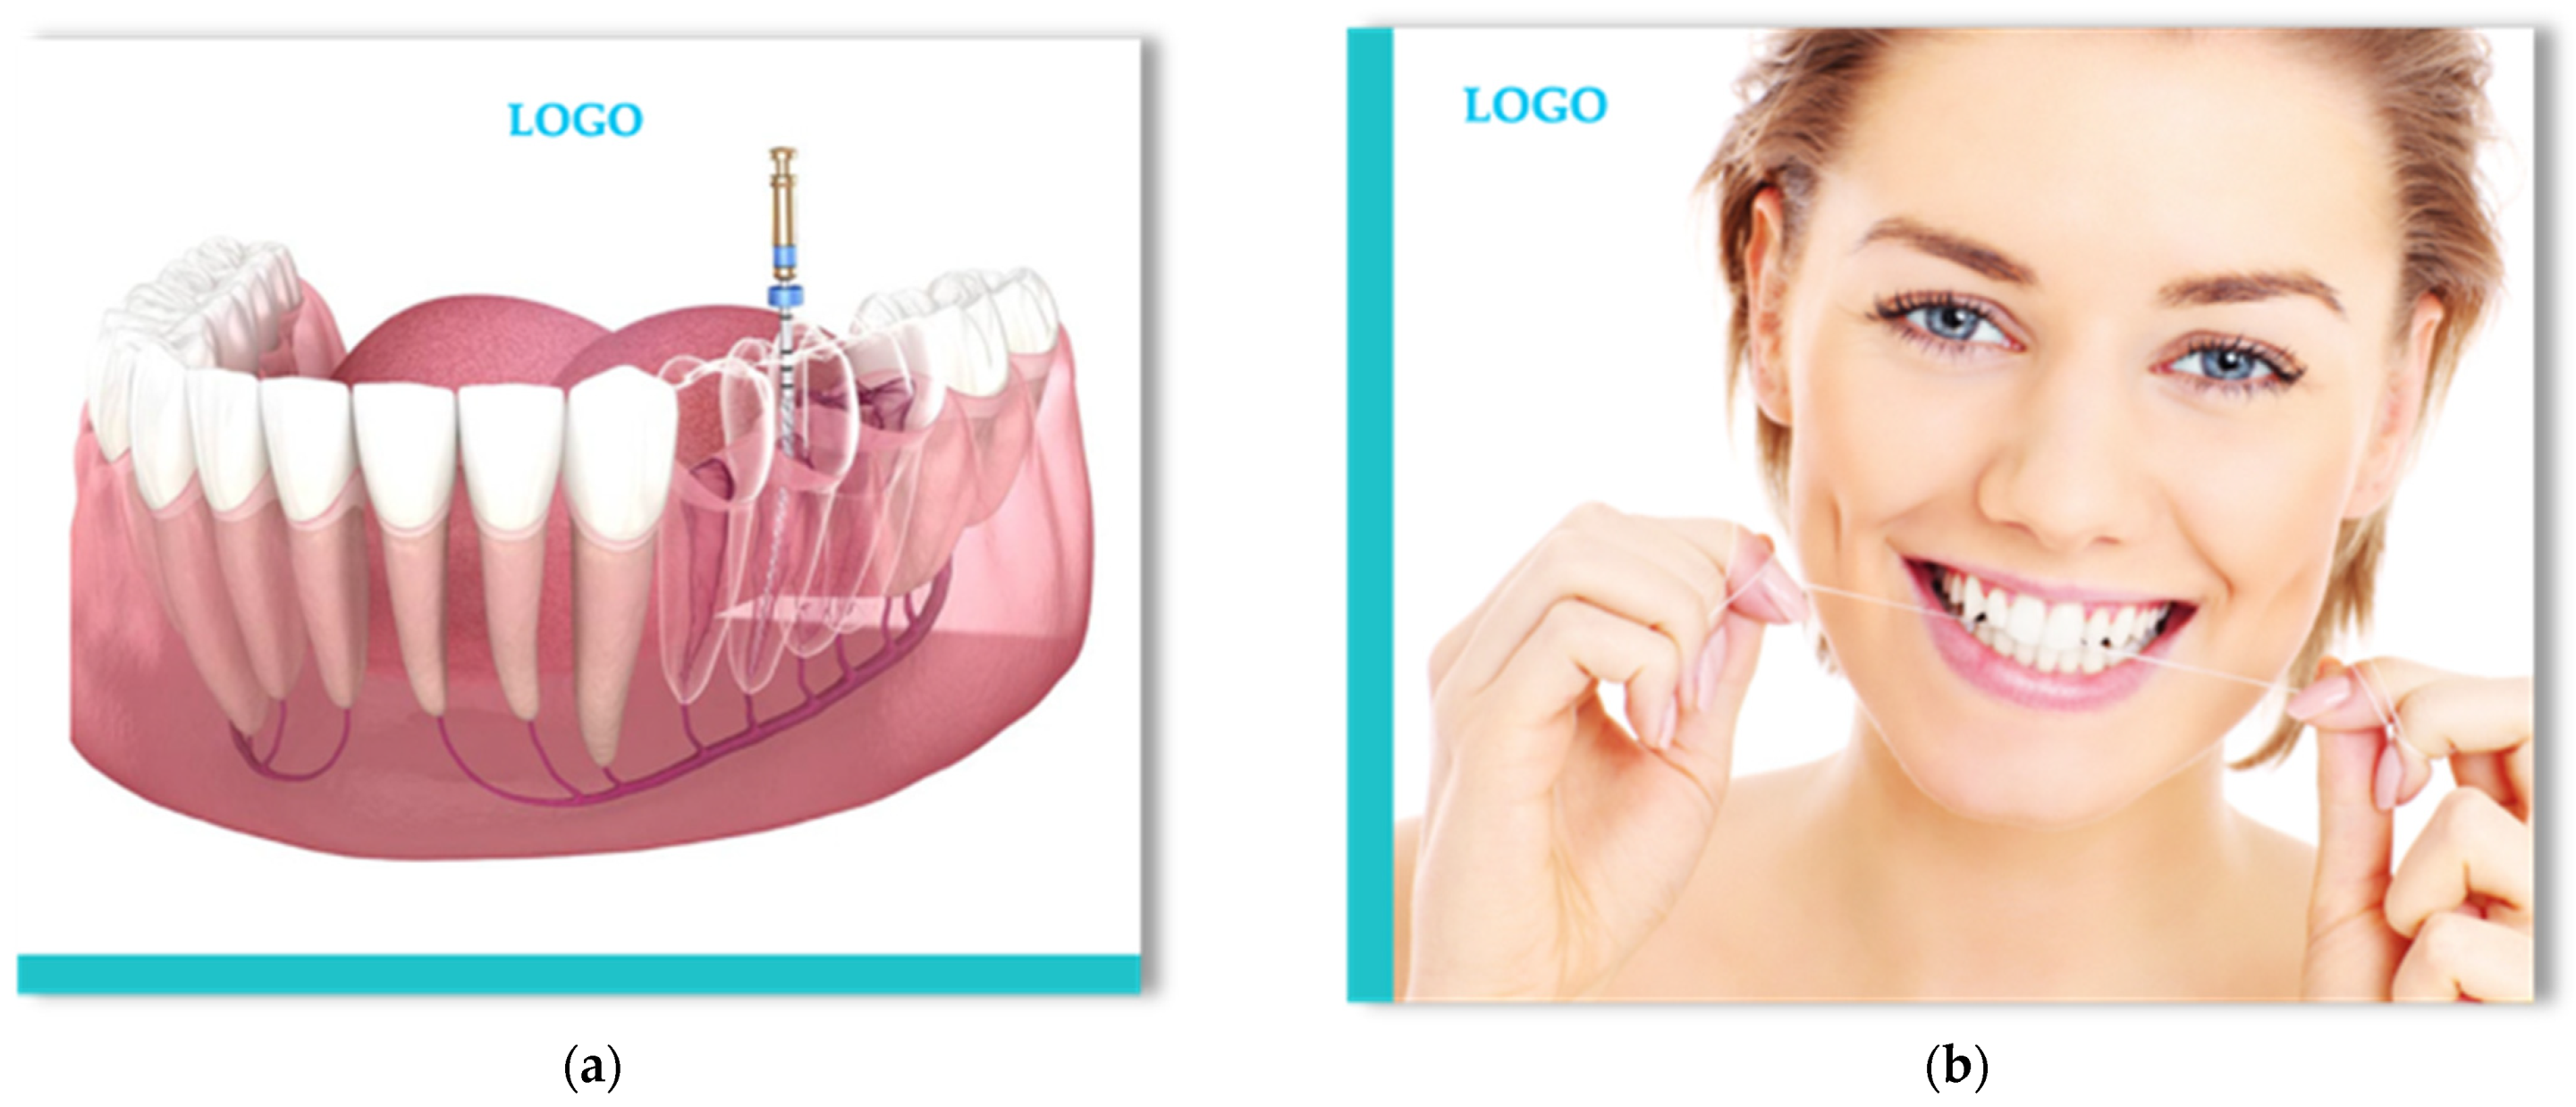
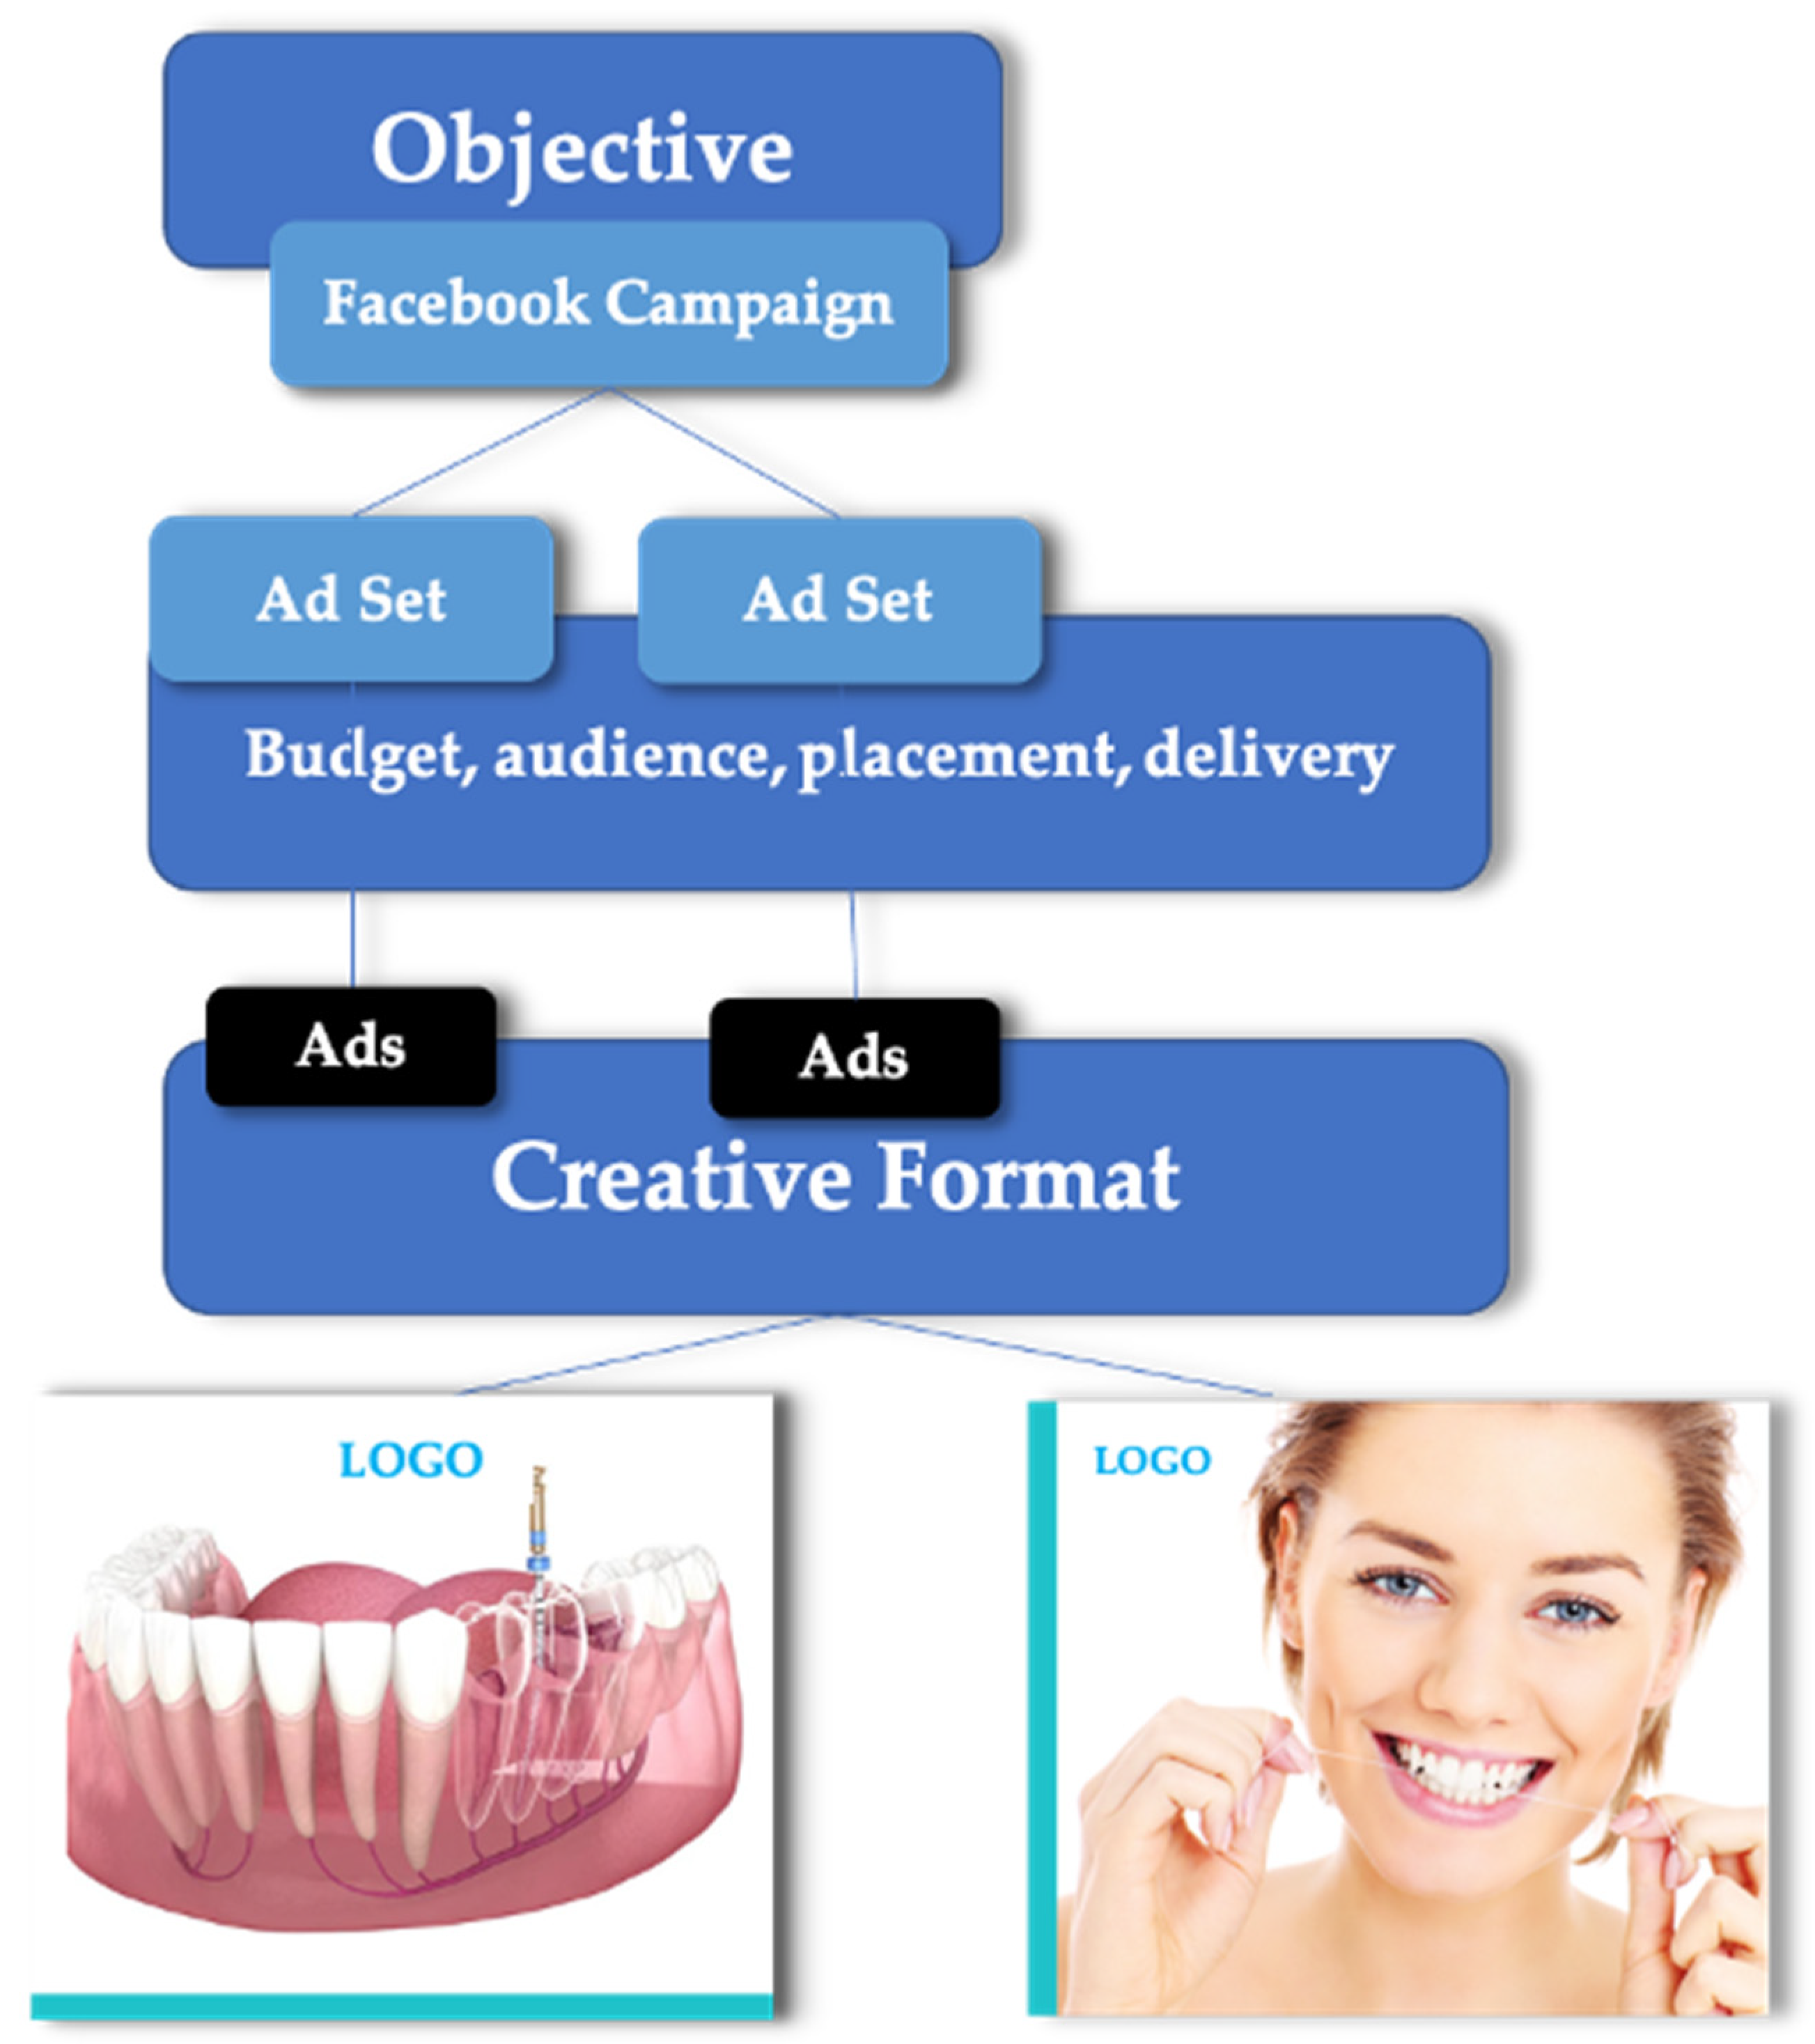
3.1. A/B Split Test (FBST)
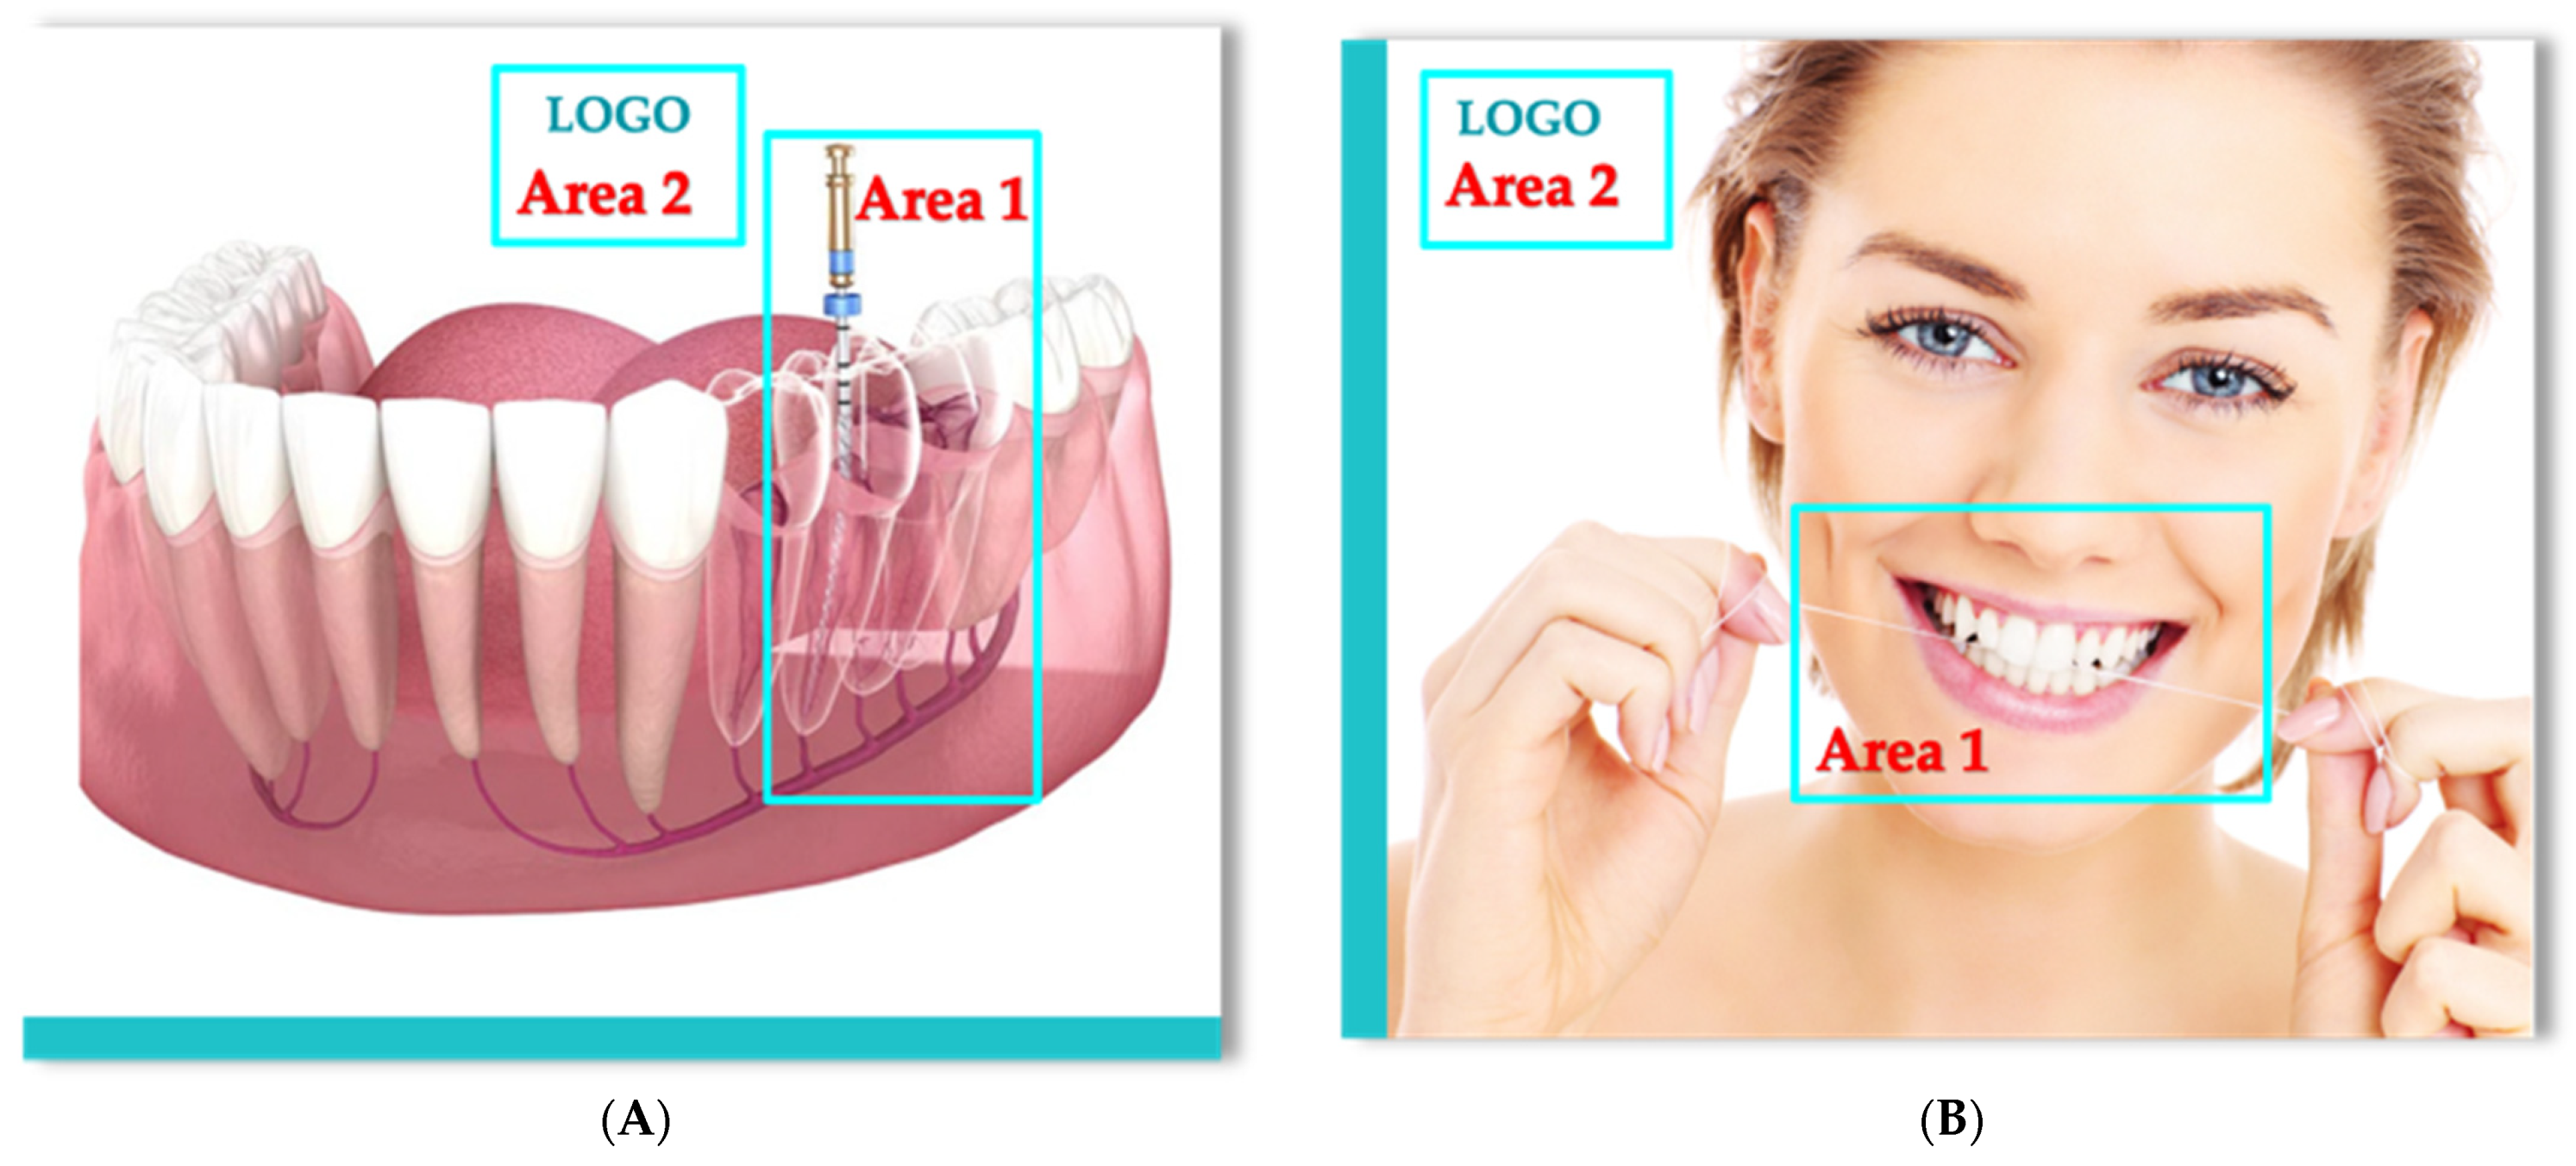
3.2. Images Analysis with Eye-Tracking Technology
- The first phase is to calibrate the system, detecting the pupils of each individual.
- For the calibration, each individual must follow a red ball on the blank screen. At first, the red ball is fixed, then it must be watched as it moves across the screen.
- After the calibration, which lasts 40–50 s, the subject is notified that the calibration stage has been successfully completed, and the experiment will begin.
- The second phase is represented by the experiment. During the experiment, the two images are displayed for each subject for ten seconds each.
4. Results
4.1. A/B Split Test Results
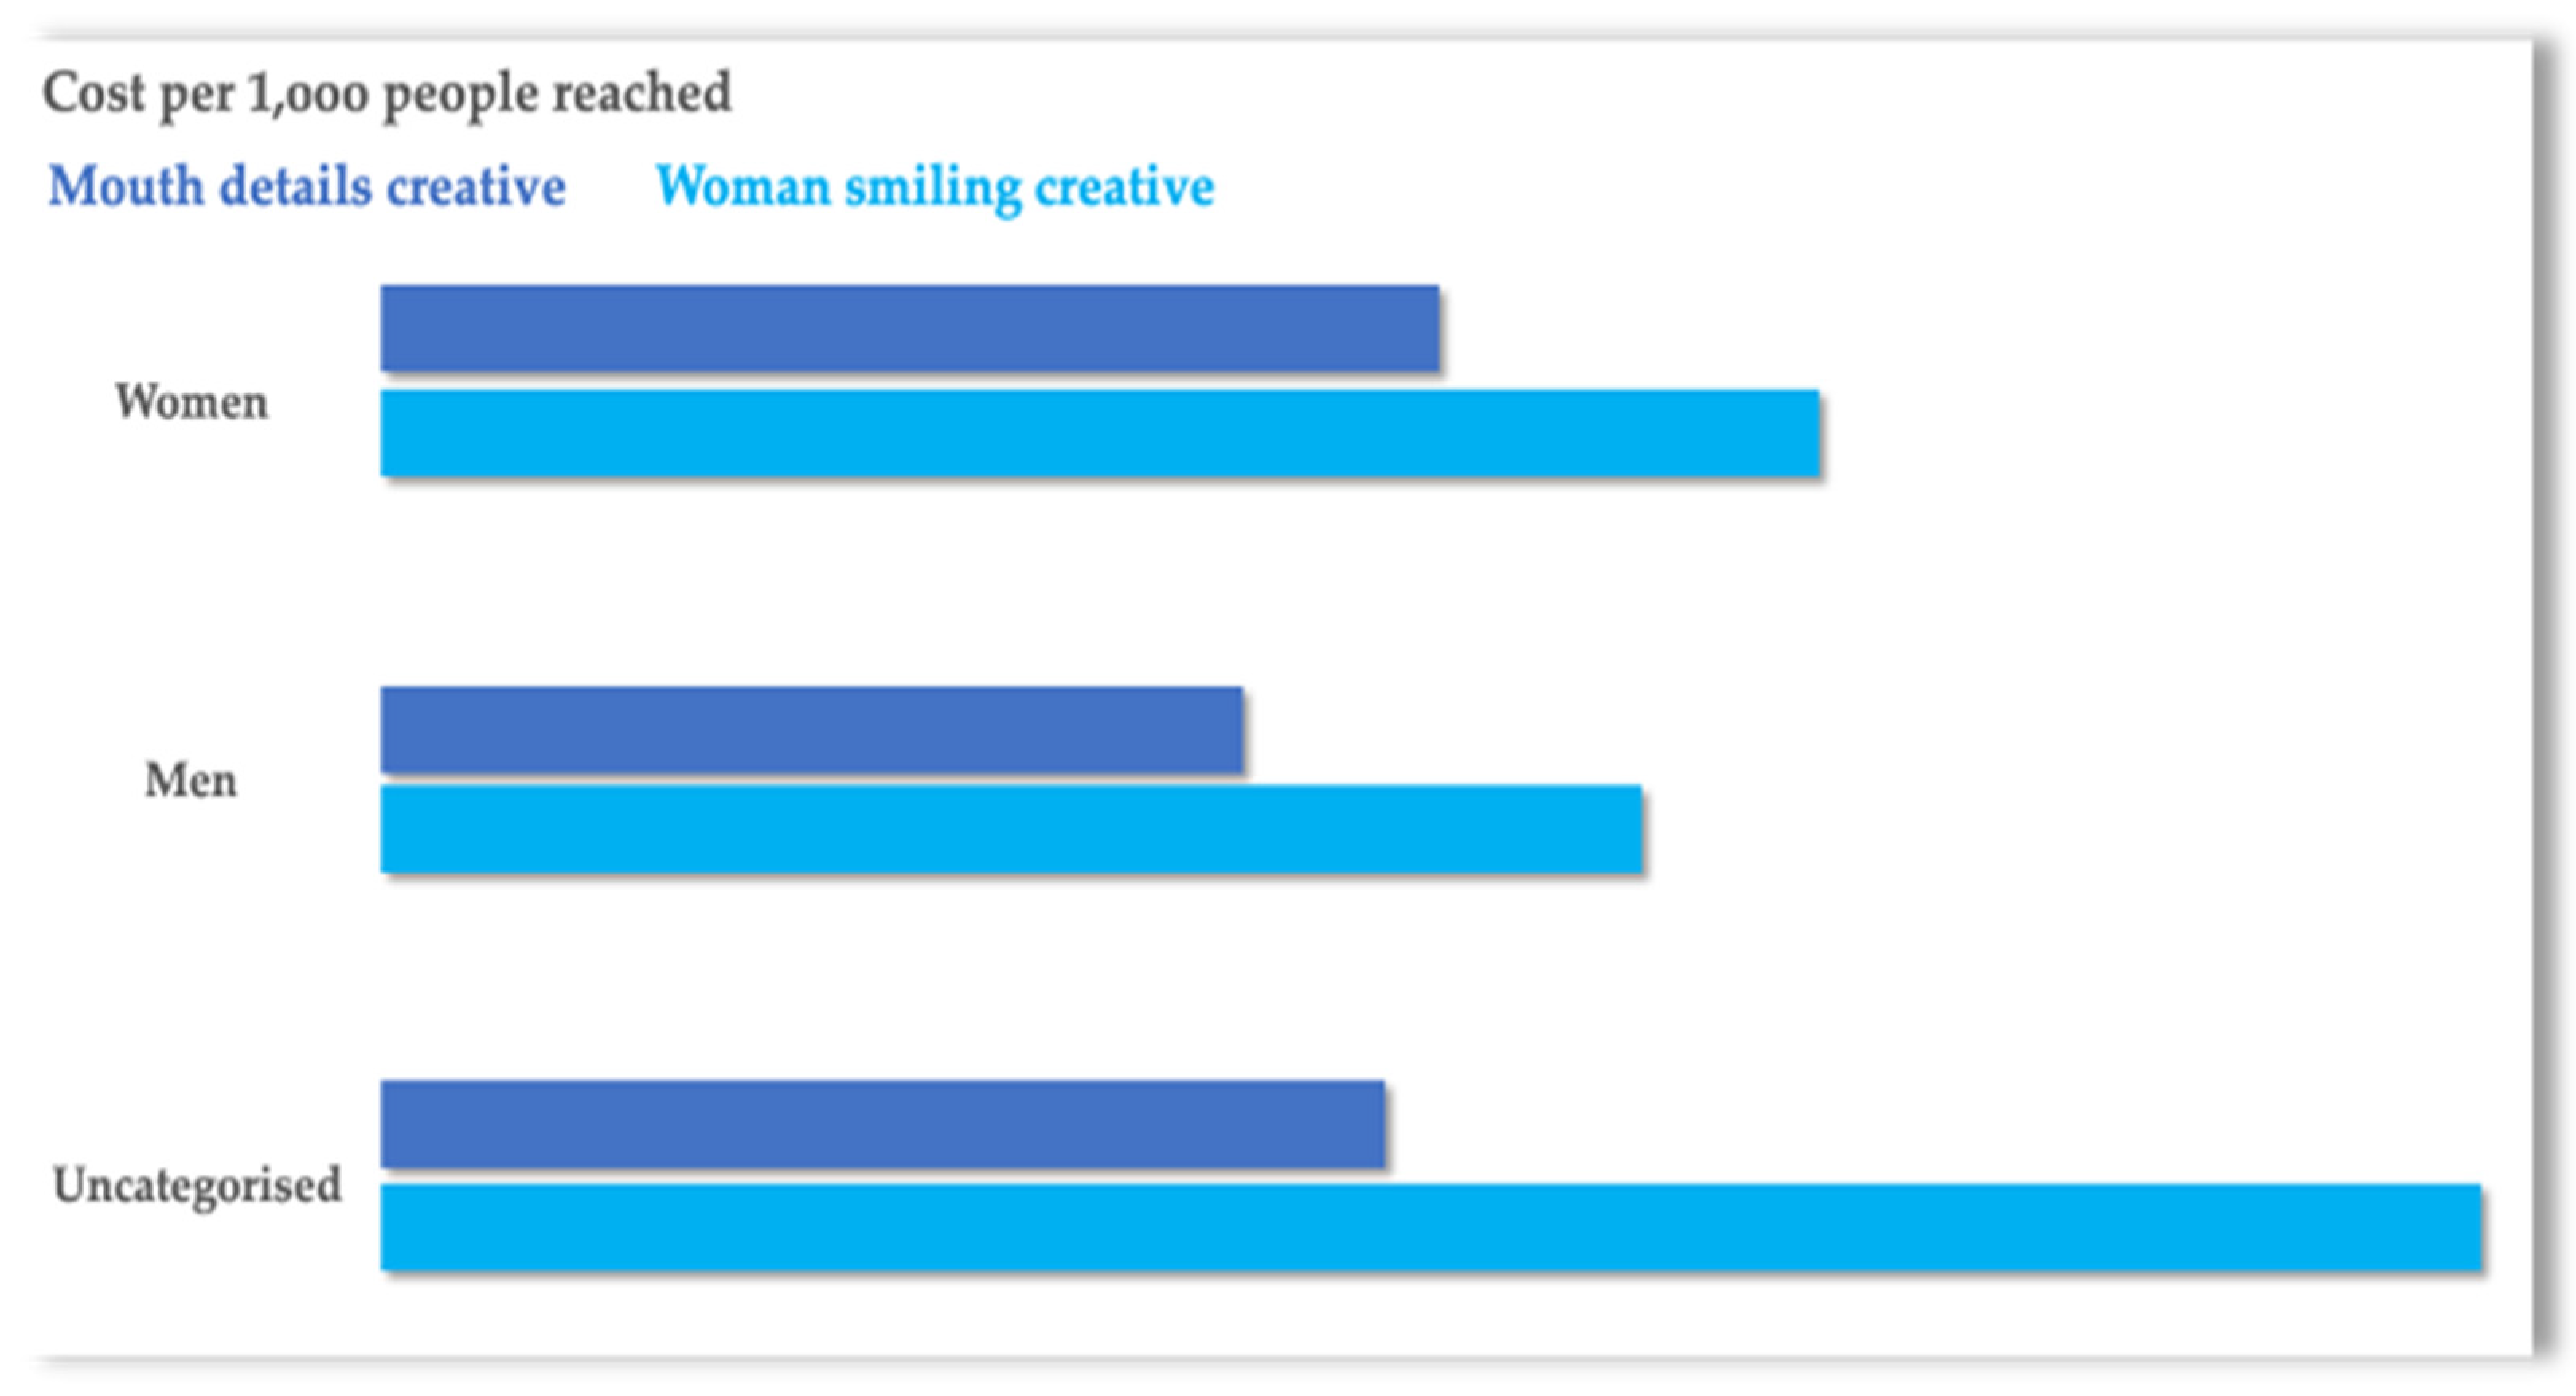
4.1.1. Cost per 1000 People Reached
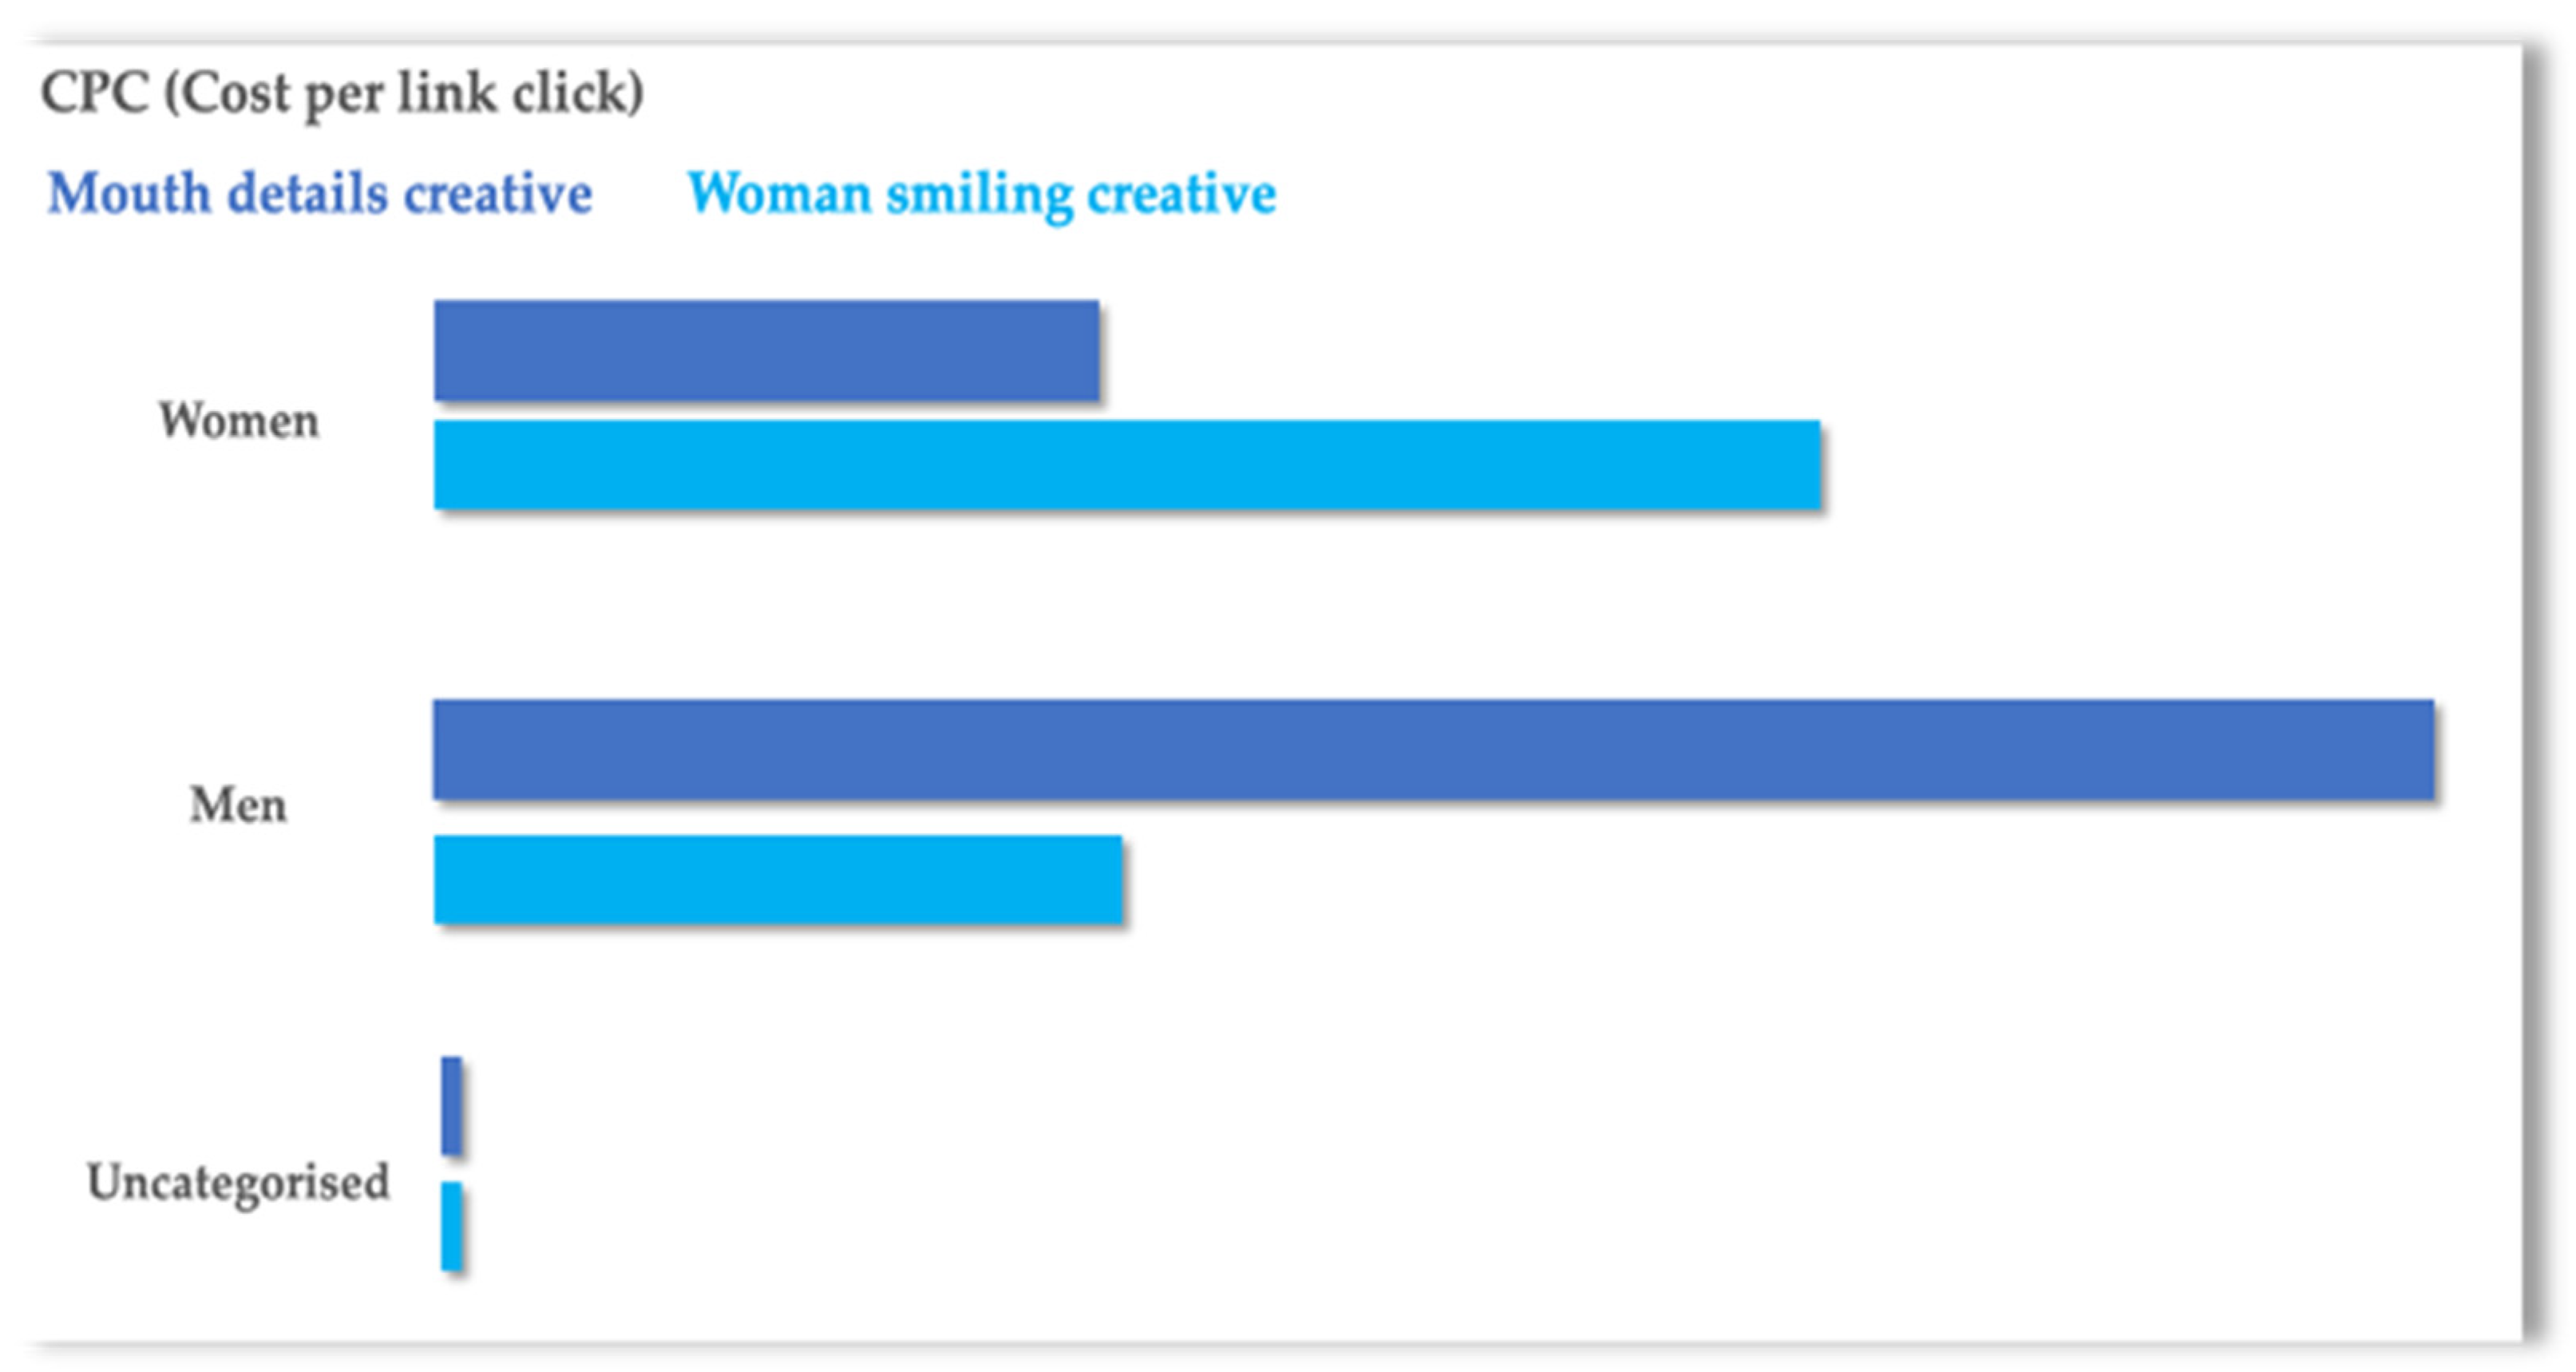
4.1.2. Cost per Link Click
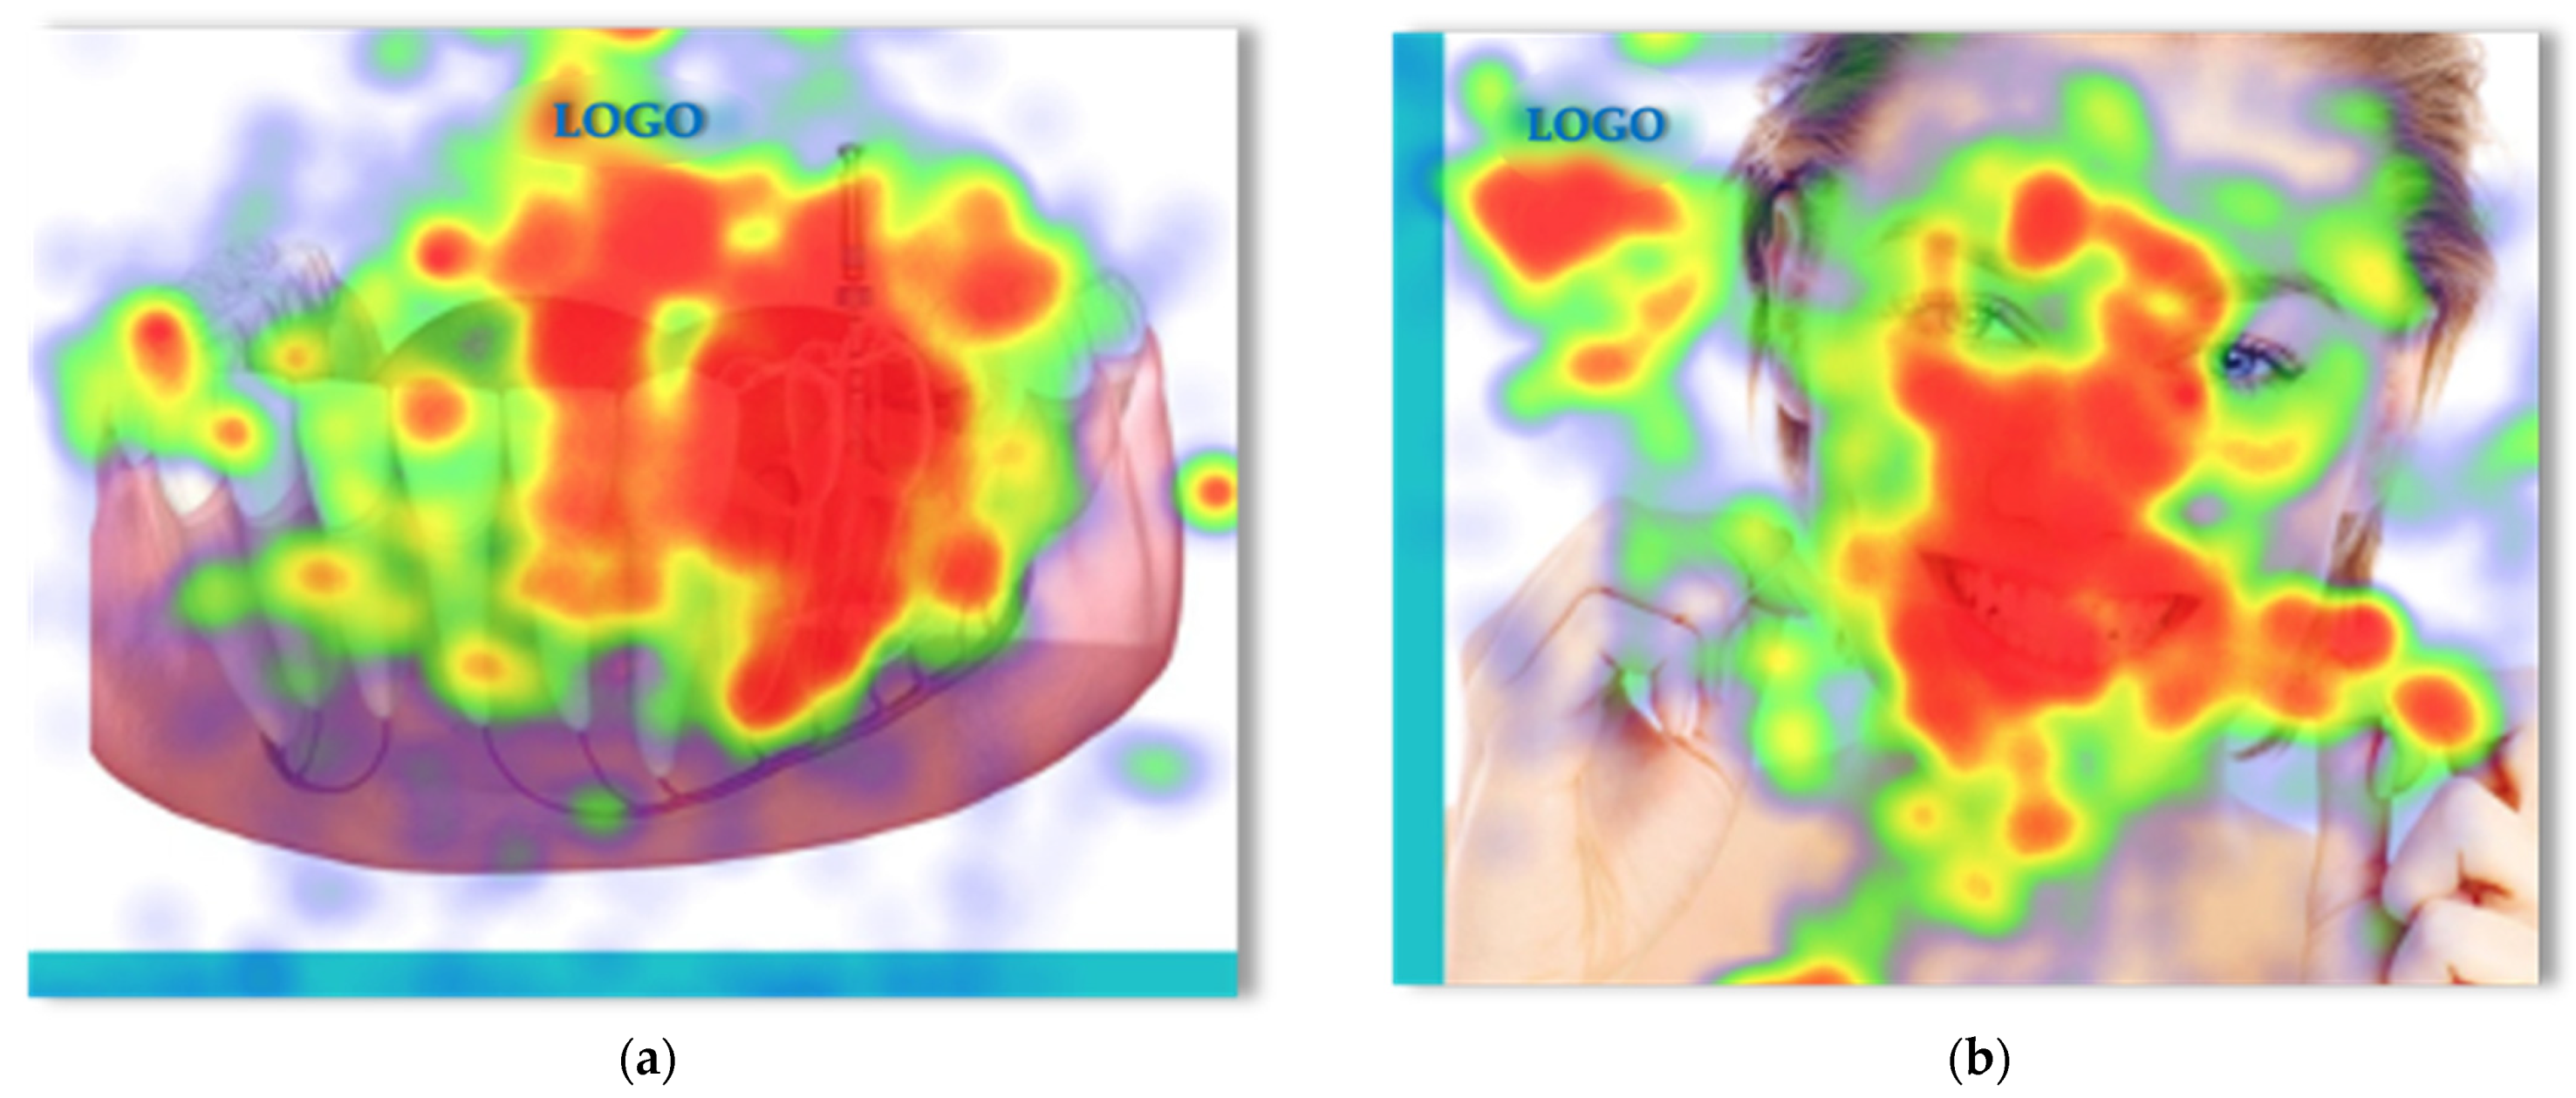
4.2. Eye-Tracking Experiment Results
4.2.1. Global Results
4.2.2. Results by Gender and Age
5. Discussion
6. Conclusions and Proposals
Author Contributions
Funding
Institutional Review Board Statement
Informed Consent Statement
Data Availability Statement
Conflicts of Interest
Ethics Approval
Appendix A

| # [Participant No] | Gender | Age | GazeCloud Session |
|---|---|---|---|
| # 0 | Male | 41 | Thursday, 24 June 2021 15:43:22 GMT |
| # 1 | Male | 20 | Thursday, 24 June 2021 15:41:03 GMT |
| # 2 | Male | 20 | Thursday, 24 June 2021 15:38:40 GMT |
| # 3 | Female | 20 | Thursday, 24 June 2021 15:36:48 GMT |
| # 4 | Female | 20 | Thursday, 24 June 2021 15:35:00 GMT |
| # 5 | Male | 20 | Thursday, 24 June 2021 15:33:15 GMT |
| # 6 | Female | 20 | Thursday, 24 June 2021 15:31:14 GMT |
| # 7 | Male | 19 | Thursday, 24 June 2021 15:29:25 GMT |
| # 8 | Female | 20 | Monday, 21 June 2021 07:35:08 GMT |
| # 9 | Female | 54 | Sunday, 20 June 2021 17:28:20 GMT |
| # 10 | Female | 54 | Sunday, 20 June 2021 17:24:29 GMT |
| # 11 | Female | 20 | Friday, 18 June 2021 17:54:58 GMT |
| # 12 | Female | 20 | Friday, 18 June 2021 08:41:42 GMT |
| # 13 | Male | 20 | Friday, 18 June 2021 08:02:18 GMT |
| # 14 | Male | 22 | Friday, 18 June 2021 08:00:16 GMT |
| # 15 | Female | 19 | Friday, 18 June 2021 07:58:09 GMT |
| # 16 | Female | 19 | Friday, 18 June 2021 07:55:59 GMT |
| # 17 | Male | 67 | Friday, 18 June 2021 07:52:42 GMT |
| # 18 | Male | 42 | Friday, 18 June 2021 07:48:21 GMT |
| # 19 | Female | 44 | Friday, 18 June 2021 07:01:25 GMT |
| # 20 | Male | 40 | Friday, 18 June 2021 06:56:26 GMT |
| # 21 | Male | 37 | Friday, 18 June 2021 06:49:57 GMT |
| # 22 | Male | 52 | Friday, 18 June 2021 06:47:24 GMT |
| # 23 | Male | 62 | Friday, 18 June 2021 05:59:54 GMT |
| # 24 | Female | 58 | Friday, 18 June 2021 05:57:25 GMT |
| # 25 | Female | 24 | Friday, 18 June 2021 05:54:42 GMT |
| # 26 | Female | 62 | Friday, 18 June 2021 05:52:26 GMT |
| # 27 | Female | 63 | Friday, 18 June 2021 05:50:02 GMT |
| # 28 | Male | 40 | Friday, 18 June 2021 05:45:17 GMT |
| # 29 | Female | 42 | Friday, 18 June 2021 05:31:16 GMT |
References
- Chang, Y.W.; Hsu, P.Y.; Wang, Y.; Chang, P.Y. Integration of online and offline health services: The role of doctor-patient online interaction. Patient Educ. Couns. 2019, 102, 1905–1910. [Google Scholar] [CrossRef] [PubMed]
- Samridhi Mishra, D.P.V.C. Communication in the time of Covid-19. Turk. J. Comput. Math. Educ. 2021, 12, 5409–5418. [Google Scholar]
- Kozánková, B.; Kambule, N.K. Consumer Trust and Data Privacy Precursors of Trust towards Social Media in the Age of Data Collection. Master’s Thesis, Lund University, Lund, Sweden, 2021. [Google Scholar]
- Atanasova, S.; Kamin, T.; Petrič, G. The benefits and challenges of online professional-patient interaction: Comparing views between users and health professional moderators in an online health community. Comput. Hum. Behav. 2018, 83, 106–118. [Google Scholar] [CrossRef]
- Keszei, D. Social Media and Emotional Intelligence: A Quantitative Analysis of the Relationship between Social Media Utilization and Post-Millennials’ Emotional Intelligence—ProQuest. Available online: https://www.proquest.com/openview/a52e634990441c3214df60095d9f64d6/1?pq-origsite=gscholar&cbl=18750&diss=y (accessed on 8 July 2021).
- Saura, J.R.; Palos-Sanchez, P.; Herráez, B.R. Digital Marketing for Sustainable Growth: Business Models and Online Campaigns Using Sustainable Strategies. Sustainability 2020, 12, 1003. [Google Scholar] [CrossRef] [Green Version]
- Garcia, J.J.L.; Lizcano, D.; Ramos, C.M.Q.; Matos, N. Digital Marketing Actions That Achieve a Better Attraction and Loyalty of Users: An Analytical Study. Futur. Internet 2019, 11, 130. [Google Scholar] [CrossRef] [Green Version]
- Kumar, V.; Mittal, S. Mobile marketing campaigns: Practices, challenges and opportunities. Int. J. Bus. Innov. Res. 2020, 21, 523. [Google Scholar] [CrossRef]
- Ijaz, M.F.; Tao, W.; Rhee, J.; Kang, Y.-S.; Alfian, G. Efficient Digital Signage-Based Online Store Layout: An Experimental Study. Sustainability 2016, 8, 511. [Google Scholar] [CrossRef] [Green Version]
- Ijaz, M.F.; Rhee, J. Constituents and Consequences of Online-Shopping in Sustainable E-Business: An Experimental Study of Online-Shopping Malls. Sustainability 2018, 10, 3756. [Google Scholar] [CrossRef] [Green Version]
- Saravanakumar, M.; Suganthalakshmi, T. Social Media Marketing. Life Sci. J. 2012, 9, 1097–8135. [Google Scholar]
- Tuten, T. Social Media Marketing, 3rd ed.; SAGE: Los Angeles, CA, USA, 2017; ISBN 9781526424549. [Google Scholar]
- Ansong, E.; Boateng, R. Surviving in the digital era—Business models of digital enterprises in a developing economy. Digit. Policy Regul. Gov. 2019, 21, 164–178. [Google Scholar] [CrossRef] [Green Version]
- Batra, R.; Keller, K.L. Integrating Marketing Communications: New Findings, New Lessons, and New Ideas. J. Mark. 2016, 80, 122–145. [Google Scholar] [CrossRef]
- Farnan, J.M.; Sulmasy, L.S.; Worster, B.K.; Chaudhry, H.J.; Rhyne, J.A.; Arora, V.M. Online medical professionalism: Patient and public relationships: Policy statement from the American College of physicians and the federation of State Medical Boards. Ann. Intern. Med. 2013, 158, 620–627. [Google Scholar] [CrossRef]
- Asiry, M.A. Dental students’ perceptions of an online learning. Saudi Dent. J. 2017, 29, 167–170. [Google Scholar] [CrossRef]
- Jo, J.H.; Kim, J.R.; Kim, M.J.; Chung, J.W.; Park, J.W. Quality and readability of online information on dental treatment for snoring and obstructive sleep apnea. Int. J. Med. Inform. 2020, 133, 104000. [Google Scholar] [CrossRef]
- Liu, Y.; Ren, C.; Shi, D.; Li, K.; Zhang, X. Evaluating the social value of online health information for third-party patients: Is uncertainty always bad? Inf. Process. Manag. 2020, 57, 102259. [Google Scholar] [CrossRef]
- Chang, T.-Y.; Hsu, M.-L.; Kwon, J.-S.; Kusdhany, M.L.S.; Hong, G. Effect of online learning for dental education in asia during the pandemic of COVID-19. J. Dent. Sci. 2021, 16, 1095–1101. [Google Scholar] [CrossRef] [PubMed]
- Wagner, G.; Schramm-Klein, H.; Steinmann, S. Online retailing across e-channels and e-channel touchpoints: Empirical studies of consumer behavior in the multichannel e-commerce environment. J. Bus. Res. 2020, 107, 256–270. [Google Scholar] [CrossRef]
- Matsui, T.; Koike, A. Who is to blame? The appearance of virtual agents and the attribution of perceived responsibility. Sensors 2021, 21, 2646. [Google Scholar] [CrossRef] [PubMed]
- Tran, L.T.T. Managing the effectiveness of e-commerce platforms in a pandemic. J. Retail. Consum. Serv. 2021, 58. [Google Scholar] [CrossRef]
- Chen, S.; Guo, X.; Wu, T.; Ju, X. Exploring the Online Doctor-Patient Interaction on Patient Satisfaction Based on Text Mining and Empirical Analysis. Inf. Process. Manag. 2020, 57, 102253. [Google Scholar] [CrossRef]
- Li, C.R.; Zhang, E.; Han, J.T. Adoption of online follow-up service by patients: An empirical study based on the elaboration likelihood model. Comput. Hum. Behav. 2021, 114, 106581. [Google Scholar] [CrossRef]
- Wedel, M.; Pieters, R. A Review of Eye-Tracking Research in Marketing. Rev. Mark. Res. 2018, 123–147. [Google Scholar] [CrossRef]
- Muñoz-Leiva, F.; Hernández-Méndez, F.; Gómez-Carmona, D. Measuring advertising effectiveness in Travel 2.0 websites through eye-tracking technology. Physiol. Behav. 2019, 200, 83–95. [Google Scholar] [CrossRef]
- Zhou, L.; Xue, F. Show products or show people: An eye-tracking study of visual branding strategy on Instagram. J. Res. Interact. Mark. 2021. [Google Scholar] [CrossRef]
- Chou, W.; Trivedi, N.; Peterson, E.; Gaysynsky, A.; Krakow, M.; Vraga, E. How do social media users process cancer prevention messages on Facebook? An eye-tracking study. Patient Educ. Couns. 2020, 103, 1161–1167. [Google Scholar] [CrossRef]
- Perrotta, D.; Grow, A.; Rampazzo, F.; Cimentada, J.; Del Fava, E.; Gil-Clavel, S.; Zagheni, E. Behaviours and attitudes in response to the COVID-19 pandemic: Insights from a cross-national Facebook survey. EPJ Data Sci. 2020, 10, 1–13. [Google Scholar] [CrossRef]
- Kohavi, R.; Tang, D.; Xu, Y. Trustworthy Online Controlled Experiments. Trust. Online Control. Exp. 2020. [Google Scholar] [CrossRef]
- King, R.; Churchill, E.F.; Tan, C. Designing with Data; O’Reilly Media, Inc.: Sebastopol, CA, USA, 2017; ISBN 9781449334833. [Google Scholar]
- Siroker, D.; Koomen, P. A/B Testing: The Most Powerful Way to Turn Clicks into Customers; Wiley: Hoboken, NJ, USA, 2013. [Google Scholar]
- Jahandideh, S.; Asefzadeh, S.; Barzegari, E. Dental services marketing: A case of dental clinics in Iran 46 Publications 134 Citations See Profile. Dataset Int. J. Healthc. Manag. 2013, 5, 12–18. [Google Scholar] [CrossRef]
- Nobre, H.; Szczygiel, N.; Condé-Pinto, M. Communicating with Patients through Facebook: The case of dental healthcare services Terrorism-Tourism-Cosmopolitanism View project EU-FP7-Homecare 222954 View project Communicating with patients through Facebook: The case of dental healthcare services. Int. J. Bus. Excell. 2019, 18, 527–548. [Google Scholar] [CrossRef]
- Skrypczak, A.M.; Tressel, W.A.; Ghayour, S.; Khosravi, R.; Ramsay, D.S. Negative online reviews of orthodontists: Content analysis of complaints posted by dissatisfied patients. Am. J. Orthod. Dentofac. Orthop. 2020, 158, 237–246. [Google Scholar] [CrossRef]
- Abdel-dayem, M.A.; Brown, D.A.; Haray, P.N. Empowering patients and educating staff—An online solution for the COVID era and beyond! Ann. Med. Surg. 2021, 65, 102238. [Google Scholar] [CrossRef]
- Al-Thuniyan, A.M.; Elmoazen, R.; Althunayan, A.; Alsalhi, R. Role of social media in dental health promotion and behavior change in Qassim province, Saudi Arabia Health Promotion View project Early Interceptive Dentistry View project Role of social media in dental health promotion and behavior change in Qassim prov. Int. J. Med. Health Res. 2018, 4, 98–103. [Google Scholar]
- Al-Amad, S.H.; Hussein, A. Anxiety among dental professionals and its association with their dependency on social media for health information: Insights from the COVID-19 pandemic. BMC Psychol. 2021, 9, 1–9. [Google Scholar] [CrossRef]
- Khan, M.H. Dental Marketing One on One. Adv. Dent. 2020, 1, 1–2. [Google Scholar] [CrossRef]
- Kesh, S.; Kazmi, A.; Pradhan, R.; Malhotra, V. Horizon, Expanding knowledge. OJAS 2014. Available online: https://bit.ly/3hhSbEf (accessed on 28 May 2021).
- Bakhov, I.; Viktorovych Bayev, V.; Victorivna Bayeva, O.; Bakhov, I.S.; Antonenko, I.Y.; Melnyk, I.L. Digital Marketing as an Innovative Communication Tool in the Health Tourism System Article in. Int. J. Eng. Trends Technol. 2020, 68. [Google Scholar] [CrossRef]
- Sukhpal, K.; Riponjot, S.; Sandeep, K. How social media can help dental professionals. Int. J. Curr. Res. Biol. Med. 2018, 3, 22–25. [Google Scholar] [CrossRef]
- Meng, F.; Zhang, X.; Liu, L.; Ren, C. Converting readers to patients? From free to paid knowledge-sharing in online health communities. Inf. Process. Manag. 2021, 58, 102490. [Google Scholar] [CrossRef]
- Audretsch, D.B.; Coad, A.; Segarra, A. Firm growth and innovation. Small Bus. Econ. 2014, 43, 743–749. [Google Scholar] [CrossRef]
- Vitorino, L.C.; Lisboa, A.; Antunes, R.J. Digital Era: How Marketing Communication Develops Business Innovation–Case Studies. In Digital Marketing Strategies and Models for Competitive Business. In Advances in Business Strategy and Competitive Advantage; IGI Global: Hershey, PA, USA, 2020; pp. 1–29. [Google Scholar]
- Caputo, A.; Pizzi, S.; Pellegrini, M.M.; Dabić, M. Digitalization and business models: Where are we going? A science map of the field. J. Bus. Res. 2021, 123, 489–501. [Google Scholar] [CrossRef]
- Dimov, G.; Ulrich, K.; König, M.; Röglinger, M.; Rosemann, M. An Exploration into Future Business Process Management Capabilities in View of Digitalization Results from a Delphi Study. Bus. Inf. Syst. Eng. 2021, 63. [Google Scholar] [CrossRef] [Green Version]
- Ribeiro-Navarrete, S.; Botella-Carrubi, D.; Palacios-Marqués, D.; Orero-Blat, M. The effect of digitalization on business performance: An applied study of KIBS. J. Bus. Res. 2021, 126, 319–326. [Google Scholar] [CrossRef]
- Răbonțu, C.-I.; Babucea, A.-G. New Perspectives on the Development of Entrepreneurship and Business in the Medical Field in Romania under the Impact of Digitalization and the Covid-19 Crisis. Ann. Econ. Ser. 2021, 2, 49–54. [Google Scholar]
- Plugmann, J.; Plugmann, P. Digitalization from the Patients’ Perspective. Digit. Healthc. 2021, 43–50. [Google Scholar] [CrossRef]
- Chatterjee, S.; Kumar Kar, A. Why do small and medium enterprises use social media marketing and what is the impact: Empirical insights from India. Int. J. Inf. Manag. 2020, 53, 102103. [Google Scholar] [CrossRef]
- Zollo, L.; Filieri, R.; Rialti, R.; Yoon, S. Unpacking the relationship between social media marketing and brand equity: The mediating role of consumers’ benefits and experience. J. Bus. Res. 2020, 117, 256–267. [Google Scholar] [CrossRef]
- Arrigo, E.; Liberati, C.; Mariani, P. Social Media Data and Users’ Preferences: A Statistical Analysis to Support Marketing Communication. Big Data Res. 2021, 24, 100189. [Google Scholar] [CrossRef]
- Chawla, Y.; Chodak, G. Social media marketing for businesses: Organic promotions of web-links on Facebook. J. Bus. Res. 2021, 135, 49–65. [Google Scholar] [CrossRef]
- Dolega, L.; Rowe, F.; Branagan, E. Going digital? The impact of social media marketing on retail website traffic, orders and sales. J. Retail. Consum. Serv. 2021, 60, 102501. [Google Scholar] [CrossRef]
- Kim, D.Y.; Kim, H.Y. Trust me, trust me not: A nuanced view of influencer marketing on social media. J. Bus. Res. 2021, 134, 223–232. [Google Scholar] [CrossRef]
- Jiménez-Marín, G.; Zambrano, R.E.; Galiano-Coronil, A.; Tobar-Pesántez, L. Brand Management from Social Marketing and Happiness Management Binomial of in the Age of Industry 4.0. J. Leg. Ethical Regul. Issues 2021, 24, 1–10. [Google Scholar] [CrossRef]
- Zambrano, R.E.; Jiménez-Marín, G.; Galiano-Coronil, A.; Ravina-Ripoll, R. Children, media and food. A new paradigm in food advertising, social marketing and happiness management. Int. J. Environ. Res. Public Health 2021, 18, 3588. [Google Scholar] [CrossRef] [PubMed]
- Carvalho, H.C.; Mazzon, J.A. A better life is possible: The ultimate purpose of social marketing. J. Soc. Mark. 2015, 5, 169–186. [Google Scholar] [CrossRef]
- Castillo-Abdul, B.; Pérez-Escoda, A.; Civila, S. Social media fostering happiness management: Three luxury brands case study on Instagram. Corp. Gov. 2021. [Google Scholar] [CrossRef]
- Lin, J.; Luo, Z.; Benitez, J.; Luo, X.R.; Popovič, A. Why do organizations leverage social media to create business value? An external factor-centric empirical investigation. Decis. Support Syst. 2021, 113628. [Google Scholar] [CrossRef]
- Hammer, C.C.; Boender, T.S.; Thomas, D.R. Social media for field epidemiologists (#SoMe4epi): How to use Twitter during the #COVID19 pandemic. Int. J. Infect. Dis. 2021. [Google Scholar] [CrossRef]
- Lian, Y.; Dong, X. Exploring social media usage in improving public perception on workplace violence against healthcare workers. Technol. Soc. 2021, 65, 101559. [Google Scholar] [CrossRef]
- Wang, Y.; Cheng, Y.; Sun, J. When public relations meets social media: A systematic review of social media related public relations research from 2006 to 2020. Public Relat. Rev. 2021, 47, 102081. [Google Scholar] [CrossRef]
- Pinheiro, V.S.; Ferreira de Freitas, A.A.; Gerhard, F. Happiness and Consumption in Social Media Times: An Analysis of Sharing Experience Posts-Web of Science Core Collection. Available online: https://www-webofscience-com.am.e-nformation.ro/wos/woscc/full-record/WOS:000668648000007 (accessed on 26 August 2021).
- Henry, R.K.; Molnar, A.; Henry, J.C. A survey of US dental practices’ use of social media. J. Contemp. Dent. Pract. 2012, 13, 137–141. [Google Scholar] [CrossRef] [PubMed]
- Chang, T.Y.; Hong, G.; Paganelli, C.; Phantumvanit, P.; Chang, W.J.; Shieh, Y.S.; Hsu, M.L. Innovation of dental education during COVID-19 pandemic. J. Dent. Sci. 2021, 16, 15–20. [Google Scholar] [CrossRef] [PubMed]
- Bahabri, R.H.; Zaidan, A.B. The impact of social media on dental practice promotion and professionalism amongst general dental practitioners and specialists in KSA. J. Taibah Univ. Med. Sci. 2021, 16, 456–460. [Google Scholar] [CrossRef]
- Chiu, Y.P. Social recommendations for facebook brand pages. J. Theor. Appl. Electron. Commer. Res. 2020, 16, 71–84. [Google Scholar] [CrossRef]
- De Silva, T.M. The role of customer engagement in cultivating relationships with automotive Facebook brand pages. Online Inf. Rev. 2021. [Google Scholar] [CrossRef]
- Molina, A.; Gómez, M.; Lyon, A.; Aranda, E.; Loibl, W. What content to post? Evaluating the effectiveness of Facebook communications in destinations. J. Destin. Mark. Manag. 2020, 18, 100498. [Google Scholar] [CrossRef]
- Kaiser, C.; Ahuvia, A.; Rauschnabel, P.A.; Wimble, M. Social media monitoring: What can marketers learn from Facebook brand photos? J. Bus. Res. 2020, 117, 707–717. [Google Scholar] [CrossRef]
- Lalicic, L.; Huertas, A.; Moreno, A.; Jabreel, M. Emotional brand communication on Facebook and Twitter: Are DMOs successful? J. Destin. Mark. Manag. 2020, 16, 100350. [Google Scholar] [CrossRef]
- Li, Z.; Zhang, Q.; Du, X.; Ma, Y.; Wang, S. Social media rumor refutation effectiveness: Evaluation, modelling and enhancement. Inf. Process. Manag. 2021, 58, 102420. [Google Scholar] [CrossRef]
- Fink, M.; Koller, M.; Gartner, J.; Floh, A.; Harms, R. Effective entrepreneurial marketing on Facebook—A longitudinal study. J. Bus. Res. 2020, 113, 149–157. [Google Scholar] [CrossRef]
- Johann, M.; Wolf, C.; Godulla, A. Managing relationships on Facebook: A long-term analysis of leading companies in Germany. Public Relat. Rev. 2021, 47, 102044. [Google Scholar] [CrossRef]
- Rakshit, S.; Mondal, S.; Islam, N.; Jasimuddin, S.; Zhang, Z. Social media and the new product development during COVID-19: An integrated model for SMEs. Technol. Forecast. Soc. Chang. 2021, 170, 120869. [Google Scholar] [CrossRef]
- McAndrew, M.; Johnston, A.E. The Role of Social Media in Dental Education. J. Dent. Educ. 2012, 76, 1474–1481. [Google Scholar] [CrossRef] [PubMed]
- Woolley, J.; Donnell, C.; Worthington, S. Making impressions count: An evaluation of the quality of information provided by orthodontic practices in London in response to the COVID-19 pandemic. Heliyon 2020, 6, e05516. [Google Scholar] [CrossRef]
- Ali, S. Dental practice during the era of COVID-19 pandemic: An Egyptian experience. Oral Dis. 2021, 1–2. [Google Scholar] [CrossRef]
- Towne, J.; Suliman, Y.; Russell, K.A.; Stuparich, M.A.; Nahas, S.; Behbehani, S. Health Information in the Era of Social Media: An Analysis of the Nature and Accuracy of Posts Made by Public Facebook Pages for Patients with Endometriosis. J. Minim. Invasive Gynecol. 2021, 28, 1637–1642. [Google Scholar] [CrossRef]
- Saadeh, R.A.; Saadeh, N.A.; de la Torre, M.A. Determining the usage of social media for medical information by the medical and dental students in northern Jordan. J. Taibah Univ. Med. Sci. 2020, 15, 110–115. [Google Scholar] [CrossRef]
- Felix, R.; Rauschnabel, P.A.; Hinsch, C. Elements of strategic social media marketing: A holistic framework. J. Bus. Res. 2017, 70, 118–126. [Google Scholar] [CrossRef]
- Aleshnikova, V.; Beregovskaya, T.; van der Voort, E. A Smart Consumer Is a Challenge for Business. In “Smart Technologies” for Society, State and Economy; Springer: Berlin/Heidelberg, Germany, 2020; pp. 1746–1753. [Google Scholar]
- Aboudou, S.; Ichraq, H.; Youssef, M. The Behaviour of Connected Consumer Following Communication by Social Media: Exploratory Study on Moroccan Ready-to-Wear Brands. Stud. Appl. Econ. 2021, 38. [Google Scholar] [CrossRef]
- Piatrov, I.; Kusá, A. Innovative approach to consumer segmentation in a digital age and their attitude to environmental issues. In Proceedings of the 14th European Conference on Innovation and Entrepreneurship (ECIE 2019), Kalamata, Greece, 19–20 September 2019; Academic Conferences and Publishing International Limited: Reading, UK, 2019; Volume 2, pp. 788–794. [Google Scholar]
- Słupińska, A.S.K. Creative management of the advertising form and content. Entrep. Sustain. Issues 2019, 7, 842–861. [Google Scholar] [CrossRef]
- Mishra, S.; Verma, M.; Gligorijevic, J. Guiding creative design in online advertising. In RecSys ’19: Proceedings of the 13th ACM Conference on Recommender Systems, Copenhagen, Denmark, 16–20 September 2019; ACM: New York, NY, USA, 2019. [Google Scholar]
- Ahmed, K.M. Effect of Design Elements for Social Media Ads on Consumer’s Purchasing Decision|Open Access Journals. Glob. Media J. 2020, 18, 1–12. [Google Scholar]
- Zhang, B.; Sundar, S.S. Proactive vs. reactive personalization: Can customization of privacy enhance user experience? Int. J. Hum. Comput. Stud. 2019, 128, 86–99. [Google Scholar] [CrossRef]
- Schreiner, T.; Rese, A.; Baier, D. Multichannel personalization: Identifying consumer preferences for product recommendations in advertisements across different media channels. J. Retail. Consum. Serv. 2019, 48, 87–99. [Google Scholar] [CrossRef]
- Baardman, L.; Fata, E.; Pani, A.; Perakis, G. Dynamic Creative Optimization in Online Display Advertising. Electron. J. 2021. [Google Scholar] [CrossRef]
- Bol, N.; Dienlin, T.; Kruikemeier, S.; Sax, M.; Boerman, S.C.; Strycharz, J.; Helberger, N.; de Vreese, C.H. Understanding the Effects of Personalization as a Privacy Calculus: Analyzing Self-Disclosure across Health, News, and Commerce Contexts. J. Comput. Commun. 2018, 23, 370–388. [Google Scholar] [CrossRef] [Green Version]
- Jung, A.-R. The influence of perceived ad relevance on social media advertising: An empirical examination of a mediating role of privacy concern. Comput. Hum. Behav. 2017, 70, 303–309. [Google Scholar] [CrossRef]
- Geng, S.; Yang, P.; Gao, Y.; Tan, Y.; Yang, C. The effects of ad social and personal relevance on consumer ad engagement on social media: The moderating role of platform trust. Comput. Hum. Behav. 2021, 122, 106834. [Google Scholar] [CrossRef]
- Hayes, J.L.; Brinson, N.H.; Bott, G.J.; Moeller, C.M. The Influence of Consumer–Brand Relationship on the Personalized Advertising Privacy Calculus in Social Media. J. Interact. Mark. 2021, 55, 16–30. [Google Scholar] [CrossRef]
- Winter, S.; Maslowska, E.; Vos, A.L. The effects of trait-based personalization in social media advertising. Comput. Hum. Behav. 2021, 114, 106525. [Google Scholar] [CrossRef]
- Kim, H.; Huh, J. Perceived Relevance and Privacy Concern Regarding Online Behavioral Advertising (OBA) and Their Role in Consumer Responses. J. Curr. Issues Res. Advert. 2016, 38, 92–105. [Google Scholar] [CrossRef]
- Nguyen, T.P.A. Storytelling and Visual Art in Advertising an Approach towards Creative and Impactful Advertising Content. 2021. Available online: https://www.theseus.fi/handle/10024/487077 (accessed on 10 May 2021).
- Cox, T.; Park, J.H. Facebook marketing in contemporary orthodontic practice: A consumer report. J. World Fed. Orthod. 2014, 3, e43–e47. [Google Scholar] [CrossRef]
- Chen, J.; Xu, J.; Jiang, G.; Ge, T.; Zhang, Z.; Lian, D.; Zheng, K. Automated Creative Optimization for E-Commerce Advertising. arXiv 2021, arXiv:2103.00436. Available online: https://arxiv.org/abs/2103.00436 (accessed on 12 May 2021).
- West, D.; Koslow, S.; Kilgour, M. Future Directions for Advertising Creativity Research. J. Advert. 2019, 48, 102–114. [Google Scholar] [CrossRef]
- Saura, J.R.; Palacios-Marqués, D.; Iturricha-Fernández, A. Ethical design in social media: Assessing the main performance measurements of user online behavior modification. J. Bus. Res. 2021, 129, 271–281. [Google Scholar] [CrossRef]
- Shanahan, T.; Tran, T.P.; Taylor, E.C. Getting to know you: Social media personalization as a means of enhancing brand loyalty and perceived quality. J. Retail. Consum. Serv. 2019, 47, 57–65. [Google Scholar] [CrossRef]
- Wiese, M.; Martinez-Climent, C.; Botella-Carrubi, D. A framework for Facebook advertising effectiveness: A behavioral perspective. J. Bus. Res. 2020, 109, 76–87. [Google Scholar] [CrossRef]
- Abbafati, C.; Machado, D.B.; Cislaghi, B.; Salman, O.M.; Karanikolos, M.; McKee, M.; Abbas, K.M.; Brady, O.J.; Larson, H.J.; Trias-Llimós, S.; et al. Five insights from the Global Burden of Disease Study 2019. Lancet 2020, 396, 1135–1159. [Google Scholar]
- Pfiffelmann, J.; Dens, N.; Soulez, S. Personalized advertisements with integration of names and photographs: An eye-tracking experiment. J. Bus. Res. 2020, 111, 196–207. [Google Scholar] [CrossRef]
- Voorveld, H.A.M.; van Noort, G.; Muntinga, D.G.; Bronner, F. Engagement with Social Media and Social Media Advertising: The Differentiating Role of Platform Type. J. Advert. 2018, 47, 38–54. [Google Scholar] [CrossRef] [Green Version]
- Haenlein, M.; Anadol, E.; Farnsworth, T.; Hugo, H.; Hunichen, J.; Welte, D. Navigating the New Era of Influencer Marketing: How to be Successful on Instagram, TikTok, & Co. Calif. Manag. Rev. 2020, 63, 5–25. [Google Scholar] [CrossRef]
- Huntinghouse, J.; Franks, E.; Fife, B. Why Facebook Ads keep failing: Lessons learned from spending over US$1m on Facebook Ads|HSTalks. J. Digit. Soc. Media Mark. 2021, 8, 298–307. [Google Scholar]
- Wang, C.C.; Hung, J.C. Comparative analysis of advertising attention to Facebook social network: Evidence from eye-movement data. Comput. Hum. Behav. 2019, 100, 192–208. [Google Scholar] [CrossRef]
- Xie, J.Q.; Rost, D.H.; Wang, F.X.; Wang, J.L.; Monk, R.L. The association between excessive social media use and distraction: An eye movement tracking study. Inf. Manag. 2021, 58, 103415. [Google Scholar] [CrossRef]
- Elias, S.; Massad, R.; Lazarov, A. Visual Attention Patterns of Socially Anxious Individuals When Using Facebook: An Eye Tracking Study. Behav. Ther. 2021, 52, 995–1007. [Google Scholar] [CrossRef]
- Yen, C.; Chiang, M.C. Examining the effect of online advertisement cues on human responses using eye-tracking, EEG, and MRI. Behav. Brain Res. 2021, 402, 113128. [Google Scholar] [CrossRef]
- Li, C. The placebo effect in web-based personalization. Telemat. Inform. 2019, 44, 101267. [Google Scholar] [CrossRef]
- Tran, T.P.; Lin, C.-W.; Baalbaki, S.; Guzmán, F. How personalized advertising affects equity of brands advertised on Facebook? A mediation mechanism. J. Bus. Res. 2020, 120, 1–15. [Google Scholar] [CrossRef]
- Yang, Z.; Kim, S.; Jung, D. How brand authenticity works for brand reputation and brand loyalty?—Focusing on dental clinic’s customer. Information 2016, 19, 5373–5380. [Google Scholar]
- Pearson, A. Personalisation the artificial intelligence way. J. Digit. Soc. Media Mark. 2020, 7, 245–269. [Google Scholar]
- Runge, J.; Geinitz, S.; Ejdemyr, S. Experimentation and performance in advertising: An observational survey of firm practices on Facebook. Expert Syst. Appl. 2020, 158, 113554. [Google Scholar] [CrossRef]
- Schwartz, E.M.; Bradlow, E.T.; Fader, P.S. Customer Acquisition via Display Advertising Using Multi-Armed Bandit Experiments. Mark. Sci. 2017, 36, 500–522. [Google Scholar] [CrossRef]
- Diviani, N.; Meppelink, C.S. The impact of recommendations and warnings on the quality evaluation of health websites: An online experiment. Comput. Hum. Behav. 2017, 71, 122–129. [Google Scholar] [CrossRef]
- Orazi, D.C.; Johnston, A.C. Running field experiments using Facebook split test. J. Bus. Res. 2020, 118, 189–198. [Google Scholar] [CrossRef]
- Fagerstrøm, A.; Arntzen, E.; Volden, M. Motivating Events at the Point of Online Purchase: An Online Business-to-Business Retail Experiment. Procedia Comput. Sci. 2021, 181, 702–708. [Google Scholar] [CrossRef]
- Kohavi, R.; Longbotham, R.; Experiments, O.C. Online Controlled Experiments and A/B Testing. Encycl. Mach. Learn. Data Min. 2017, 7, 922–929. [Google Scholar] [CrossRef]
- Nicola Donovan the Role of Experimentation at Booking.com|Click. Magazine. Available online: https://partner.booking.com/en-gb/click-magazine/role-experimentation-bookingcom (accessed on 7 July 2021).
- Kosinski, M.; Matz, S.C.; Gosling, S.D.; Popov, V.; Stillwell, D. Facebook as a research tool for the social sciences: Opportunities, challenges, ethical considerations, and practical guidelines. Am. Psychol. 2015, 70, 543–556. [Google Scholar] [CrossRef] [PubMed] [Green Version]
- Statista. Number of Monthly Active Facebook Users Worldwide as of 1st Quarter 2021. 2021. Available online: https://bit.ly/3A0ywQB (accessed on 19 June 2021).
- Saroj, A.; Pal, S. Use of social media in crisis management: A survey. Int. J. Disaster Risk Reduct. 2020, 48, 101584. [Google Scholar] [CrossRef]
- Cook, S.K.; Jerome, R.N.; Dunagan, J.; Kennedy, N.; Edwards, T.; Minnix, J.A.; Witmer, L.; Ferguson, J.; Cinciripini, P.; Wilkins, C.; et al. Engaging smokers in research: Utility of Facebook in facilitating recruitment to a smoking cessation study. Contemp. Clin. Trials 2021, 107, 106461. [Google Scholar] [CrossRef]
- Ju, R.; Dong, C.; Zhang, Y. How controversial businesses communicate CSR on Facebook: Insights from the Canadian cannabis industry. Public Relat. Rev. 2021, 47, 102059. [Google Scholar] [CrossRef]
- Shahbaznezhad, H.; Dolan, R.; Rashidirad, M. The Role of Social Media Content Format and Platform in Users’ Engagement Behavior. J. Interact. Mark. 2021, 53, 47–65. [Google Scholar] [CrossRef]
- Lynch, J.G. Theory and external validity. J. Acad. Mark. Sci. 1999, 27, 367–376. [Google Scholar] [CrossRef] [Green Version]
- Steckler, A.; McLeroy, K.R. The importance of external validity. Am. J. Public Health 2008, 98, 9–10. [Google Scholar] [CrossRef]
- Bracht, G.H.; Glass, G.V. The External Validity of Experiments. Am. Educ. Res. J. 1968, 5, 437–474. [Google Scholar] [CrossRef]
- Calder, B.J.; Phillips, L.W.; Tybout, A.M. The Concept of External Validity. J. Consum. Res. 1982, 9, 240. [Google Scholar] [CrossRef]
- Green, L.W. Evaluation and measurement: Some dilemmas for health education. Am. J. Public Health 1977, 67, 155–161. [Google Scholar] [CrossRef]
- Facebook Despre Testarea A/B|Centrul de Ajutor Pentru Facebook Business. Available online: https://www.facebook.com/business/help/1738164643098669?id=445653312788501 (accessed on 9 July 2021).
- Sketchdeck We Tested 48 Facebook Ads to Bust 6 Marketing Myths. Available online: https://www.sketchdeck.com/blog/we-tested-48-facebook-ads-to-bust-6-marketing-myths (accessed on 9 July 2021).
- Dommett, K.; Power, S. The political economy of facebook advertising: Election spending, regulation and targeting online. Polit. Q. 2019, 90, 257–265. [Google Scholar] [CrossRef] [Green Version]
- Fabijan, A.; Dmitriev, P.; McFarland, C.; Vermeer, L.; Holmström Olsson, H.; Bosch, J. Experimentation growth: Evolving trustworthy A/B testing capabilities in online software companies. J. Softw. Evol. Process 2018, 30, e2113. [Google Scholar] [CrossRef]
- Jansen, B.J.; Schuster, S. Bidding on the buying funnel for sponsored search and keyword advertising. J. Electron. Commer. Res. 2011, 12, 1–18. [Google Scholar]
- SocSciStatistics Chi Square Calculator. Available online: https://www.socscistatistics.com/tests/chisquare/default2.aspx (accessed on 25 June 2021).
| # [Participant No *] | [Timestamp ms] | [Gaze x%] | [Gaze y%] |
|---|---|---|---|
| 0 | 0 | 0.605 | 0.616 |
| 0 | 0 | 0.608 | 0.613 |
| 0 | 34 | 0.609 | 0.617 |
| 0 | 58 | 0.612 | 0.616 |
| 0 | 108 | 0.613 | 0.614 |
| … | … | … | … |
| 7 | 0 | 0.482 | 0.502 |
| 7 | 0 | 0.475 | 0.503 |
| 7 | 98 | 0.471 | 0.511 |
| … | … | … | … |
| 15 | 0 | 0.437 | 0.252 |
| … | … | … | … |
| 29 | 9939 | 0.423 | 0.21 |
| Performance Metrics/Campaign | Cost per 1000 People Reached | Reach | Impressions |
|---|---|---|---|
| Image A (mouth details ad) | $ xx.03 | 3979 | 6876 |
| Image B (woman smiling ad) | $ xx.76 | 2931 | 6098 |
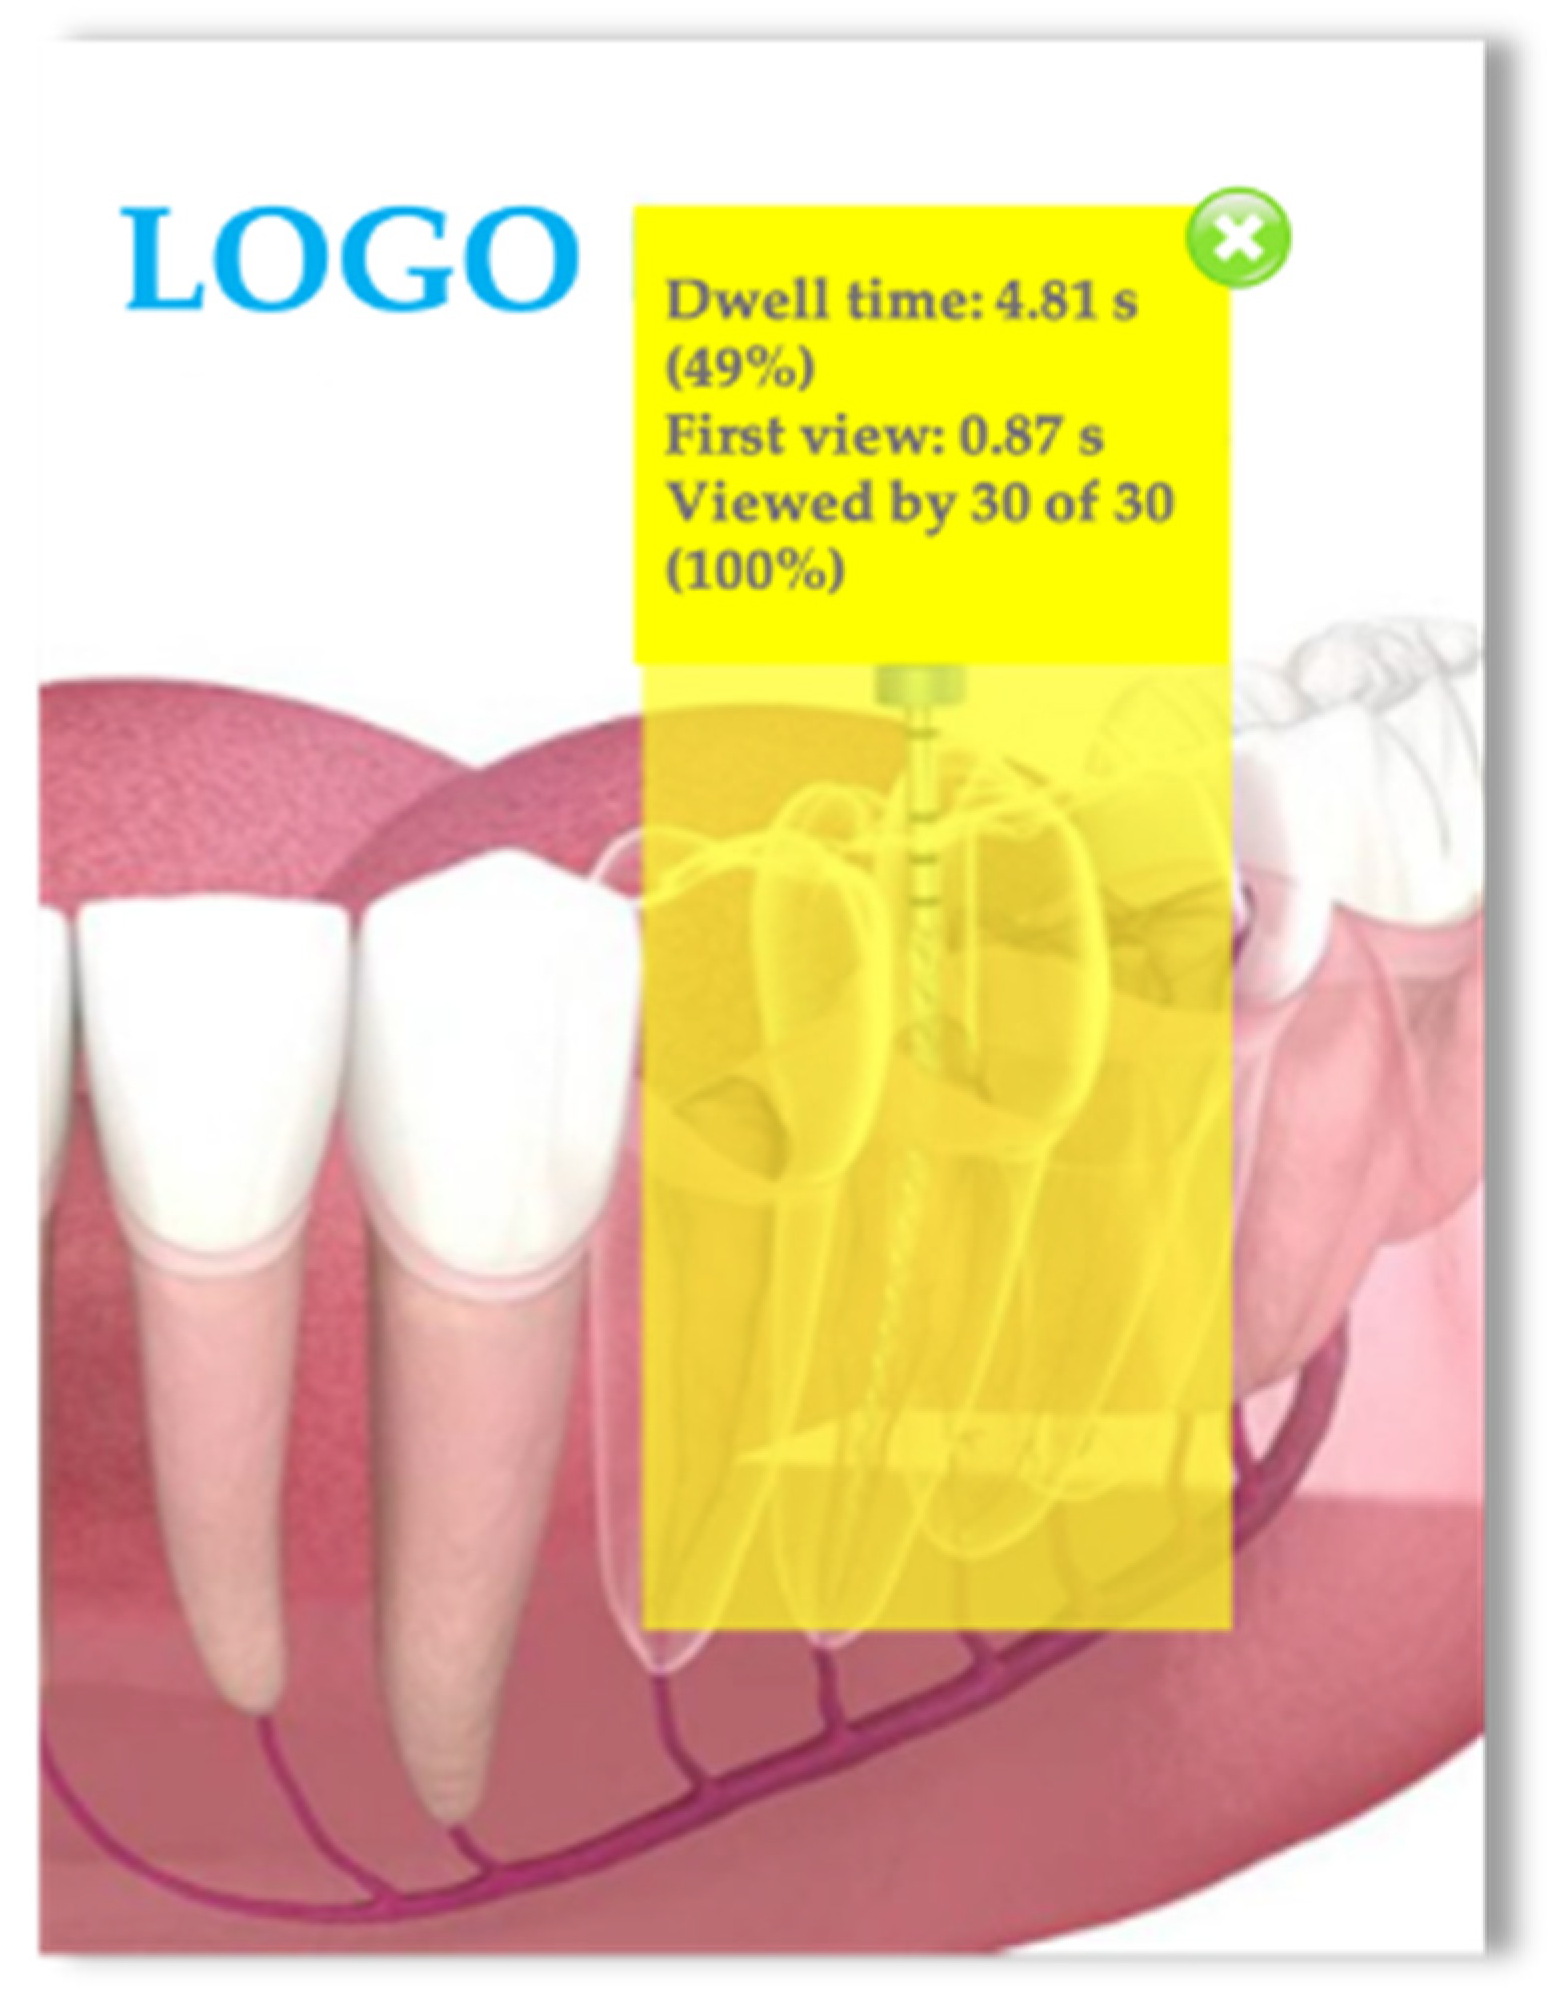
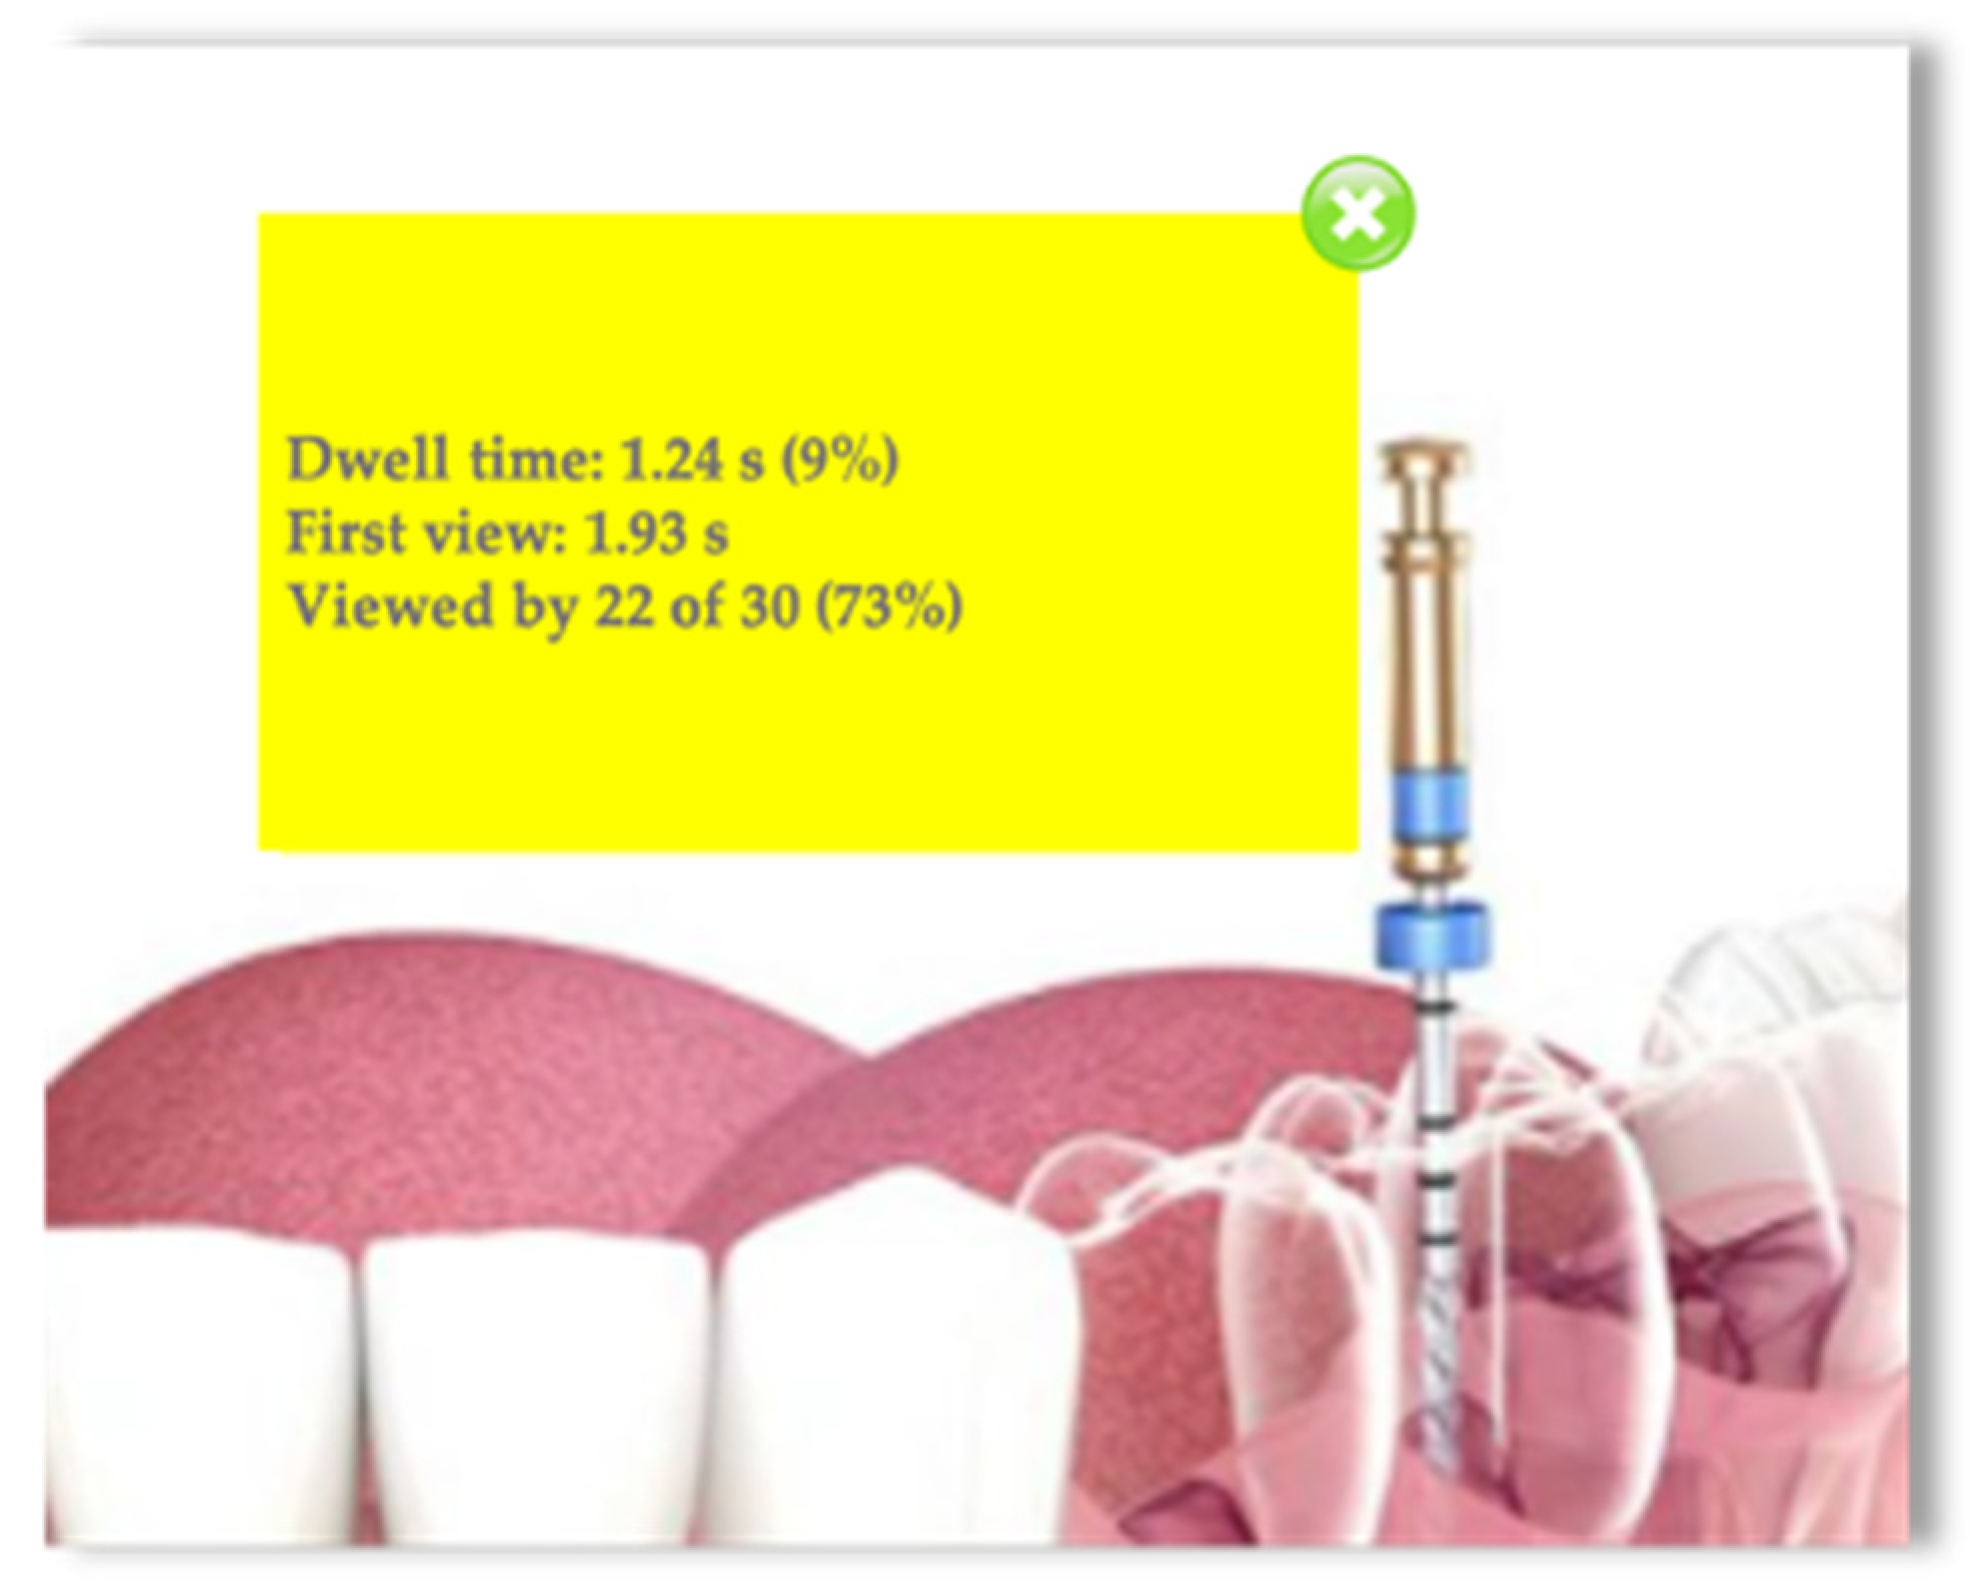
| Image A, Area 1 | Image A, Area 2 | |||||
|---|---|---|---|---|---|---|
| Global | Women | Men | Global | Women | Men | |
| Dwell time | 4.81 s | 4.55 s | 5.09 s | 1.24 s | 1.06 s | 1.42 s |
| First view | 0.87 s | 1.18 s | 0.52 s | 1.93 s | 2.29 | 1.57 s |
| Viewed by | 100% | 100% | 100% | 73% | 83% | 63% |
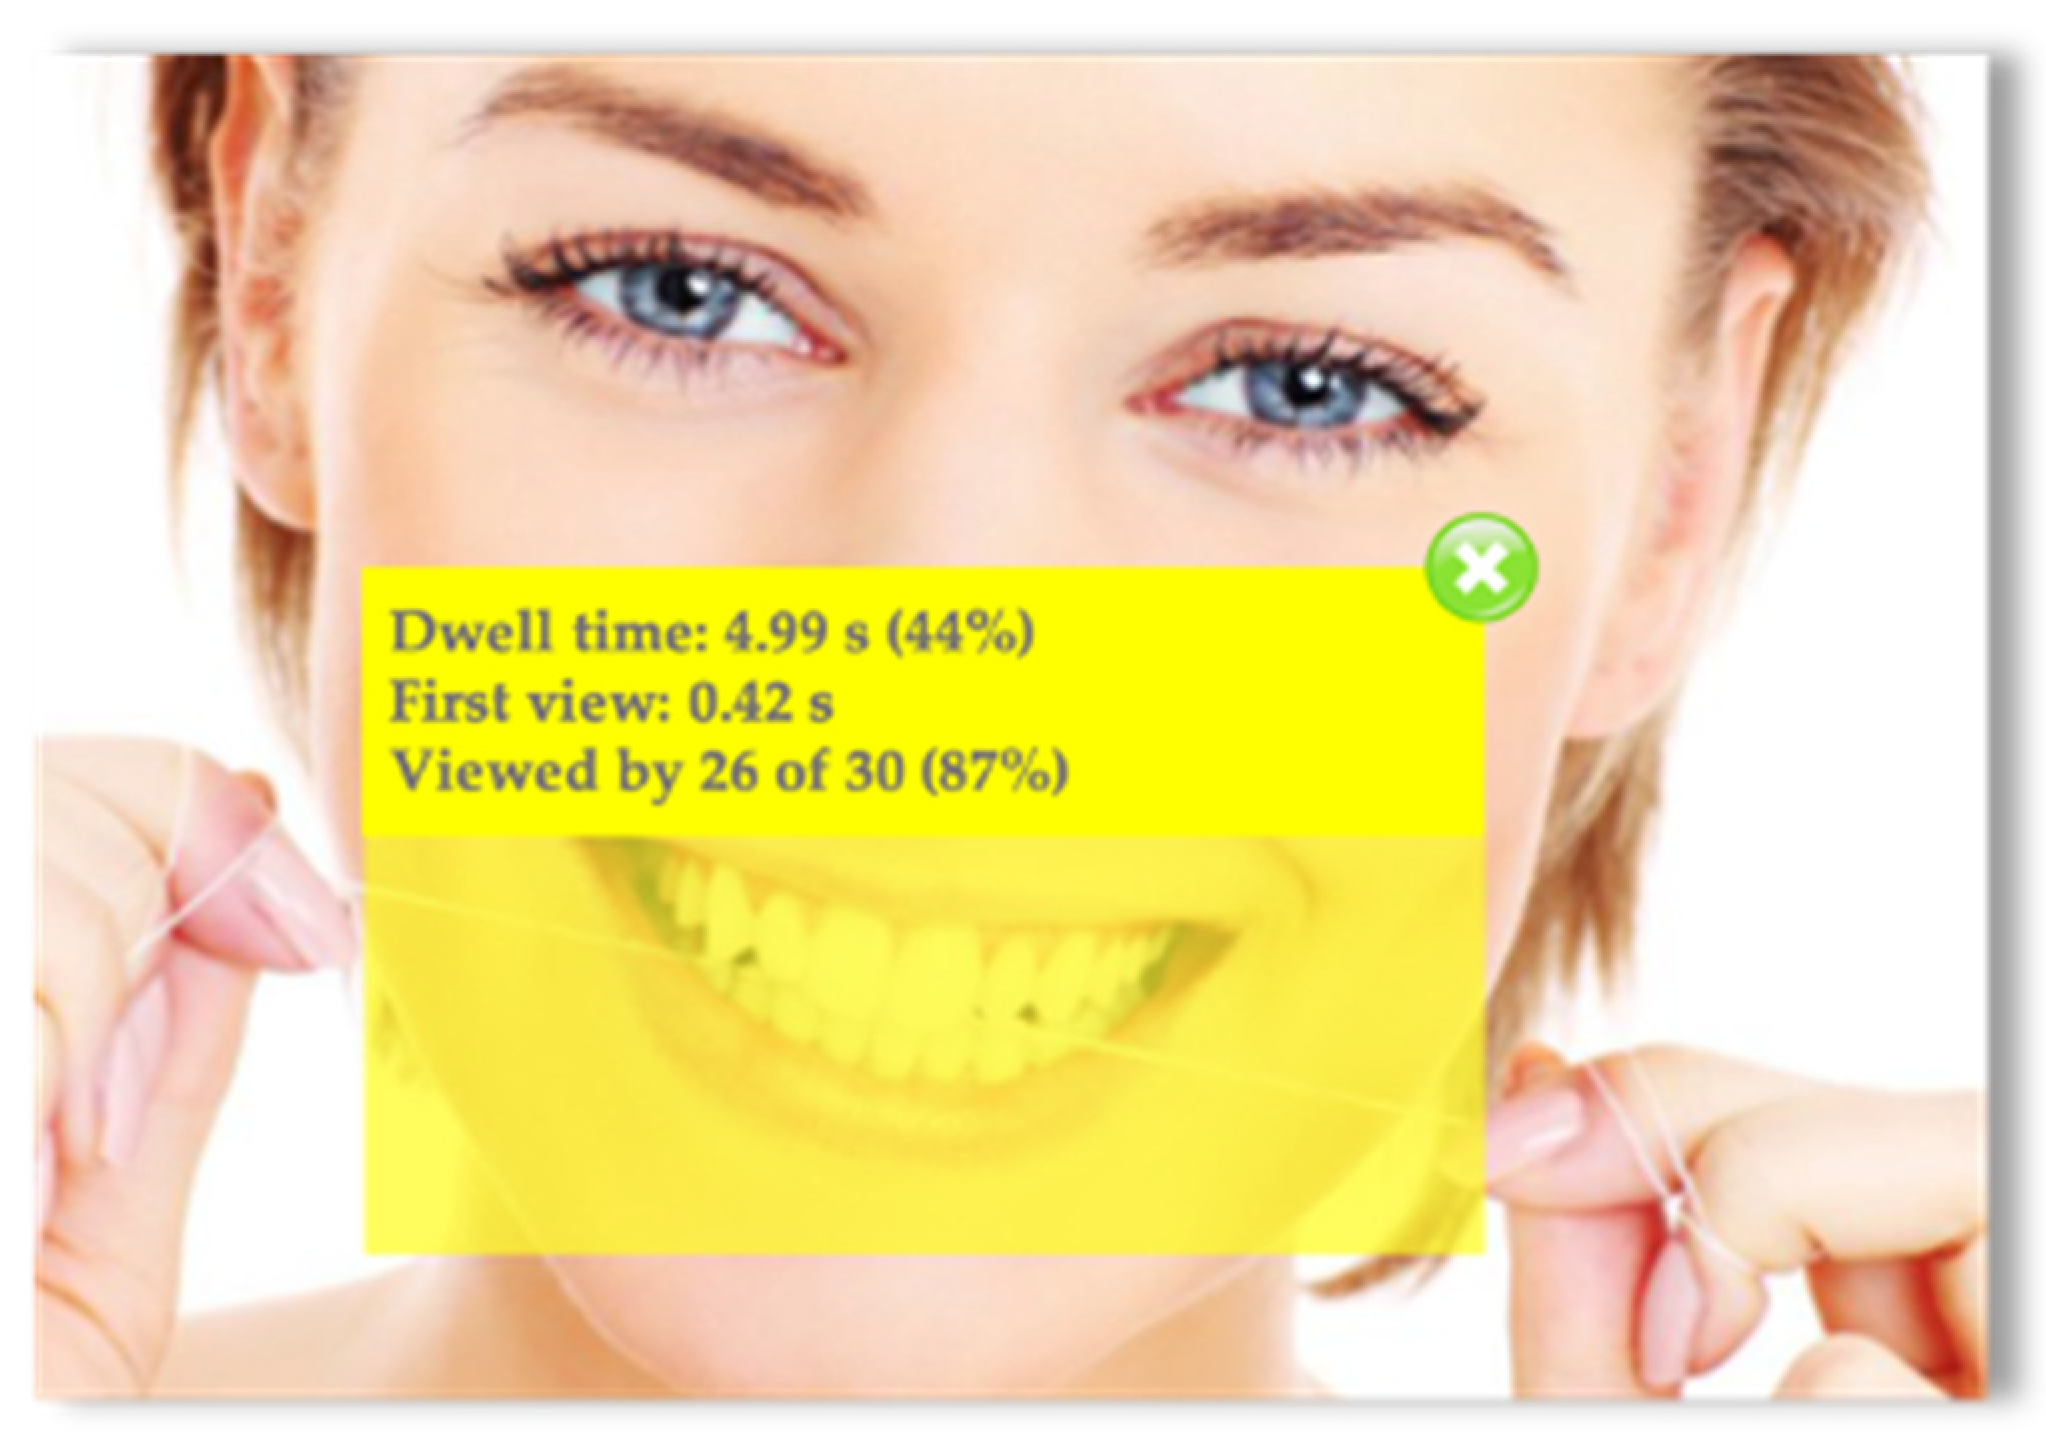
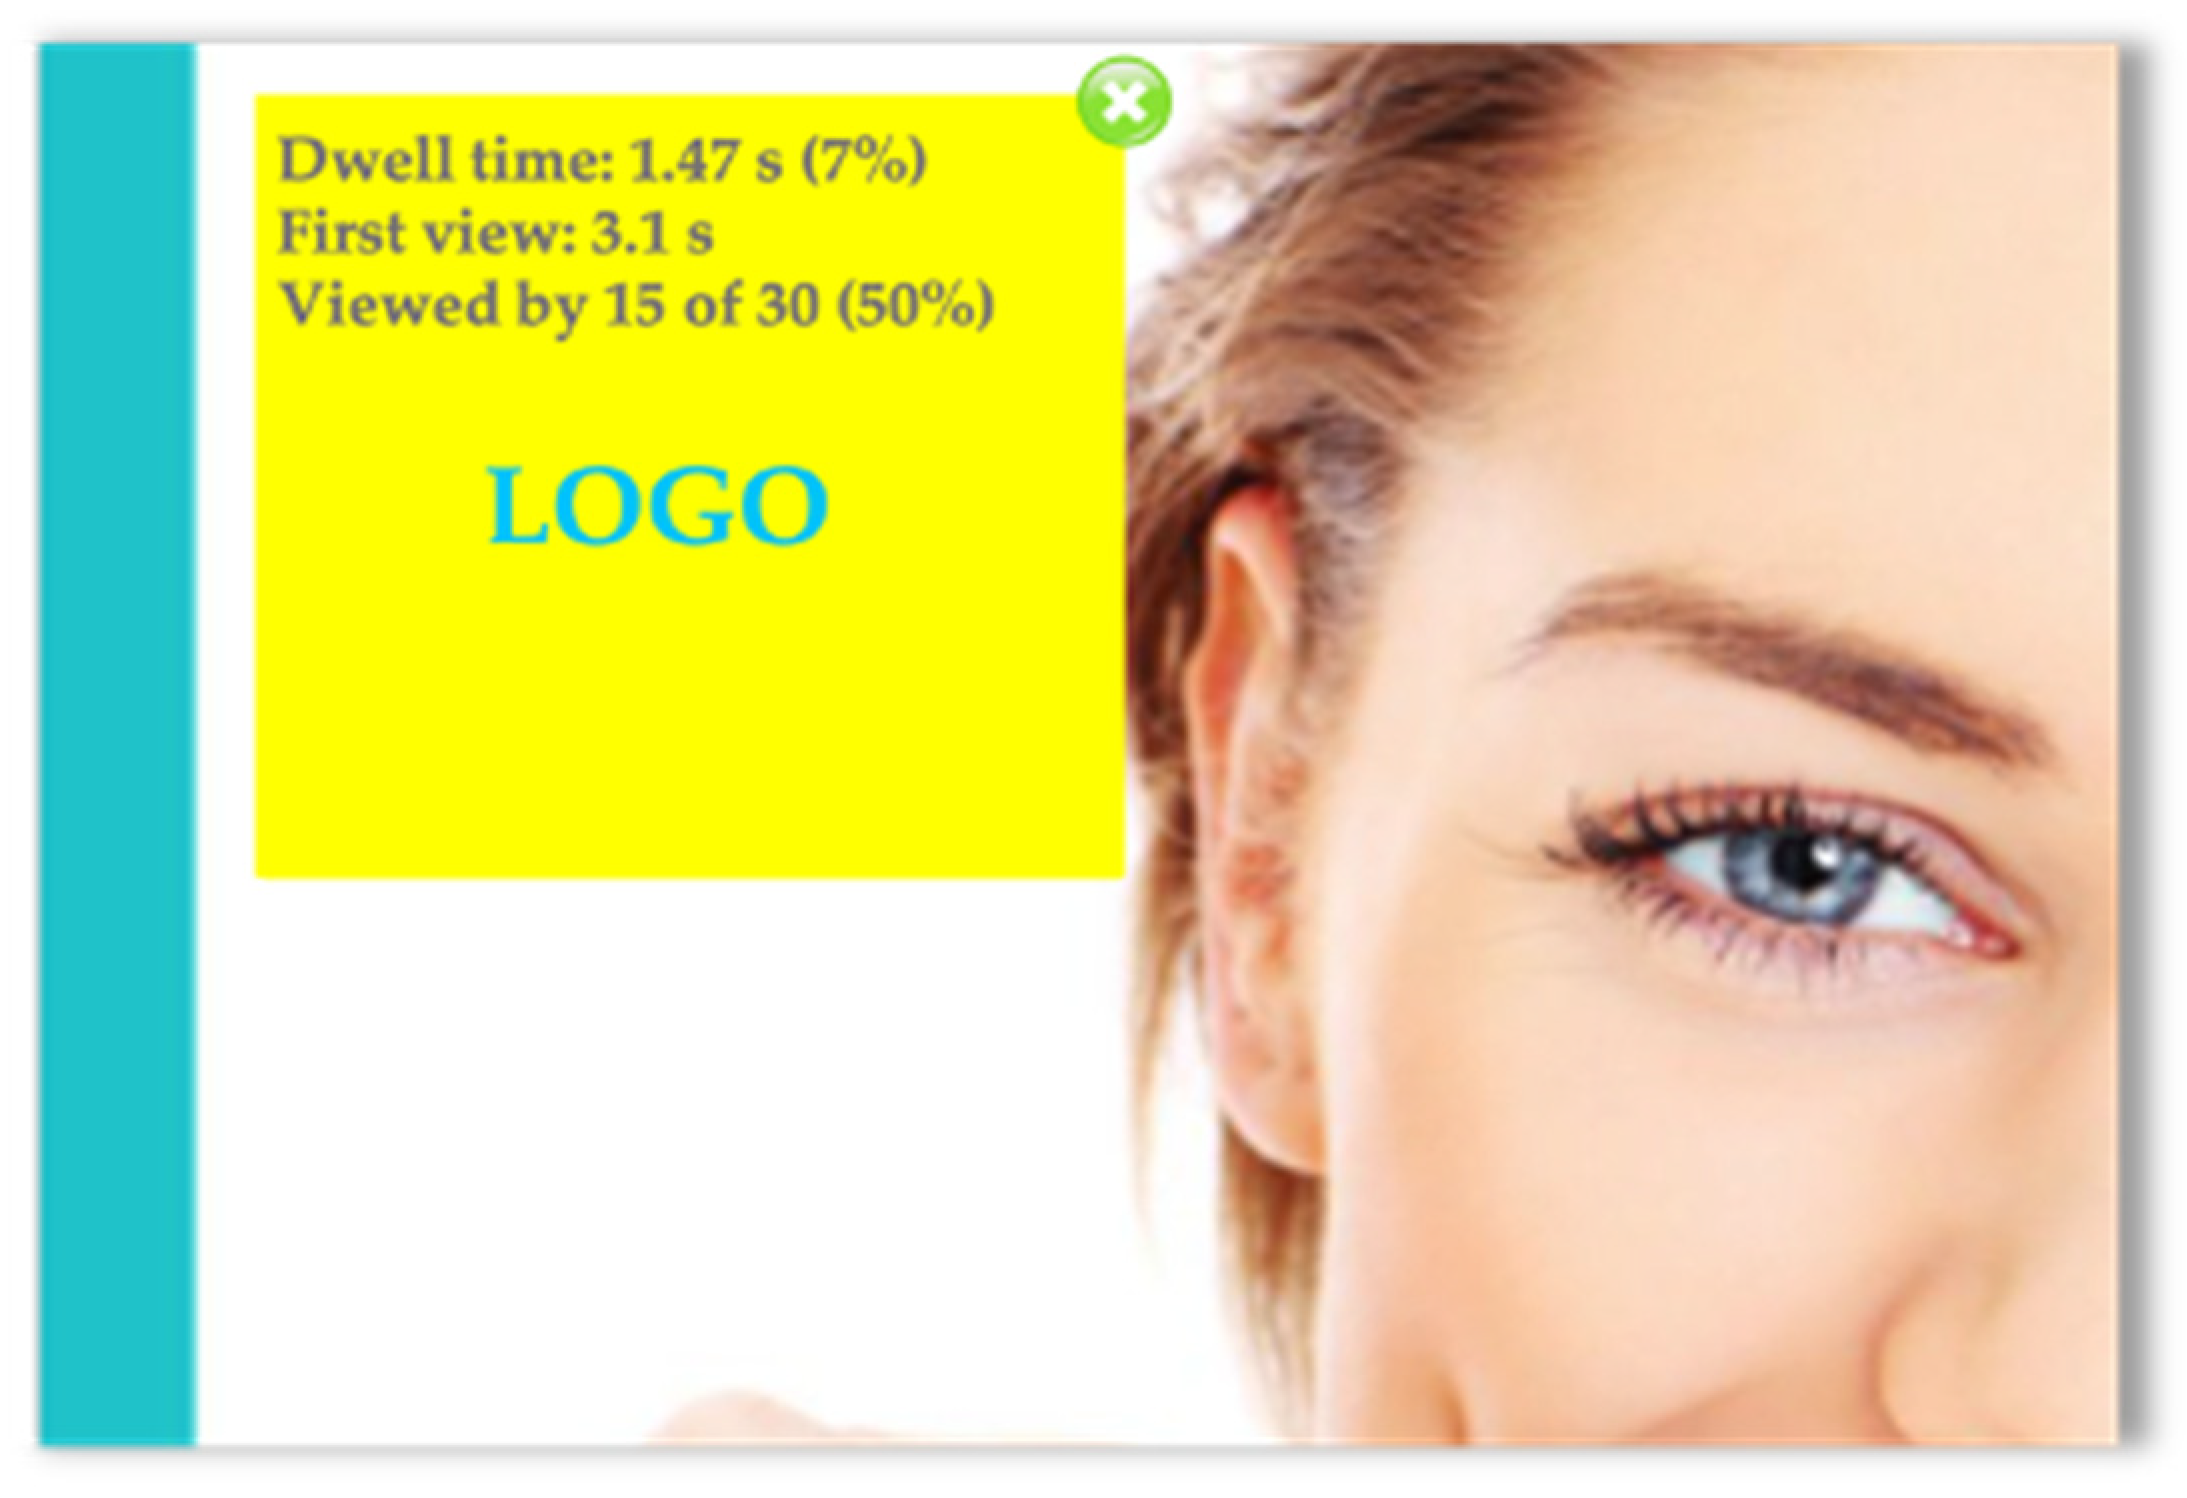
| Image B, Area 1 | Image B, Area 2 | |||||
|---|---|---|---|---|---|---|
| Global | Women | Men | Global | Women | Men | |
| Dwell time | 4.99 s | 4.85 s | 5.13 s | 2.47 s | 1.91 | 3.03 s |
| First view | 0.42 s | 0.49 s | 0.35 s | 3.1 s | 2.63 | 3.57 s |
| Viewed by | 87% | 93% | 81% | 50% | 64% | 36% |
| Image A, Area 1 | Image A, Area 2 | |||||
|---|---|---|---|---|---|---|
| Global | 18–30 Years | Over 60 Years | Global | 18–30 Years | Over 60 Years | |
| Dwell time | 4.81 | 3.76 s | 5.2 s | 7.64 s | 1.24 s | 1.09 s |
| First view | 0.87 s | 0.92 s | 0.83 s | 0.8 s | 1.93 s | 1.26 s |
| Viewed by | 100% | 100% | 100% | 100% | 73% | 80% |
| Image B, Area 1 | Image B, Area 2 | |||||
|---|---|---|---|---|---|---|
| Global | 18–30 Years | Over 60 Years | Global | 18–30 Years | Over 60 Years | |
| Dwell time | 4.99 s | 4.85 s | 3.53 | 6.59 s | 1.47 s | 0.46 s |
| First view | 0.42 s | 0.51 s | 0.15 | 0.6 s | 3.1 s | 2.42 s |
| Viewed by | 87% | 87% | 74% | 100% | 50% | 60% |
Publisher’s Note: MDPI stays neutral with regard to jurisdictional claims in published maps and institutional affiliations. |
© 2021 by the authors. Licensee MDPI, Basel, Switzerland. This article is an open access article distributed under the terms and conditions of the Creative Commons Attribution (CC BY) license (https://creativecommons.org/licenses/by/4.0/).
Share and Cite
Nichifor, E.; Lixăndroiu, R.C.; Chițu, I.B.; Brătucu, G.; Sumedrea, S.; Maican, C.I.; Tecău, A.S. Eye Tracking and an A/B Split Test for Social Media Marketing Optimisation: The Connection between the User Profile and Ad Creative Components. J. Theor. Appl. Electron. Commer. Res. 2021, 16, 2319-2340. https://doi.org/10.3390/jtaer16060128
Nichifor E, Lixăndroiu RC, Chițu IB, Brătucu G, Sumedrea S, Maican CI, Tecău AS. Eye Tracking and an A/B Split Test for Social Media Marketing Optimisation: The Connection between the User Profile and Ad Creative Components. Journal of Theoretical and Applied Electronic Commerce Research. 2021; 16(6):2319-2340. https://doi.org/10.3390/jtaer16060128
Chicago/Turabian StyleNichifor, Eliza, Radu Constantin Lixăndroiu, Ioana Bianca Chițu, Gabriel Brătucu, Silvia Sumedrea, Cătălin Ioan Maican, and Alina Simona Tecău. 2021. "Eye Tracking and an A/B Split Test for Social Media Marketing Optimisation: The Connection between the User Profile and Ad Creative Components" Journal of Theoretical and Applied Electronic Commerce Research 16, no. 6: 2319-2340. https://doi.org/10.3390/jtaer16060128
APA StyleNichifor, E., Lixăndroiu, R. C., Chițu, I. B., Brătucu, G., Sumedrea, S., Maican, C. I., & Tecău, A. S. (2021). Eye Tracking and an A/B Split Test for Social Media Marketing Optimisation: The Connection between the User Profile and Ad Creative Components. Journal of Theoretical and Applied Electronic Commerce Research, 16(6), 2319-2340. https://doi.org/10.3390/jtaer16060128