1. Introduction
Technology evaluation/forecasting on different levels—organizational, personal, technical, and market—constitutes an important component of technology management. It introduces diverse methods and tools in tandem to assess the added value of a given technology [
1] to support the business model of a company. Whereas investment decisions in both evolving and breakthrough technologies are guided by regulations, norms, and culture, Gastaldi et al. argue that that predominant role in this regard is played by rational, individual-level decision-making and its interplay with organizational expectations [
2]. Our article focuses on evaluating one of the crucial enabling technologies for the contemporary digital world—networking hardware. It constitutes the fundamental component of networking infrastructure within a company and provides a backbone for, among others, e-commerce solutions, Enterprise Systems, as well as Internet of Things (IoT) applications. Whereas in small office/home office business settings networking technologies of relatively low performance and level of sophistication are generally applied in order to minimize costs, quality-related requirements tend to increase considerably along with the size of a company. The most demanding customers include Internet Service Providers and large companies that provide digital services on a large scale. Since modern solutions of global reach more and more often employ real-time exchange of considerable volumes of data over a global network infrastructure, high-performance and ultra-reliable networking devices constitute an indispensable factor. On top of that, innovation often proves difficult to interpret by incumbent firms; this is especially valid in the realm of digital technologies, where product lifecycles are shorter, and continuous innovation is paramount and driven by customer needs [
3].
The goal of this research is to deliver a reference model for supporting future decisions regarding the further short- and long-term utilization or replacement of Cisco switches. The acceptance of networking devices procured by end-users for professional purposes is not indifferent to the productivity and quality of their work—and thus, the condition of the organization that employs them. It affects not only the level of satisfaction of consumers of a given technology but also decision-making processes, long-term development activities, and potential market advantages of providers of such solutions. Potential lack of acceptance for particular hardware classes results in discontinuation of usage and seeking of alternatives. Such a situation negatively impacts vendors’ market shares. This is one of the reasons why technology acceptance research has taken permanent root, especially in countries with high levels of information technology sophistication. The study was driven by a single research question:
RQ1: What factors influence the level of Cisco switches acceptance among network administrators in business environments?
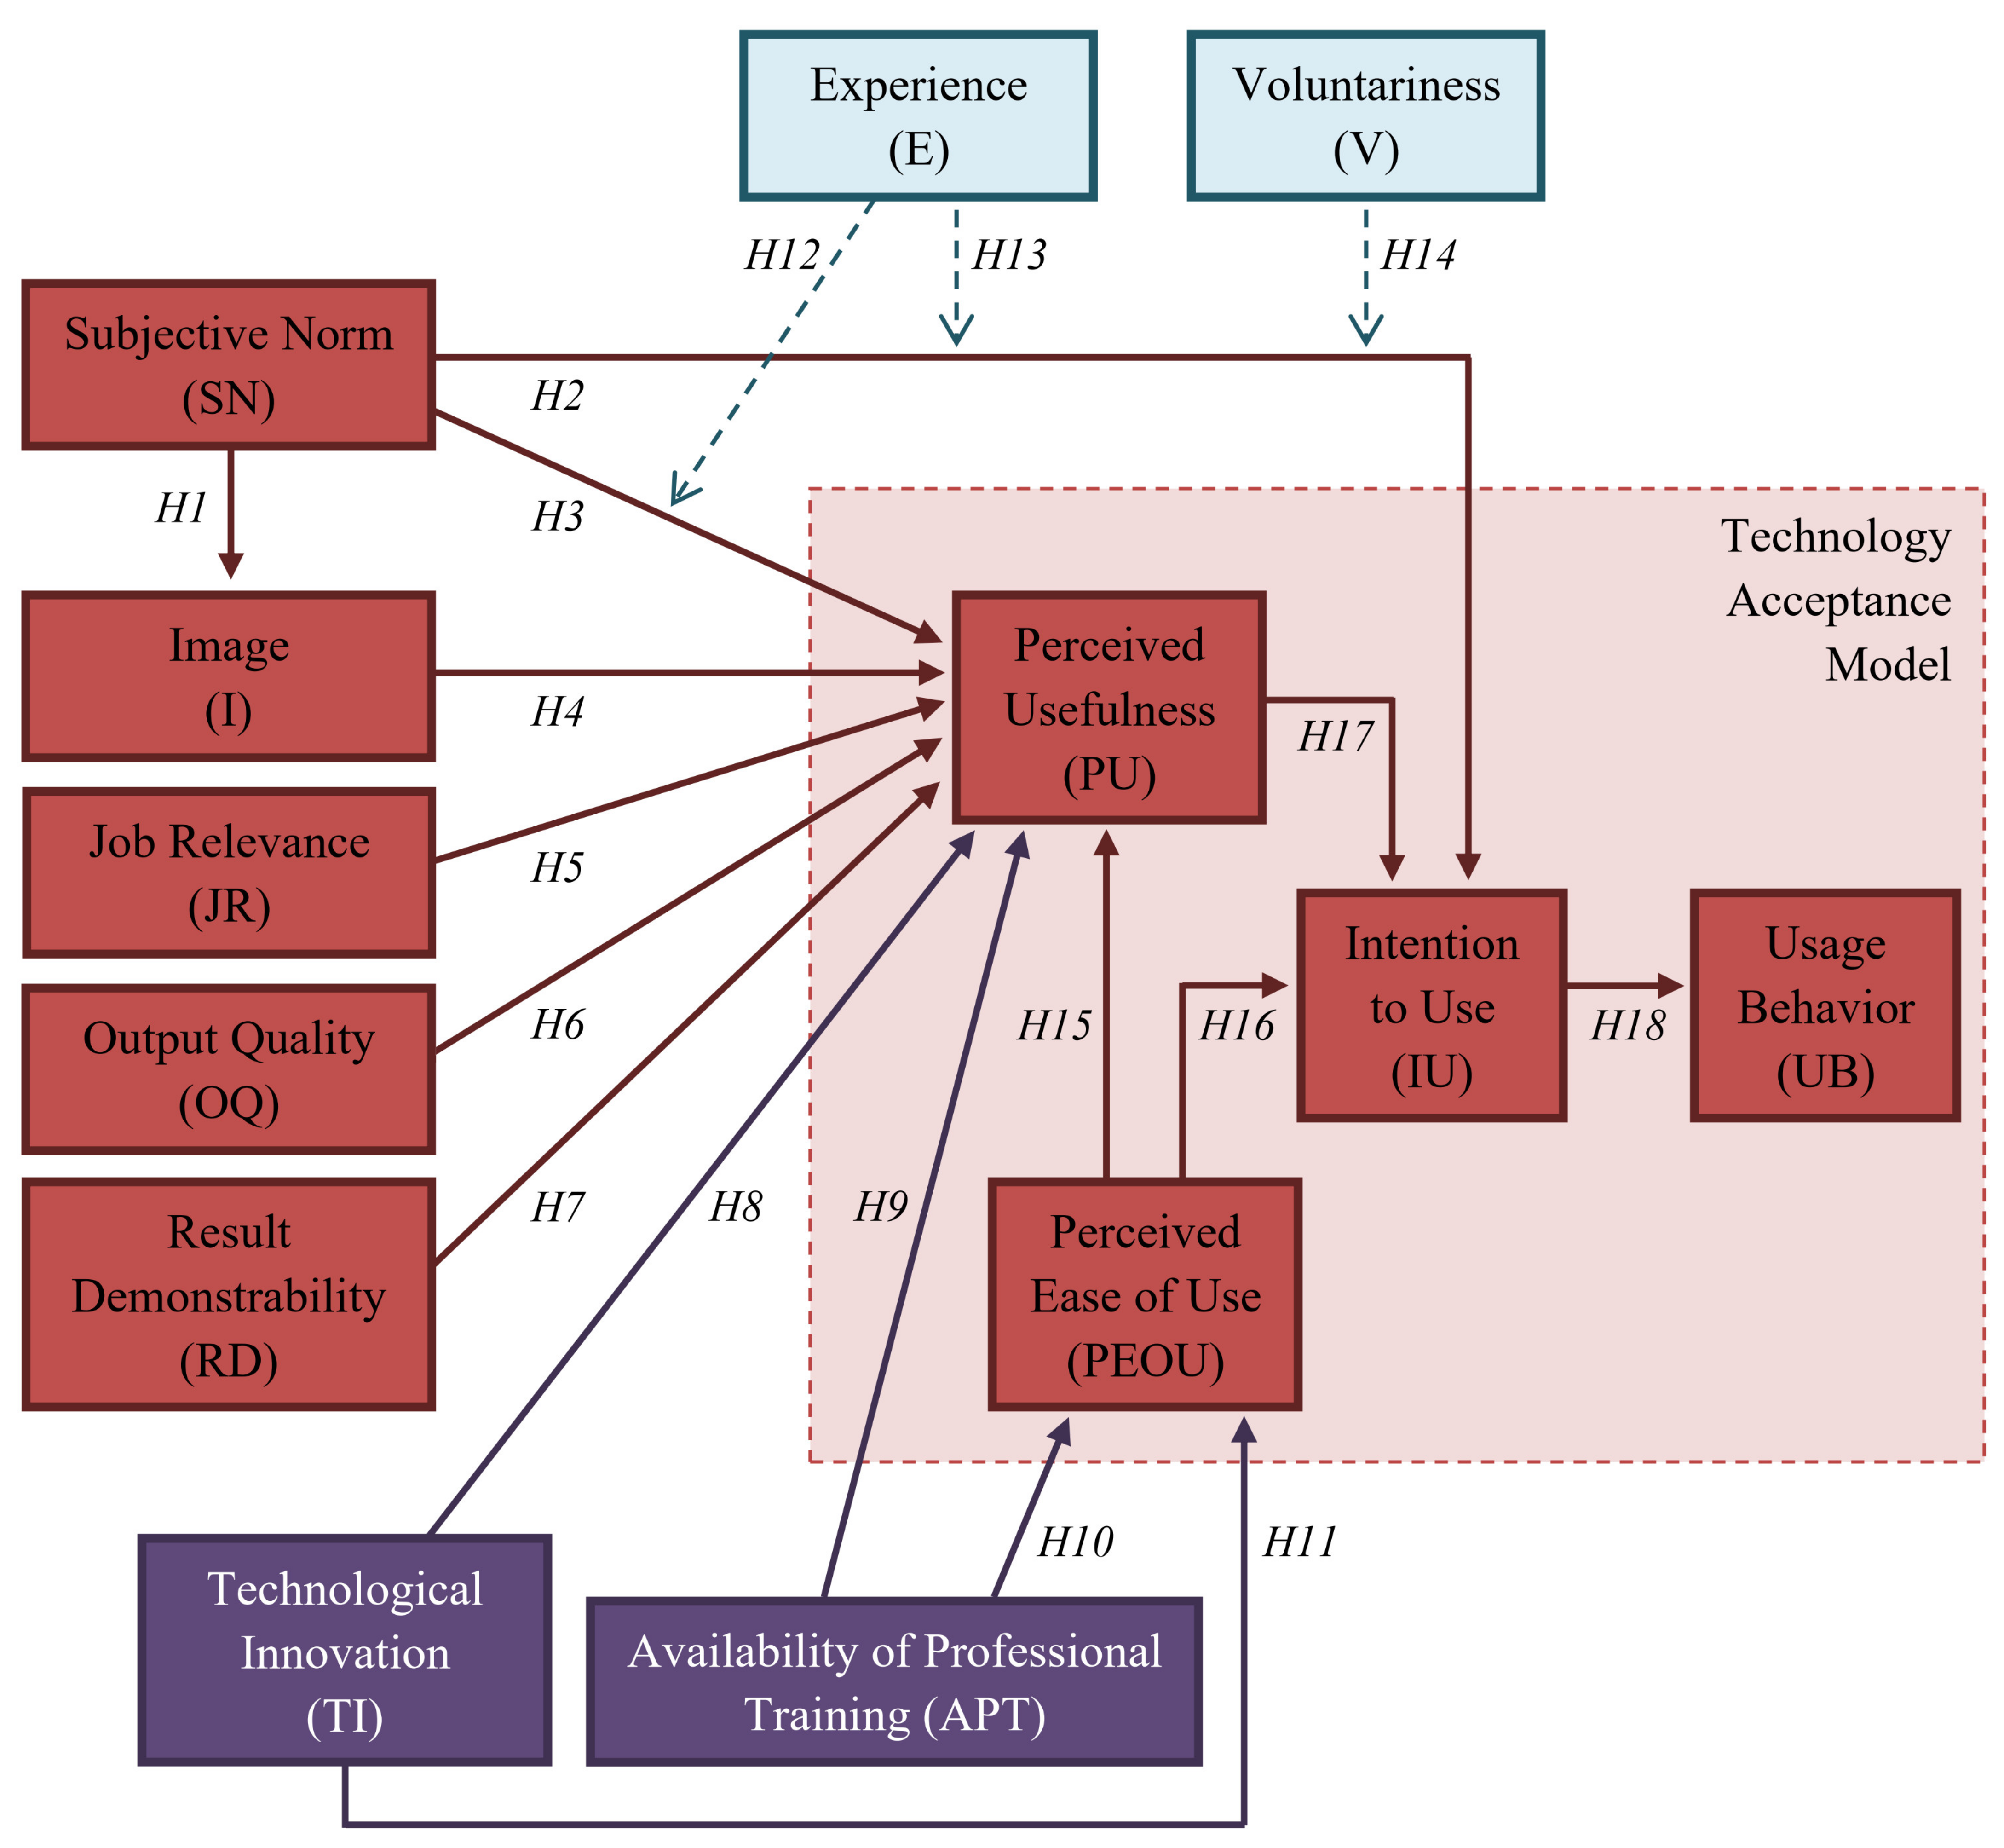
In order to address this research question, the authors opted for grounding the empirical study on a substantively selected and self-expanded technology acceptance theory, namely, Technology Acceptance Model (TAM) 2. Acceptance theories proved to be useful tools in evaluating certain aspects of diverse technologies. Such artifacts—interdisciplinary in nature—enable the levels of user approval to be assessed through direct measurement of the intention to use the information technologies as well as the software under research. To achieve this, the influence of versatile factors on the selected technologies’ usage is taken into account. TAM2 theorizes that (1) end-users perceptions are susceptible to credible social pressure and perceived status regardless of whether a given technology is mandated by a company or not; (2) professionals weigh what deliverables a given technology can in fact provide; (3) how well can it deliver those; (4) to what extent deliverables match their goals at workplaces; (5) how all that translates to both perceived usefulness and user-friendliness—and ultimately specific behavior [
4]. Therefore, it facilitated investigating the phenomenon from different viewpoints, considering both social influence and cognitive instrumental processes [
5].
Since technology acceptance may be considered a well-established concept, several research domains are covered by studies: e-commerce, green technologies, social networking, project success, e-learning, or healthcare, to mention just some of them. That said, Venkatesh and Davis highlight that scrutinizing support for given information technologies in business is often elusive and intricate [
4]. Therefore, researchers and practitioners do not confine themselves to using generic acceptance models only to investigate different phenomena and provide added value to established theories in domain-specific research. Analysis of related works clearly shows that networking hardware acceptance driven by business decision-making places itself outside the scope of subjects popular among acceptance researchers. Therefore, we reckon a scarcity regarding the acceptance of networking hardware exists within the body-of-knowledge, thus constituting a research gap to be explored. The long-lasting successful cooperation of the authors with both network solutions’ designers and administrators brought attention to the complexity of the subject regarding the intention to use networking equipment in a company and usage determinants itself. Several factors are advertised by manufacturers as having an influence on the process of proper networking device selection for a company—such as functionality, reliability, efficiency, compatibility with other networking devices, or power saving. By verifying those claims and filling the research gap, practitioners have been equipped with a tool to support decision-making processes in network equipment purchasing policy and training policy planning.
After the Introduction, related research is discussed. Then, the research design is introduced: the method used, the rationale behind selecting the TAM2 model as the basis for our research, the enhancements proposed, as well as the research hypotheses. Subsequently, the results of the study are presented, followed by their discussion. Finally, the implications and limitations of the study are outlined.
2. Related Research
Theories for the acceptance and use of technologies provide invaluable background for explaining technological successes [
6]. That said, while the networking topic is covered by over 2,409,800 Web of Science Core Collection contributions by mid-February 2021, cross-checking those contributions with such technology acceptance models as UTAUT, TAM2, and TAM3 generates only 156 results. Studies undertaken within networking in a broad sense tend to cover mobile technologies, e-commerce, and technology-augmented learning.
As the studies targeting the propagation of mobile technologies across different domains are concerned, understanding the reasons why companies adopt mobile technologies is the research goal of Leclercq. An 80-participant study is performed to address the research question and analyze how these mobile technologies are appropriated by individuals in order for the company to fully benefit from the mobile technology implementation [
7]. Chyou et al. investigate the usage factors of QR codes related to the dominance of smartphones [
8]. A 123-participant study revealed that a consumer’s utilitarian value and hedonic value of a mobile information service are strongly correlated [
9]. The use of mobile technologies in the tourism sector was investigated using the modified version of the TAM model—called Corporate Adoption of M-technology—and it was shown that more commitment from employees may be gained when the reduction in privacy is presented as a benefit of flexible working [
10]. In turn, Zhang et al. studied the perceptions of 91 Canadian nurses who used personal digital assistants for a single month in their daily activities, reporting that respondents’ perception of usefulness is the main factor behind the adoption of mobile technology, having subjective norm and image within the organization as significant antecedents [
11]. On the other hand, the assessment of mobile technologies acceptance in stock exchange using the TAM model is accomplished by Yaseen and Zayed [
12].
E-commerce adoption is explored from different angles. To begin with, it is the subject of study, which reveals that most of the 524 companies being investigated were either at the first or second stage on the e-commerce 5-stage adoption ladder [
13]. The author of the study applied the acceptance model comprising 8 internal and 6 external factors. A high-level view of ICT at the company level within developing economies is provided by Arslan et al. [
14]. Through a 2591-firm Partial Least Squares study they conclude that organizational factors play a greater role in firm-level ICT use than perception-based external barriers, with the company size playing a crucial factor in its decision to use a website. On top of that, companies that have internationally recognized quality certification tend to use websites more to communicate with suppliers and customers in developing economies, whereas a firm’s leadership experience within the respective sectors does not have any statistical association with ICT use. Studies that explore e-commerce often overlap with assessing the potential of mobile technologies. The expanded TAM model is used in a study featuring 164 respondents to identify the determinants of utilitarian value in smartphone-based mobile commerce [
15]. Complimentary research, which scrutinizes the determinants that affect the potential adoption of mobile payment services in Taiwan, hints at a risk-averse bearing of the young generation and the authoritative role of celebrities and colleagues in breaking this barrier [
16]. Zhao and Xi, after investigating the TAM model structure, attempt to use perceived value theory to recognize factors from the service model aspect to well interpret user behavior in the adoption of Third-Party Mobile Payment service [
17]. Thusi and Maduku [
18] as well as Ardiansah et al. [
19] turn the audience’s attention towards an issue that proves of vital importance when discussing enabling technologies for e-commerce, i.e., security. Subjective perception of risk in using mobile banking solutions was reported to have a strong negative effect on South African millennials’ intention to begin using mobile banking applications, effectively turning out to be a significant barrier for their providers [
18]. In a similar fashion, the management of e-commerce ventures and developers of solutions that support them have no other way than to take into account both privacy and security, as [
19] clearly confirmed that purchase intention was directly and strongly influenced by the e-payments security.
Acceptance of enabling technologies tends to be also verified intensively in the context of teaching. Again, this typically involves mobile technologies. Sánchez-Prieto et al. target TAM variables pool to investigate their utility in predicting how keen the pre-service teachers are to take advantage of mobile technologies during the initial years of their academic training [
20]. The authors make a case for shifting some focus away from perceived usefulness and perceived ease of use in such a setting. Instead of those widely acknowledged variables, perceived enjoyment, as well as compatibility with practices in place, turn out to play the essential role. In turn, Kuciapski investigates mobile technologies acceptance with respect to knowledge transfer by employees [
21]. The survey, conducted among 371 employees who knew how to use mobile devices, applications, and services, introduced relative usability and user autonomy that proved to have a higher total impact on the intention to use mobile technologies for knowledge transfer than generic Unified Theory of Acceptance and Use of Technology variables. The study laid the foundation for elaborating a theoretical framework for transferring knowledge by the means of mobile technologies that juxtaposes the impact of a wide range of external and internal usability determinants [
22]. Stal and Paliwoda-Pękosz approach the acceptance of mobile technologies as a medium for transferring knowledge from a different perspective, scrutinizing factors of a technical nature. They put access to information (i.e., the ability to access resources in the context of cellular coverage, its parameters, and costs), information quality (i.e., the extent of adapting the content being presented to the specifics of mobile devices), as well as information navigation (i.e., content navigability-related features) to work [
23]. As a result, they found the TAM highly useful in explaining intention to use mobile technologies, yet shed doubt on access to mobile information having a positive impact on the perceived usability of such technologies. The research conducted in this domain, however, is not limited to the technological aspect of knowledge transfer. The introduction of new IT solutions in a company is routinely met with resistance from employees. In this context, pinpointing motivation to learn as an important factor that supports individual propensity to adopt a particular technology seems essential [
24]; companies are expected to provide future users with the benefits of technologies being introduced in order to inspire such motivation. Vanduhe et al., upon building a model that goes beyond TAM thanks to incorporating social motivation and task technology fit, hint at considering gamification as a method to stimulate motivation within professional training [
25].
When discussing high-tech business and the acceptance of its products, one simply cannot ignore the aspect of innovation. Yuen et al. put innovation diffusion theory to work in tandem with the TAM model to investigate in what way the perceived characteristics of innovation may influence novel technologies [
26]. Ullah et al. introduce the integrated construct of innovativeness alongside cost-saving while scrutinizing the acceptance of such technologies in the context of energy management in developing countries [
27]. The authors suggest that innovativeness impacts the perceived ease of use way stronger than the perceived usefulness. As product-related innovativeness is not only integral to the performance of a company [
28] but also reported to be among the factors that have a significant impact on its level of internationalization [
29], it found its way into business maturity assessment. For instance, Aguiar et al. used the Design Science Research method to set up a staged digital transformation capability maturity model that may be taken advantage of to guide managers in enhancing the IT capability of their companies [
30].
More strictly technology-focused studies include contributions by Saprikis et al. [
31], Wild et al. [
32], Putri and Sucahyo [
33], Pankowska et al. [
34], Alkawsi et al. [
35], as well as Macik [
36]. As far as the former is concerned, the most significant determinants to employ augmented reality technologies are discussed, providing managers of shopping malls with the instruments to enhance customers’ experiences, streamline the information flow to potential customers, and overhaul business models [
31]. Interoperability, learnability, as well as privacy are reported to be relevant and not yet widely recognized constructs to assess augmented reality and wearable networked components [
32]. Upon analyzing the factors that support the acceptance of network users to use the IPv6 networking addressing scheme, a recommendation for Internet Service Providers is made to change the mindset and strategies for the implementation of IPv6—as it is entirely different from IPv4 in terms of capacity, complexity, and the way of handling incident or service interruption [
33]. Investigation of the intention to use cloud computing solutions revealed that providers of such services ought to put considerable focus on service availability and security, as potential users pay attention to these aspects [
34]. Electricity providers are encouraged to adopt a smart meter acceptance model in order for meter manufacturers to achieve a better fit with end-user requirements and assist governments in setting standards for processing consumer data related to actual energy consumption [
35]. Finally, Macik explores the adoption of IoT by young consumers in Poland regarding the level of adoption and factors explaining this phenomenon based on the univariate analysis of variance fed with a 223-consumers sample [
36]. In his study, the gender impact was significant, whereas declared income—including lack of funds as the reason for not using IoT—did not prove to be a useful explanatory variable.
4. Results
4.1. Sample Descriptions
The structure of data provided by respondents that filled the enhanced TAM2 questionnaire was quantitatively analyzed according to the following criteria: age, nature of use, practical experience regarding networking hardware administration, and place of permanent residence (
Table 1).
As far as age is concerned, the majority of respondents were in the range of 30 to 34.9 years. The average age among women was 36.8, whereas among men it was 31.32. While IT tends to be dominated by young professionals, such an age distribution resulted from initially required experience, regarding dealing with Cisco hardware. Such hardware, considered relatively expensive, is mostly used in medium to large companies that employ professionals having certain expertise and experience. The largest group of professionals being surveyed indicated experience longer than 2 years (27.32%: 2 to 3.9 years and 25.37%: up to 5.9 years). This comprises a total of 52.69% of the sample.
Given prices on relatively high levels, not many professionals use it as building blocks for home computer networks. Therefore, as many as 90.24% of the respondents have everyday contact with Cisco hardware in their workplaces—and only 9.76% of them privately. Most respondents work and live in Poland, but also a certain number of network administrators from other European countries took part in the study. Further analysis of the geographical distribution of participants was carried out, revealing that the leading numbers of professionals come from the Silesian (21), Masovian (20), Lower Silesian (17), and Greater Poland (16) regions (Voivodeships) of Poland.
4.2. Data Structure
Table 2 introduces an overview of the data collected within the study. The results show subjective feelings of IT professionals using Cisco hardware, yet do not address the significance of individual factors.
It should be noted that the highest averages were ascertained in the case of IU1 and IU2 observed variables (Assuming that I have access to Cisco switches, I intend to use them, and Considering that I have access to Cisco hardware, I predict that I will use it in the future, respectively). This may be due to several reasons. Should the networking devices be reliable and have no material technical issues (what is confirmed by OQ1 and OQ2 averages above 6.0: The quality of Cisco hardware is high, and I have no complaints regarding the performance of Cisco switches), no need to replace it emerges. For the aforementioned observed variables, the standard deviation values are among the lowest (below 1.0), as is the range of answers. This confirms the relatively high unanimity among the respondents. Similar results were obtained regarding the Usage Behavior group.
Additionally, Result Demonstrability comes with high values—in particular, RD1 (5.717; I can easily demonstrate the advantages of using Cisco switches to other professionals). This may also provide evidence that network administrators have a positive opinion regarding Cisco hardware. Noteworthy is the availability of a vendor-provided worldwide network of training centers and recognized international certification. This is confirmed by the APT1 (5.746; Financial aspect aside, professional training offered by the existing Cisco academy network is easily accessible) as well as APT2 (5.771; Financial aspect aside, international Cisco certification that confirms broad networking knowledge and device administration skills is established).
On the other hand, I1, I2, and I3 ranked among observed variables with the worst averages (3.756; 3.737, and 3.546 respectively). Given that this question group was dedicated to assessing whether using Cisco switches at work gives a professional a higher status or occupational prestige. It turns out, however, that this feature is relatively irrelevant for users and is not considered when making procurement-related business decisions.
4.3. Data Reliability
Specific question groups serving as building blocks for the questionnaire used within this study were submitted to a consistency check. To justify the claim that the individual latent variables of the customized TAM2 model are supported by questions that are pertinent and formulated properly, Cronbach’s Alpha coefficients [
42] were calculated for each question group. The unstandardized Alpha, computed on the covariance matrix of items, is considered to be a mainstream method for such evaluation [
43].
A potential drawback of Cronbach’s Alpha coefficient is that a greater number of items in the test can artificially inflate the value of Alpha itself [
44]. To make the results independent of test items [
45], the standardized Cronbach’s Alpha coefficients, computed on the correlation matrix of items using IBM SPSS software were provided (see
Table 3). The closer the coefficient to a maximum value of 1, the more consistent and reliable the question group is. Values above 0.7 are generally regarded as adequate; there appears to be no consensus regarding minimal threshold, however. For instance, Kaiser [
46] as well as Sekaran and Bougie [
38] consider 0.6 an acceptable value. The empirical investigation regarding the magnitudes of alpha coefficients obtained in behavioral research revealed that 75% of the observed Alpha coefficients were 0.7 or greater, 49% were 0.8 or greater, whereas 14% were 0.9 or greater [
47].
Analysis of internal consistency reliability reveals that all latent variables except Output Quality (OQ) have achieved standardized Cronbach’s Alpha coefficients exceeding 0.8. The highest coefficients were evidenced in the case of Subjective Norm (SN), Image as well as Perceived Usefulness (PU). For these three factors, the values of standardized Cronbach’s Alphas pointed at excellent reliability of the drawn-up questions. It is the fact that a trial stage was taken into account within research design that was one of the reasons behind achieving good internal consistency throughout the study. On one hand, potential issues regarding verbalizing the questions were minimized thanks to it. On the other hand, a redundancy of individual questions that artificially inflates Alpha coefficients was avoided.
4.4. Estimation of Free Parameters
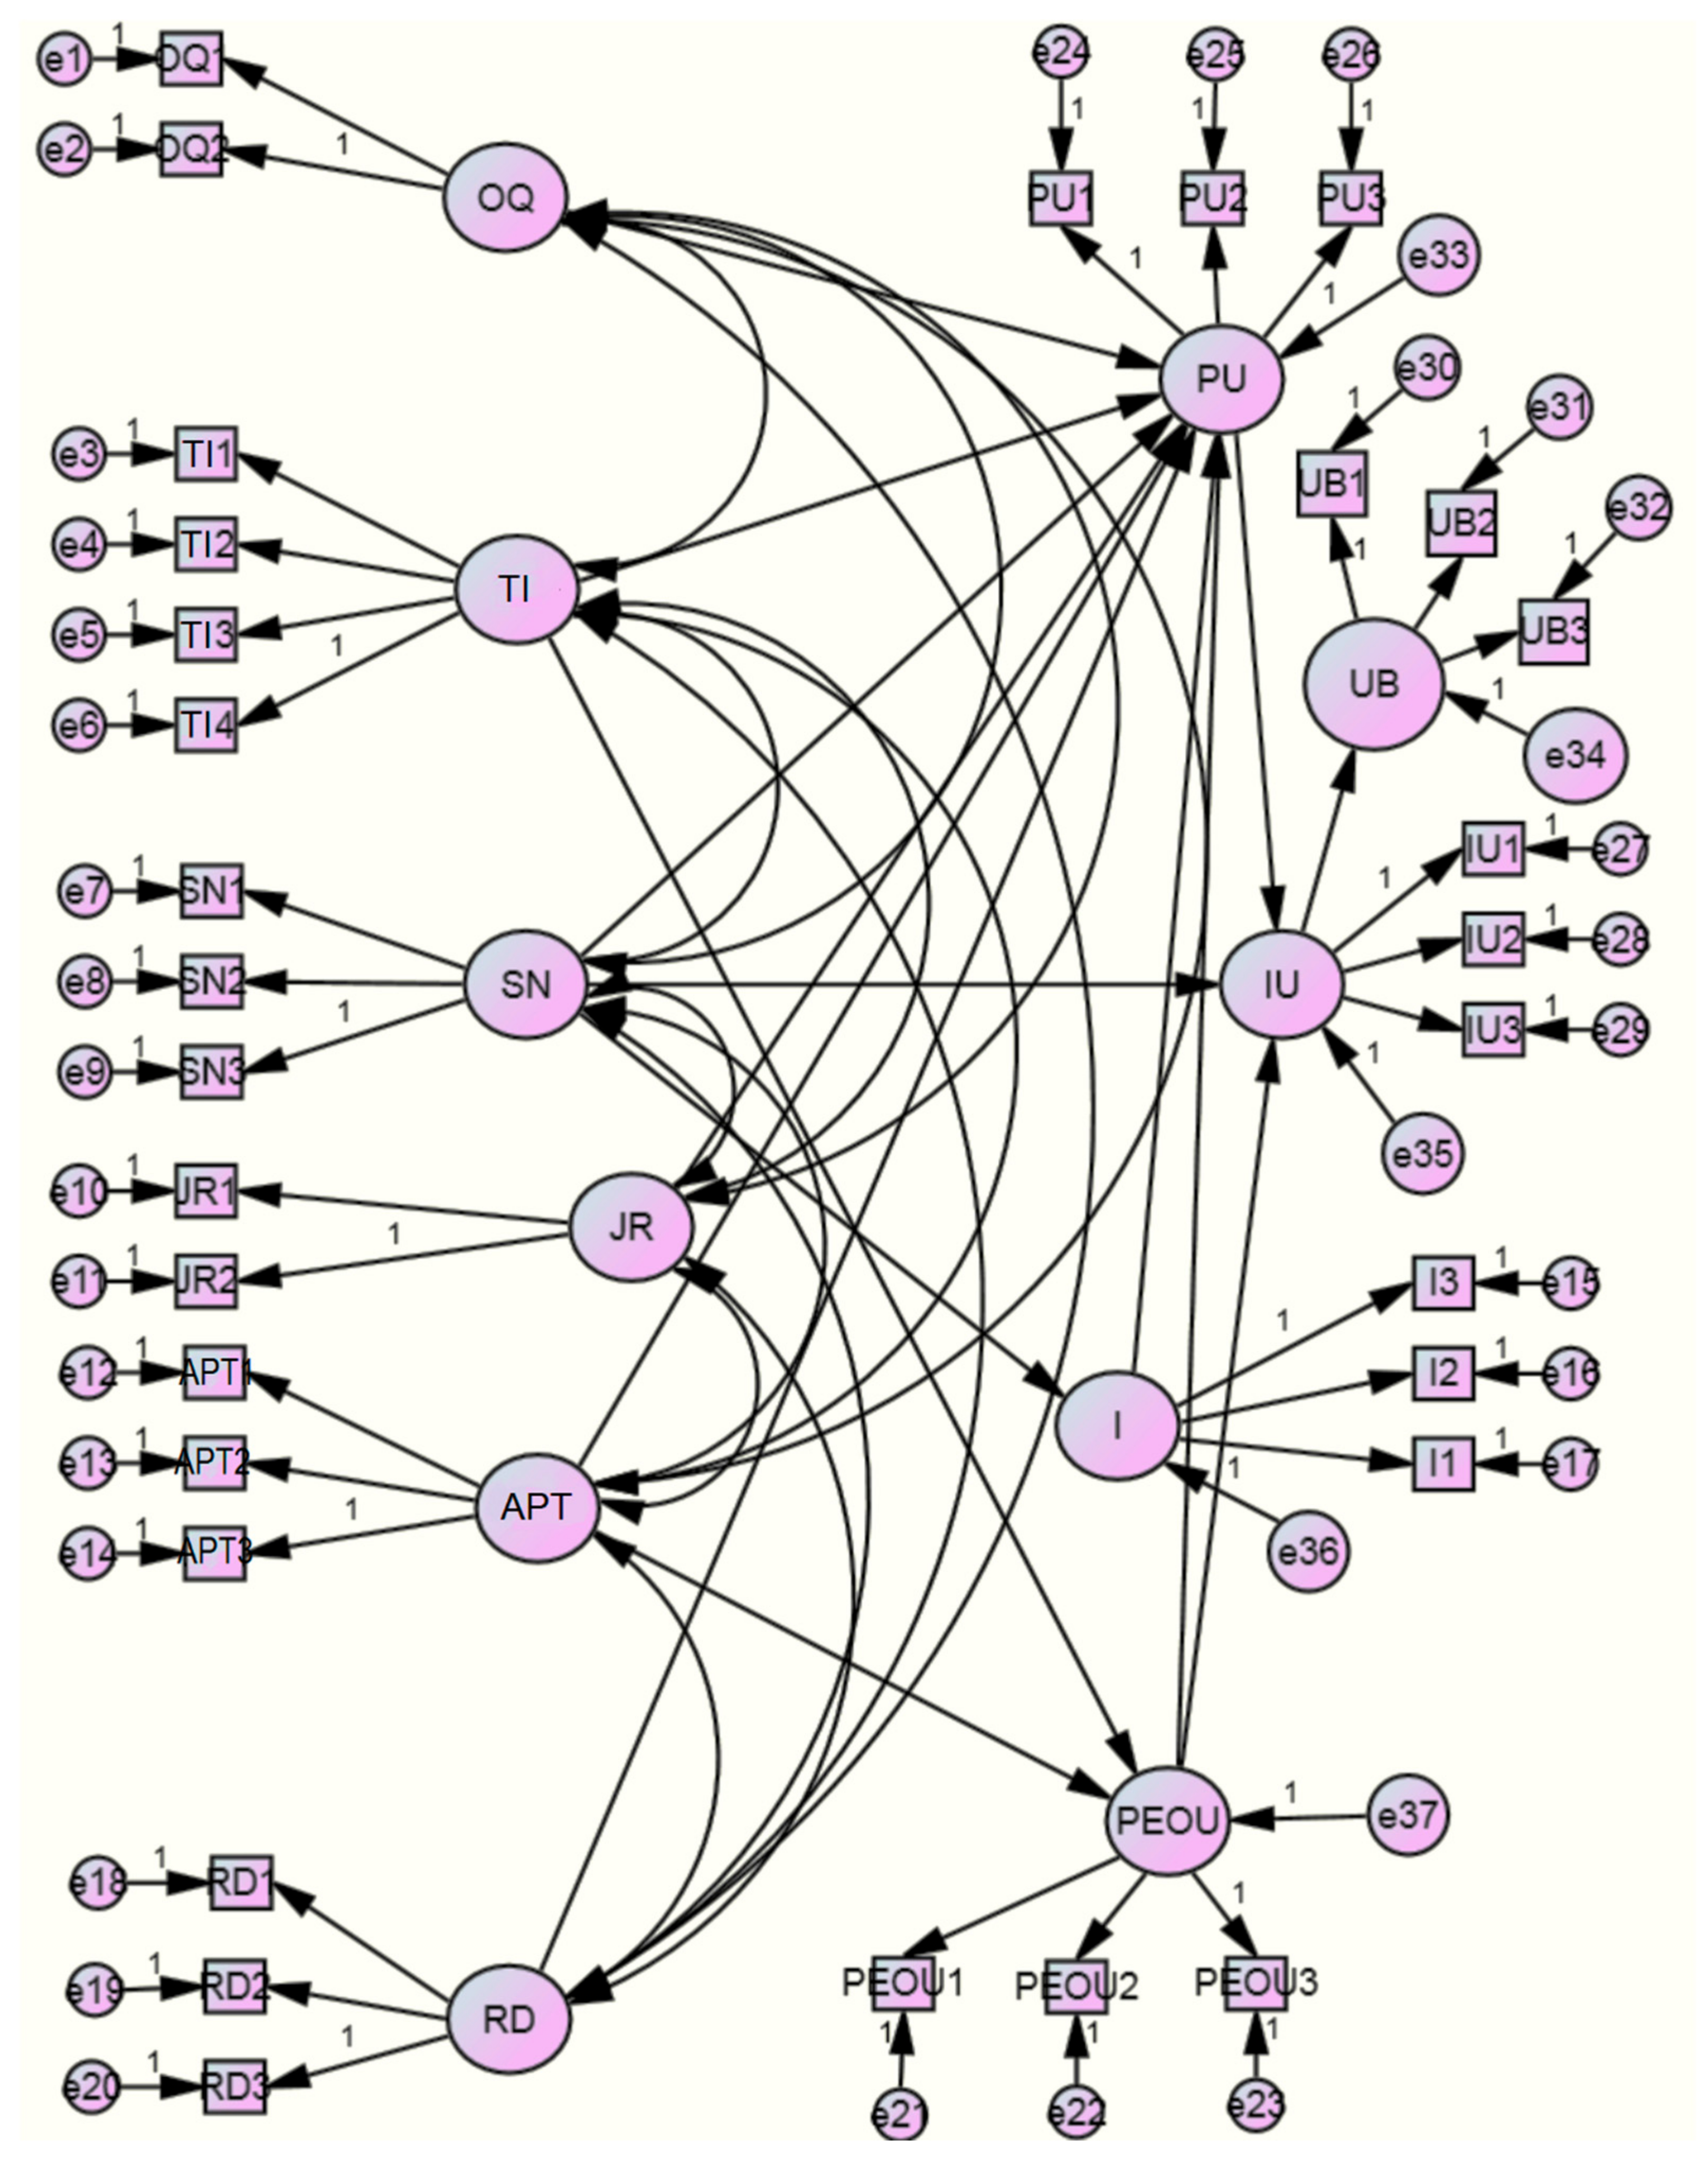
In order to verify the hypotheses presented in this article, the IBM SPSS Statistics software was used along with Amos, a structural equation modeling tool featuring a visual component. The measurement model binds latent variables (represented as ellipses) and observed variables (rectangles) using cause–effect relationships (one-way arrows) and co-variances (two-way arrows), as depicted in
Figure 2. Both measurement and structural error terms are included in the model as well. The CMIN/DF value calculated for the measurement model (1.731) meets a relatively restrictive threshold of 2.0. This points to the model being well-fitting and is confirmed by the RMSEA value of 0.077 that Browne and Cudeck classify as a reasonable error of approximation [
48].
Both hypothesis verification and setting directions of further enhancement of the customized TAM2 model benefit from the examination of the significance levels calculated regarding given model parameters. To consider a relationship between latent variables significant, a 0.05 threshold of
p coefficient should not be exceeded. Values below 0.01 are considered strongly significant, whereas those up to 0.001 (thus denoted as *** throughout
Table 4) are very significant. Standardized regression weights are included in the table to reveal both the direction and strength of individual relationships. The closer a β coefficient to the utmost values of −1 and 1, the stronger a relationship. It is worth stressing that computed coefficients tend to be of higher absolute value for significant relationships than those related to non-significant ones. It practically means that the contribution of a given factor into explaining the behavior is higher.
Hypotheses H12, H13, and H14 are intentionally not included in
Table 4, as their evaluation requires additional calculations within sub-groups. It turns out that the
p-value calculated for the SN → PU relationship decreases along with growth in experience: 0.845 for professionals with experience up to 5 years and 0.437 for more experienced ones. A similar situation was observed when the SN → IU relationship was investigated in terms of voluntariness (0.424 in case of those who are obliged to use Cisco solutions and 0.359 for unsolicited users), while the very same relationship moderated by experience generated completely different results. A
p valuation of 0.056 was calculated for non-experienced professionals, whereas the valuation reached as high as 0.629 across the experienced group.
4.5. Further Elaboration of the Measurement Model
Despite the explanatory power of the customized TAM2 model being sufficient for predicting human behavior (R2 of 0.476), it was fine-tuned to further enhance its substantive adaptation to the specificity of the networking domain. To achieve that, non-significant relations were removed one at a time, followed by calculating significance levels and analyzing them in each cycle. Potential relationships that were taken into account neither by the generic TAM2 nor by the customized version thereof were explored as well. As a result, two latent variables—i.e., Job Relevance (JR) and Technological Innovation (TI)—were removed altogether.
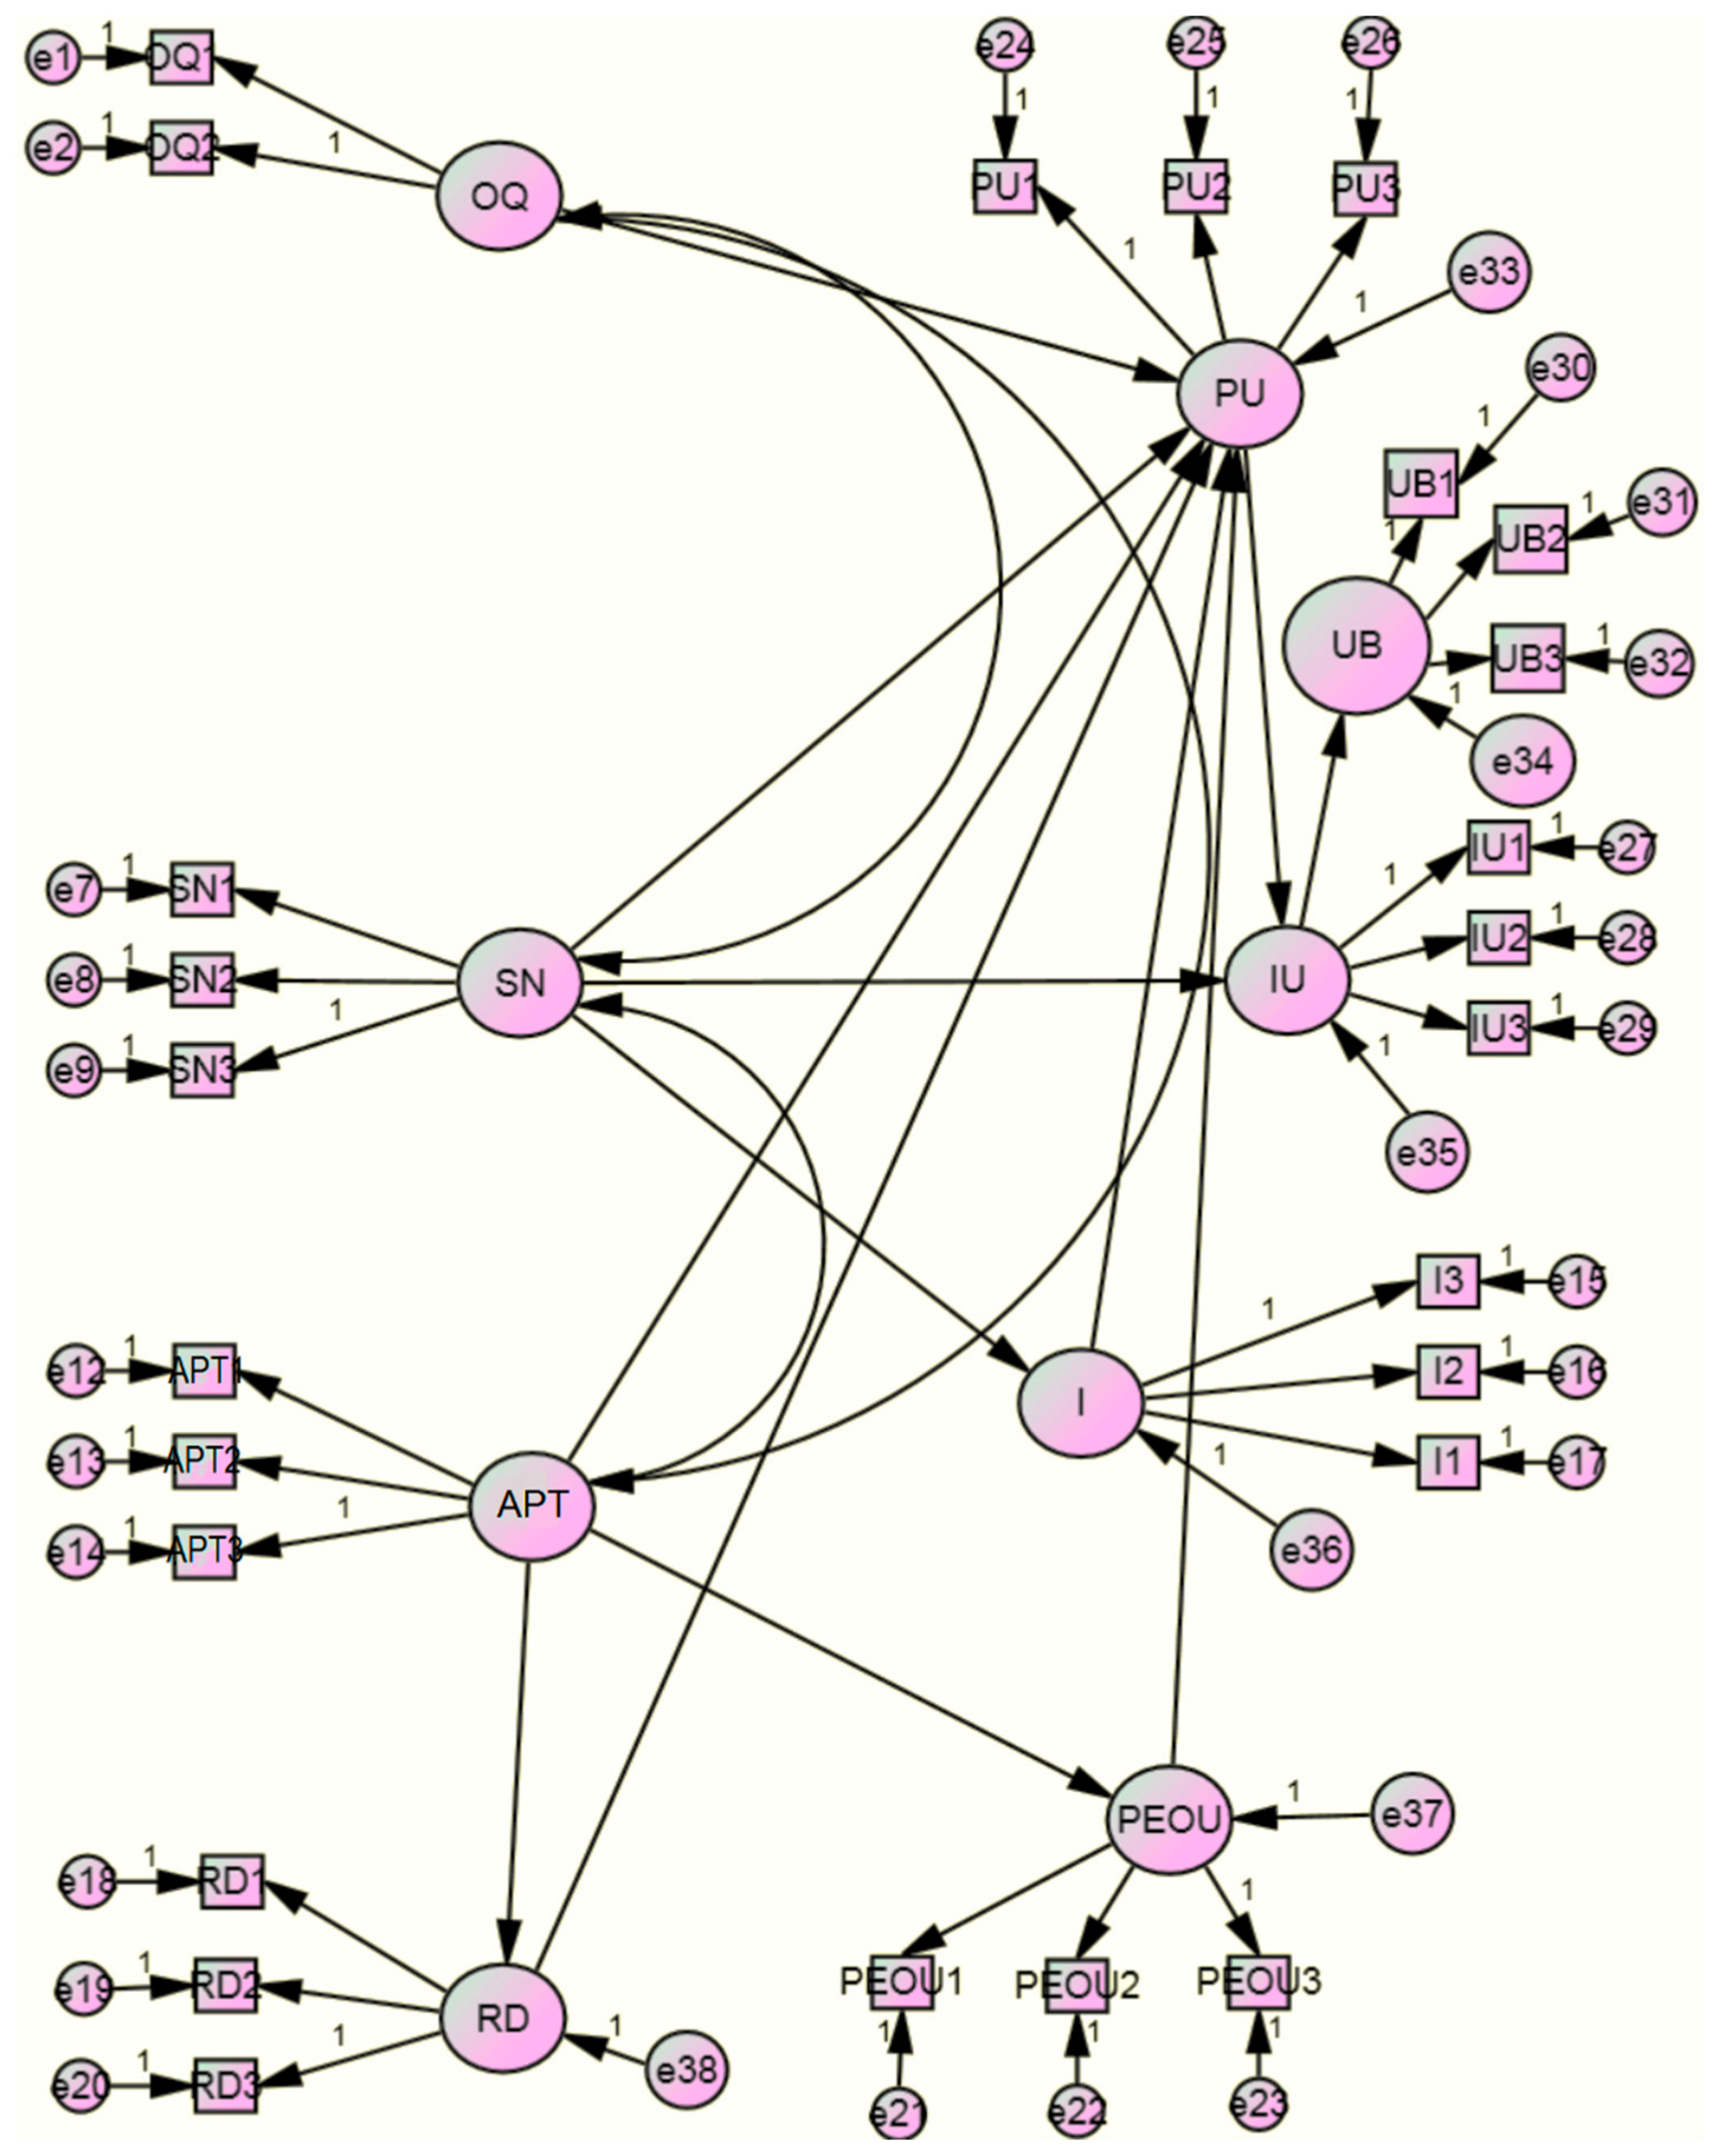
Based on the H7 (which, in line with the results provided in
Table 4, points at the strong significance of the relationship between Result Demonstrability and Perceived Usefulness), a new domain-specific relationship is proposed. Result Demonstrability translates into the advantages of Cisco switches being familiar to users and users’ experience regarding the strengths and weaknesses of these networking devices. In some cases, the training system in place can also influence the perception of Cisco switches benefits, as future network administrators are familiarized with technological solutions used to build them from the ground up. Thereby, the Availability of Professional Training might affect Result Demonstrability (see
Figure 3).
Research hypotheses were naturally re-aligned with the final version of the customized TAM2 model. To distinguish the hypotheses from the initially posed ones, each hypothesis at this stage was supplemented with a prefix (n):
nH1. Subjective Norm has a significant influence on Image;
nH2. Availability of Professional Training has a significant influence on Result Demonstrability;
nH3. Subjective Norm has a significant influence on Intention to Use;
nH4. Subjective Norm has a significant influence on Perceived Usefulness;
nH5. Image has a significant influence on Perceived Usefulness;
nH6. Output Quality has a significant influence on Perceived Usefulness;
nH7. Result Demonstrability has a significant influence on Perceived Usefulness;
nH8. Availability of Professional Training has a significant influence on Perceived Usefulness;
nH9. Availability of Professional Training has a significant influence on Perceived Ease of Use;
nH10. Positive direct impact of Subjective Norm on Perceived Usefulness is reduced along with the increase in Experience;
nH11. Positive direct impact of Subjective Norm on Intention to Use is reduced along with the increase in Experience;
nH12. Positive direct impact of Subjective Norm on Intention to Use is reduced along with the increase in Voluntariness;
nH13. Perceived Ease of Use has a significant influence on Perceived Usefulness;
nH14. Perceived Usefulness has a significant influence on Intention to Use;
nH15. Intention to Use has a significant influence on Usage Behavior.
Upon fine-tuning, a slight increase in both applied fitness indices was observed, as CMIN/DF and RMSEA values dropped to 1.641 and 0.072, respectively.
Table 5 provides significance levels and standardized coefficients for the final customized TAM2 model.
Three hypotheses—i.e., nH10, nH11, nH12—were, again, evaluated within sub-groups. In this case, the results follow a similar setup as before fine-tuning the model. A decrease in the p-value calculated for the SN → PU relationship is still observed along with growth in experience (non-experienced: 0.077; experienced: 0.021). The SN → IU relationship significance levels drop while moderated by voluntariness (solicited users: 0.291; unsolicited users: 0.190) and spike while moderated by experience (non-experienced: 0.045; experienced: 0.545).
5. Discussion
Results presented in the previous section of the article provide a sufficient basis to accept as many as eleven of the hypotheses posed for the final version of the customized TAM2 model. As new latent variables proposed by the authors are concerned, it should be stressed that, as depicted by significance levels throughout all iterations of developing the model, Availability of Professional Training indeed influences Perceived Ease of Use (H10/nH9). It confirms the validity of the educational and marketing strategy adopted by Cisco Systems. Owing to the worldwide network of Cisco academies offering professional training not only to active network administrators but also students (and even secondary school pupils), Cisco switches are reported to be relatively easy to maintain and configure. Whereas from the perspective of a self-taught user such a statement can be considered controversial, it supports the findings of Yoon et al. [
24] to some extent. In addition to knowledge transfer [
21] and certification, training programs incorporate gamification elements such as badges, quizzes, or progress bars [
25], thereby maintaining tension and building motivation among participants [
24]. Such an educational initiative is not offered commonly among the competition. It may be argued that it translates further on sales volume, since a rational customer takes into account Perceived Ease of Use (and overall cost of maintaining the entire network infrastructure of a company as a result) while selecting networking hardware.
Moreover, the newly established relationship from the authors that implies the Availability of Professional Training having a significant influence on Result Demonstrability (nH2) was accepted as well. The correlation between these two latent variables proved to be strong (
p = 0.002 and β value of 0.345). It turned out that a wide range of training opportunities and convenient access to the training content positively impact the recognition of Cisco switches and their users’ opinions regarding strengths and weaknesses of hardware under discussion. This can be considered a transposition of Thusi and Maduku’s recommendations [
18] to the networking field, who pointed out the necessity to improve marketing communication toward emphasizing benefits and subjective perspectives of increasing one’s own productivity.
Finally, the influence of Availability of Professional Training on Perceived Usefulness (H9/nH8) proved significant. It ought to be stressed though that, to our surprise, the impact is negative. This shows that by training (increasing knowledge, acquiring new skills) one can shift one’s personal limits and simply begin to perceive some unrealized potential. In other words, one simply expects even more. Once again, it turned out that the training component is of great relevance [
24,
32] in the networking domain. Thus, all APT-related related relationships were confirmed within the final model, as depicted in
Table 6.
It should be pointed out that the H18/nH15, which may be considered a crucial hypothesis, was strongly confirmed (***) by the study. Indeed, Intention to Use significantly (and positively) influences Usage Behavior regarding Cisco switches. The Usage Behavior factor was investigated based on three questions. This conclusion can be strengthened by the fact that the most of administrators being surveyed have relatively long practical experience regarding Cisco networking hardware administration (see
Table 1). The average Usage Behavior reported by professionals on a 7-degree Likert scale is very high (6.01). The time reported daily for maintaining Cisco switches is between 1.5 and 2 h.
On the other hand, the study has shown that among three factors being scrutinized originally, Intention to Use is significantly affected only by Perceived Usefulness. Nevertheless, the H17/nH14 was accepted without a shadow of a doubt. It is clear then that Cisco switches are appreciated by network administrators thanks to their efficiency, which directly impacts the intention of their use in the future. The value of the
p coefficient indicates that Perceived Usefulness influences the decision process regarding future purchases of the networking hardware very much. Whilst the direct effect of the key construct of TAM-based models (i.e., Perceived Ease of Use) is usually confirmed [
2,
12,
23,
25], our study points to the need to be highly cautious about mechanically replicating such an assumption across industries. Analysis indicates that such a caveat might be applied not only to highly specialized high-tech settings. Doubts in this regard have also been raised regarding mobile solutions [
10,
11,
20], that position themselves much closer to a typical technology “consumer”.
Exploring the factors that directly shape Intention to Use further, it was denied that Subjective Norm influences it. Analyzing the H2/nH3, employees’ opinion does not affect whether users intend to continue using Cisco devices or not. As it turned out, this decision is taken based on the utility of the networking equipment, and not the judgment of others. Administrators make a decision regarding actual hardware performance based on their own experience, and not at the instigation of co-workers. In this very case, the rejection of the aforementioned hypothesis speaks well of networking professionals, since outside pressure is not considered at the practical experience’s expense. To follow up the expertise aspect, it was learned that along with the increase in Experience, the influence of Subjective Norms on Intention to Use is weakened (thus, H13/nH11 is accepted). This goes in line with [
2,
36], which indicate that excluding moderators would impoverish the model whilst the level of experience can strongly influence the interpretation of research targeting propensity towards using a given technology [
20]. Significance levels for this relationship considerably vary across professional expertise in both the initial and final versions of the customized TAM2 model. The study confirmed that the more experienced a professional is, the less influenced by one’s organizational environment in making decisions about the continued use of Cisco switches the professional will be.
The succeeding five hypotheses are accepted, as significance levels related to them meet the specified threshold. For that reason:
Output Quality has a significant influence on Perceived Usefulness;
Result Demonstrability has a significant influence on Perceived Usefulness;
Perceived Ease of Use has a significant influence on Perceived Usefulness;
Subjective Norm has a significant influence on Perceived Usefulness;
Subjective Norm has a significant influence on Image.
According to end-users, it may be recapitulated that the overall quality of Cisco hardware (as delineated by H6/nH6) has a significant impact on professionals’ efficiency, and the impact is positive. In terms of quality, one may regard the reliability and resistance to anomalies that occur in LANs and negatively impact the efficiency of computer networks, or even interrupt switching operations. High quality is said by the respondents to be a welcome feature by each vendor, regardless of external circumstances. The back-office specificity of using corporate switches as e-commerce technological enablers stands in stark contrast to the forbearance regarding lackluster access to resources, which has been reported, for example, in the case of mobile access to e-learning content [
23].
A firm confirmation of H7/nH7 means that the advantages of Cisco switches along with the knowledge regarding weaknesses and strong points of the devices (Result Demonstrability) significantly impact Perceived Usefulness. Such knowledge boosts the efficiency and swiftness of performing administrative tasks. Professional training initiatives may have an indirect influence on such a situation [
18] since future users are familiarized with the advantages of the technology from the very beginning. One cannot also ignore the fact that informed users tend to place a high value on security and service availability [
34]—both vital in the networking context.
Comparing the significance levels computed for H15/nH13 with other factors that are hypothesized to influence Perceived Usefulness, it should be no surprise that Perceived Ease of Use is indeed related to the latter. Few studies question such a relationship, which is sometimes justified by moderators [
20]. It is therefore confirmed that user-friendliness regarding maintaining Cisco switches has a significant impact on a professional’s efficiency at work. Upon accepting the hypothesis, it might be stated that networking devices that are regarded as easy to use shall be positively assessed by network administrators who tend to select such devices more frequently compared to competing products.
The relationship between Subjective Norm and Perceived Usefulness was originally challenged (H3). Eliminating a couple of non-significant factors within its enhanced version brought a dozen-fold improvement regarding significance levels of nH4, putting it clearly below the acceptance threshold with
p = 0.016. Thereby, network administrators tasked with managing Cisco switches are open to suggestions regarding the overall value of particular hardware expressed by their colleagues. Younger professionals are particularly susceptible to the authoritative role of their more experienced counterparts, which is in line with [
16]. In contrast, the relation between Subjective Norm and Image (H1/nH1) is infallibly very strong. Thus, the opinion and recommendations of third parties affect the prestige of the network administrator’s profession among other employees, which the authors reckon to be an important factor for an administrator’s self-esteem.
As was the case with the relationship between Subjective Norms and Intention to Use, the influence of the former on Perceived Usefulness against categorized Experience was examined. This time, however, the H12/nH10 hypothesis should be rejected. In the case being discussed, the p-value decreases along with the increase in experience, thus boosting significance. As a result, the opinion of administrators around the world, with a longer experience, has a greater impact on the assumed performance of Cisco switches. When the most technologically experienced people around the organization express favorably about Cisco switches and encourage their application, it makes sense for administrators to feel that using this hardware constituted a good choice, so it would be wise to do so again in the future. Such an attitude might also boost their confidence and contribute to improving administrators’ work.
Finally, research conducted also denied that Image has a significant influence on Perceived Usefulness (H4/nH5). It may be concluded that the position of staff responsible for maintaining Cisco devices in a company does not stand out above other employees in terms of prestige. The professionals being specialists in their narrow IT field are regarded just the same as other specialists in the company. A similar phenomenon occurred regarding perceptions of Technological Innovation. A possible explanation is that high-tech solutions are recognized as innovative by design (which generally contradicts [
26]). That said, innovativeness is reported to primarily affect Perceived Ease of Use [
27], and in the proposed model, this latter does not directly impinge on Intention to Use.
6. Conclusions
6.1. Summary of Findings
The study provided an opportunity to scrutinize the acceptance determinants of a certain group of digital economy’s technological enablers among network administrators in business environments. Based on the strengths and weaknesses of the available models of acceptance as well as potential fit, the TAM2 model was adopted as a basis for research. The authors, however, decided to customize the model to provide a superior determination of the factors that influence the acceptance of networking hardware. Thereby, a couple of domain-specific latent variables were proposed, i.e., Technological Innovation (TI) and Availability of Professional Training (APT). The latter of the proposed factors was confirmed to have a significant impact on networking hardware acceptance.
Upon analysis of all the relationships in which the Availability of Professional Training factor is occurring, the authors can agree that the introduction of professional training through the establishment of a worldwide academy network is a well-considered step in the evolution of Cisco Systems. While this project required and still entails considerable financial resources to provide up-to-date training content, to maintain e-learning infrastructure, as well as to provide technical support and subject-related expertise from Cisco engineers, it has brought the corporation numerous benefits. It also constitutes a marketing component, with Cisco leading the way in many areas of networking technology. Obviously, the entire program cannot be simply reduced to financial aspects. It is impossible to evaluate, in financial terms, a contribution to the dissemination of networking knowledge and the development of the information society worldwide.
Additionally, investigating the feedback from specified groups of respondents with experience from 0 to 5 years and more than 5 years reveals that a very strong significance of Intention to Use’s impact on the Usage Behavior is recognized. The aforementioned significance levels regardless of experience have shown that it is unlikely that the gap in market share regarding the Ethernet switches segment between Cisco and its strongest competitors will be leveled in near future. Whereas IT hardware manufacturers have observed a slowdown in product sales in recent years and emerging economies-based vendors from Asia-Pacific and Latin America successfully put pressure on this market segment [
49], Cisco has some strong arguments to challenge this process. That said, major risks for current dominance include:
mergers and acquisitions among second-tier Ethernet switches vendors;
stronger and more determined expansion of Chinese vendors;
significant changes in pricing policies (radical reduction in prices while maintaining a high level of reliability);
possible post-COVID-19 economic decline, limiting the volume that companies and institutions are keen to invest in IT.
6.2. Implications
The article has both practical and theoretical implications for technology evaluation. To begin with, mid-level management was provided with a tool that enhances decision processes regarding the procurement of Ethernet class networking switches in organizations with substantial utilization of networking hardware—which is typical for high-tech business and e-commerce. The authors consider such support an important practical implication. Taking advantage of partial feedback from network administrators only, a decision-maker can put the model to use to anticipate future requests regarding changing a particular networking hardware class vendor or committing to a more intense co-operation with a given vendor. Another practical implication is raising awareness of the importance of well-chosen professional training in the context of job satisfaction and efficiency. Thereby, management boards are now given substantive grounds to adjust internal policies regarding financing particular categories of technology-oriented and general professional training. On the other hand, Ethernet switches manufacturers might include the results of the study to tune-in both design- and marketing-oriented internal research regarding future development and placement of their products.
As contributions to the theory are concerned, the authors confronted the Structural Equation Modelling-related body-of-knowledge with the specifics of the highly networking-dependent domains, thus filling the gap regarding scrutinizing acceptance factors of Ethernet switches. Authors’ latent variable enriched and expanded study results while increasing the explanatory potential of the generic TAM2 model. Owing to that, the factors that affect the acceptance of Cisco hardware could be subjected to more precise analysis.
6.3. Limitations
As with any research, this contribution comes with a few limitations. First of all, given the data gathering method selected, the vast majority of the participants of the study provided work and services primarily in a single country—although much of the time for global companies. This might be considered a limitation of the study. Secondly, the customized TAM2 was built with, in mind, establishing which factors influence the acceptance of networking switches provided by a specific vendor. As scrutinized decision factors are regarded, corporate networking solutions in the Ethernet switching segment provided by leading vendors are homogenous to a degree that justifies applying the customized TAM2 model to other vendors as well. Nonetheless, research triangulation would provide additional arguments to support that claim.
Additionally, even though the indirect impact of both author-proposed and generic TAM2 factors on Intention to Use and Usage Behavior was computed while processing both measurement models, it remains out of the scope of this study. Therefore, it is neither analyzed nor discussed within the body of the article.


