
Emerging Interaction Patterns in the Emiliania huxleyi-EhV System


Abstract
:1. Introduction
2. Materials and Methods
2.1. Emiliania Huxleyi and EhV Strains
2.2. Cross-Infectivity Experiments
2.3. Enumeration of Algae and Viruses
2.4. Growth Rate, Resistance, Viral Production
2.5. Host-Virus Network Analysis
3. Results
4. Discussion
Supplementary Materials
Acknowledgments
Author Contributions
Conflicts of Interest
References
- Wilhelm, S.W.; Suttle, C.A. Viruses and nutrient cycles in the sea—Viruses play critical roles in the structure and function of aquatic food webs. Bioscience 1999, 49, 781–788. [Google Scholar] [CrossRef]
- Suttle, C.A. Marine viruses—Major players in the global ecosystem. Nat. Rev. Microbiol. 2007, 5, 801–812. [Google Scholar] [CrossRef] [PubMed]
- Breitbart, M. Marine viruses: Truth or dare. Annu. Rev. Mar. Sci. 2012, 4, 425–448. [Google Scholar] [CrossRef] [PubMed]
- Fuhrman, J.A. Marine viruses and their biogeochemical and ecological effects. Nature 1999, 399, 541–548. [Google Scholar] [CrossRef] [PubMed]
- Wommack, K.E.; Colwell, R.R. Virioplankton: Viruses in aquatic ecosystems. Microbiol. Mol. Biol. Rev. 2000, 64, 69–114. [Google Scholar] [CrossRef] [PubMed]
- Weinbauer, M.G.; Rassoulzadegan, F. Are viruses driving microbial diversification and diversity? Environ. Microbiol. 2004, 6, 1–11. [Google Scholar] [CrossRef] [PubMed]
- Brussaard, C.P.D. Viral control of phytoplankton populations—A review. J. Eukaryot. Microbiol. 2004, 51, 125–138. [Google Scholar] [CrossRef] [PubMed]
- Suttle, C.A.; Chan, A.M. Dynamics and distribution of cyanophages and their effect on marine Synechococcus spp. Appl. Environ. Microbiol. 1994, 60, 3167–3174. [Google Scholar] [PubMed]
- Waterbury, J.B.; Valois, F.W. Resistance to cooccurring phages enables marine synechococcus communities to coexist with cyanophages abundant in seawater. Appl. Environ. Microbiol. 1993, 59, 3393–3399. [Google Scholar] [PubMed]
- Weinbauer, M.G. Ecology of prokaryotic viruses. FEMS Microbiol. Rev. 2004, 28, 127–181. [Google Scholar] [CrossRef] [PubMed]
- Jiang, S.C.; Paul, J.H. Gene transfer by transduction in the marine environment. Appl. Environ. Microbiol. 1998, 64, 2780–2787. [Google Scholar] [PubMed]
- Fuhrman, J.A.; Suttle, C.A. Viruses in marine planktonic systems. Oceanography 1993, 6, 51–63. [Google Scholar] [CrossRef]
- Hutchinson, G.E. The paradox of the plankton. Am. Nat. 1961, 95, 137–145. [Google Scholar] [CrossRef]
- Winter, C.; Bouvier, T.; Weinbauer, M.G.; Thingstad, T.F. Trade-offs between competition and defense specialists among unicellular planktonic organisms: The “killing the winner“ hypothesis revisited. Microbiol. Mol. Biol. Rev. 2010, 74, 42–57. [Google Scholar] [CrossRef] [PubMed]
- Thingstad, T.F.; Vage, S.; Storesund, J.E.; Sandaa, R.A.; Giske, J. A theoretical analysis of how strain-specific viruses can control microbial species diversity. Proc. Natl. Acad. Sci. USA 2014, 111, 7813–7818. [Google Scholar] [CrossRef] [PubMed]
- Sheldon, B.C.; Verhulst, S. Ecological immunology: Costly parasite defences and trade-offs in evolutionary ecology. Trends Ecol. Evol. 1996, 11, 317–321. [Google Scholar] [CrossRef]
- Weitz, J.S.; Poisot, T.; Meyer, J.R.; Flores, C.O.; Valverde, S.; Sullivan, M.B.; Hochberg, M.E. Phage-bacteria infection networks. Trends Microbiol. 2013, 21, 82–91. [Google Scholar] [CrossRef] [PubMed]
- Poullain, V.; Gandon, S.; Brockhurst, M.A.; Buckling, A.; Hochberg, M.E. The evolution of specificity in evolving and coevolving antagonistic interactions between a bacteria and its phage. Evolution 2008, 62, 1–11. [Google Scholar] [CrossRef] [PubMed]
- Meyer, J.R.; Dobias, D.T.; Weitz, J.S.; Barrick, J.E.; Quick, R.T.; Lenski, R.E. Repeatability and contingency in the evolution of a key innovation in phage lambda. Science 2012, 335, 428–432. [Google Scholar] [CrossRef] [PubMed]
- Fortuna, M.A.; Stouffer, D.B.; Olesen, J.M.; Jordano, P.; Mouillot, D.; Krasnov, B.R.; Poulin, R.; Bascompte, J. Nestedness versus modularity in ecological networks: Two sides of the same coin? J. Anim. Ecol. 2010, 79, 811–817. [Google Scholar] [CrossRef] [PubMed]
- Flores, C.O.; Poisot, T.; Valverde, S.; Weitz, J.S. Bimat: A matlab package to facilitate the analysis of bipartite networks. Methods Ecol. Evol. 2016, 7, 127–132. [Google Scholar] [CrossRef]
- Gomez, P.; Buckling, A. Bacteria-phage antagonistic coevolution in soil. Science 2011, 332, 106–109. [Google Scholar] [CrossRef] [PubMed]
- Benmayor, R.; Buckling, A.; Bonsall, M.B.; Brockhurst, M.A.; Hodgson, D.J. The interactive effects of parasitesf disturbance, and productivity on experimental adaptive radiations. Evolution 2008, 62, 467–477. [Google Scholar] [CrossRef] [PubMed]
- Brockhurst, M.A.; Buckling, A.; Rainey, P.B. The effect of a bacteriophage on diversification of the opportunistic bacterial pathogen, pseudomonas aeruginosa. Proc. R. Soc. B-Biol. Sci. 2005, 272, 1385–1391. [Google Scholar] [CrossRef] [PubMed]
- Brockhurst, M.A.; Rainey, P.B.; Buckling, A. The effect of spatial heterogeneity and parasites on the evolution of host diversity. Proc. R. Soc. B-Biol. Sci. 2004, 271, 107–111. [Google Scholar] [CrossRef] [PubMed]
- Middelboe, M.; Holmfeldt, K.; Riemann, L.; Nybroe, O.; Haaber, J. Bacteriophages drive strain diversification in a marine flavobacterium: Implications for phage resistance and physiological properties. Environ. Microbiol. 2009, 11, 1971–1982. [Google Scholar] [CrossRef] [PubMed]
- Riemann, L.; Grossart, H.-P. Elevated lytic phage production as a consequence of particle colonization by a marine flavobacterium (Cellulophaga sp.). Microb. Ecol. 2008, 56, 505–512. [Google Scholar] [CrossRef] [PubMed]
- Middelboe, M. Bacterial growth rate and marine virus-host dynamics. Microb. Ecol. 2000, 40, 114–124. [Google Scholar] [PubMed]
- Avrani, S.; Wurtzel, O.; Sharon, I.; Sorek, R.; Lindell, D. Genomic island variability facilitates prochlorococcus-virus coexistence. Nature 2011, 474, 604–608. [Google Scholar] [CrossRef] [PubMed]
- Meaden, S.; Paszkiewicz, K.; Koskella, B. The cost of phage resistance in a plant pathogenic bacterium is context-dependent. Evolution 2015, 69, 1321–1328. [Google Scholar] [CrossRef] [PubMed]
- Lennon, J.T.; Khatana, S.A.M.; Marston, M.F.; Martiny, J.B.H. Is there a cost of virus resistance in marine cyanobacteria? ISME J. 2007, 1, 300–312. [Google Scholar] [CrossRef] [PubMed]
- Lythgoe, K.A.; Chao, L. Mechanisms of coexistence of a bacteria and a bacteriophage in a spatially homogeneous environment. Ecol. Lett. 2003, 6, 326–334. [Google Scholar] [CrossRef]
- Bohannan, B.J.M.; Lenski, R.E. The relative importance of competition and predation varies with productivity in a model community. Am. Nat. 2000, 156, 329–340. [Google Scholar] [CrossRef]
- Mizoguchi, K.; Morita, M.; Fischer, C.R.; Yoichi, M.; Tanji, Y.; Unno, H. Coevolution of bacteriophage pp01 and escherichia coli o157: H7 in continuous culture. Appl. Environ. Microbiol. 2003, 69, 170–176. [Google Scholar] [CrossRef] [PubMed]
- Thomas, R.; Grimsley, N.; Escande, M.L.; Subirana, L.; Derelle, E.; Moreau, H. Acquisition and maintenance of resistance to viruses in eukaryotic phytoplankton populations. Environ. Microbiol. 2011, 13, 1412–1420. [Google Scholar] [CrossRef] [PubMed]
- Frickel, J.; Sieber, M.; Becks, L. Eco-evolutionary dynamics in a coevolving host-virus system. Ecol. Lett. 2016, 19, 450–459. [Google Scholar] [CrossRef] [PubMed]
- Brown, C.W.; Yoder, J.A. Coccolithophorid blooms in the global ocean. J. Geophys. Res.-Oceans 1994, 99, 7467–7482. [Google Scholar] [CrossRef]
- Tyrrell, T.; Taylor, A.H. A modelling study of Emiliania huxleyi in the ne atlantic. J. Mar. Syst. 1996, 9, 83–112. [Google Scholar] [CrossRef]
- Egge, J.K.; Heimdal, B.R. Blooms of phytoplankton including Emiliania-huxleyi (haptophyta)—Effects of nutrient supply in different n-p ratios. Sarsia 1994, 79, 333–348. [Google Scholar] [CrossRef]
- Broerse, A.T.C.; Ziveri, P.; van Hinte, J.E.; Honjo, S. Coccolithophore export production, species composition, and coccolith-caco3 fluxes in the ne atlantic (34 degrees n 21 degrees w and 48 degrees n 21 degrees w). Deep-Sea Res. Part II Top. Stud. Oceanogr. 2000, 47, 1877–1905. [Google Scholar] [CrossRef]
- Burkill, P.H.; Archer, S.D.; Robinson, C.; Nightingale, P.D.; Groom, S.B.; Tarran, G.A.; Zubkov, M.V. Dimethyl sulphide biogeochemistry within a coccolithophore bloom (disco): An overview. Deep-Sea Res. Part II Top. Stud. Oceanogr. 2002, 49, 2863–2885. [Google Scholar] [CrossRef]
- Cottrell, M.T.; Suttle, C.A. Wide-spread occurrence and clonal variation in viruses which cause lysis of a cosmopolitan, eukaryotic marine phytoplankter, micromonas-pusilla. Mar. Ecol. Prog. Ser. 1991, 78, 1–9. [Google Scholar] [CrossRef]
- Nissimov, J.I.; Napier, J.A.; Kimmance, S.A.; Allen, M.J. Permanent draft genomes of four new coccolithoviruses: Ehv-18, ehv-145, ehv-156 and ehv-164. Mar. Genom. 2014, 15, 7–8. [Google Scholar] [CrossRef] [PubMed]
- Allen, M.J.; Martinez-Martinez, J.; Schroeder, D.C.; Somerfield, P.J.; Wilson, W.H. Use of microarrays to assess viral diversity: From genotype to phenotype. Environ. Microbiol. 2007, 9, 971–982. [Google Scholar] [CrossRef] [PubMed]
- Pagarete, A.; Kusonmano, K.; Petersen, K.; Kimmance, S.A.; Martinez, J.M.; Wilson, W.H.; Hehemann, J.H.; Allen, M.J.; Sandaa, R.A. Dip in the gene pool: Metagenomic survey of natural coccolithovirus communities. Virology 2014, 466, 129–137. [Google Scholar] [CrossRef] [PubMed]
- Pagarete, A.; Lanzen, A.; Puntervoll, P.; Sandaa, R.A.; Larsen, A.; Larsen, J.B.; Allen, M.J.; Bratbak, G. Genomic sequence and analysis of ehv-99b1, a new coccolithovirus from the norwegian fjords. Intervirology 2013, 56, 60–66. [Google Scholar] [CrossRef] [PubMed]
- Nissimov, J.I.; Worthy, C.A.; Rooks, P.; Napier, J.A.; Kimmance, S.A.; Henn, M.R.; Ogata, H.; Allen, M.J. Draft genome sequence of the coccolithovirus ehv-84. Stand. Genom. Sci. 2011, 5, 1–11. [Google Scholar] [CrossRef] [PubMed]
- Nissimov, J.I.; Worthy, C.A.; Rooks, P.; Napier, J.A.; Kimmance, S.A.; Henn, M.R.; Ogata, H.; Allen, M.J. Draft genome sequence of four coccolithoviruses: Emiliania huxleyi virus ehv-88, ehv-201, ehv-207, and ehv-208. J. Virol. 2012, 86, 2896–2897. [Google Scholar] [CrossRef] [PubMed]
- Nissimov, J.I.; Worthy, C.A.; Rooks, P.; Napier, J.A.; Kimmance, S.A.; Henn, M.R.; Ogata, H.; Allen, M.J. Draft genome sequence of the coccolithovirus Emiliania huxleyi virus 202. J. Virol. 2012, 86, 2380–2381. [Google Scholar] [CrossRef] [PubMed]
- Nissimov, J.I.; Worthy, C.A.; Rooks, P.; Napier, J.A.; Kimmance, S.A.; Henn, M.R.; Ogata, H.; Allen, M.J. Draft genome sequence of the coccolithovirus Emiliania huxleyi virus 203. J. Virol. 2011, 85, 13468–13469. [Google Scholar] [CrossRef] [PubMed]
- Pagarete, A.J. Functional Genomics of Coccolithophore Viruses. Ph.D. Thesis, Pierre and Marie Curie University, Paris, France, 2010; p. 222. [Google Scholar]
- Middelboe, M.; Jacquet, S.; Weinbauer, M. Viruses in freshwater ecosystems: An introduction to the exploration of viruses in new aquatic habitats. Freshw. Biol. 2008, 53, 1069–1075. [Google Scholar] [CrossRef]
- Bouvier, T.; del Giorgio, P.A. Key role of selective viral-induced mortality in determining marine bacterial community composition. Environ. Microbiol. 2007, 9, 287–297. [Google Scholar] [CrossRef] [PubMed]
- Chao, L.; Levin, B.R.; Stewart, F.M. A complex community in a simple habitat: An experimental study with bacteria and phage. Ecology 1977, 58, 369–378. [Google Scholar] [CrossRef]
- Lenski, R.E.; Levin, B.R. Constraints on the coevolution of bacteria and virulent phage: A model, some experiments, and predictions for natural communities. Am. Nat. 1985, 125, 585–602. [Google Scholar] [CrossRef]
- Thyrhaug, R.; Larsen, A.; Thingstad, T.F.; Bratbak, G. Stable coexistence in marine algal host-virus systems. Mar. Ecol. Prog. Ser. 2003, 254, 27–35. [Google Scholar] [CrossRef]
- Haaber, J.; Middelboe, M. Viral lysis of phaeocystis pouchetii: Implications for algal population dynamics and heterotrophic c, n and p cycling. ISME J. 2009, 3, 430–441. [Google Scholar] [CrossRef] [PubMed]
- Moebus, K. Marine bacteriophage reproduction under nutrient-limited growth of host bacteria.2. Investigations with phage-host system h3:H3/1. Mar. Ecol. Prog. Ser. 1996, 144, 13–22. [Google Scholar] [CrossRef]
- Moebus, K. Marine bacteriophage reproduction under nutrient-limited growth of host bacteria.1. Investigations with six phage-host systems. Mar. Ecol. Prog. Ser. 1996, 144, 1–12. [Google Scholar] [CrossRef]
- Parada, V.; Herndl, G.J.; Weinbauer, M.G. Viral burst size of heterotrophic prokaryotes in aquatic systems. J. Mar. Biol. Assoc. UK 2006, 86, 613–621. [Google Scholar] [CrossRef]
- Motegi, C.; Nagata, T. Enhancement of viral production by addition of nitrogen or nitrogen plus carbon in subtropical surface waters of the South Pacific. Aquat. Microb. Ecol. 2007, 48, 27–34. [Google Scholar] [CrossRef]
- Bratbak, G.; Jacobsen, A.; Heldal, M.; Nagasaki, K.; Thingstad, F. Virus production in phaeocystis pouchetii and its relation to host cell growth and nutrition. Aquat. Microb. Ecol. 1998, 16, 1–9. [Google Scholar] [CrossRef]
- Baudoux, A.-C.; Brussaard, C.P.D. Influence of irradiance on virus-algal host interactions. J. Phycol. 2008, 44, 902–908. [Google Scholar] [CrossRef] [PubMed]
- Demory, D.; Arsenieff, L.; Simon, N.; Six, C.; Rigaut-Jalabert, F.; Marie, D.; Ge, P.; Bigeard, E.; Jacquet, S.; Sciandra, A.; et al. Temperature is a key factor in micromonas–virus interactions. ISME J. 2017, 13, 601–612. [Google Scholar] [CrossRef] [PubMed]
- Maat, D.S.; Crawfurd, K.J.; Timmermans, K.R.; Brussaard, C.P.D. Elevated CO2 and phosphate limitation favor micromonas pusilla through stimulated growth and reduced viral impact. Appl. Environ. Microbiol. 2014, 80, 3119–3127. [Google Scholar] [CrossRef] [PubMed]
- Maat, D.S.; de Blok, R.; Brussaard, C.P.D. Combined phosphorus limitation and light stress prevent viral proliferation in the phytoplankton species phaeocystis globosa, but not in micromonas pusilla. Front. Mar. Sci. 2016, 3. [Google Scholar] [CrossRef]
- Kendrick, B.J.; DiTullio, G.R.; Cyronak, T.J.; Fulton, J.M.; van Mooy, B.A.S.; Bidle, K.D. Temperature-induced viral resistance in Emiliania huxleyi (prymnesiophyceae). PLoS ONE 2014, 9, e112134. [Google Scholar] [CrossRef] [PubMed]
- MacArthur, R.H.; Wilson, E.O. The Theory of Island Biogeography; Princeton University Press: Princeton, NJ, USA, 1967; p. 203. [Google Scholar]
- Klochkova, T.A.; Kang, S.H.; Cho, G.Y.; Pueschel, C.M.; West, J.A.; Kim, G.H. Biology of a terrestrial green alga, Chlorococcum sp. (chlorococcales, chlorophyta), collected from the miruksazi stupa in Korea. Phycologia 2006, 45, 349–358. [Google Scholar] [CrossRef]
- Wilson, W.H.; Tarran, G.A.; Schroeder, D.; Cox, M.; Oke, J.; Malin, G. Isolation of viruses responsible for the demise of an Emiliania huxleyi bloom in the english channel. J. Mar. Biol. Assoc. UK 2002, 82, 369–377. [Google Scholar] [CrossRef]
- Vaughn, J.M.; Balch, W.M.; Novotny, J.F.; Vining, C.L.; Palmer, C.D.; Drapeau, D.T.; Booth, E.; Vaughn, J.M.; Kneifel, D.M.; Bell, A.L. Isolation of Emiliania huxleyi viruses from the gulf of maine. Aquat. Microb. Ecol. 2010, 58, 109–116. [Google Scholar] [CrossRef]
- Highfield, A.; Evans, C.; Walne, A.; Miller, P.I.; Schroeder, D.C. How many coccolithovirus genotypes does it take to terminate an Emiliania huxleyi bloom? Virology 2014, 466, 138–145. [Google Scholar] [CrossRef] [PubMed]
- Martinez, J.M.; Schroeder, D.C.; Larsen, A.; Bratbak, G.; Wilson, W.H. Molecular dynamics of Emiliania huxleyi and cooccurring viruses during two separate mesocosm studies. Appl. Environ. Microbiol. 2007, 73, 554–562. [Google Scholar] [CrossRef] [PubMed]
- Sorensen, G.; Baker, A.C.; Hall, M.J.; Munn, C.B.; Schroeder, D.C. Novel virus dynamics in an Emiliania huxleyi bloom. J. Plankton Res. 2009, 31, 787–791. [Google Scholar] [CrossRef] [PubMed]
- Ruiz, E. Growth Rate Experiments in Emiliania Huxleyi; Universitetet I Bergen: Bergen, Norway, 2014. [Google Scholar]
- Brussaard, C.P.D.; Thyrhaug, R.; Marie, D.; Bratbak, G. Flow cytometric analyses of viral infection in two marine phytoplankton species, micromonas pusilla (prasinophyceae) and phaeocystis pouchetii (prymnesiophyceae). J. Phycol. 1999, 35, 941–948. [Google Scholar] [CrossRef]
- Brussaard, C.P.D.; Marie, D.; Bratbak, G. Flow cytometric detection of viruses. J. Virol. Methods 2000, 85, 175–182. [Google Scholar] [CrossRef]
- Brussaard, C.P.D.; Marie, D.; Thyrhaug, R.; Bratbak, G. Flow cytometric analysis of phytoplankton viability following viral infection. Aquat. Microb. Ecol. 2001, 26, 157–166. [Google Scholar] [CrossRef]
- Levasseur, M.; Thompson, P.A.; Harrison, P.J. Physiological acclimation of marine-phytoplankton to different nitrogen-sources. J. Phycol. 1993, 29, 587–595. [Google Scholar] [CrossRef]
- Almeida-Neto, M.; Guimaraes, P.; Guimaraes, P.R.; Loyola, R.D.; Ulrich, W. A consistent metric for nestedness analysis in ecological systems: Reconciling concept and measurement. Oikos 2008, 117, 1227–1239. [Google Scholar] [CrossRef]
- Newman, M.E.J. Modularity and community structure in networks. Proc. Natl. Acad. Sci. USA 2006, 103, 8577–8582. [Google Scholar] [CrossRef] [PubMed]
- Barber, M.J. Modularity and community detection in bipartite networks. Phys. Rev. E 2007, 76. [Google Scholar] [CrossRef] [PubMed]
- Våge, S.; Storesund, J.E.; Thingstad, T.F. Adding a cost of resistance description extends the ability of virus-host model to explain observed patterns in structure and function of pelagic microbial communities. Environ. Microbiol. 2013, 15, 1842–1852. [Google Scholar] [CrossRef] [PubMed]
- Avrani, S.; Lindell, D. Convergent evolution toward an improved growth rate and a reduced resistance range in prochlorococcus strains resistant to phage. Proc. Natl. Acad. Sci. USA 2015, 112, E2191–E2200. [Google Scholar] [CrossRef] [PubMed]
- Segev, E.; Wyche, T.P.; Kim, K.H.; Petersen, J.; Ellebrandt, C.; Vlamakis, H.; Barteneva, N.; Paulson, J.N.; Chai, L.; Clardy, J.; et al. Dynamic metabolic exchange governs a marine algal-bacterial interaction. Elife 2016, 5, e17473. [Google Scholar] [CrossRef] [PubMed]
- Marston, M.F.; Pierciey, F.J.; Shepard, A.; Gearin, G.; Qi, J.; Yandava, C.; Schuster, S.C.; Henn, M.R.; Martiny, J.B.H. Rapid diversification of coevolving marine synechococcus and a virus. Proc. Natl. Acad. Sci. USA 2012, 109, 4544–4549. [Google Scholar] [CrossRef] [PubMed]
- Avrani, S.; Schwartz, D.A.; Lindell, D. Virus-host swinging party in the oceans: Incorporating biological complexity into paradigms of antagonistic coexistence. Mob. Genet. Elements 2012, 2, 88–95. [Google Scholar] [CrossRef] [PubMed]
- Castillo, D.; Christiansen, R.H.; Espejo, R.; Middelboe, M. Diversity and geographical distribution of flavobacterium psychrophilum isolates and their phages: Patterns of susceptibility to phage infection and phage host range. Microb. Ecol. 2014, 67, 748–757. [Google Scholar] [CrossRef] [PubMed]
- Holt, R.D.; Grover, J.; Tilman, D. Simple rules for interspecific dominance in systems with exploitative and apparent competition. Am. Nat. 1994, 144, 741–771. [Google Scholar] [CrossRef]
- Leibold, M.A. A graphical model of keystone predators in food webs: Trophic regulation of abundance, incidence, and diversity patterns in communities. Am. Nat. 1996, 147, 784–812. [Google Scholar] [CrossRef]
- Lakeman, M.B.; von Dassow, P.; Cattolico, R.A. The strain concept in phytoplankton ecology. Harmful Algae 2009, 8, 746–758. [Google Scholar] [CrossRef]
- Nissimov, J.I.; Napier, J.A.; Allen, M.J.; Kimmance, S.A. Intragenus competition between coccolithoviruses: An insight on how a select few can come to dominate many. Environ. Microbiol. 2016, 18, 133–145. [Google Scholar] [CrossRef] [PubMed]
- Duffy, S.; Turner, P.E.; Burch, C.L. Pleiotropic costs of niche expansion in the RNA bacteriophage phi 6. Genetics 2006, 172, 751–757. [Google Scholar] [CrossRef] [PubMed]
- Elena, S.F.; Agudelo-Romero, P.; Lalic, J. The evolution of viruses in multi-host fitness landscapes. Open Virol. J. 2009, 3, 1–6. [Google Scholar] [CrossRef] [PubMed]
- Nikolin, V.M.; Osterrieder, K.; von Messling, V.; Hofer, H.; Anderson, D.; Dubovi, E.; Brunner, E.; East, M.L. Antagonistic pleiotropy and fitness trade-offs reveal specialist and generalist traits in strains of canine distemper virus. PLoS ONE 2012, 7, e50955. [Google Scholar] [CrossRef]
- Keen, E.C. Tradeoffs in bacteriophage life histories. Bacteriophage 2014, 4, e28365. [Google Scholar] [CrossRef] [PubMed]
- Bedhomme, S.; Lafforgue, G.; Elena, S.F. Multihost experimental evolution of a plant rna virus reveals local adaptation and host-specific mutations. Mol. Biol. Evol. 2012, 29, 1481–1492. [Google Scholar] [CrossRef] [PubMed]
- Agrawal, A.F.; Lively, C.M. Modelling infection as a two-step process combining gene-for-gene and matching-allele genetics. Proc. R. Soc. B-Biol. Sci. 2003, 270, 323–334. [Google Scholar] [CrossRef] [PubMed]
- Flor, H.H. Host-parasite interaction in flax rust—Its genetics and other implications. Phytopathology 1955, 45, 680–685. [Google Scholar]
- Inouye, B.; Stinchcombe, J.R. Relationships between ecological interaction modifications and diffuse coevolution: Similarities, differences, and causal links. Oikos 2001, 95, 353–360. [Google Scholar] [CrossRef]
- Rowe, J.M.; Fabre, M.F.; Gobena, D.; Wilson, W.H.; Wilhelm, S.W. Application of the major capsid protein as a marker of the phylogenetic diversity of Emiliania huxleyi viruses. FEMS Microbiol. Ecol. 2011, 76, 373–380. [Google Scholar] [CrossRef] [PubMed]
- Mackinder, L.C.M.; Worthy, C.A.; Biggi, G.; Hall, M.; Ryan, K.P.; Varsani, A.; Harper, G.M.; Wilson, W.H.; Brownlee, C.; Schroeder, D.C. A unicellular algal virus, Emiliania huxleyi virus 86, exploits an animal-like infection strategy. J. Gen. Virol. 2009, 90, 2306–2316. [Google Scholar] [CrossRef] [PubMed]
- Allen, M.J.; Howard, J.A.; Lilley, K.S.; Wilson, W.H. Proteomic analysis of the ehv-86 virion. Proteome Sci. 2008, 6. [Google Scholar] [CrossRef] [PubMed]
- Medlin, L.K.; Barker, G.L.A.; Campbell, L.; Green, J.C.; Hayes, P.K.; Marie, D.; Wrieden, S.; Vaulot, D. Genetic characterisation of Emiliania huxleyi (haptophyta). J. Mar. Syst. 1996, 9, 13–31. [Google Scholar] [CrossRef]
- Iglesias-Rodriguez, M.D.; Schofield, O.M.; Batley, J.; Medlin, L.K.; Hayes, P.K. Intraspecific genetic diversity in the marine coccolithophore Emiliania huxleyi (prymnesiophyceae): The use of microsatellite analysis in marine phytoplankton population studies. J. Phycol. 2006, 42, 526–536. [Google Scholar] [CrossRef]
- Blanco-Ameijeiras, S.; Lebrato, M.; Stoll, H.M.; Iglesias-Rodriguez, D.; Muller, M.N.; Mendez-Vicente, A.; Oschlies, A. Phenotypic variability in the coccolithophore Emiliania huxleyi. PLoS ONE 2016, 11, e0157697. [Google Scholar] [CrossRef] [PubMed]
- Paasche, E. A review of the coccolithophorid Emiliania huxleyi (prymnesiophyceae), with particular reference to growth, coccolith formation, and calcification-photosynthesis interactions. Phycologia 2001, 40, 503–529. [Google Scholar] [CrossRef]
- Kegel, J.U.; John, U.; Valentin, K.; Frickenhaus, S. Genome variations associated with viral susceptibility and calcification in Emiliania huxleyi. PLoS ONE 2013, 8, e80684. [Google Scholar] [CrossRef] [PubMed]
- Young, J.R.; Westbroek, P. Genotypic variation in the coccolithophorid species Emiliania-huxleyi. Mar. Micropaleontol. 1991, 18, 5–23. [Google Scholar] [CrossRef]
- Young, J.R. A Guide to Extant Coccolithophore Taxonomy; International Nannoplankton Association: Bremerhaven, Germany, 2003; p. 121. [Google Scholar]
- Cook, S.S.; Whitlock, L.; Wright, S.W.; Hallegraeff, G.M. Photosynthetic pigment and genetic differences between two southern ocean morphotypes of Emiliania huxleyi (haptophyta). J. Phycol. 2011, 47, 615–626. [Google Scholar] [CrossRef] [PubMed]
- Hagino, K.; Bendif, E.; Young, J.R.; Kogame, K.; Probert, I.; Takano, Y.; Horiguchi, T.; de Vargas, C.; Okada, H. New evidence for morphological and genetic variation in the cosmopolitan coccolithophore Emiliania huxleyi (prymnesiophyceae) from the cox1b-atp4 genes. J. Phycol. 2011, 47, 1164–1176. [Google Scholar] [CrossRef] [PubMed]
- Coolen, M.J.L. 7000 years of Emiliania huxleyi viruses in the black sea. Science 2011, 333, 451–452. [Google Scholar] [CrossRef] [PubMed]

| Number | Hypothesis | Reference |
|---|---|---|
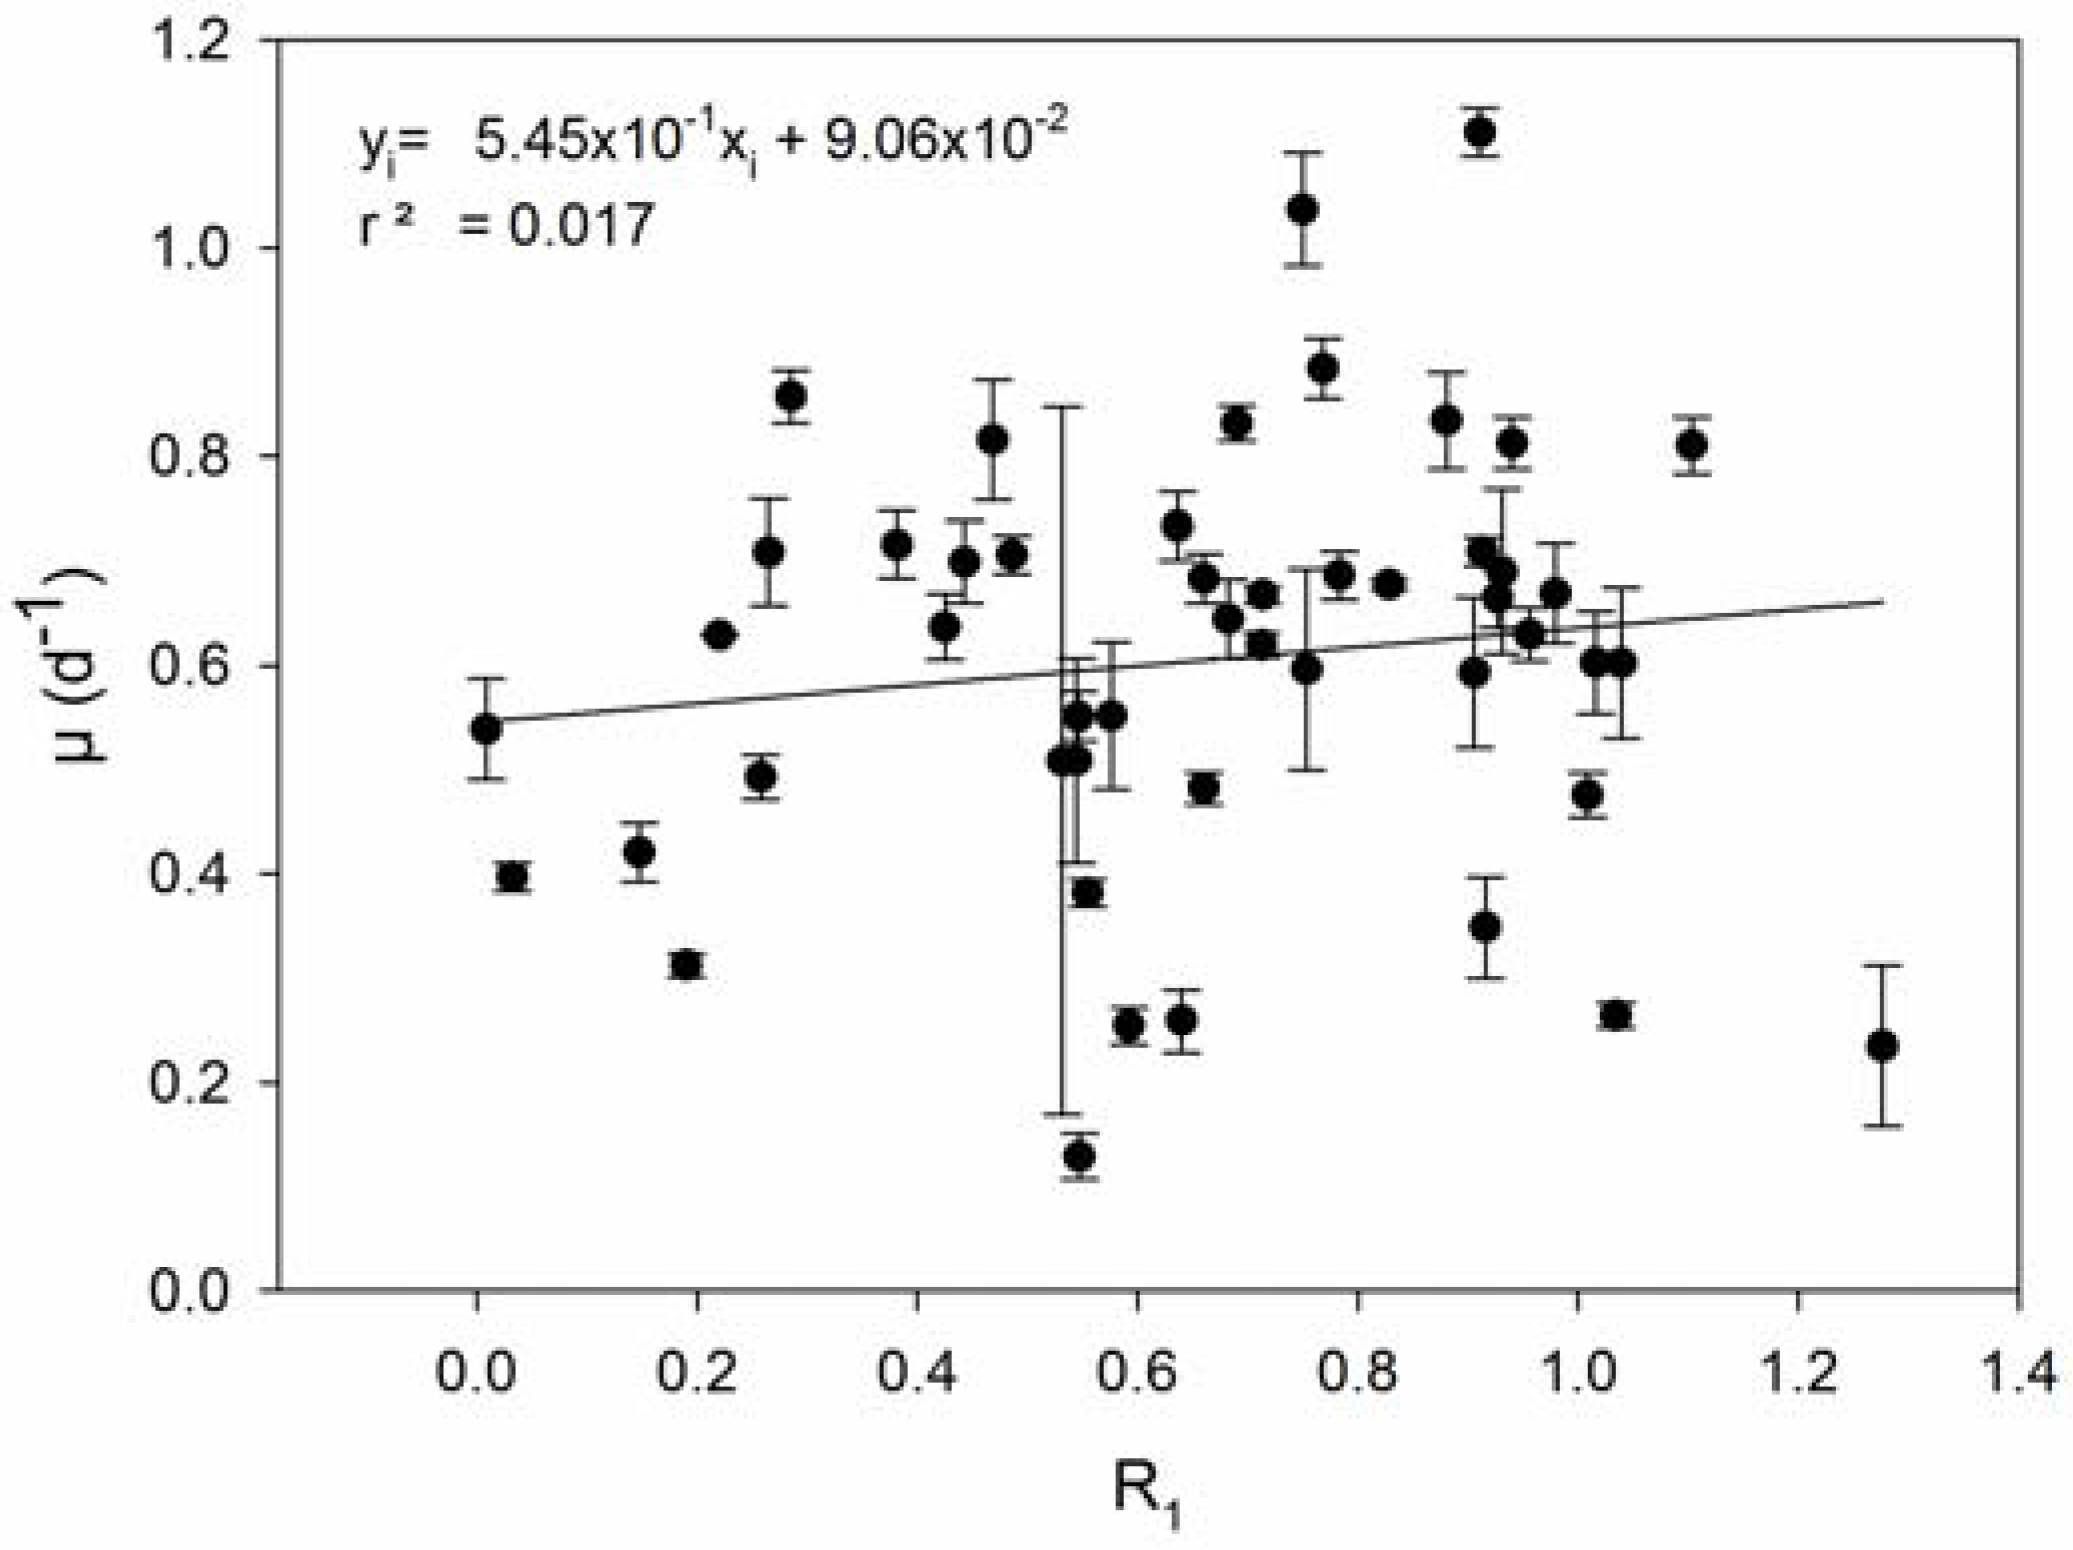
| 1 | Resistance is associated with reduced growth rates (COR). | Prokaryotes: [23,24,25,27,28,29,52,53,54,55] Eukaryotes: [35,36,56,57] |
| 2 | Host strains with higher µ produce more viruses. | [58,59,60,61,62,63,64,65,66] |
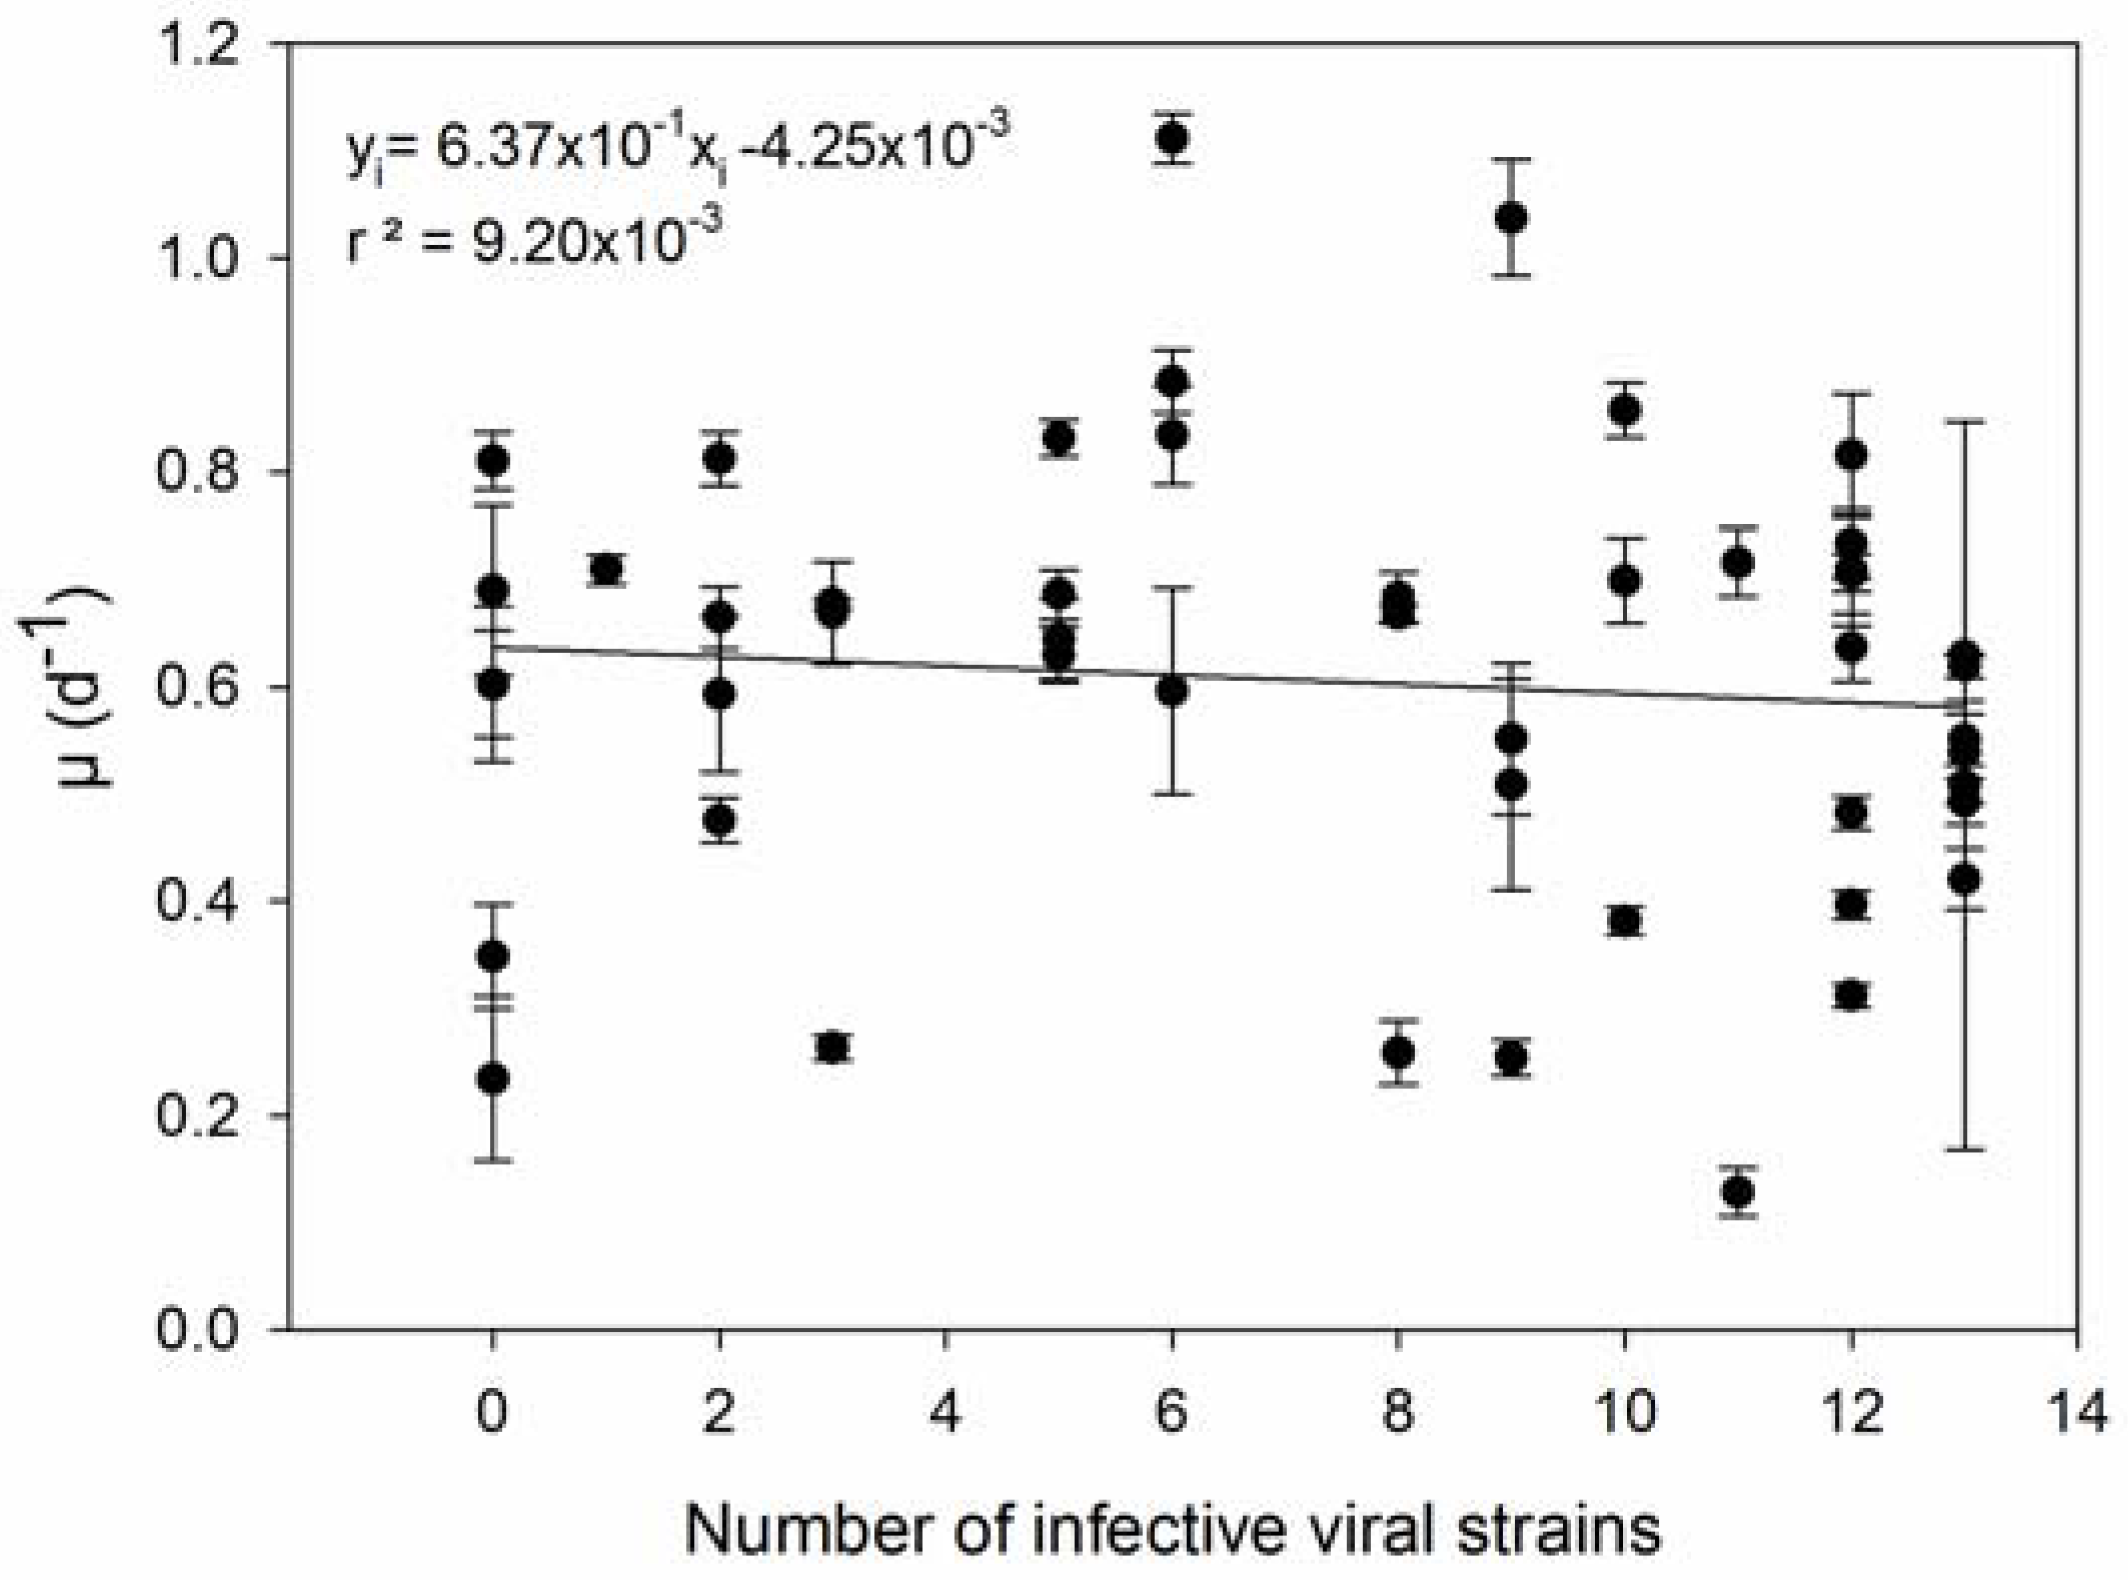
| 3 | Host strains with higher µ are infected by more viral strains. | [36] |
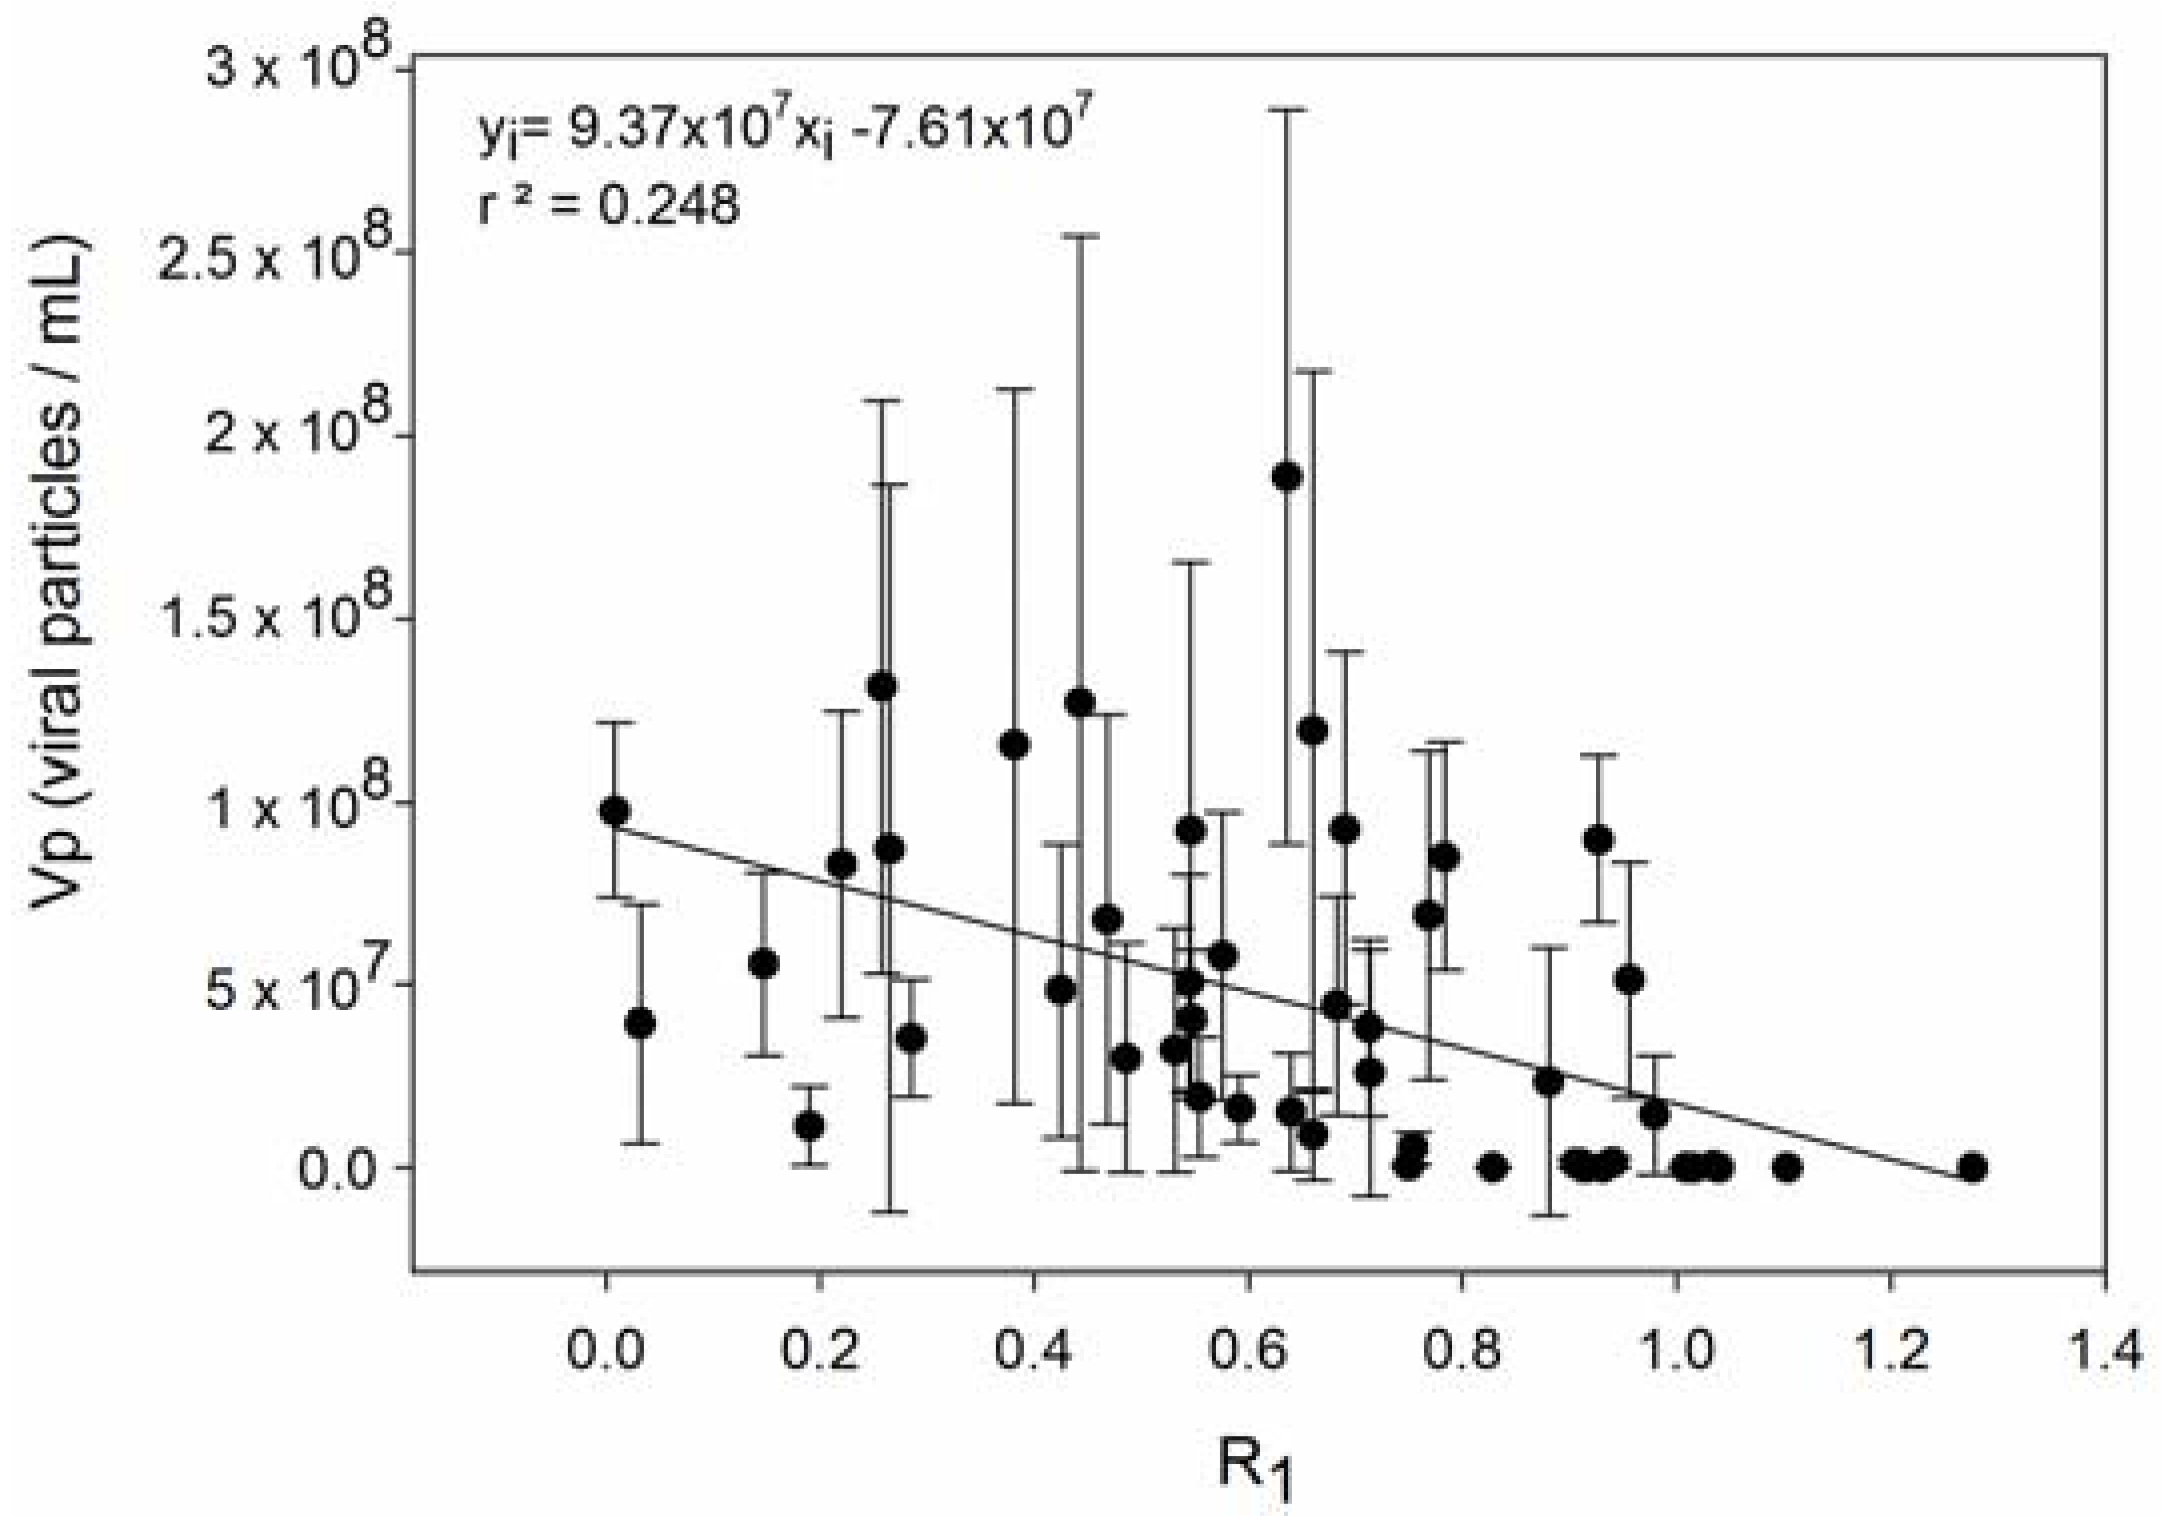
| 4 | Host strains with higher R produce fewer viruses. | [56,67] |
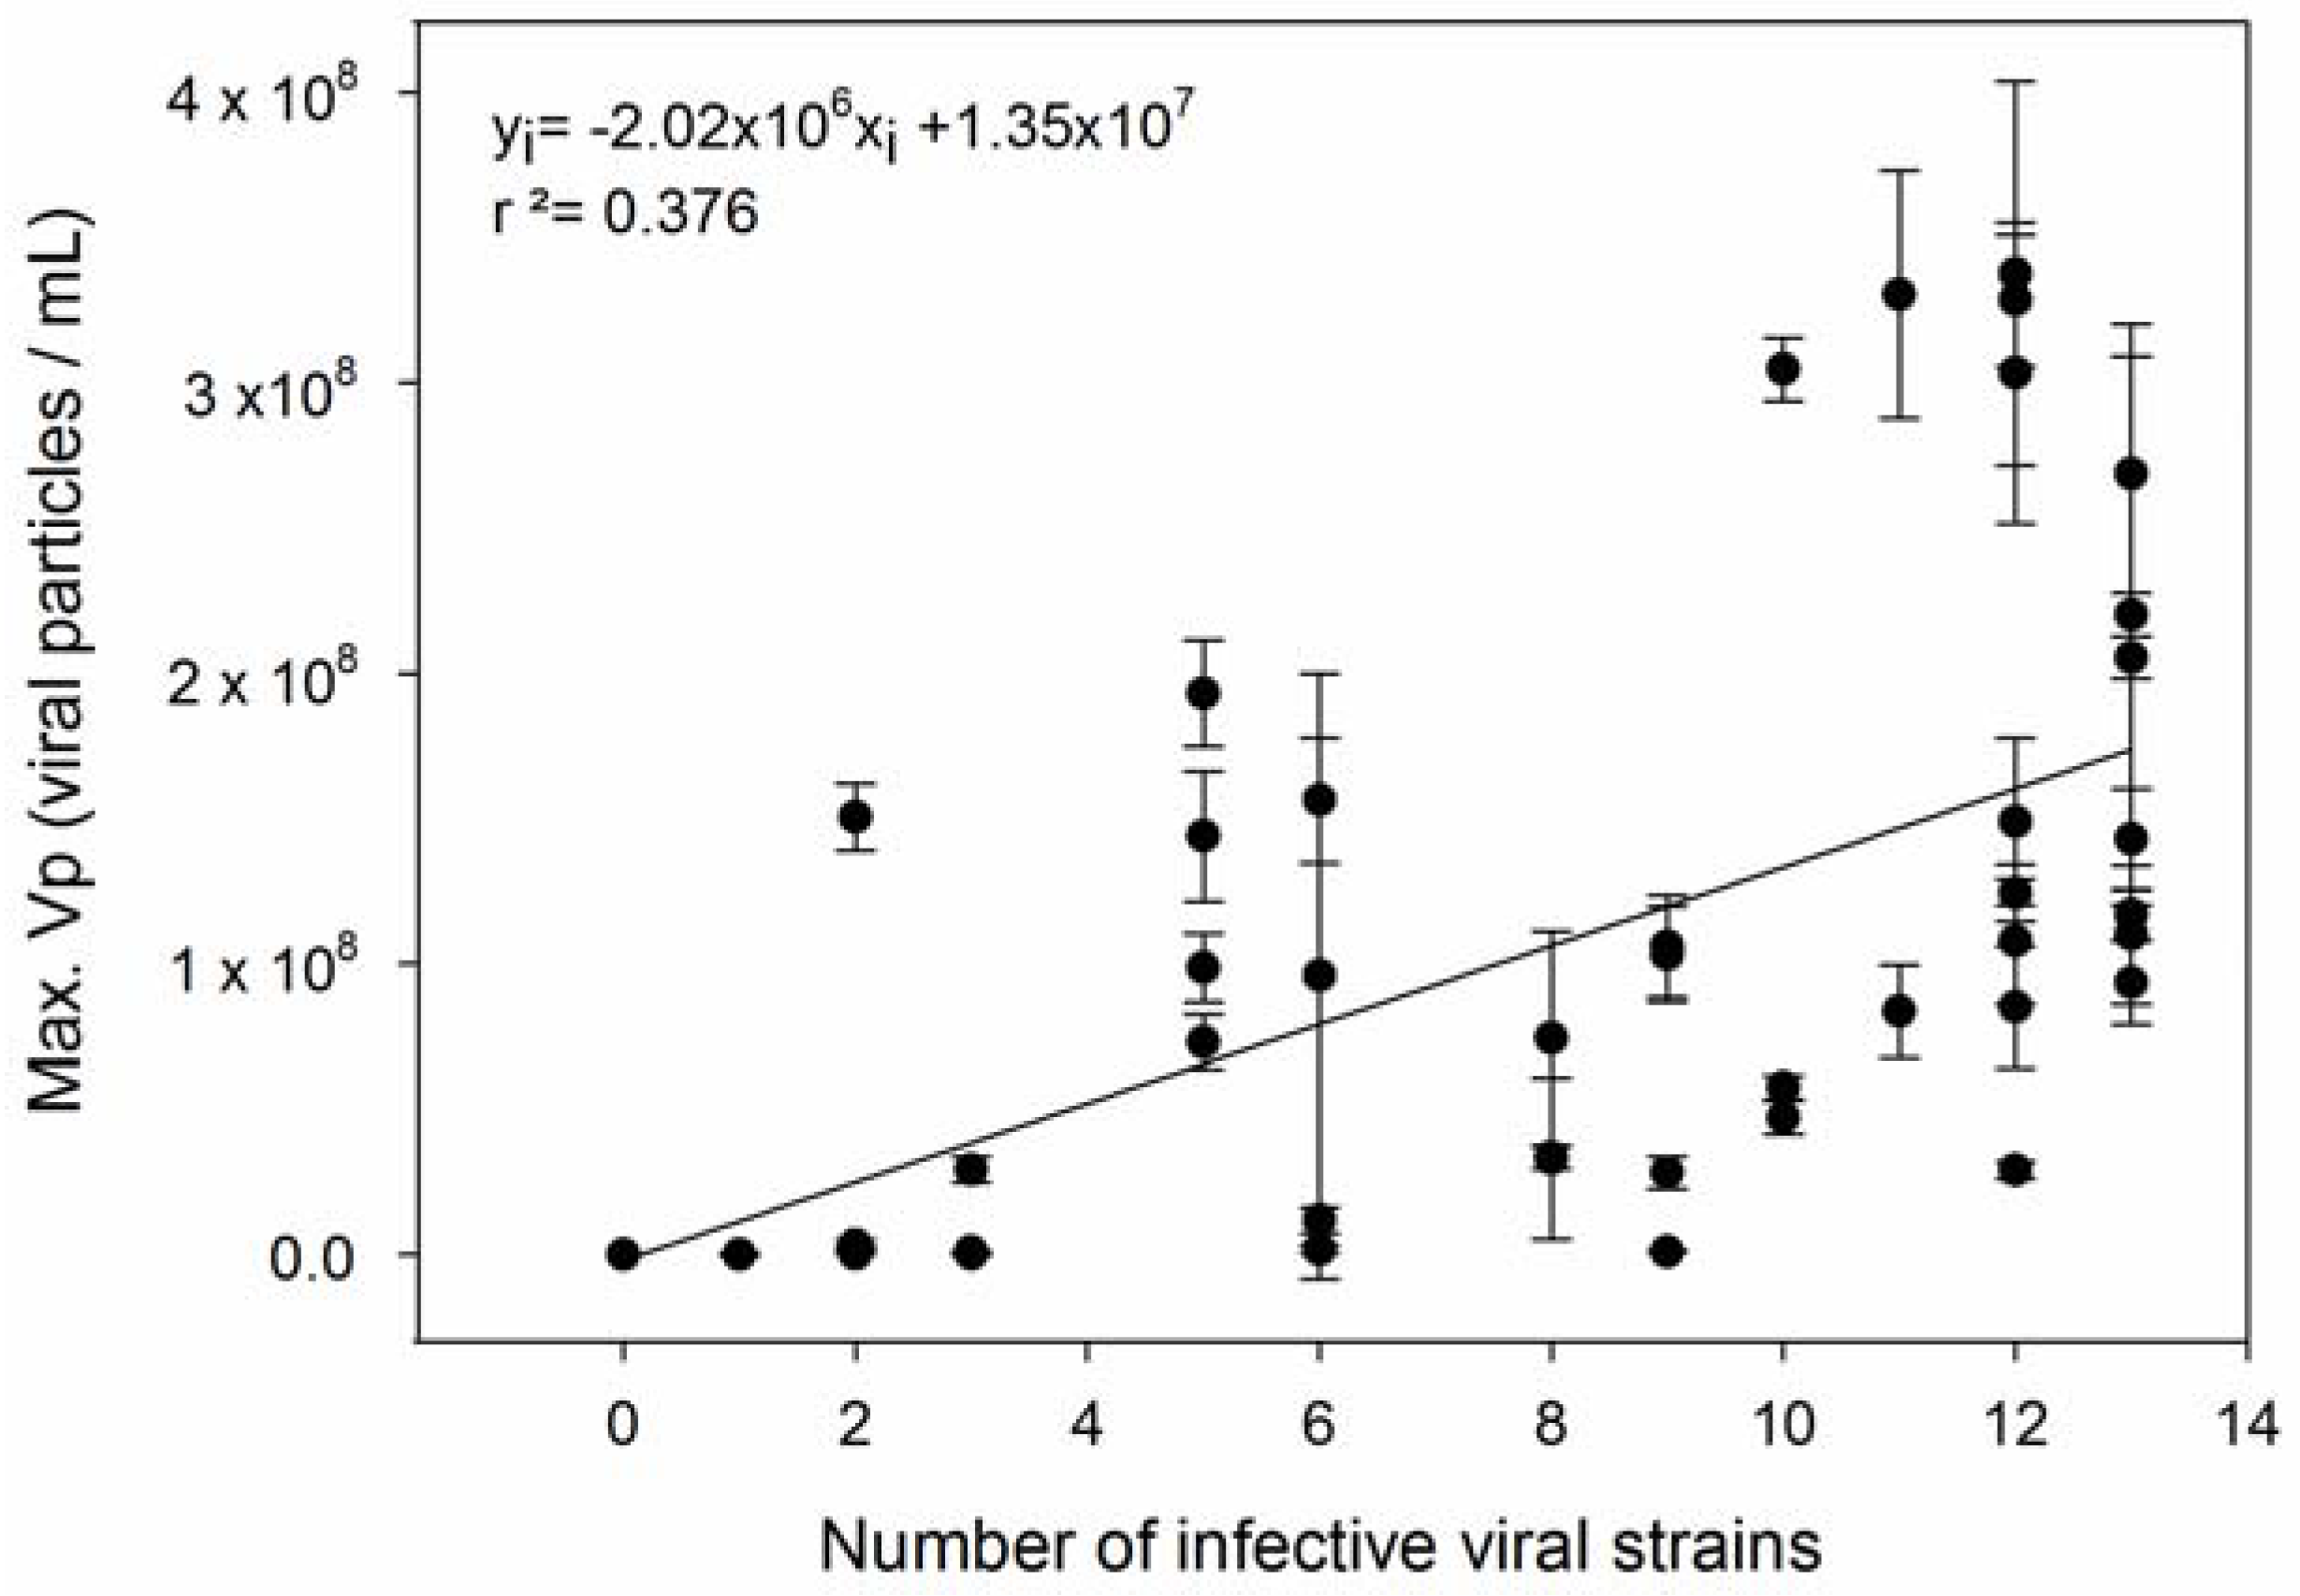
| 5 | Specialist viruses have higher Vp than generalists. | [14,68] |
© 2017 by the authors. Licensee MDPI, Basel, Switzerland. This article is an open access article distributed under the terms and conditions of the Creative Commons Attribution (CC BY) license ( http://creativecommons.org/licenses/by/4.0/).
Share and Cite
Ruiz, E.; Oosterhof, M.; Sandaa, R.-A.; Larsen, A.; Pagarete, A. Emerging Interaction Patterns in the Emiliania huxleyi-EhV System. Viruses 2017, 9, 61. https://doi.org/10.3390/v9030061
Ruiz E, Oosterhof M, Sandaa R-A, Larsen A, Pagarete A. Emerging Interaction Patterns in the Emiliania huxleyi-EhV System. Viruses. 2017; 9(3):61. https://doi.org/10.3390/v9030061
Chicago/Turabian StyleRuiz, Eliana, Monique Oosterhof, Ruth-Anne Sandaa, Aud Larsen, and António Pagarete. 2017. "Emerging Interaction Patterns in the Emiliania huxleyi-EhV System" Viruses 9, no. 3: 61. https://doi.org/10.3390/v9030061
APA StyleRuiz, E., Oosterhof, M., Sandaa, R.-A., Larsen, A., & Pagarete, A. (2017). Emerging Interaction Patterns in the Emiliania huxleyi-EhV System. Viruses, 9(3), 61. https://doi.org/10.3390/v9030061