
Detecting Selection in the HIV-1 Genome during Sexual Transmission Events

 , , , , , , , , and
Abstract
:
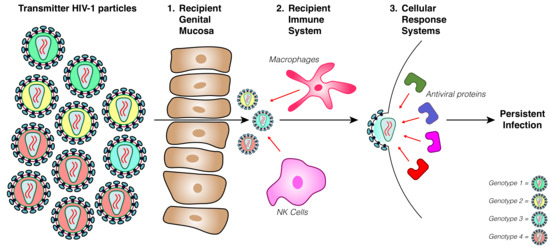
1. Introduction
2. Materials and Methods
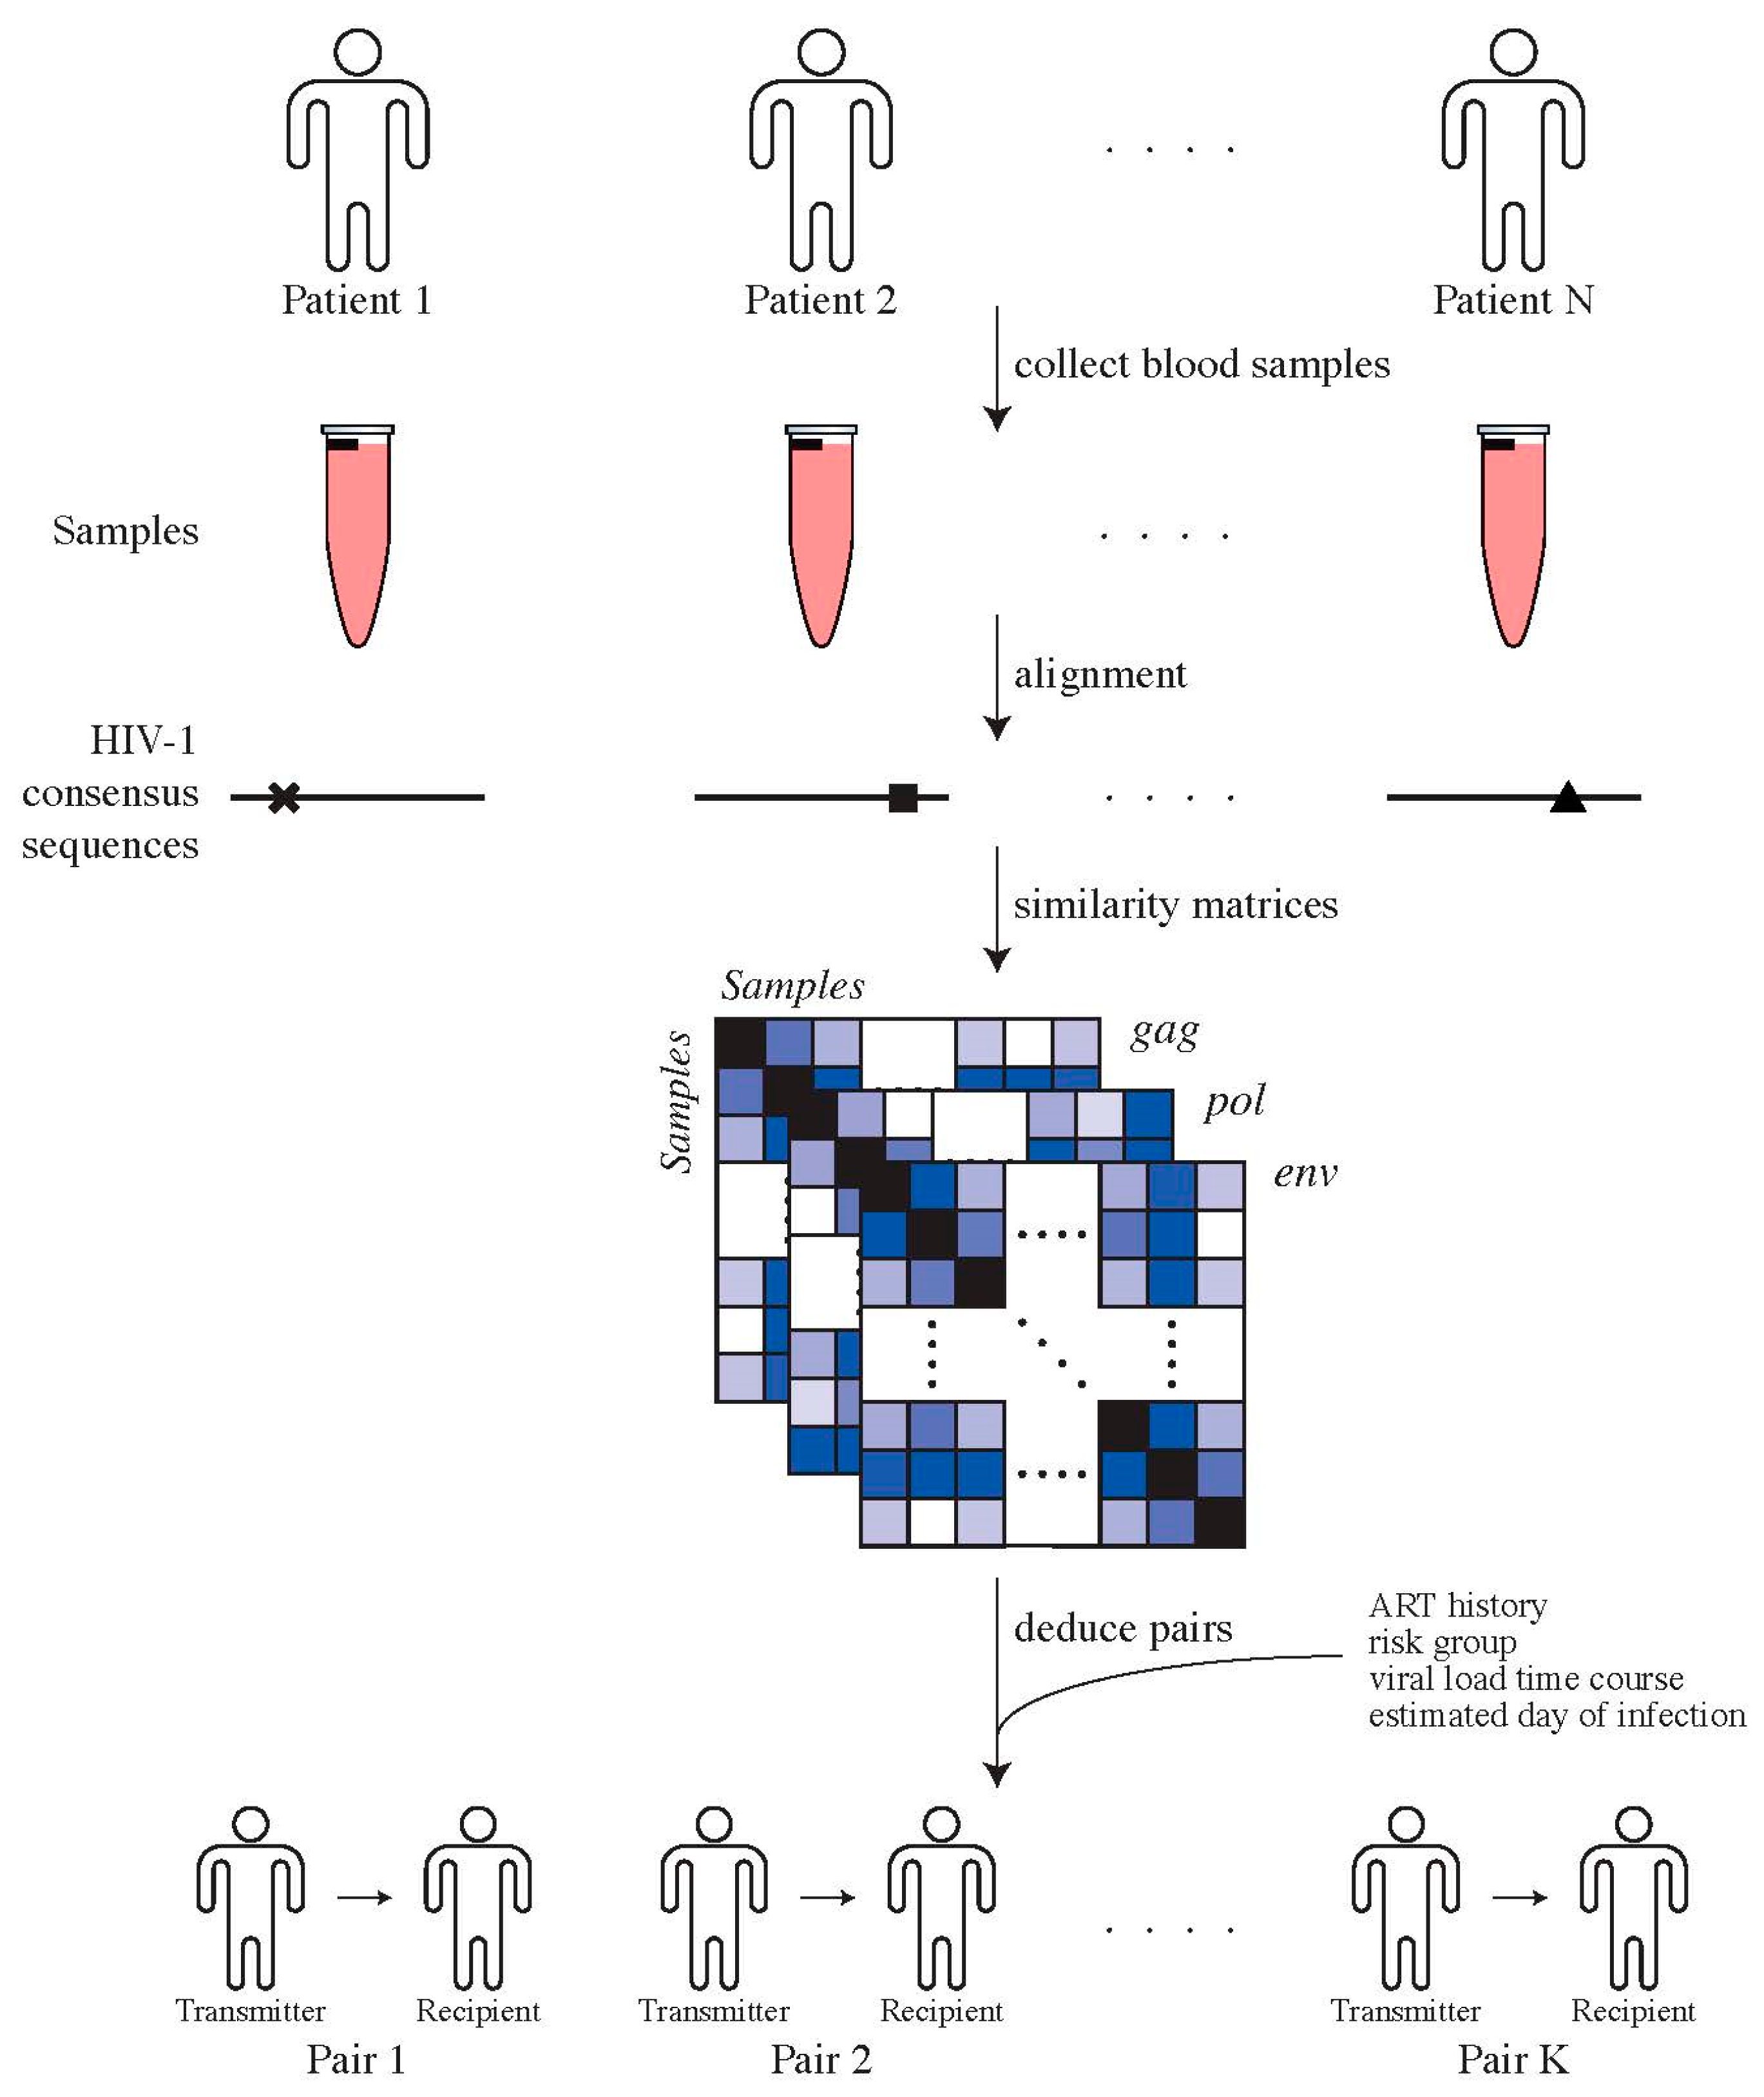
2.1. Study Design
2.2. Determining Transmitter–Recipient Relationships
2.3. Next-Generation Sequencing (NGS) Data Generation and Analysis
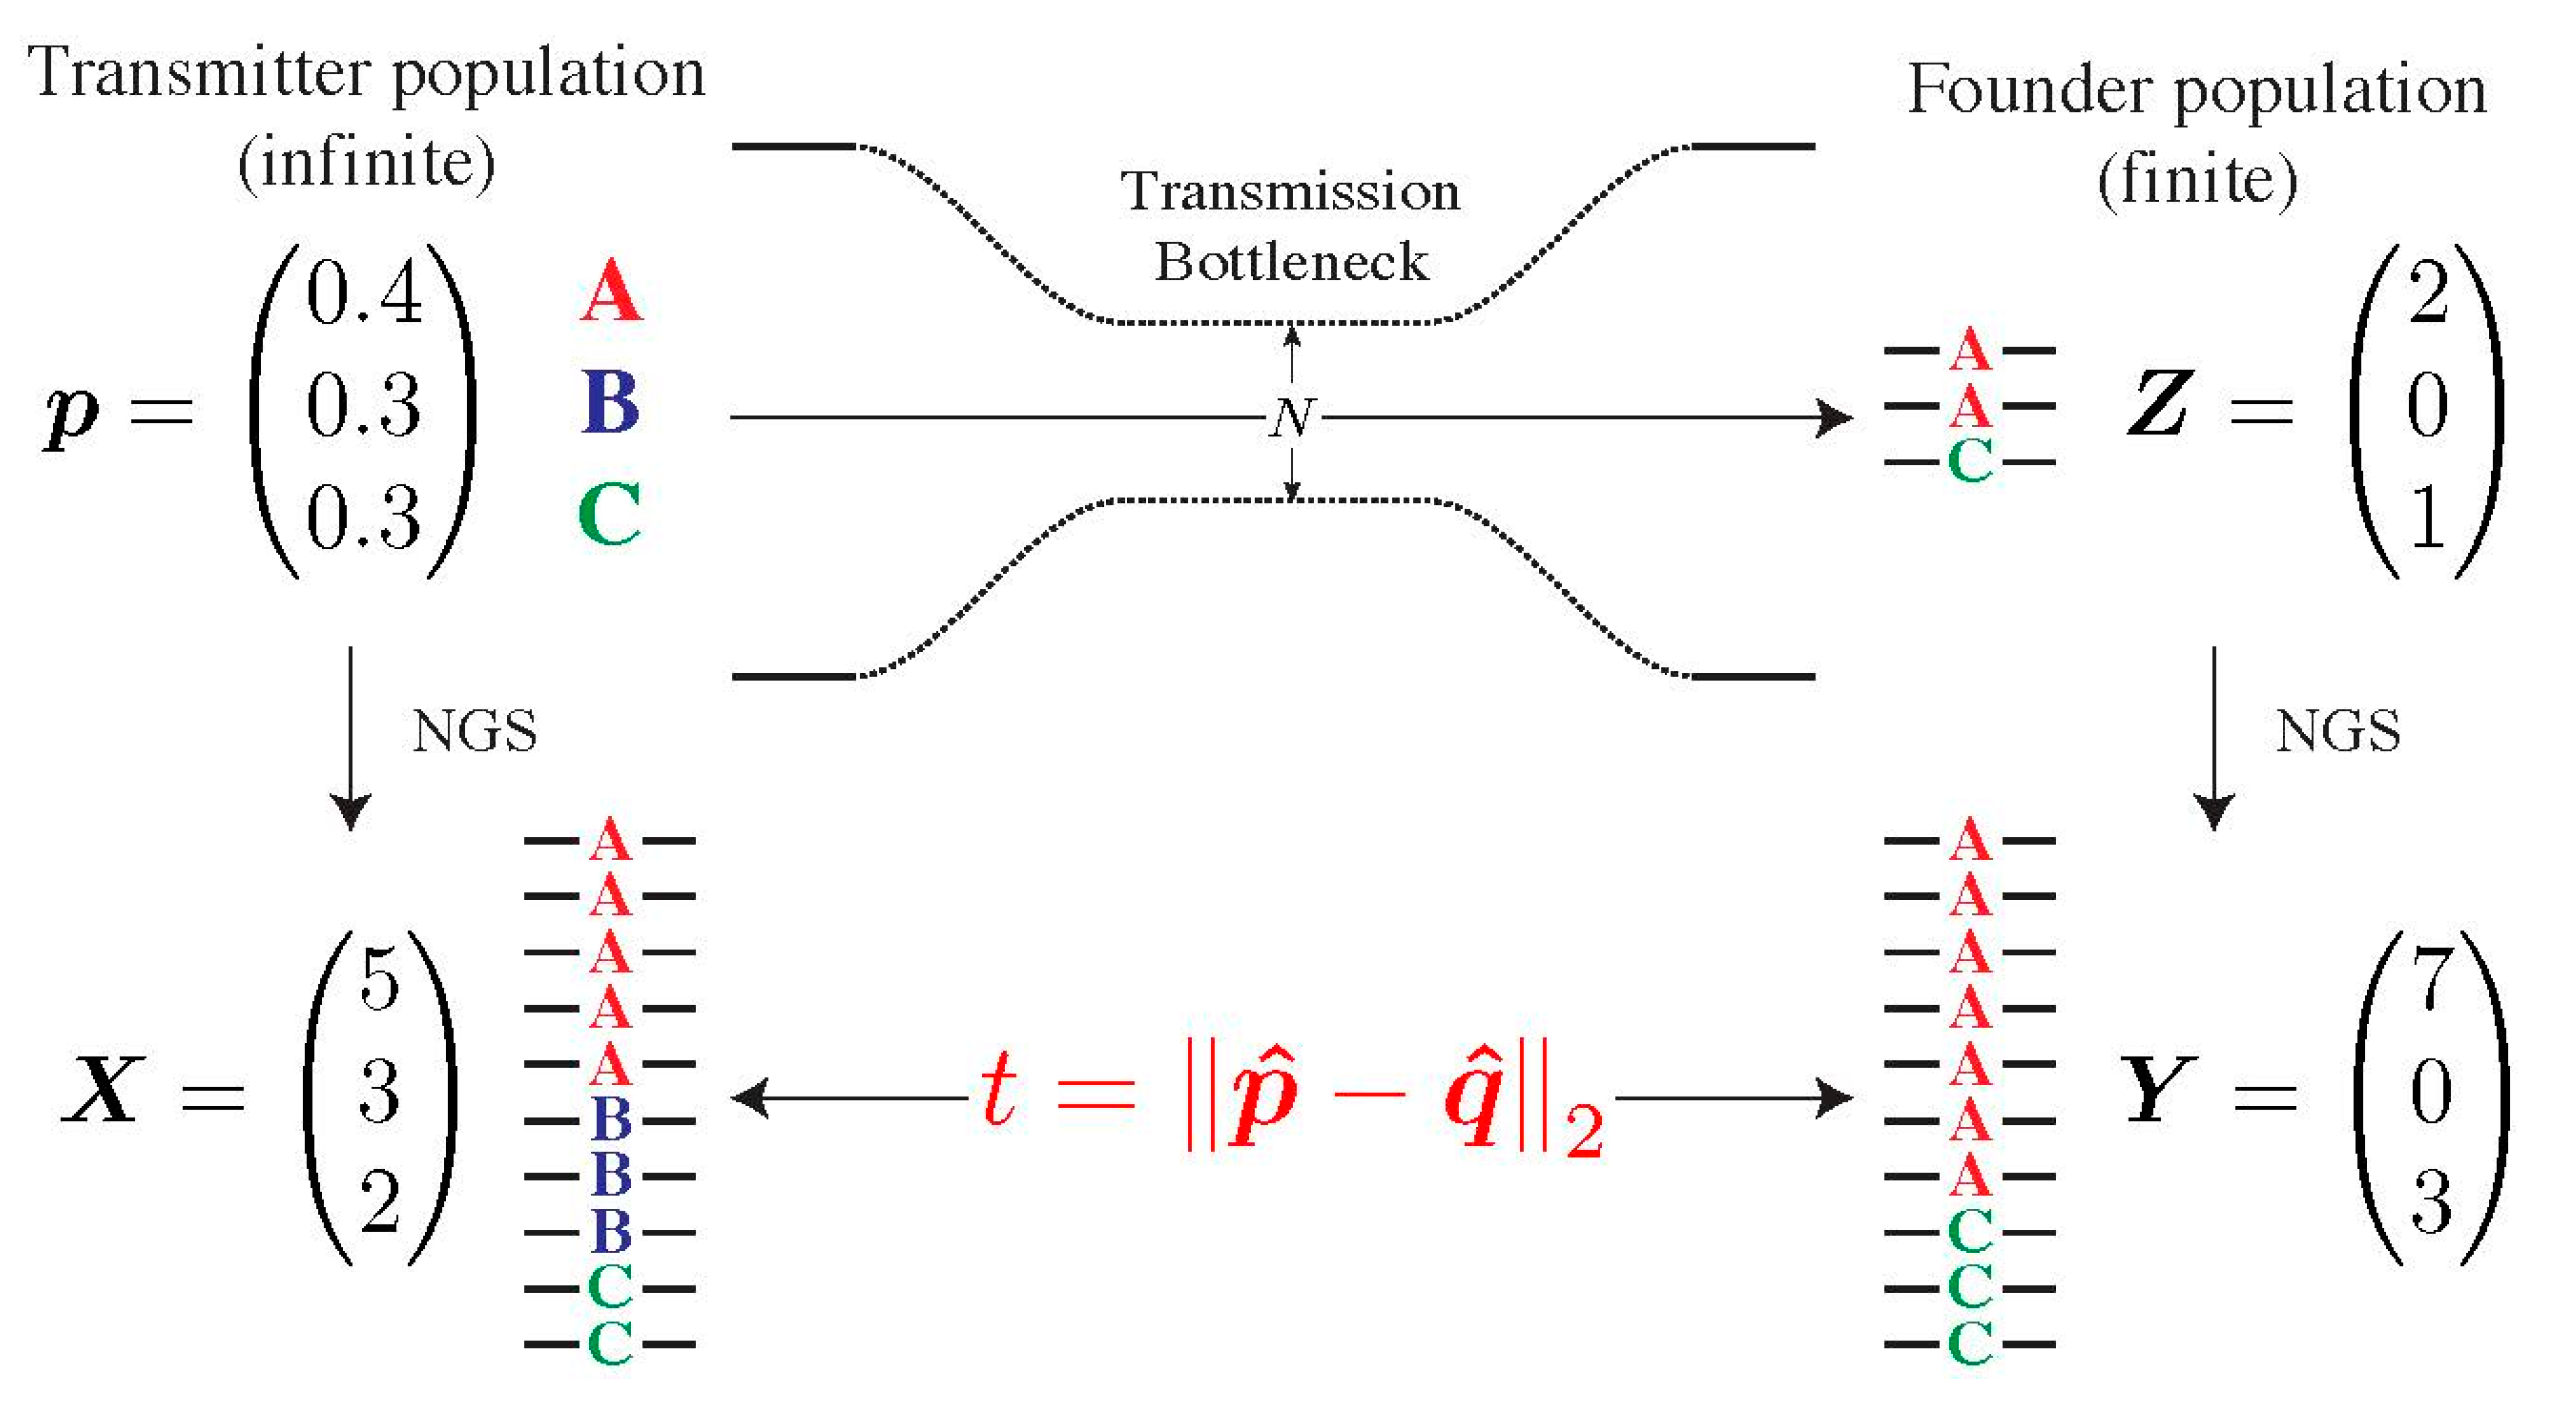
2.4. Testing for Selection during Transmission
2.5. Assessing the Specificity of Our Model
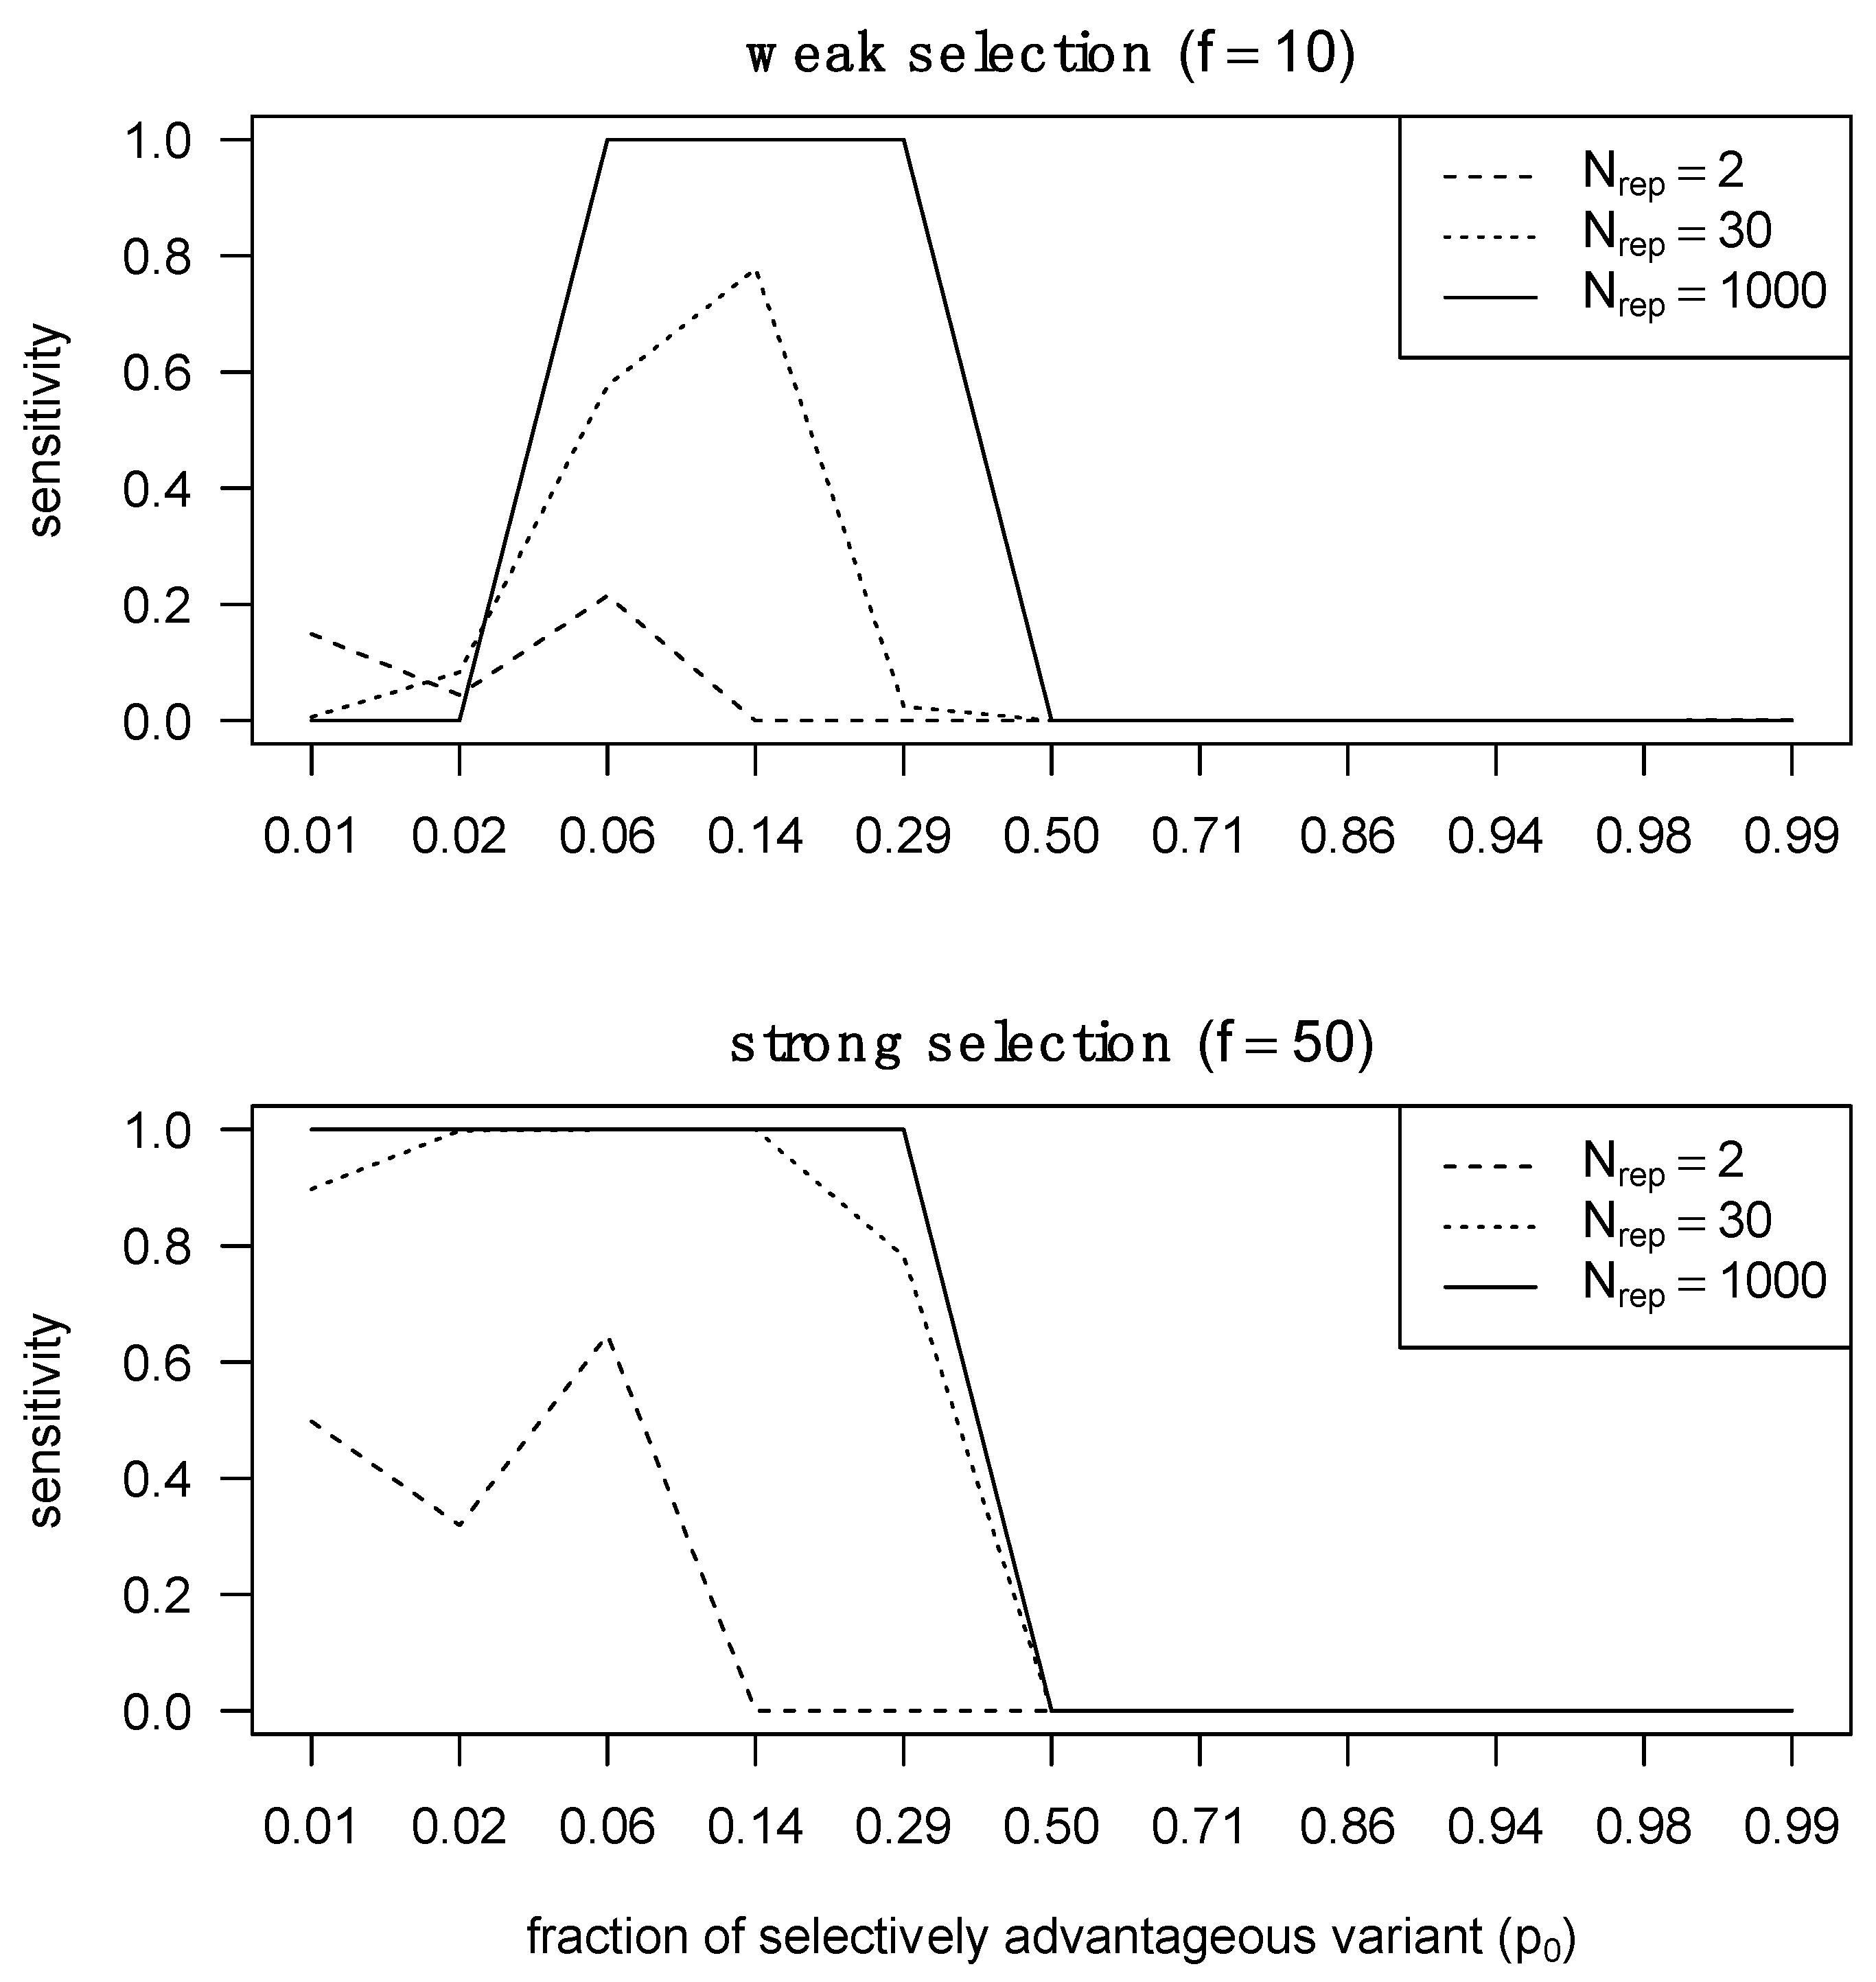
2.6. Assessing the Sensitivity of SeTesT
2.7. Combining Data Sets to Increase Power
2.8. Assessing the Effect of Early Sampling
3. Results
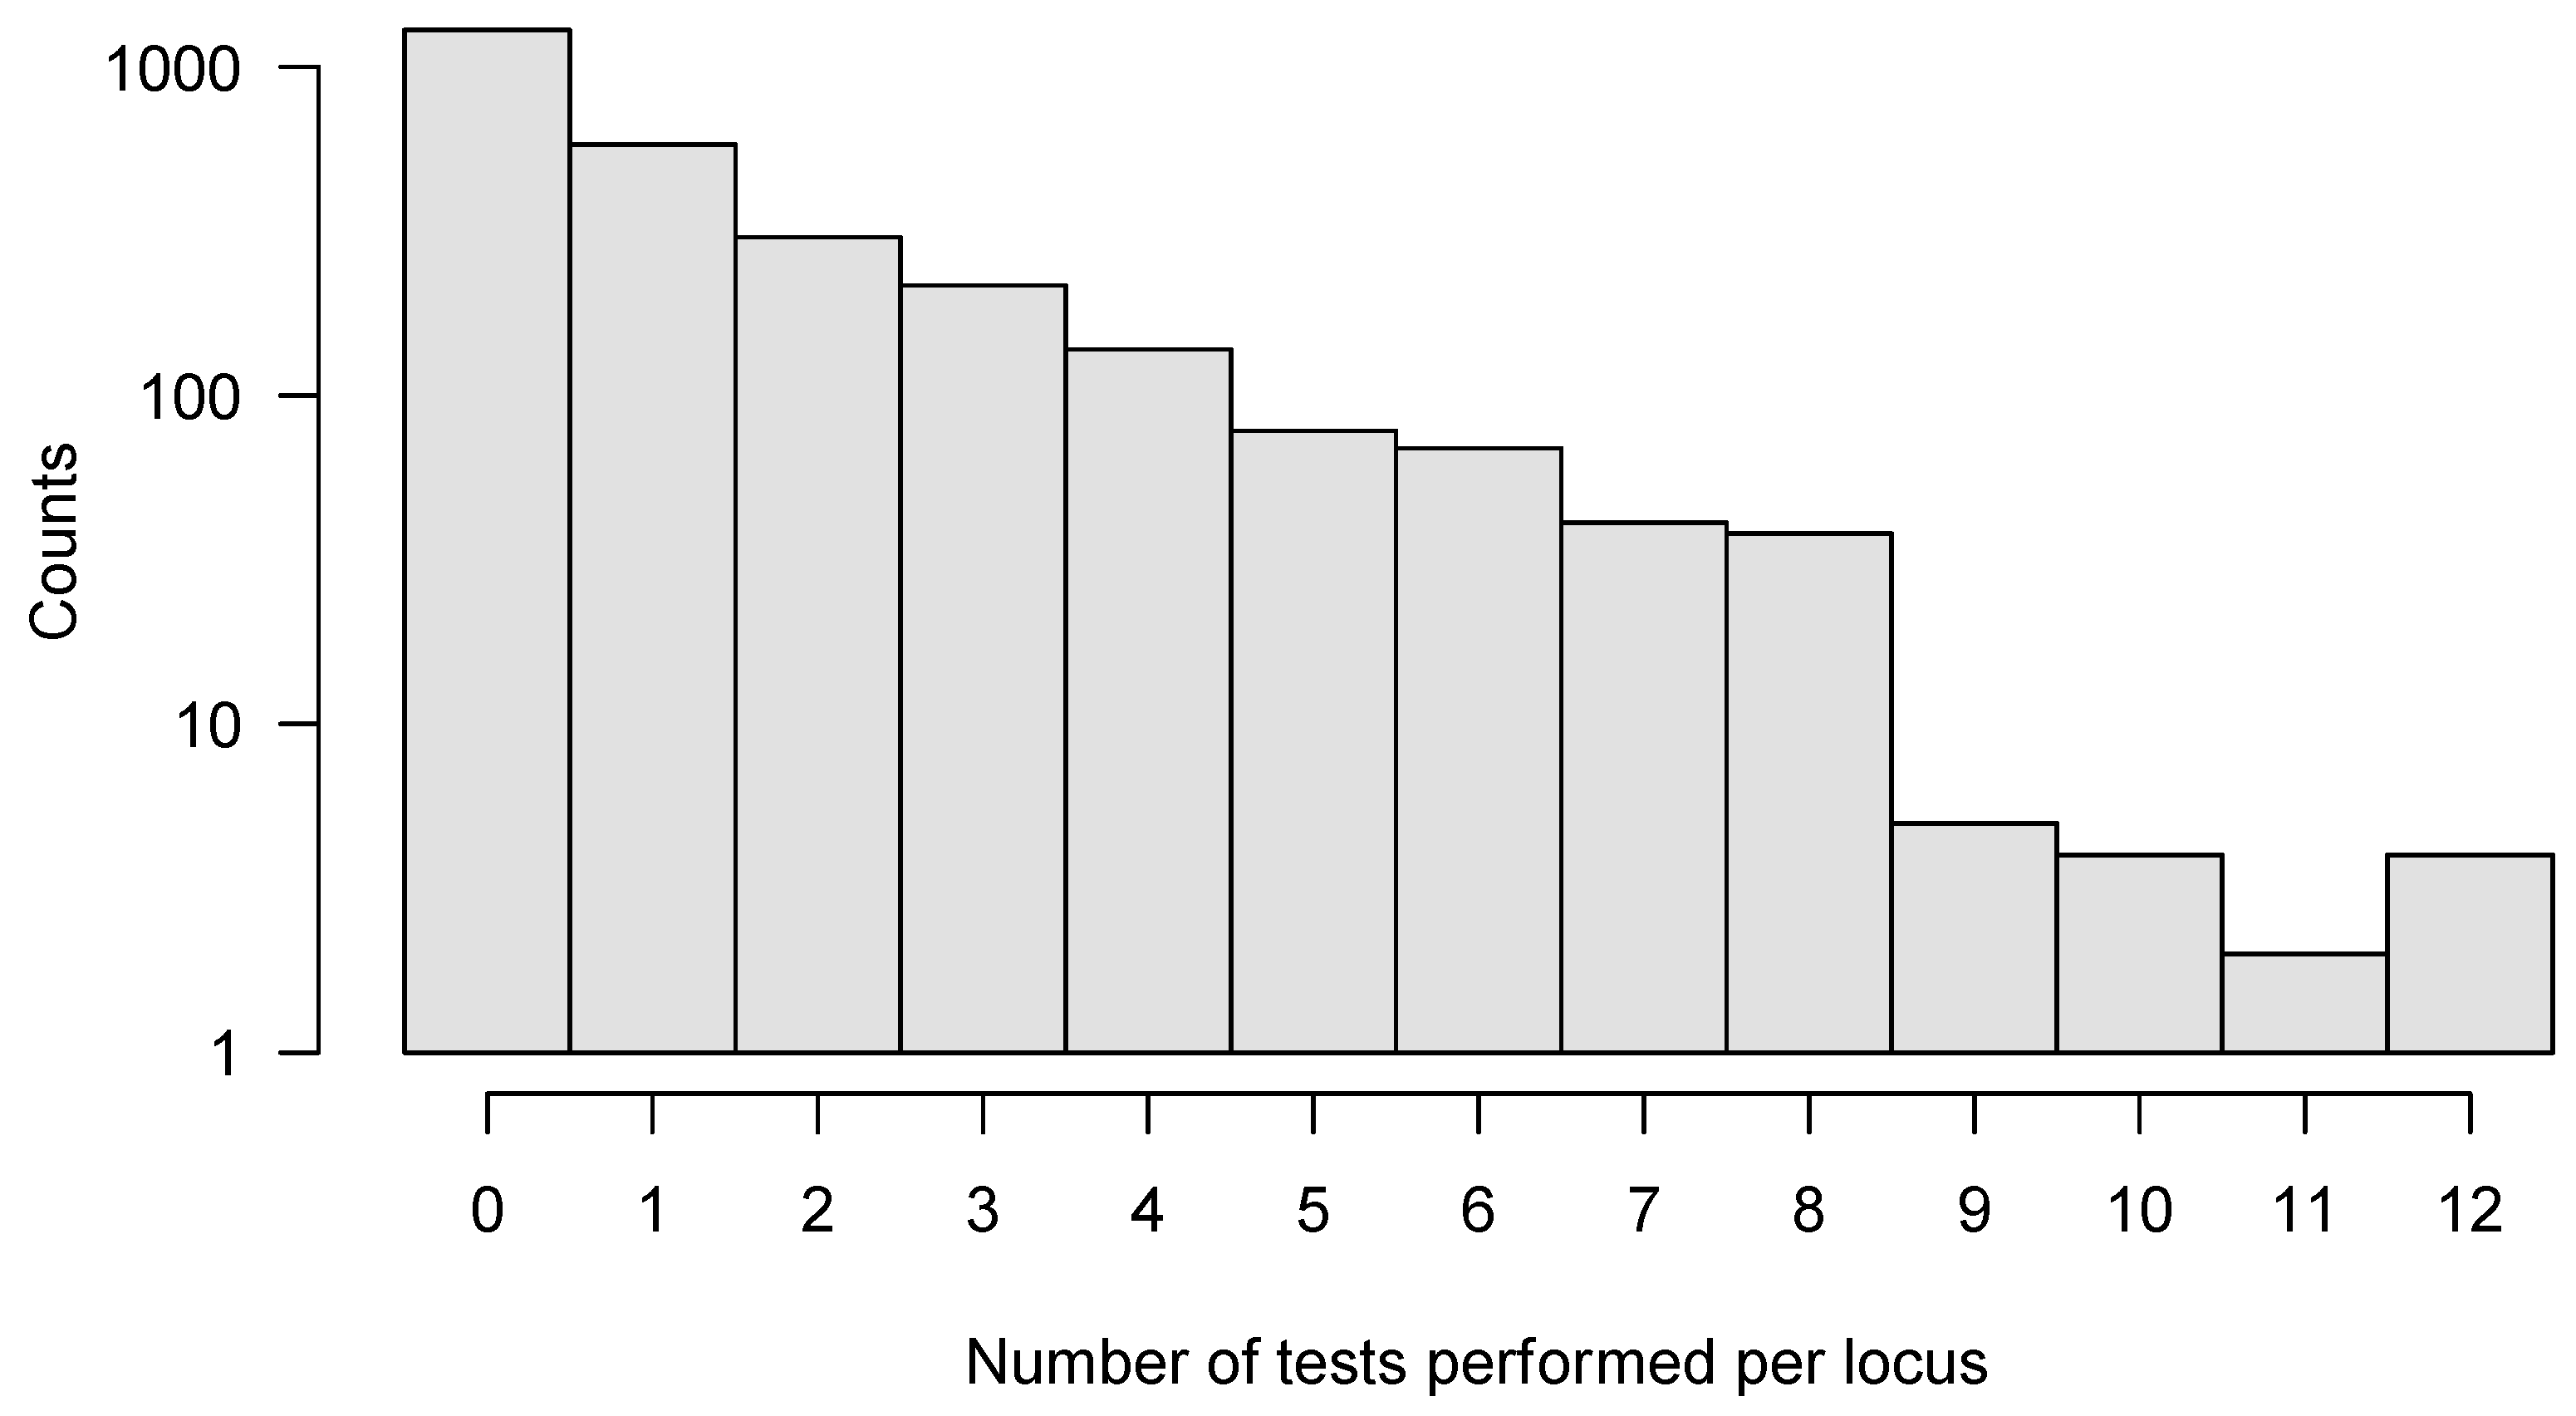
3.1. Detecting Selection Is Compromised by the Transmission Bottleneck
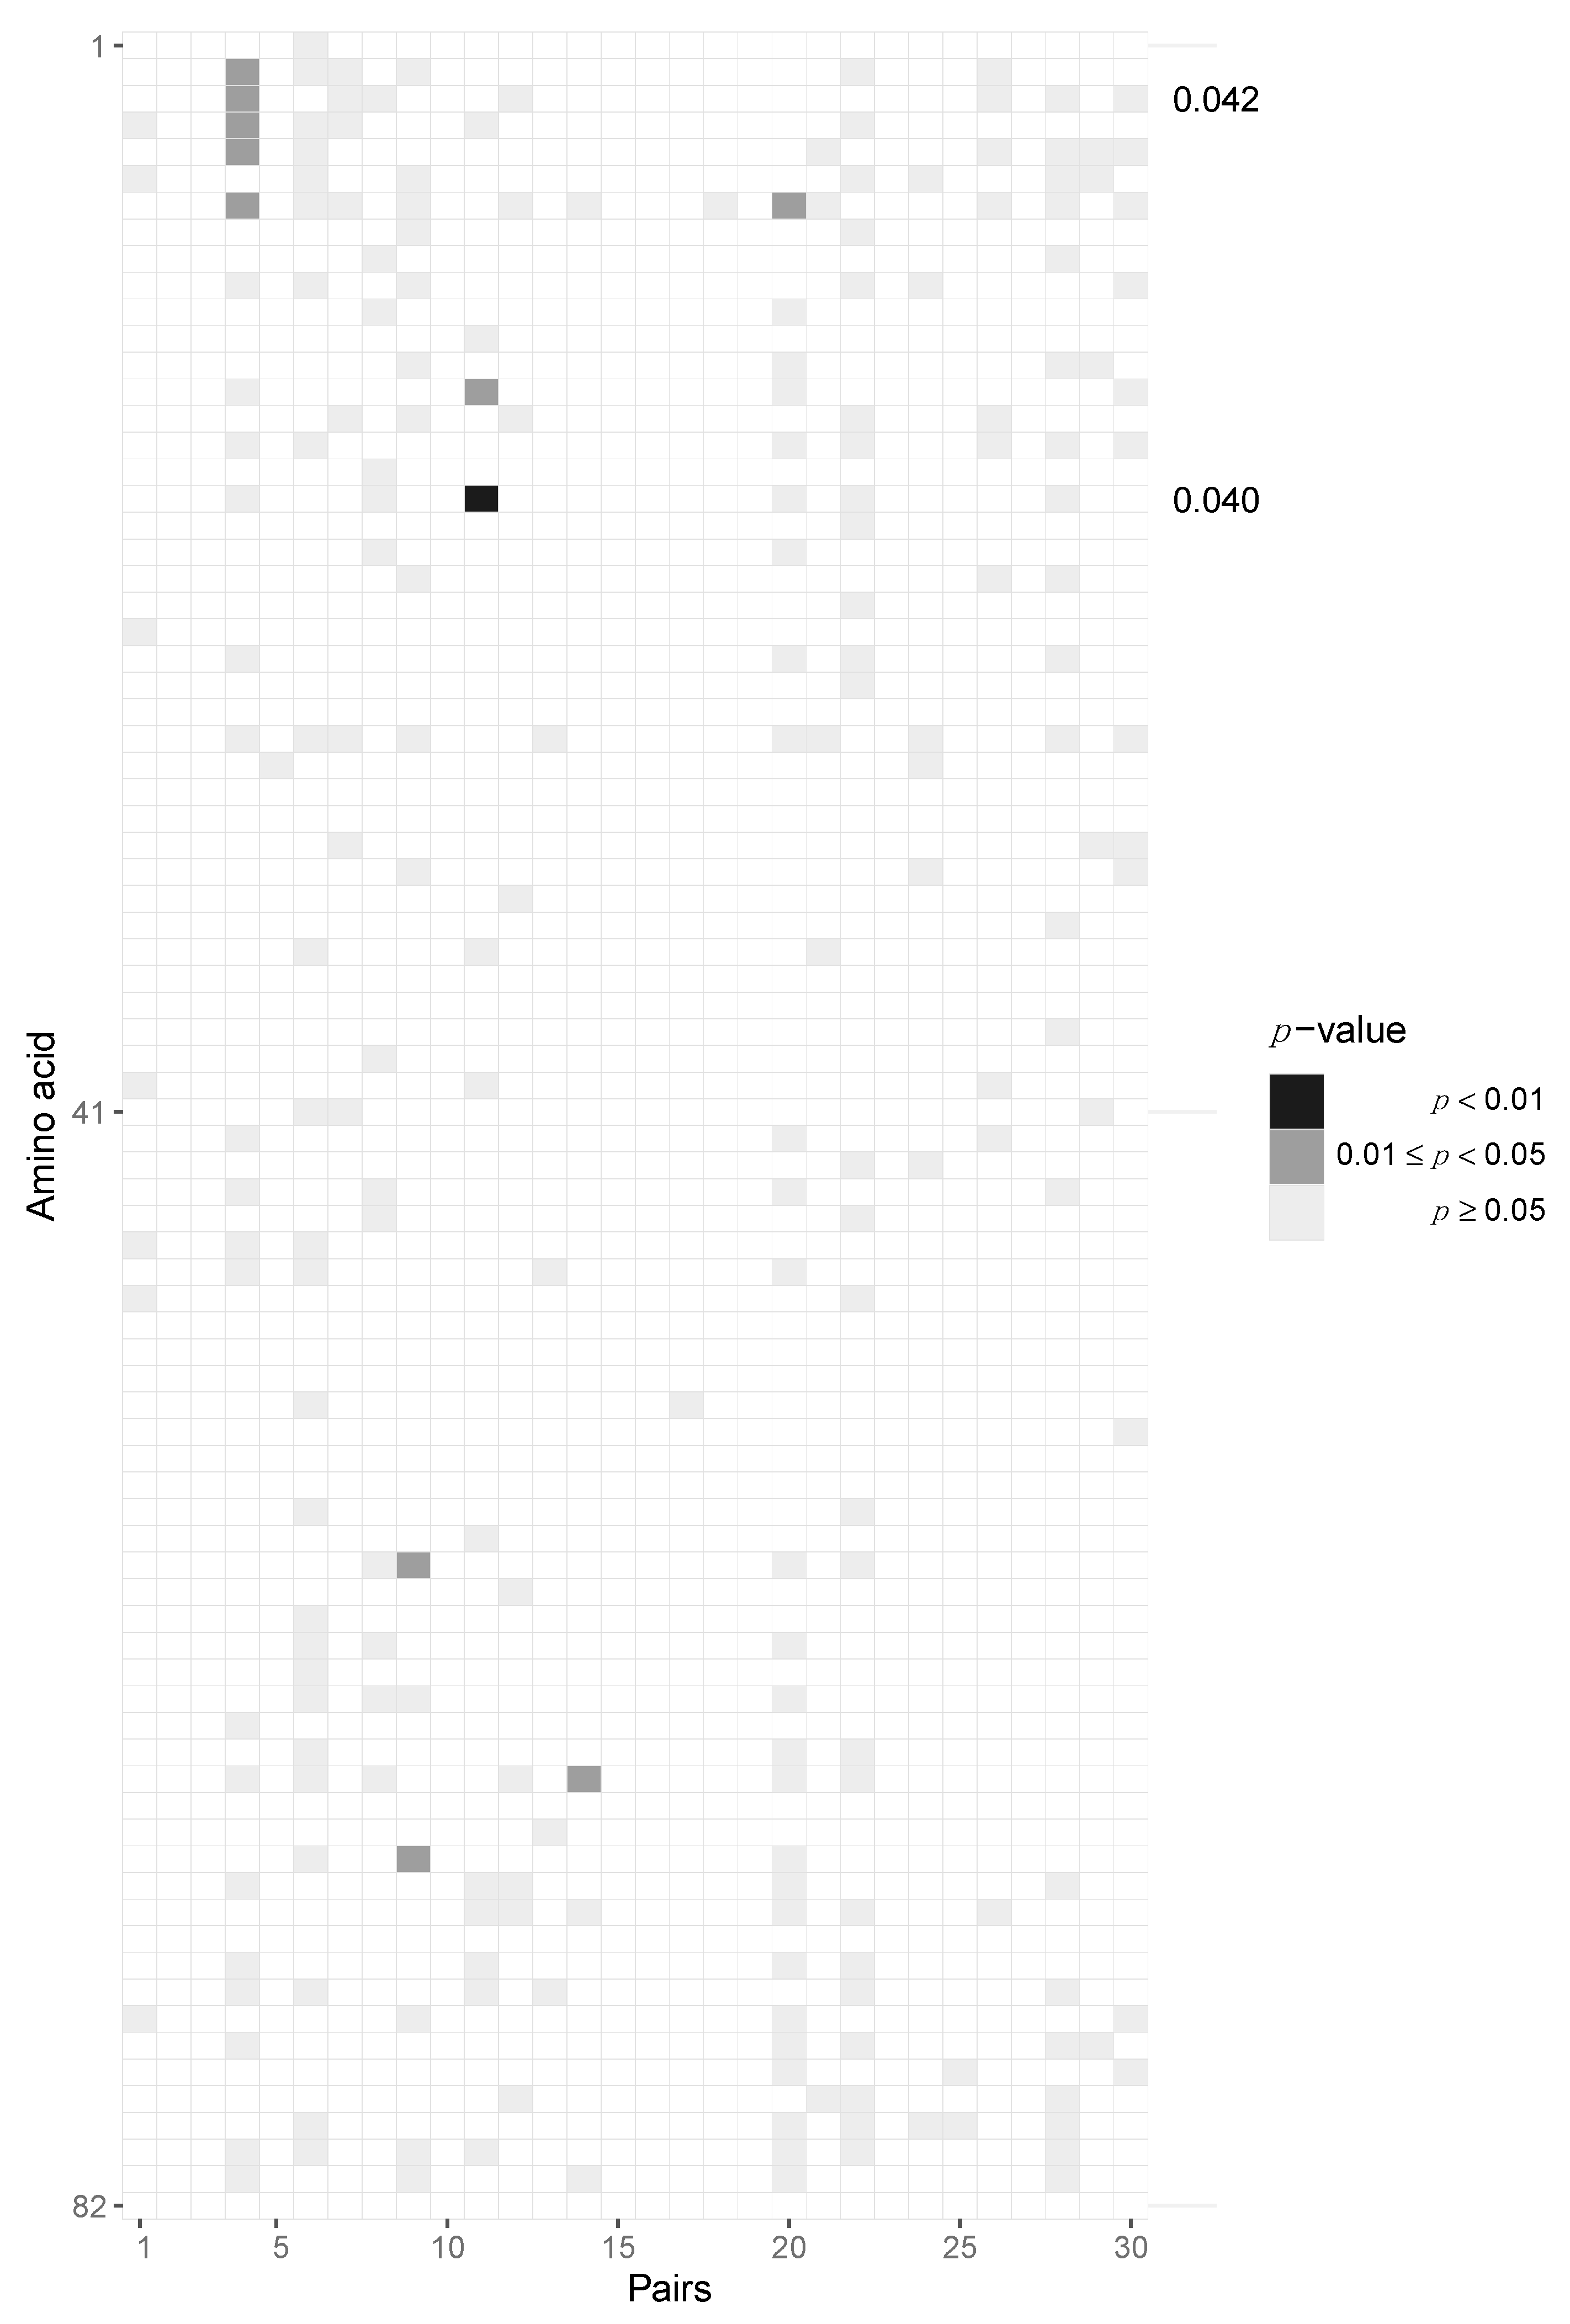
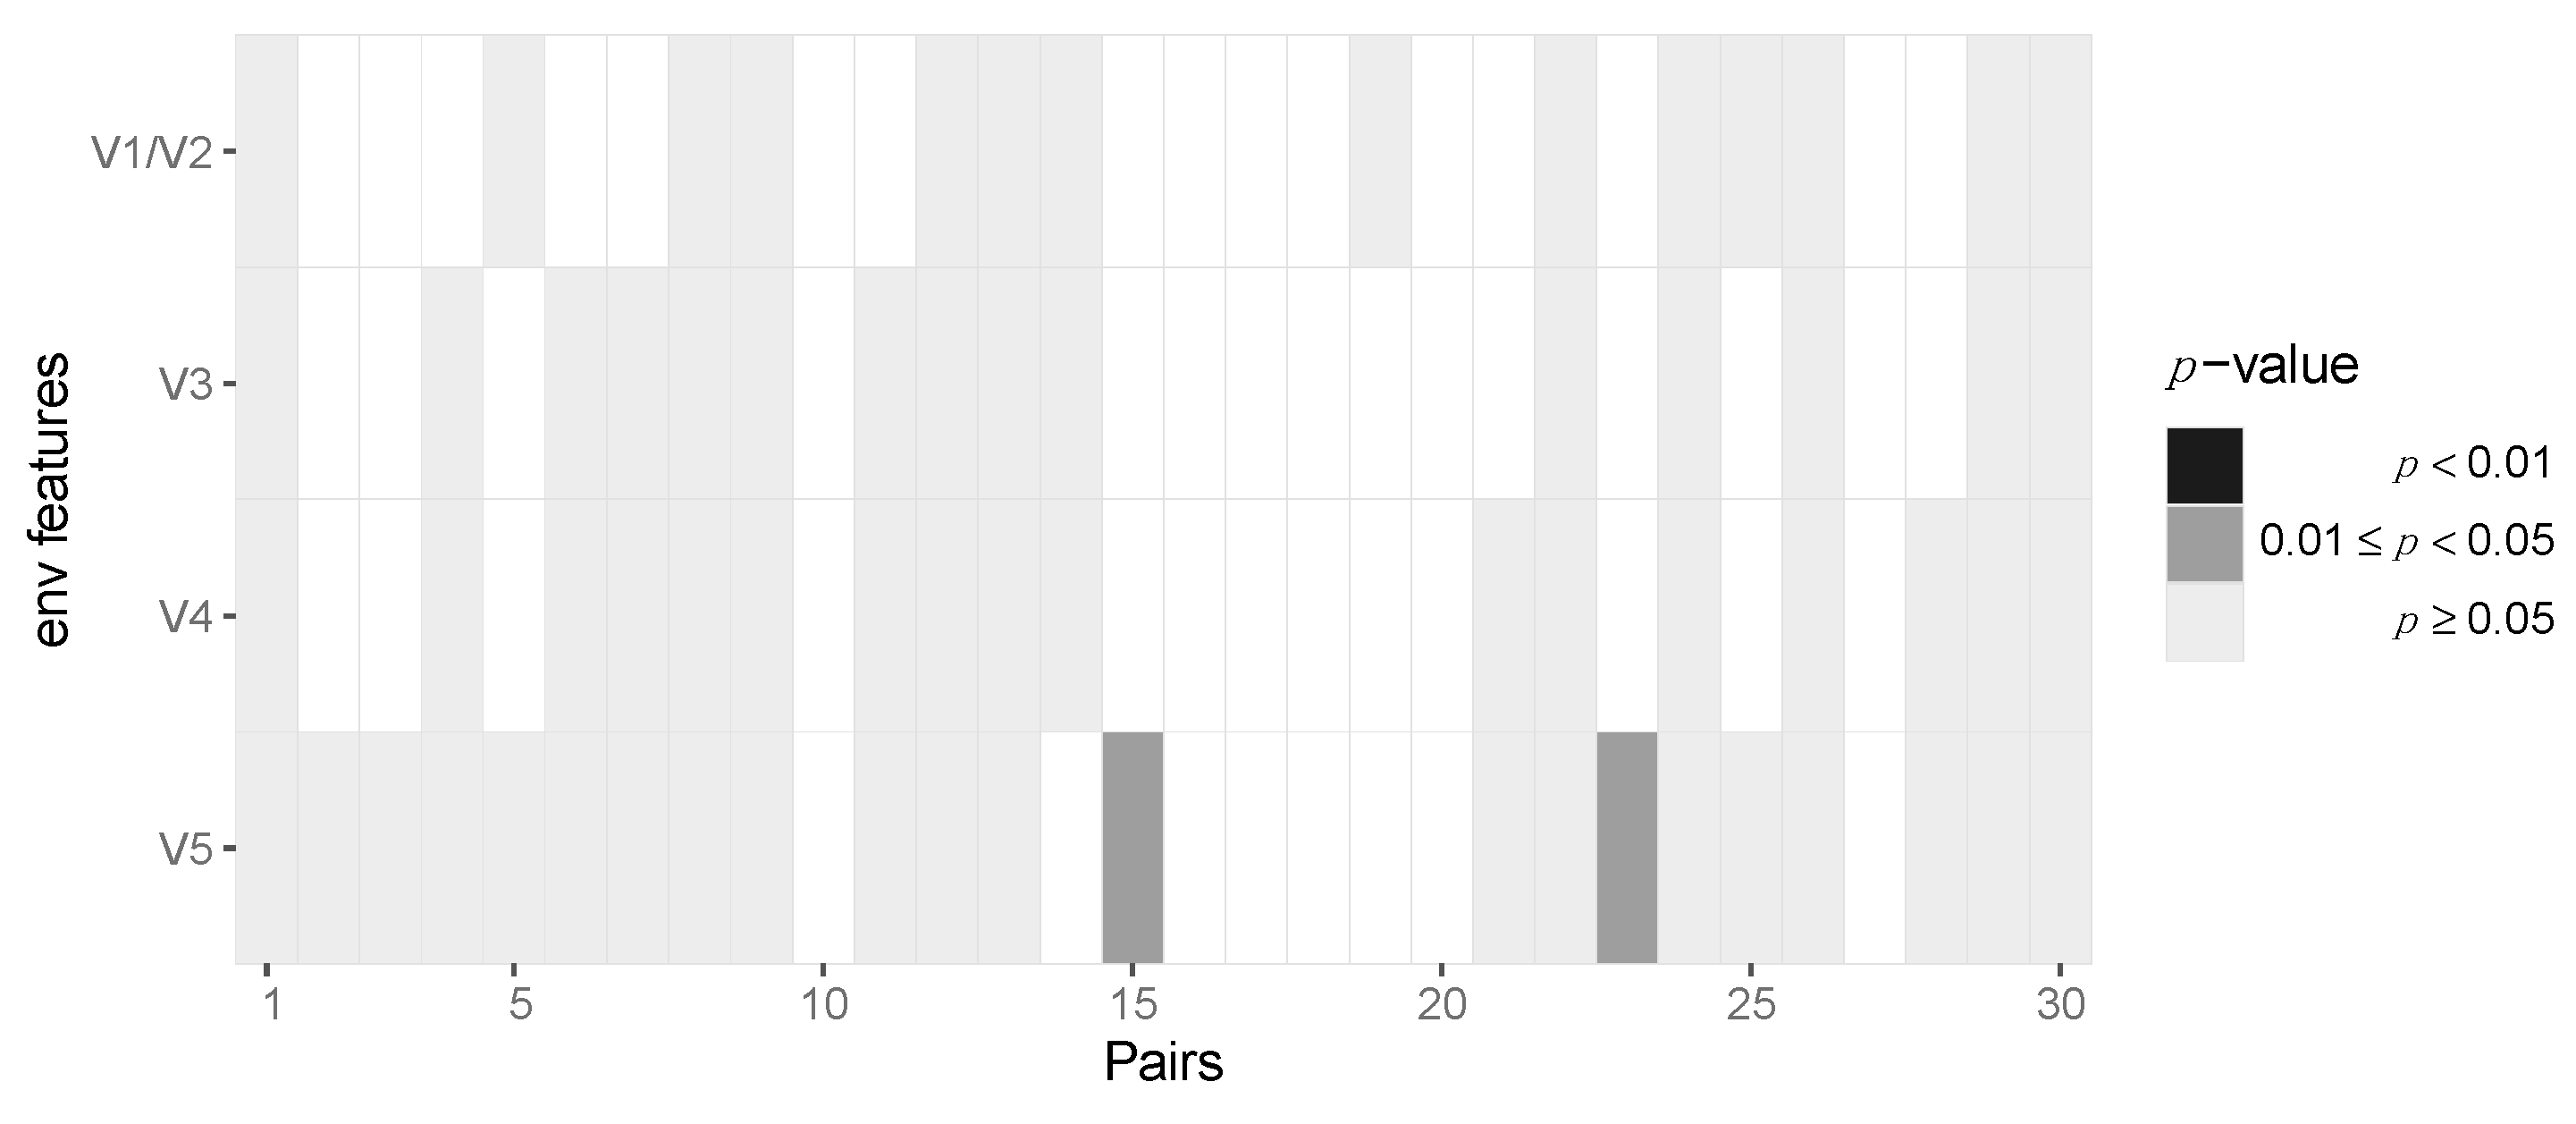
3.2. Assessing Selection in the HIV-1 Genomes of ZPHI and SHCS Transmitter–Recipient Pairs
4. Discussion
5. Conclusions
Supplementary Materials
Author Contributions
Funding
Institutional Review Board Statement
Informed Consent Statement
Data Availability Statement
Acknowledgments
Conflicts of Interest
References
- UNAIDS. Global HIV & AIDS Statistics—2020 Fact Sheets. Available online: https://www.unaids.org/en/resources/fact-sheet (accessed on 9 December 2021).
- Shattock, R.J.; Moore, J.P. Inhibiting sexual transmission of HIV-1 infection. Nat. Rev. Microbiol. 2003, 1, 25–34. [Google Scholar] [CrossRef]
- Joseph, S.B.; Swanstrom, R.; Kashuba, A.D.; Cohen, M.S. Bottlenecks in HIV-1 transmission: Insights from the study of founder viruses. Nat. Rev. Microbiol. 2015, 13, 414–425. [Google Scholar] [CrossRef] [Green Version]
- Shaw, G.M.; Hunter, E. HIV Transmission. Cold Spring Harb. Perspect. Med. 2012, 2, a006965. [Google Scholar] [CrossRef]
- Sagar, M. HIV-1 transmission biology: Selection and characteristics of infecting viruses. J. Infect. Dis. 2010, 202 (Suppl. S2), S289–S296. [Google Scholar] [CrossRef] [Green Version]
- Quinones-Mateu, M.E.; Arts, E.J. Fitness of drug resistant HIV-1: Methodology and clinical implications. Drug Resist. Updat. 2002, 5, 224–233. [Google Scholar] [CrossRef]
- Elena, S.F.; Agudelo-Romero, P.; Lalic, J. The evolution of viruses in multi-host fitness landscapes. Open Virol. J. 2009, 3, 1–6. [Google Scholar] [CrossRef] [Green Version]
- Seifert, D.; Di Giallonardo, F.; Metzner, K.J.; Gunthard, H.F.; Beerenwinkel, N. A framework for inferring fitness landscapes of patient-derived viruses using quasispecies theory. Genetics 2015, 199, 191–203. [Google Scholar] [CrossRef] [Green Version]
- Bonhoeffer, S.; Barbour, A.D.; De Boer, R.J. Procedures for reliable estimation of viral fitness from time-series data. Proc. Biol. Sci. 2002, 269, 1887–1893. [Google Scholar] [CrossRef]
- Mouquet, H.; Nussenzweig, M.C. HIV: Roadmaps to a vaccine. Nature 2013, 496, 441–442. [Google Scholar] [CrossRef]
- Ahmad, N.; Baroudy, B.M.; Baker, R.C.; Chappey, C. Genetic analysis of human immunodeficiency virus type 1 envelope V3 region isolates from mothers and infants after perinatal transmission. J. Virol. 1995, 69, 1001–1012. [Google Scholar] [CrossRef] [Green Version]
- Zhu, T.; Mo, H.; Wang, N.; Nam, D.S.; Cao, Y.; Koup, R.A.; Ho, D.D. Genotypic and phenotypic characterization of HIV-1 patients with primary infection. Science 1993, 261, 1179–1181. [Google Scholar] [CrossRef]
- Chohan, B.; Lang, D.; Sagar, M.; Korber, B.; Lavreys, L.; Richardson, B.; Overbaugh, J. Selection for human immunodeficiency virus type 1 envelope glycosylation variants with shorter V1–V2 loop sequences occurs during transmission of certain genetic subtypes and may impact viral RNA levels. J. Virol. 2005, 79, 6528–6531. [Google Scholar] [CrossRef] [Green Version]
- Liu, Y.; Curlin, M.E.; Diem, K.; Zhao, H.; Ghosh, A.K.; Zhu, H.; Woodward, A.S.; Maenza, J.; Stevens, C.E.; Stekler, J.; et al. Env length and N-linked glycosylation following transmission of human immunodeficiency virus Type 1 subtype B viruses. Virology 2008, 374, 229–233. [Google Scholar] [CrossRef] [Green Version]
- Choi, J.Y.; Pond, S.L.K.; Anderson, C.M.; Richman, D.D.; Smith, D.M. Molecular Features of the V1-V4 Coding Region of Sexually Transmitted Human Immunodeficiency Virus Type 1. J. Infect. Dis. 2017, 215, 1506–1513. [Google Scholar] [CrossRef]
- Carlson, J.M.; Schaefer, M.; Monaco, D.C.; Batorsky, R.; Claiborne, D.T.; Prince, J.; Deymier, M.J.; Ende, Z.S.; Klatt, N.R.; DeZiel, C.E.; et al. HIV transmission. Selection bias at the heterosexual HIV-1 transmission bottleneck. Science 2014, 345, 1254031. [Google Scholar] [CrossRef] [Green Version]
- Keele, B.F.; Giorgi, E.E.; Salazar-Gonzalez, J.F.; Decker, J.M.; Pham, K.T.; Salazar, M.G.; Sun, C.; Grayson, T.; Wang, S.; Li, H.; et al. Identification and characterization of transmitted and early founder virus envelopes in primary HIV-1 infection. Proc. Natl. Acad. Sci. USA 2008, 105, 7552–7557. [Google Scholar] [CrossRef] [Green Version]
- Derdeyn, C.A.; Decker, J.M.; Bibollet-Ruche, F.; Mokili, J.L.; Muldoon, M.; Denham, S.A.; Heil, M.L.; Kasolo, F.; Musonda, R.; Hahn, B.H.; et al. Envelope-constrained neutralization-sensitive HIV-1 after heterosexual transmission. Science 2004, 303, 2019–2022. [Google Scholar] [CrossRef] [Green Version]
- Haaland, R.E.; Hawkins, P.A.; Salazar-Gonzalez, J.; Johnson, A.; Tichacek, A.; Karita, E.; Manigart, O.; Mulenga, J.; Keele, B.F.; Shaw, G.M.; et al. Inflammatory genital infections mitigate a severe genetic bottleneck in heterosexual transmission of subtype A and C HIV-1. PLoS Pathog. 2009, 5, e1000274. [Google Scholar] [CrossRef] [Green Version]
- Rieder, P.; Joos, B.; Scherrer, A.U.; Kuster, H.; Braun, D.; Grube, C.; Niederost, B.; Leemann, C.; Gianella, S.; Metzner, K.J.; et al. Characterization of Human Immunodeficiency Virus Type 1 (HIV-1) Diversity and Tropism in 145 Patients With Primary HIV-1 Infection. Clin. Infect. Dis. 2011, 53, 1271–1279. [Google Scholar] [CrossRef] [Green Version]
- Magnani, R.; Sabin, K.; Saidel, T.; Heckathorn, D. Review of sampling hard-to-reach and hidden populations for HIV surveillance. AIDS 2005, 19 (Suppl. S2), S67–S72. [Google Scholar]
- Posada-Cespedes, S.; Seifert, D.; Beerenwinkel, N. Recent advances in inferring viral diversity from high-throughput sequencing data. Virus. Res. 2017, 239, 17–32. [Google Scholar] [CrossRef] [PubMed] [Green Version]
- Posada-Cespedes, S.; Seifert, D.; Topolsky, I.; Jablonski, K.P.; Metzner, K.J.; Beerenwinkel, N. V-pipe: A computational pipeline for assessing viral genetic diversity from high-throughput data. Bioinformatics 2021, 37, 1673–1680. [Google Scholar] [CrossRef] [PubMed]
- Bergstrom, C.T.; McElhany, P.; Real, L.A. Transmission bottlenecks as determinants of virulence in rapidly evolving pathogens. Proc. Natl. Acad. Sci. USA 1999, 96, 5095–5100. [Google Scholar] [CrossRef] [PubMed] [Green Version]
- Sobel Leonard, A.; Weissman, D.B.; Greenbaum, B.; Ghedin, E.; Koelle, K. Transmission Bottleneck Size Estimation from Pathogen Deep-Sequencing Data, with an Application to Human Influenza A Virus. J. Virol. 2017, 91, e00171-17. [Google Scholar] [CrossRef] [Green Version]
- Lumby, C.K.; Nene, N.R.; Illingworth, C.J.R. A novel framework for inferring parameters of transmission from viral sequence data. PLoS Genet. 2018, 14, e1007718. [Google Scholar] [CrossRef] [Green Version]
- Morris, D.H.; Petrova, V.N.; Rossine, F.W.; Parker, E.; Grenfell, B.T.; Neher, R.A.; Levin, S.A.; Russell, C.A. Asynchrony between virus diversity and antibody selection limits influenza virus evolution. bioRxiv 2020, 9, e62105. [Google Scholar] [CrossRef]
- Schoeni-Affolter, F.; Ledergerber, B.; Rickenbach, M.; Rudin, C.; Gunthard, H.F.; Telenti, A.; Furrer, H.; Yerly, S.; Francioli, P. Cohort profile: The Swiss HIV Cohort study. Int. J. Epidemiol. 2010, 39, 1179–1189. [Google Scholar] [CrossRef] [Green Version]
- Yang, W.L.; Kouyos, R.; Scherrer, A.U.; Boni, J.; Shah, C.; Yerly, S.; Klimkait, T.; Aubert, V.; Furrer, H.; Battegay, M.; et al. Assessing the Paradox Between Transmitted and Acquired HIV Type 1 Drug Resistance Mutations in the Swiss HIV Cohort Study From 1998 to 2012. J. Infect. Dis. 2015, 212, 28–38. [Google Scholar] [CrossRef] [Green Version]
- Rieder, P.; Joos, B.; von Wyl, V.; Kuster, H.; Grube, C.; Leemann, C.; Boni, J.; Yerly, S.; Klimkait, T.; Burgisser, P.; et al. HIV-1 transmission after cessation of early antiretroviral therapy among men having sex with men. AIDS 2010, 24, 1177–1183. [Google Scholar] [CrossRef]
- Oberle, C.S.; Joos, B.; Rusert, P.; Campbell, N.K.; Beauparlant, D.; Kuster, H.; Weber, J.; Schenkel, C.D.; Scherrer, A.U.; Magnus, C.; et al. Tracing HIV-1 transmission: Envelope traits of HIV-1 transmitter and recipient pairs. Retrovirology 2016, 13. [Google Scholar] [CrossRef] [Green Version]
- Giallonardo, F.D.; Töpfer, A.; Rey, M.; Prabhakaran, S.; Duport, Y.; Leemann, C.; Schmutz, S.; Campbell, N.K.; Joos, B.; Lecca, M.R.; et al. Full-length haplotype reconstruction to infer the structure of heterogeneous virus populations. Nucleic Acids Res. 2014, 42, e115. [Google Scholar] [CrossRef] [PubMed]
- Schmieder, R.; Edwards, R. Quality control and preprocessing of metagenomic datasets. Bioinformatics 2011, 27, 863–864. [Google Scholar] [CrossRef] [PubMed] [Green Version]
- Katoh, K.; Standley, D.M. MAFFT multiple sequence alignment software version 7: Improvements in performance and usability. Mol. Biol. Evol. 2013, 30, 772–780. [Google Scholar] [CrossRef] [PubMed] [Green Version]
- Schirmer, M.; Ijaz, U.Z.; D’Amore, R.; Hall, N.; Sloan, W.T.; Quince, C. Insight into biases and sequencing errors for amplicon sequencing with the Illumina MiSeq platform. Nucleic Acids Res. 2015, 43, e37. [Google Scholar] [CrossRef] [PubMed]
- Neyman, J.; Pearson, E.S. Contributions to the theory of testing statistical hypotheses. Stat. Res. Mem. 1936, 1, 1–37. [Google Scholar]
- Derkach, A.; Lawless, J.F.; Sun, L. Robust and Powerful Tests for Rare Variants Using Fisher’s Method to Combine Evidence of Association From Two or More Complementary Tests. Genet. Epidemiol. 2013, 37, 110–121. [Google Scholar] [CrossRef] [Green Version]
- Guglietta, S.; Pantaleo, G.; Graziosi, C. Long sequence duplications, repeats, and palindromes in HIV-1 gp120: Length variation in V4 as the product of misalignment mechanism. Virology 2010, 399, 167–175. [Google Scholar] [CrossRef] [Green Version]
- Prakash, S.S.; Kalra, R.; Lodha, R.; Kabra, S.K.; Luthra, K. Diversity of HIV type 1 envelope (V3-V5) sequence in HIV type 1-infected Indian children. AIDS Res. Hum. Retrovir. 2012, 28, 505–509. [Google Scholar] [CrossRef]
- Jafari, M.; Guatelli, J.; Lewinski, M.K. Activities of Transmitted/Founder and Chronic Clade B HIV-1 Vpu and a C-Terminal Polymorphism Specifically Affecting Virion Release. J. Virol. 2014, 88, 5062–5078. [Google Scholar] [CrossRef] [Green Version]
- Gonzalez, M.E. Vpu Protein: The Viroporin Encoded by HIV-1. Viruses 2015, 7, 4352–4368. [Google Scholar] [CrossRef] [Green Version]
- Magadan, J.G.; Bonifacino, J.S. Transmembrane domain determinants of CD4 Downregulation by HIV-1 Vpu. J. Virol. 2012, 86, 757–772. [Google Scholar] [CrossRef] [PubMed] [Green Version]
- Zhou, S.; Jones, C.; Mieczkowski, P.; Swanstrom, R. Primer ID Validates Template Sampling Depth and Greatly Reduces the Error Rate of Next Generation Sequencing of HIV-1 Genomic RNA Populations. J. Virol. 2015, 89, 8540–8555. [Google Scholar] [CrossRef] [PubMed] [Green Version]
- Seifert, D.; Di Giallonardo, F.; Topfer, A.; Singer, J.; Schmutz, S.; Gunthard, H.F.; Beerenwinkel, N.; Metzner, K.J. A Comprehensive Analysis of Primer IDs to Study Heterogeneous HIV-1 Populations. J. Mol. Biol. 2016, 428, 238–250. [Google Scholar] [CrossRef] [Green Version]
- Cavarelli, M.; Foglieni, C.; Rescigno, M.; Scarlatti, G. R5 HIV-1 envelope attracts dendritic cells to cross the human intestinal epithelium and sample luminal virions via engagement of the CCR5. EMBO Mol. Med. 2013, 5, 776–794. [Google Scholar] [CrossRef] [PubMed]
- Patel, P.; Borkowf, C.B.; Brooks, J.T.; Lasry, A.; Lansky, A.; Mermin, J. Estimating per-act HIV transmission risk: A systematic review. AIDS 2014, 28, 1509–1519. [Google Scholar] [CrossRef] [PubMed]
- Boily, M.C.; Baggaley, R.F.; Wang, L.; Masse, B.; White, R.G.; Hayes, R.J.; Alary, M. Heterosexual risk of HIV-1 infection per sexual act: Systematic review and meta-analysis of observational studies. Lancet Infect. Dis. 2009, 9, 118–129. [Google Scholar] [CrossRef] [Green Version]
- Agresti, A.; Gottard, A. Reducing conservatism of exact small-sample methods of inference for discrete data. In Compstat 2006, Proceedings in Computational Statistics, Rome, Italy, 23 March 2006; Springer: Berlin/Heidelberg, Germany, 2006; pp. 245–260. [Google Scholar]
- Boeras, D.I.; Hraber, P.T.; Hurlston, M.; Evans-Strickfaden, T.; Bhattacharya, T.; Giorgi, E.E.; Mulenga, J.; Karita, E.; Korber, B.T.; Allen, S.; et al. Role of donor genital tract HIV-1 diversity in the transmission bottleneck. Proc. Natl. Acad. Sci. USA 2011, 108, E1156–E1163. [Google Scholar] [CrossRef] [Green Version]
- Borrow, P.; Lewicki, H.; Wei, X.; Horwitz, M.S.; Peffer, N.; Meyers, H.; Nelson, J.A.; Gairin, J.E.; Hahn, B.H.; Oldstone, M.B.; et al. Antiviral pressure exerted by HIV-1-specific cytotoxic T lymphocytes (CTLs) during primary infection demonstrated by rapid selection of CTL escape virus. Nat. Med. 1997, 3, 205–211. [Google Scholar] [CrossRef]
- Price, D.A.; Goulder, P.J.; Klenerman, P.; Sewell, A.K.; Easterbrook, P.J.; Troop, M.; Bangham, C.R.; Phillips, R.E. Positive selection of HIV-1 cytotoxic T lymphocyte escape variants during primary infection. Proc. Natl. Acad. Sci. USA 1997, 94, 1890–1895. [Google Scholar] [CrossRef] [Green Version]


Publisher’s Note: MDPI stays neutral with regard to jurisdictional claims in published maps and institutional affiliations. |
© 2022 by the authors. Licensee MDPI, Basel, Switzerland. This article is an open access article distributed under the terms and conditions of the Creative Commons Attribution (CC BY) license (https://creativecommons.org/licenses/by/4.0/).
Share and Cite
Seifert, D.; Joos, B.; Braun, D.L.; Oberle, C.S.; Schenkel, C.D.; Kuster, H.; Grube, C.; Böni, J.; Yerly, S.; Aubert, V.; et al. Detecting Selection in the HIV-1 Genome during Sexual Transmission Events. Viruses 2022, 14, 406. https://doi.org/10.3390/v14020406
Seifert D, Joos B, Braun DL, Oberle CS, Schenkel CD, Kuster H, Grube C, Böni J, Yerly S, Aubert V, et al. Detecting Selection in the HIV-1 Genome during Sexual Transmission Events. Viruses. 2022; 14(2):406. https://doi.org/10.3390/v14020406
Chicago/Turabian StyleSeifert, David, Beda Joos, Dominique L. Braun, Corinna S. Oberle, Corinne D. Schenkel, Herbert Kuster, Christina Grube, Jürg Böni, Sabine Yerly, Vincent Aubert, and et al. 2022. "Detecting Selection in the HIV-1 Genome during Sexual Transmission Events" Viruses 14, no. 2: 406. https://doi.org/10.3390/v14020406