Article

Exploring HIV-1 Transmission Dynamics by Combining Phylogenetic Analysis and Infection Timing

1
Aids Reference Laboratory, Department of Diagnostic Sciences, Ghent University, 9000 Ghent, Belgium
2
Aids Reference Center, Department of Internal Medicine, Ghent University Hospital, 9000 Ghent, Belgium
3
Epidemiology of Infectious Diseases Unit, Scientific Institute of Public Health Sciensano, 1050 Brussels, Belgium
4
Aids Reference Laboratory, Medical Microbiology Unit, Université Catholique de Louvain, 1200 Brussels, Belgium
5
Aids Reference Laboratory, Université Libre de Bruxelles, 1050 Brussels, Belgium
6
HIV/STD Reference Laboratory, Department of Clinical Sciences, Institute of Tropical Medicine, 2000 Antwerp, Belgium
7
Aids Reference Laboratory, Centre Hospitalier Universitaire St. Pierre, 1000 Brussels, Belgium
8
Aids Reference Laboratory, Centre Hospitalier Universitaire de Liège, 4000 Liège, Belgium
9
Aids Reference Laboratory, Vrije Universiteit Brussel VUB, 1090 Brussels, Belgium
10
Aids Reference Laboratory, University Hospital Leuven, 3000 Leuven, Belgium
11
Rega Institute for Medical Research, Department of Microbiology, Immunology and Transplantation, KU Leuven, 3000 Leuven, Belgium
*
Author to whom correspondence should be addressed.
Viruses 2019, 11(12), 1096; https://doi.org/10.3390/v11121096
Submission received: 4 October 2019 / Revised: 21 November 2019 / Accepted: 22 November 2019 / Published: 26 November 2019
(This article belongs to the Special Issue HIV Molecular Epidemiology for Prevention)

Abstract

:
HIV-1 pol sequences obtained through baseline drug resistance testing of patients newly diagnosed between 2013 and 2017 were analyzed for genetic similarity. For 927 patients the information on genetic similarity was combined with demographic data and with information on the recency of infection. Overall, 48.3% of the patients were genetically linked with 11.4% belonging to a pair and 36.9% involved in a cluster of ≥3 members. The percentage of early diagnosed (≤4 months after infection) was 28.6%. Patients of Belgian origin were more frequently involved in transmission clusters (49.7% compared to 15.3%) and diagnosed earlier (37.4% compared to 12.2%) than patients of Sub-Saharan African origin. Of the infections reported to be locally acquired, 69.5% were linked (14.1% paired and 55.4% in a cluster). Equal parts of early and late diagnosed individuals (59.9% and 52.4%, respectively) were involved in clusters. The identification of a genetically linked individual for the majority of locally infected patients suggests a high rate of diagnosis in this population. Diagnosis however is often delayed for >4 months after infection increasing the opportunities for onward transmission. Prevention of local infection should focus on earlier diagnosis and protection of the still uninfected members of sexual networks with human immunodeficiency virus (HIV)-infected members.

1. Introduction

The number of new human immunodeficiency virus (HIV) diagnoses in Belgium is falling, with a decrease of 2% in 2017 compared to 2016 and 27.5% compared to 2012. There is wide access to testing and care [1] and since December 2016, the immediate initiation of antiretroviral therapy after diagnosis is recommended for every patient. In 2017, 16,070 HIV-infected persons were in care and 97% of these were on therapy. Of individuals treated for at least six months, 97% attained a viral load of less than 200 copies/mL [2]. Despite these encouraging numbers, 890 new HIV diagnoses were registered in 2017, corresponding to a rate of 7.9 infections per 100,000 individuals, which is well above the average rate in the European Union (6.9 to 6.2 per 100,000) [3]. Nearly half (49%) of all new diagnoses are established in men having sex with men (MSM), mainly of Belgian or European origin, whereas for infections through heterosexual contacts, representing 48% of all new diagnoses, 49% were diagnosed in Sub-Saharan Africans [2].
Laboratory monitoring and drug resistance analysis is centralized in seven Belgian AIDS (acquired immunodeficiency syndrome) Reference Laboratories. Baseline drug resistance testing of newly diagnosed, therapy-naive individuals is standard practice. As evidenced by many studies, the HIV sequence databases that result from baseline resistance testing may provide a wealth of information on the ongoing local spread of HIV [4,5,6,7,8,9,10,11,12]. To what extent the results inferred from these studies reflects the actual transmission dynamics however largely depend on the degree of representativeness of the samples analyzed, the depth of the sampling and the quality of the individual socio-demographic, laboratory and clinical information available, and the relevance of the results is the highest when targeting concentrated and densely sampled epidemics.
Previous phylogenetic analyses of the Belgian HIV epidemic showed that local HIV acquisition is almost exclusively driven by MSM and is concentrated in transmission clusters [13]. However, knowledge on the specific characteristics of those individuals that contribute most to the transmission in these clusters is lacking. There is a general belief that particularly patients with early (acute) infection sustain virus spread because of the high viral loads during this stage of infection [14,15]. Modeling studies [16] and phylodynamic studies [17,18] support this hypothesis.
In order to further characterize the structure of the current Belgian epidemic, extend insight on the drivers of local transmission, and define gaps in prevention, we combined in this study phylogenetic and demographic analyses with information on the stage of infection at diagnosis. The results show that for the majority of individuals infected locally, a potential source partner was found and that a high percentage was involved in a transmission cluster. In these transmission clusters a nearly equal participation of early and late diagnosed individuals was observed. The sexual networks behind the transmission clusters should be the target of prevention focusing on earlier diagnosis and protection of the still uninfected.

2. Materials and Methods

2.1. Study Population and Infection Timing

HIV-1 pol sequences were collected from 1185 treatment-naive patients who received baseline resistance testing after being diagnosed in Belgium in 2014 (n = 555) and 2016 (n = 630). Demographic data, collected within the framework of mandatory HIV surveillance, were linked to the individual patients using a pseudonymized identifier. For mode of transmission, the categories were MSM, heterosexual, and other (including intravenous drug use, blood transfusion, and perinatal infections). The 26 patients reporting bisexual behavior were all male. They were classified as MSM because male–male contact was presumed to be their most likely source of infection. HIV-1 subtyping was performed using Rega v3 and Comet [19,20]. The subtype was allocated in case of a concordant outcome of both tools and considered as undefined in all other cases. Time since infection was estimated for patients for whom sufficient leftover serum or plasma, collected within one month after diagnosis, was available (n = 1033, 87.2%). Infection timing was performed following an algorithm described before, with slight modifications [21]. Patients diagnosed during the pre-seroconversion stage were classified as early diagnosed and patients with a CD4+ T-cell count of 100 or less were classified as late diagnosed. For all other patients, the BED HIV-1 incidence enzyme immunoassay (EIA) and the HIV-1 limiting antigen (LA)g-Avidity EIA (both from Sedia Biosciences Corporation, Portland, OR, USA) were performed. Patients for whom both assays reported ‘recent’, corresponding to a presumed infection ≤4 months before collection of the sample, were considered as ‘early diagnosed’ and patients for whom both assays reported ‘long-term’, corresponding to a presumed infection of more than 4 months before, were referred to as ‘late diagnosed’. Patients with discordant results for both assays were withdrawn from subsequent statistical analyses. Concordant results were obtained for 927 patients (i.e., 89.7% of the patients diagnosed in 2014 or 2016). The characteristics of the 927 study patients were fully comparable with the characteristics of the extended population of patients diagnosed between 2013 and 2017 used for phylogenetic analysis.

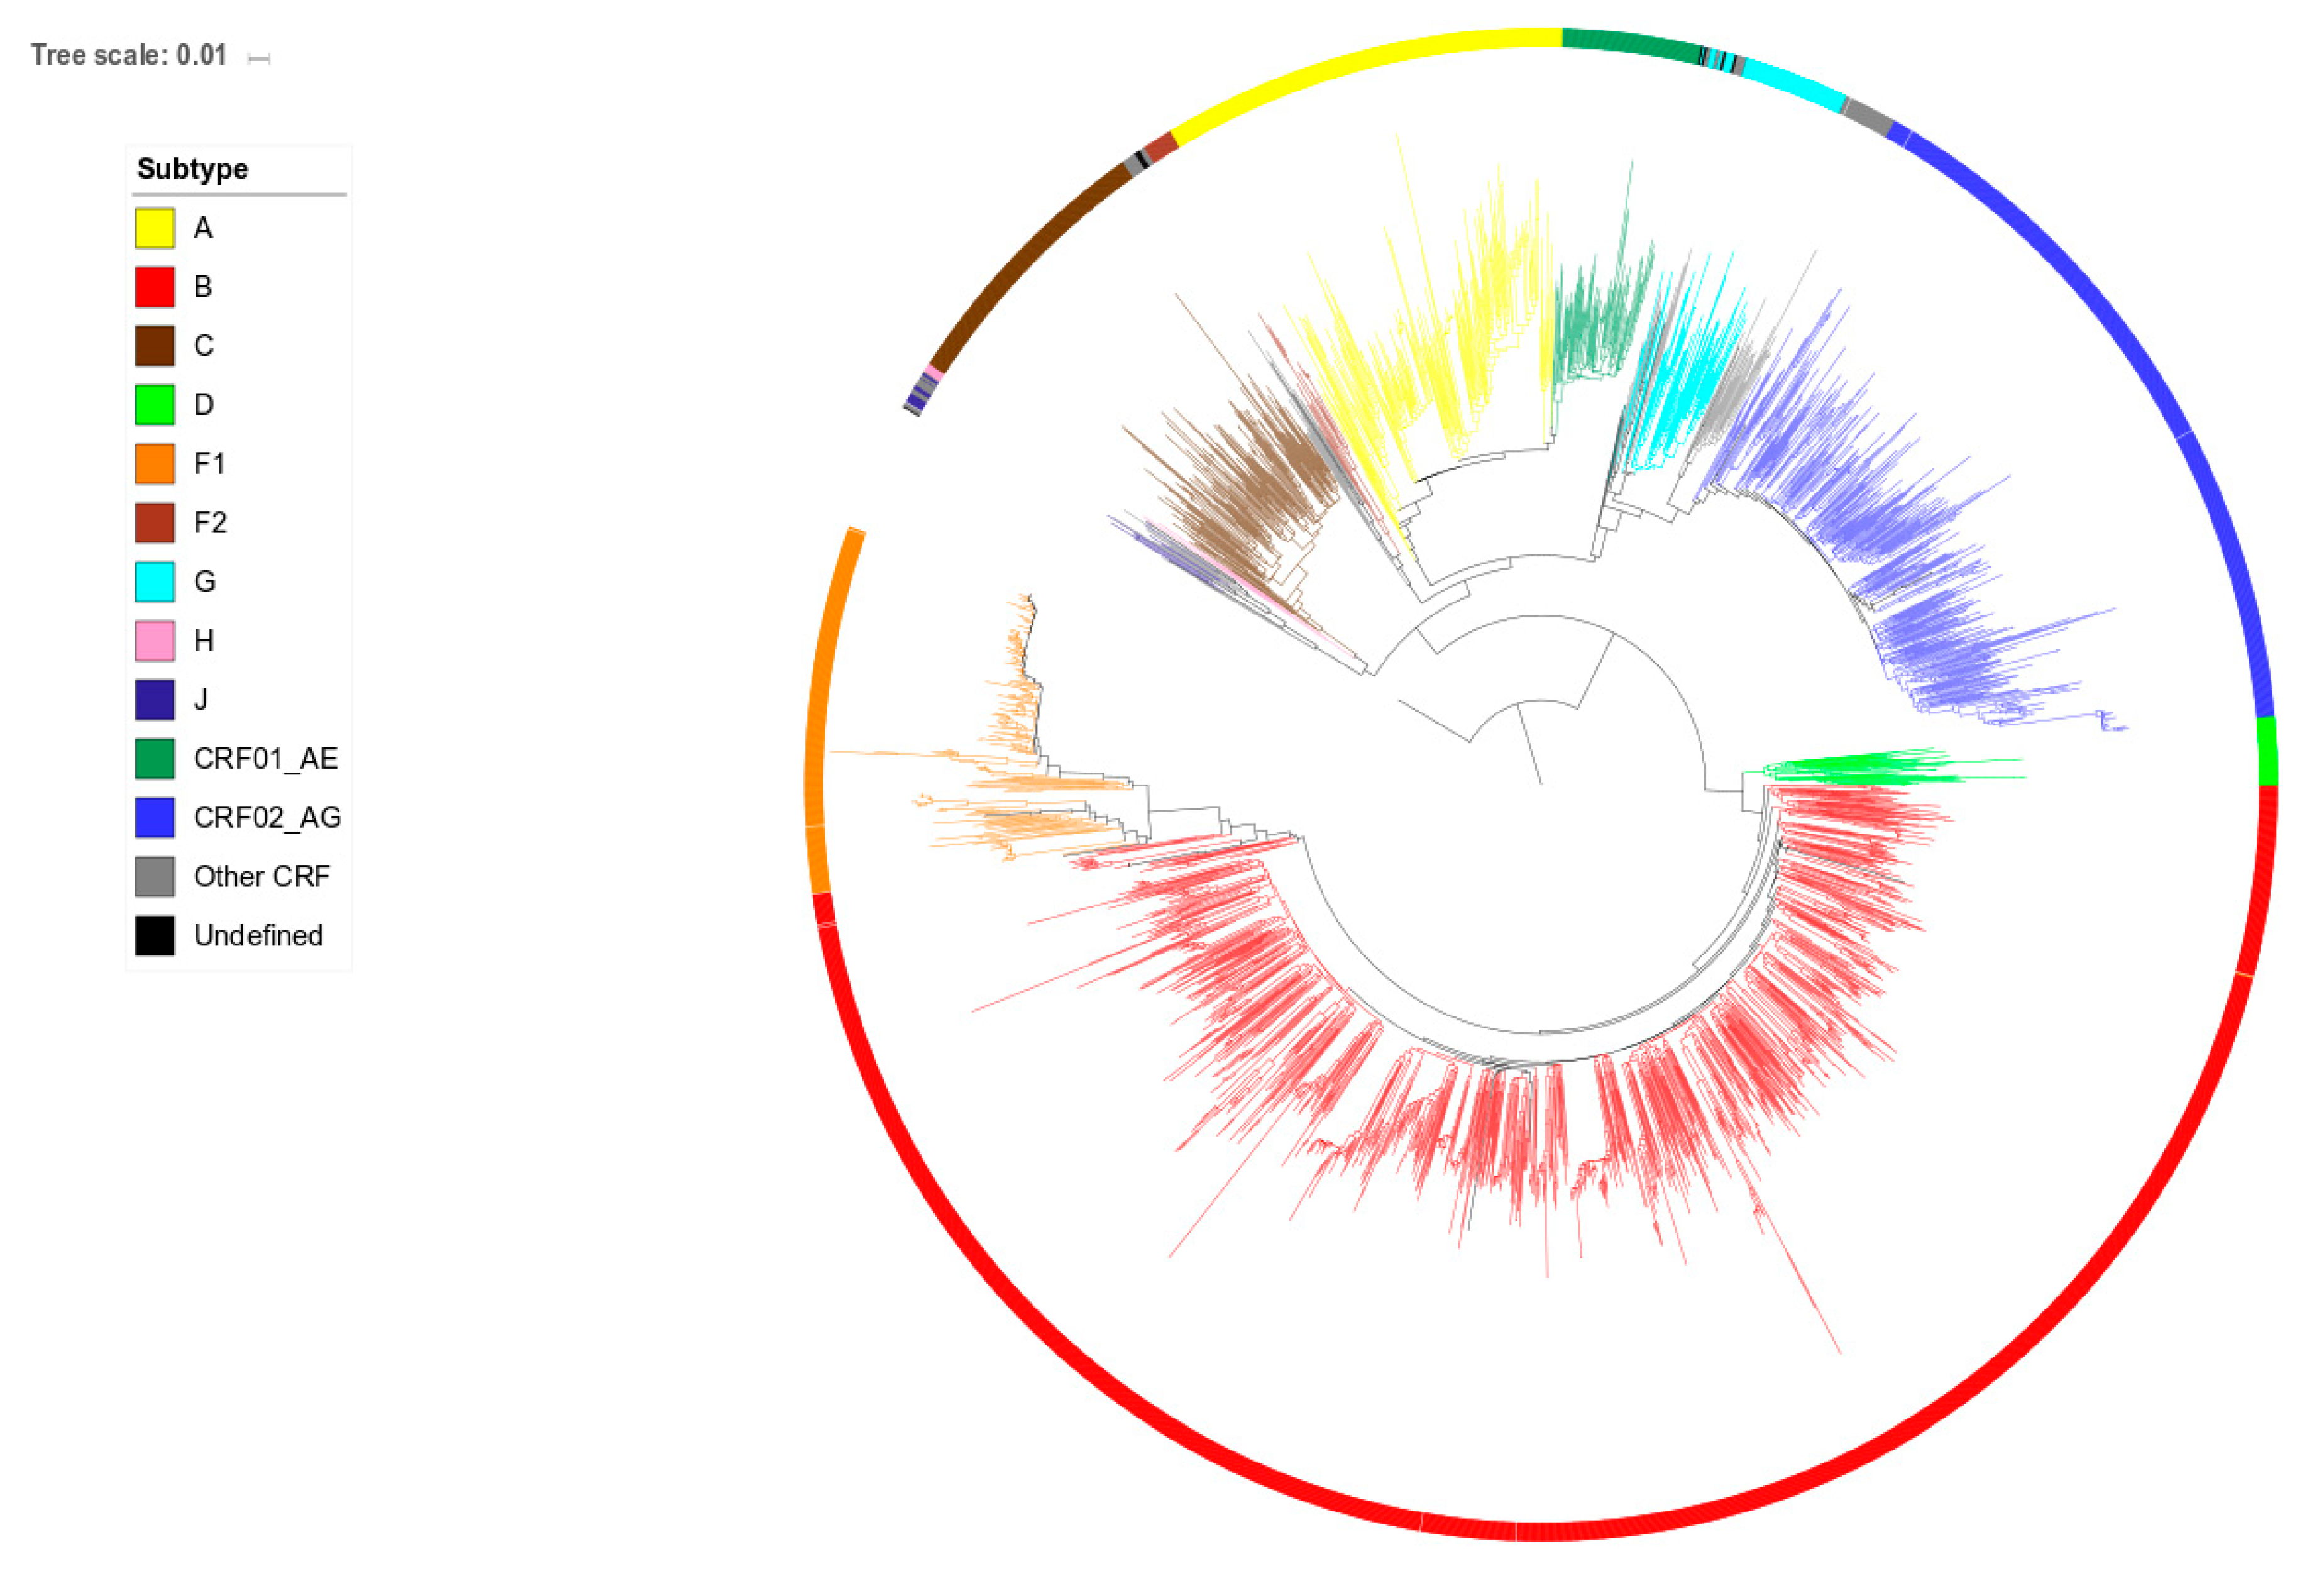
2.2. Phylogenetic Analysis

HIV-1 pol sequences from the study population were supplemented with 1664 HIV-1 pol sequences from patients newly diagnosed in 2013 (n = 655), 2015 (n = 456) or 2017 (n = 553). Sequences were generated using Sanger sequencing by either the TruGene HIV-1 genotyping kit (TruGene, Siemens Healthcare Diagnostics, Eschborn, Germany), ViroSeq HIV-1 Genotyping System (Abbott Molecular, Wavre, Belgium) or an in-house protocol. Since the length of the generated sequences slightly differed between protocols, they were trimmed to the 870 nucleotides that were covered by all methods, representing codons 9 to 99 of the protease gene and 41 to 239 of the reverse transcriptase gene. Alignments were composed in BioEdit [22]. Gaps resulting from the insertions of three nucleotides at codon positions 33 or 35 of the protease gene were observed in less than 20 sequences and were removed. Positions associated with drug resistance, detected in 79 patients, were kept after excluding any influence on the phylogenetic tree topology. The phylogenetic tree was constructed using the maximum likelihood (ML) approach implemented in PhyML 3.0 [23] with automatic selection of the best fit evolutionary model of DNA substitution (GTR + G + I) using the Akaike information criterion. Figure 1 shows the phylogenetic tree of the extended population of 2849 patients. Branch support was obtained by the approximate likelihood-ratio test (LRT) [24]. Identification of clustering was performed as described before [13]. Sequences linked with at least one other sequence with an LRT of ≥0.97 and a mean pairwise distance of ≤0.015 were considered as genetically linked and classified as either paired (2 members) or clustered (≥3 members). Sequences located in a cluster but with a branch length of >0.030 were considered as isolated and removed as cluster members to ensure that the cluster members identified primarily resulted from recent transmission events.

2.3. Statistical Analysis

The relationships between time of infection and patient characteristics, as well as between origin (Belgian versus African) and patient characteristics were modeled using binary logistic regression models. Each potential risk factor was included in the univariate analysis and identified risk factors (p-value < 0.05) were selected for multivariate logistic regression analyses using the stepwise method. At first, all risk factors identified in the univariate analysis were included in the multivariate analysis. Identified significant risk factors (p-value < 0.05) in this first round were selected for a second round of multivariate analysis and this process was repeated until all remaining risk factors were significant. Only the risk factors that remained as significant after the last analysis were listed in the respective tables. The odds ratio with its 95% confidence interval is provided as a summary statistic. Significance was set at < 0.05. All data were analyzed using SPSS (IBM SPSS Statistics for Windows, Version 23.0. Released 2015; IBM Corp, Armonk, NY, USA).

2.4. Ethics

Ethics approval was obtained for all participating sites with the ethical committee of Ghent University Hospital as the coordinating center (EC ref 2014/0717). All sequence data were compiled and merged with the demographic data and infection time data using pseudonymized identifiers. Only aggregated data were presented.

3. Results

3.1. Patient Characteristics

The study population consisted of 927 patients, 77.3% were male, 56.4% MSM, 49.9% of Belgian origin, 69.5% reported infection in Belgium, and 49.1% were infected with a subtype B strain. These characteristics fully matched those of the extended series of 2856 patients used to construct the phylogenetic tree and define clustering (77.1% male, 57.4% MSM, 48.2% of Belgian origin, 70.5% infected in Belgium and 46.4% infected with a subtype B strain). A close genetic link in the phylogenetic tree was found for 48.3% of the 927 patients with 11.4% involved in a pair and 36.9% in a transmission cluster. Infection time analysis classified 28.6% of the 927 patients as early diagnosed. The odds of being diagnosed early were significantly higher for clustered and paired individuals, for MSM and for patients reporting infection in Belgium (Table 1).

3.2. Origin and Infection Stage at Diagnosis

For the 718 (77.5%) patients for whom the origin was known, 358 (49.9%) were of Belgian and 196 (27.3%) of Sub-Saharan African origin. The odds of being of African origin were significantly higher for females, heterosexuals, younger patients, patients reporting infection in Africa, and patients infected with the non-B subtypes A, C or CRF02_AG (Table 2). Due to the important differences between HIV-infected patients of Belgian and African origin, further analysis of the characteristics associated with early diagnosis was done separately for both groups. Amongst the 358 patients of Belgian origin, 37.4% were diagnosed early. The only characteristic that distinguished early from late diagnosed Belgians was younger age (odds ratio of 0.958 per year of age increase; p = 0.001; 95% confidence interval 0.953–0.988). Of the 196 patients of African origin, only 12.2% were diagnosed early. The odds of being diagnosed early were significantly higher for clustered or paired individuals (odds ratio of 9.770; p < 0.001; 95% confidence interval 3.489–27.354 for clustered individuals, odds ratio of 4.687; p = 0.013; 95% confidence interval 1.383–15.890 for paired individuals).

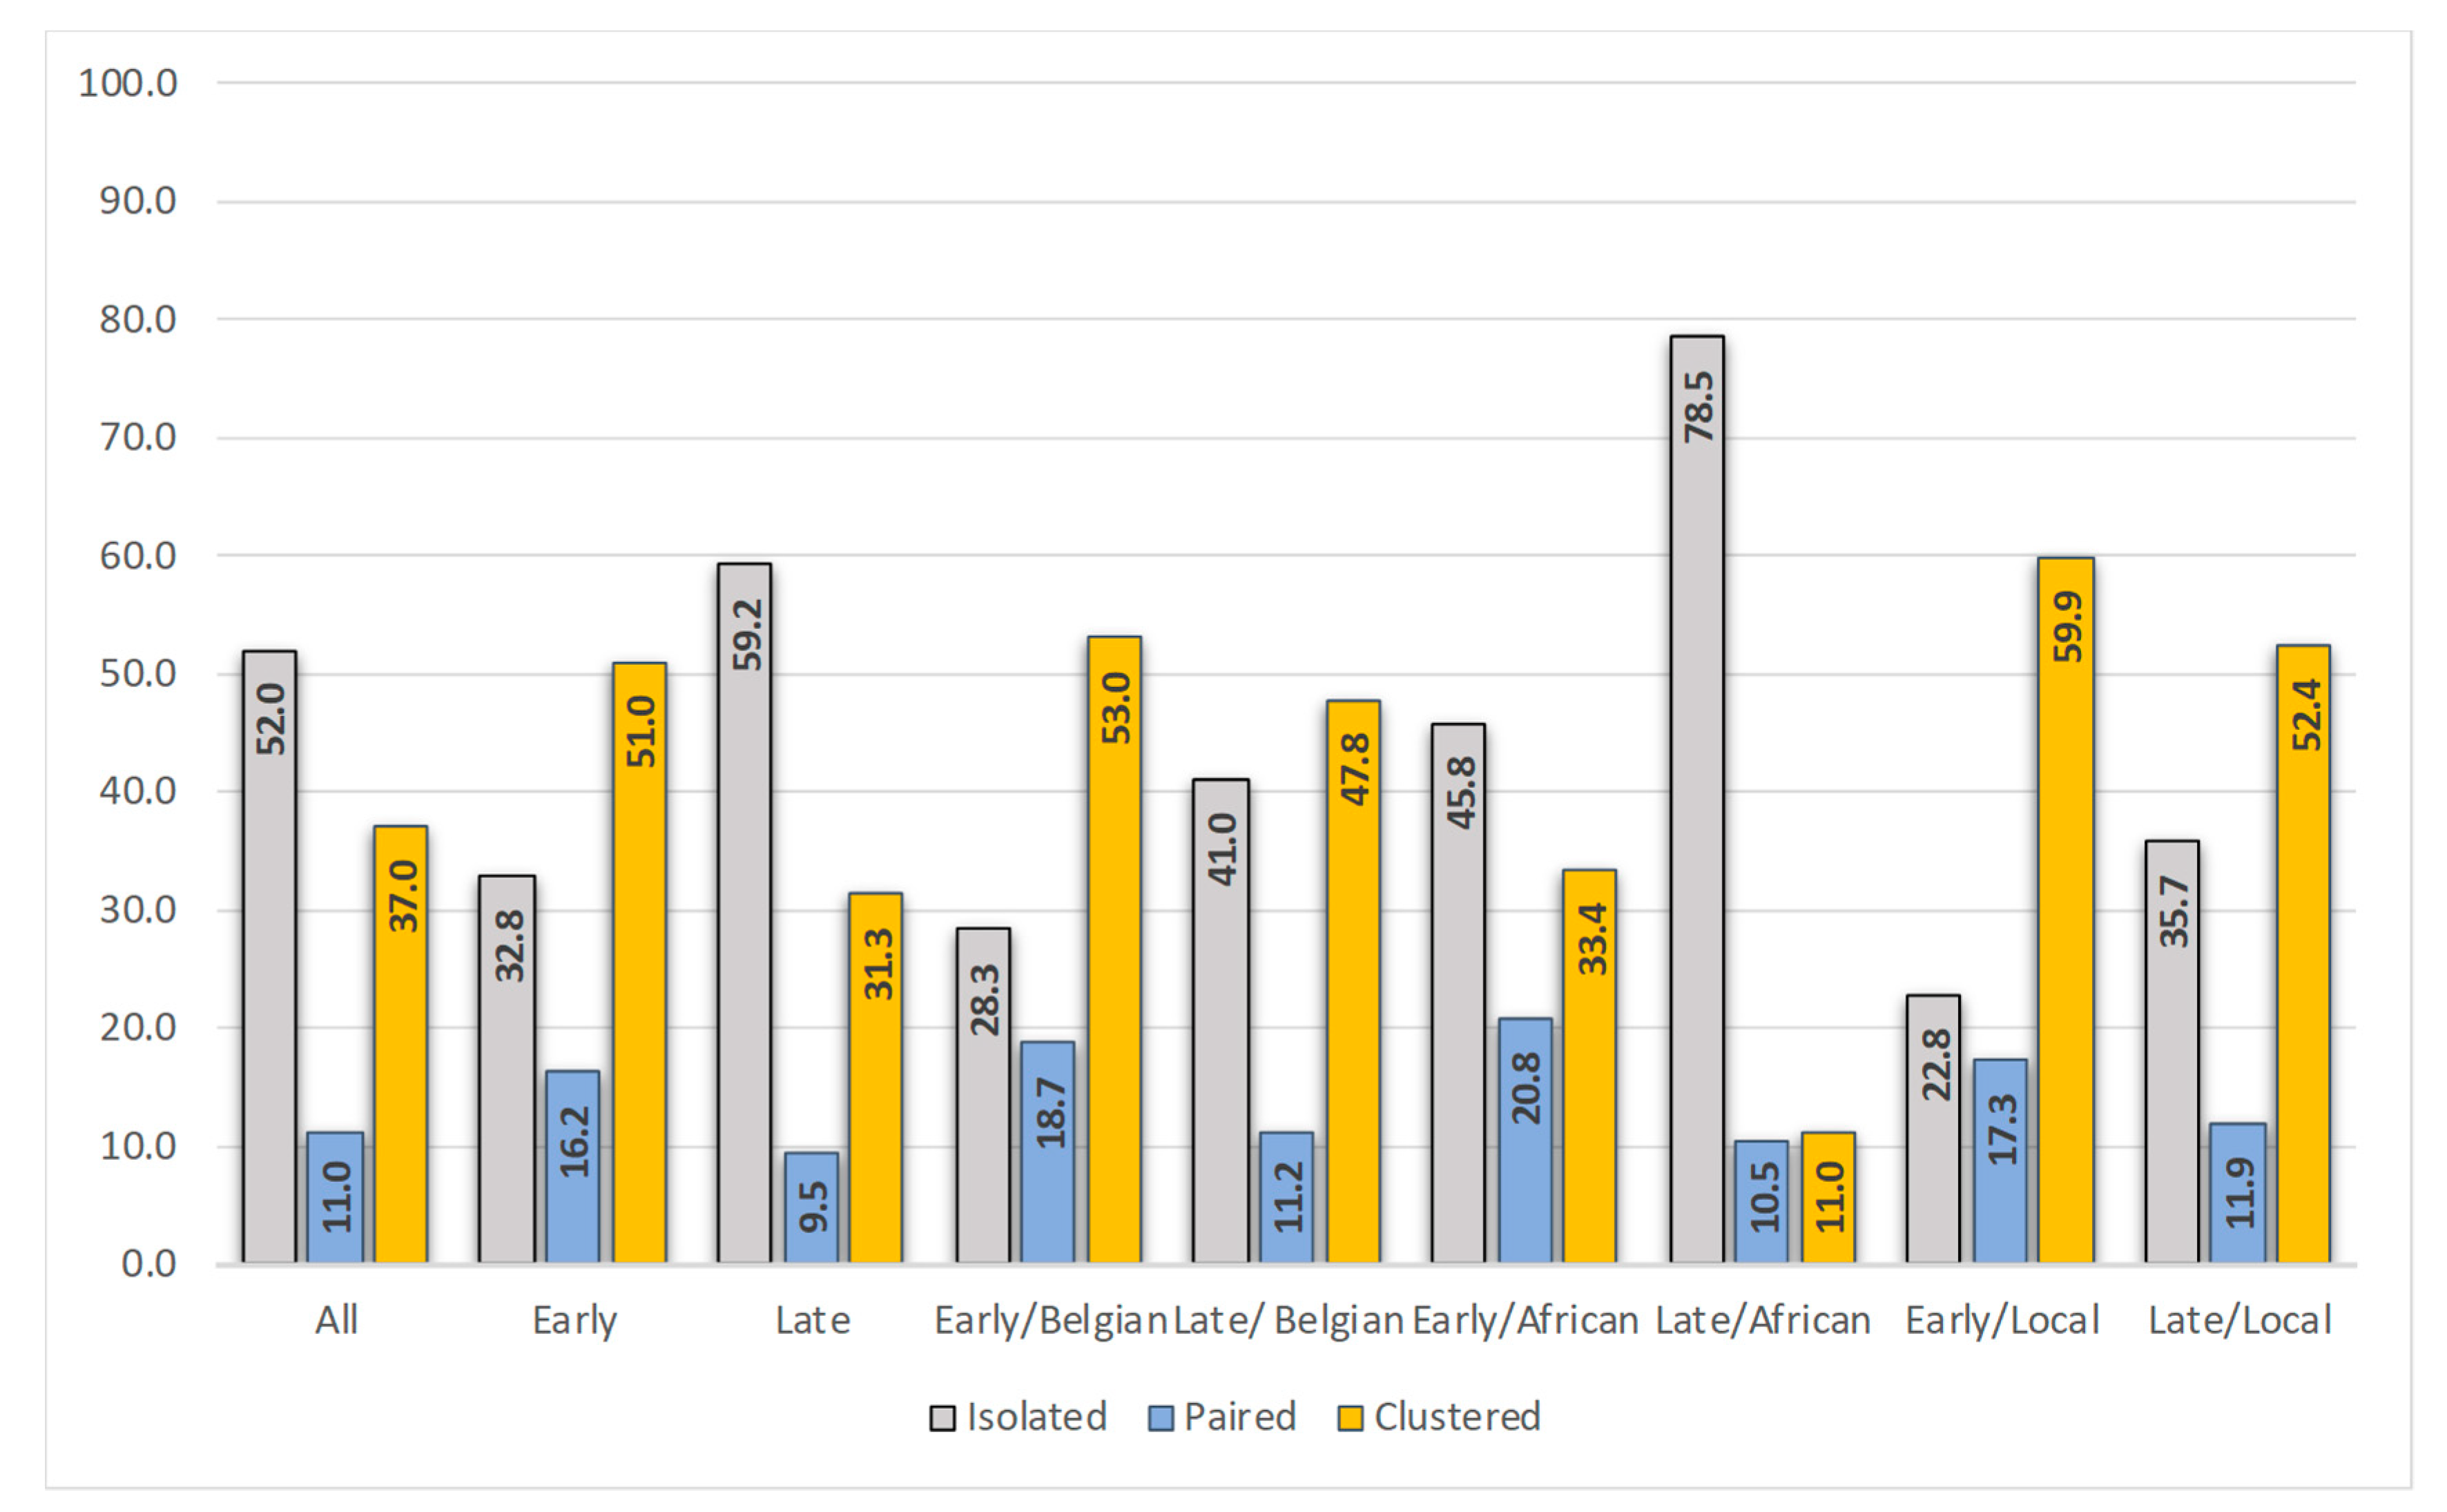
3.3. Position in the Phylogenetic Tree and Time of Diagnosis

Overall, a close genetic counterpart in the phylogenetic tree was found for 448 (48.3%) of the 927 patients. Of the 265 early diagnosed, 67.2% were linked, and of the 662 late diagnosed, 40.8% were linked. When considering only patients of Belgian origin, 71.7% of the early diagnosed and 58.9% of the late diagnosed were linked. Figure 2 shows the distribution of positions in the phylogenetic tree (isolated, paired, clustered) for the different populations.
A total of 105 clusters with at least one new member belonging to the study population was identified. For the five clusters with the highest increase in new members in 2014 and 2016 (respectively 46, 20, 15, 12, and 10 new members), the ratio of early/late diagnosed individuals (18/28, 10/10, 5/10, 6/6, and 8/2) revealed a nearly equal representation.

3.4. Characteristics of the Patients Infected in Belgium

Of the 449 patients for whom information on the most likely location of infection was available, 312 (69.5%) reported being infected in Belgium. Patients infected locally were predominantly male (86.9%), of Belgian origin (75.2%), MSM (71.5%), and infected with HIV-1 subtype B (64.7%). A close link in the phylogenetic tree was found for 69.6% (14.1% paired and 55.4% clustered) and 40.7% were early diagnosed. Older age was found to be significantly associated with being diagnosed late (OR 0.975; p = 0.015; 95% confidence interval 0.955–0.995). Figure 2 shows the distribution of positions in the phylogenetic tree for the early and late diagnosed, locally infected, individuals. Only 22.8% of the early diagnosed in Belgium resided on an isolated branch in the tree. These patients were more frequently infected with a subtype A, CRF02_AG, C or D virus (31.0% versus 11.8% in the clustered early diagnosed individuals).

4. Discussion

Study of the relationship between HIV sequences from patients of defined geographic regions can provide a unique insight into local epidemics. Combination of this information with demographic data and with information on the time between infection and diagnosis may help to better characterize the patients that were infected recently and thus escaped prevention measures. This information may help to increase the efficacy of prevention measures. Unless a seroconversion is demonstrated however, defining the time between infection and diagnosis is challenging. We used a previously validated algorithm that allows to discriminate between patients diagnosed less than four months after infection (early diagnosed) and patients diagnosed at least four months after infection (late diagnosed) [21]. The algorithm relies on two commercial HIV incidence assays, the Sedia BED HIV-1 EIA and the Sedia HIV-1 LAg-Avidity EIA that respectively assess HIV-1 specific antibody concentration and HIV-1 specific antibody affinity. Both assays have been extensively validated and proven to be reliable although the false prediction of an early infection cannot be fully ruled out [25,26,27]. To minimize the number of false predictions, we therefore included in the study population only patients with a concordant result for both assays. Overall, a high percentage (28.6%) of the study patients were classified as early diagnosed.
As HIV care and laboratory monitoring in Belgium is well centralized and baseline resistance testing is routinely performed for all newly diagnosed and treatment-naive individuals that enter care, we assume that our study population includes the majority of patients first-time diagnosed in our country over the intended period. Analyses for infection time were done for patients diagnosed in 2014 and 2016. The phylogenetic analysis however covered the years 2013 to 2017 to ensure that potential sources diagnosed the same year or the year before or after diagnosis of the study patients could be traced. Based on previous experience, we used stringent criteria to define phylogenetic clustering in order to maximize the chance that linkages identified resulted from recent transmission events [13,28,29]. For nearly half (48.3%) of the study population a close genetic link was found in the phylogenetic tree. This percentage is at the higher end of figures reported for comparable populations [4,30,31,32,33,34,35,36,37]. A one-to-one comparison of these studies is however hampered by differences in time period, depth of sampling, geographical region, degree of heterogeneity of the studied population, and lack of uniformity in methods and definition [38]. In our population for instance, marked differences were observed between the patients of Belgian origin and the patients of African origin. Patients of African origin were more often diagnosed late and more frequently found on isolated branches in the phylogenetic tree. This is in line with the assumption that most Africans diagnosed in Belgium were infected abroad. Information on the time of migration to Belgium is unknown so it cannot be excluded that part of the Africans were infected locally by source partners not diagnosed in the covered time frame. Only a limited number of Africans were diagnosed early. These early diagnosed individuals showed high involvement in pairs and clusters, supporting local transmission and participation in existing sexual networks as reported before [13].
Of the overall 265 early diagnosed patients, 50.9% were members of a cluster, a number that increased to 71.7% in case only individuals of Belgian origin were considered. These percentages are well above the 27% of early diagnosed with a phylogenetic link reported for a comparable study in Paris [33]. Although a close link in the phylogenetic tree is not a direct evidence for one-to-one forward transmission, the findings do indicate that the majority of early diagnosed patients in our study population were infected through contact with sexual networks that include already diagnosed individuals though more thorough studies on cluster dynamics will be needed to support this statement [39]. Only 22.8% (29/265) of the early diagnosed patients reporting infection in Belgium were located on isolated branches in the phylogenetic tree. Interestingly, these individuals showed a high prevalence of African subtypes (A, CRF02_AG, C, and D). This may suggest infection by an African partner not diagnosed in Belgium in the covered time frame. Referral to testing and care is known to be more problematic in migrants [1].
Late diagnosed patients constituted a heterogeneous group, but late diagnosed patients that reported infection in Belgium did not differ in characteristics from the early diagnosed locally infected individuals. Acute infection is generally considered the most critical period for transmission because of the high viral load, lack of awareness, and increased risk behavior around the time of infection. A high representation of recently infected patients in phylogenetic clusters is reported in many studies and considered as an important argument supporting this view [12,34,40,41]. Others however have toned down this opinion or reported on the limitations of phylogenetic analysis to define timing of transmission [15,33,42,43,44]. The observed nearly equal involvement of early and late diagnosed patients in transmission clusters in the study presented (respectively 59.9% and 52.4%) is in-line with the observations of Robineau et al. who also reported a mix of early and late diagnosed individuals in transmission networks [33]. Further investigations are needed to define the effective contribution of each on transmission as well as the most likely time of transmission, as individuals diagnosed late may have transmitted early after infection.
The high number of newly diagnosed individuals that could be linked with a potential source of infection supports the belief that the diagnostic coverage in our country is high, at least for the patients infected locally. It also suggests that an important part of these infections could have been prevented because they occurred through contacts with sexual networks that include HIV diagnosed individuals. The high involvement of patients diagnosed more than four months after infection in these transmission clusters points to a need for more timely diagnosis in order to limit opportunities for transmission. Better understanding of the behavior of individuals in transmission clusters may help to define the reasons for delayed diagnosis. The observation that late diagnosed individuals are of older age is not new but interesting as several research groups have reported age-discrepant transmission, with the selection of older sexual partners being significantly associated with HIV infection in young MSM [32,45,46]. Also, the cross border connections of transmission clusters with other European countries will be worthwhile to examine.
Targeting the sexual networks behind transmission clusters will be key for a more impactful deployment of prevention measures to protect still uninfected network members. In this regard, the Transmission Reduction Intervention Project (TRIP) is a promising initiative [47]. The goal of this initiative is to identify not yet diagnosed infections through partner tracing of the newly diagnosed individuals. The project has been successfully implemented in Ukraine, Greece, and the US [11,48,49,50]. The combination of partner tracing initiatives with real-time phylogenetics and infection time analysis may increase the effectiveness of the approach because it will allow to focus on the most active transmission clusters. Extensive partner tracing and network analysis may also provide opportunities to identify priority candidates for pre-exposure prophylaxis (PrEP) [51]. PrEP was successfully introduced in Belgium mid-2017, after a demonstration project that included 200 participants [52]. The effect of this implementation needs to be followed over the coming years and phylogenetic as well as infection time analysis may be useful tools to do so.
Important strengths of this study are the nationwide coverage, the dense sampling, the use of very recent data, and the combination of phylogenetic analysis and infection time analysis. A limitation however is that for some variables, such as the presumed location of the infection, the number of missing data is large. Another limitation is that conclusions on transmission were drawn from indirect links, as the phylogenetic methods used do not define direct transmission nor the order of transmission. Moreover, the contribution of undiagnosed individuals, diagnosed individuals without a baseline resistance test, and individuals diagnosed before 2013 or after 2017 could not be assessed.
Despite these limitations our data revealed some important characteristics of the local HIV epidemic that may offer new opportunities for prevention. Decreasing the time between infection and diagnosis and increasing the awareness of prevention as well as promotion of PrEP and/or condom use in not yet infected partners of sexual networks linked with HIV transmission clusters will be key to further limit local expansion of HIV.

Author Contributions

Conceptualization, C.V.; methodology, V.M., K.D., K.V.L.; formal analysis, G.D., M.-L.D., K.F., A.S., K.S., F.V., D.V., E.V.; data curation, C.V., V.M.; writing—original draft preparation, C.V., K.V.L.; writing—review and editing, J.D., D.V.B., S.C., K.S.

Funding

The Belgian AIDS Reference Laboratories are supported by the Belgian Ministry of Social Affairs through a fund within the Health Insurance System. This work was also financed by the King Baudouin Foundation (grant no.: 2013-J1820640-201099).

Acknowledgments

The authors would like to thank Delfien Staelens and Marlies Schauvliege for performing the infection time analysis. The authors are also very grateful to the patients and clinicians for their participation.

Conflicts of Interest

The authors declare no conflict of interest.The funders had no role in the design of the study; in the collection, analyses, or interpretation of data; in the writing of the manuscript, or in the decision to publish the results”.

References

  1. Van Beckhoven, D.; Florence, E.; Ruelle, J.; Deblonde, J.; Verhofstede, C.; Callens, S.; Vancutsem, E.; Lacor, P.; Demeester, R.; Goffard, J.C.; et al. Good continuum of HIV care in Belgium despite weaknesses in retention and linkage to care among migrants. BMC Infect. Dis. 2015, 15, 496. [Google Scholar] [CrossRef] [PubMed]
  2. Sasse, A.; Deblonde, J.; Van Beckhoven, D. Epidemiology of AIDS and HIV in Belgium: Situation on 31 December 2017. Sciensano. Available online: http://doi.org/10.25608/NBWP-GJ70 (accessed on 25 August 2019).
  3. European Centre for Disease Prevention and Control, World Health Organization (WHO) Regional Office for Europe. HIV/AIDS Surveillance in Europe 2018-2017 Data. Available online: https://ecdc.europa.eu/en/publications-data/presentation-hivaids-surveillance-europe-2018-2017-data (accessed on 25 August 2019).
  4. Dennis, A.M.; Hue, S.; Hurt, C.B.; Napravnik, S.; Sebastian, J.; Pillay, D.; Eron, J.J. Phylogenetic insights into regional HIV transmission. AIDS 2012, 26, 1813–1822. [Google Scholar] [CrossRef] [PubMed]
  5. Dennis, A.M.; Herbeck, J.T.; Brown, A.L.; Kellam, P.; de Oliveira, T.; Pillay, D.; Fraser, C.; Cohen, A.S. Phylogenetic Studies of Transmission Dynamics in Generalized HIV Epidemics: An Essential Tool Where the Burden is Greatest? J. Acq. Immun. Def. Synd. 2014, 67, 181–195. [Google Scholar] [CrossRef] [PubMed]
  6. Lubelchek, R.J.; Hoehnen, S.C.; Hotton, A.L.; Kincaid, S.L.; Barker, D.E.; French, A.L. Transmission Clustering Among Newly Diagnosed HIV Patients in Chicago, 2008 to 2011: Using Phylogenetics to Expand Knowledge of Regional HIV Transmission Patterns. J. Acq. Immun. Def. Synd. 2015, 68, 46–54. [Google Scholar] [CrossRef] [PubMed]
  7. Oster, A.M.; Wertheim, J.O.; Hernandez, A.L.; Ocfemia, M.C.B.; Saduvala, N.; Hall, H.I. Using Molecular HIV Surveillance Data to Understand Transmission Between Subpopulations in the United States. J. Acq. Immun. Def. Synd. 2015, 70, 444–451. [Google Scholar] [CrossRef]
  8. Fisher, M.; Pao, D.; Brown, A.E.; Sudarshi, D.; Gill, O.N.; Cane, P.; Buckton, A.J.; Parry, J.V.; Johnson, A.M.; Sabin, C.; et al. Determinants of HIV-1 transmission in men who have sex with men: A combined clinical, epidemiological and phylogenetic approach. AIDS 2010, 24, 1739–1747. [Google Scholar] [CrossRef]
  9. De Oliveira, T.; Kharsany, A.B.M.; Graf, T.; Cawood, C.; Khanyile, D.; Grobler, A.; Puren, A.; Madurai, S.; Baxter, C.; Karim, Q.A.; et al. Transmission networks and risk of HIV infection in KwaZulu-Natal, South Africa: A community-wide phylogenetic study. Lancet HIV 2017, 4, E41–E50. [Google Scholar] [CrossRef]
  10. Paraskevis, D.; Nikolopoulos, G.K.; Sypsa, V.; Psichogiou, M.; Pantavou, K.; Kostaki, E.; Karamitros, T.; Paraskeva, D.; Schneider, J.; Malliori, M.; et al. Molecular investigation of HIV-1 cross-group transmissions during an outbreak among people who inject drugs (2011-2014) in Athens, Greece. Infect. Genet. Evol. 2018, 62, 11–16. [Google Scholar] [CrossRef]
  11. Morgan, E.; Nyaku, A.N.; D’Aquila, R.T.; Schneider, J.A. Determinants of HIV Phylogenetic Clustering in Chicago Among Young Black Men Who Have Sex with Men From the uConnect Cohort. J. Acq. Immun. Def. Synd. 2017, 75, 265–270. [Google Scholar] [CrossRef]
  12. Brenner, B.G.; Ibanescu, R.I.; Hardy, I.; Roger, M. Genotypic and Phylogenetic Insights on Prevention of the Spread of HIV-1 and Drug Resistance in “Real-World” Settings. Viruses 2018, 10, 10. [Google Scholar] [CrossRef]
  13. Verhofstede, C.; Dauwe, K.; Fransen, K.; Van Laethem, K.; Van den Wijngaert, S.; Ruelle, J.; Delforge, M.L.; Vancutsem, E.; Vaira, D.; Stoffels, K.; et al. Phylogenetic analysis of the Belgian HIV-1 epidemic reveals that local transmission is almost exclusively driven by men having sex with men despite presence of large African migrant communities. Infect. Genet. Evol. 2018, 61, 36–44. [Google Scholar] [CrossRef] [PubMed]
  14. Pilcher, C.D.; Tien, H.C.; Eron, J.J.; Vernazza, P.L.; Leu, S.Y.; Stewart, P.W.; Goh, L.E.; Cohen, M.S.; Quest, S.; Duke, U.N. Brief but efficient: Acute HIV infection and the sexual transmission of HIV. J. Infect. Dis. 2004, 189, 1785–1792. [Google Scholar] [CrossRef] [PubMed]
  15. Quinn, T.C.; Wawer, M.J.; Sewankambo, N.; Serwadda, D.; Li, C.J.; Wabwire-Mangen, F.; Meehan, M.O.; Lutalo, T.; Gray, R.H. Viral load and heterosexual transmission of human immunodeficiency virus type 1. N. Engl. J. Med. 2000, 342, 921–929. [Google Scholar] [CrossRef]
  16. Powers, K.A.; Ghani, A.C.; Miller, W.C.; Hoffman, I.F.; Pettifor, A.E.; Kamanga, G.; Martinson, F.E.A.; Cohen, M.S. The role of acute and early HIV infection in the spread of HIV and implications for transmission prevention strategies in Lilongwe, Malawi: A modelling study. Lancet 2011, 378, 256–268. [Google Scholar] [CrossRef]
  17. Yerly, S.; Vora, S.; Rizzardi, P.; Chave, J.P.; Vernazza, P.L.; Flepp, M.; Telenti, A.; Battegay, M.; Veuthey, A.L.; Bru, J.P.; et al. Acute HIV infection: Impact on the spread of HIV and transmission of drug resistance. AIDS 2001, 15, 2287–2292. [Google Scholar] [CrossRef] [PubMed]
  18. Brenner, B.G.; Roger, M.; Routy, J.P.; Moisi, D.; Ntemgwa, M.; Matte, C.; Baril, J.G.; Thomas, R.; Rouleau, D.; Bruneau, J.; et al. High rates of forward transmission events after acute/early HIV-1 infection. J. Infect. Dis. 2007, 195, 951–959. [Google Scholar] [CrossRef]
  19. Pineda-Pena, A.C.; Faria, N.R.; Imbrechts, S.; Libin, P.; Abecasis, A.B.; Deforche, K.; Gomez-Lopez, A.; Camacho, R.J.; de Oliveira, T.; Vandamme, A.M. Automated subtyping of HIV-1 genetic sequences for clinical and surveillance purposes: Performance evaluation of the new REGA version 3 and seven other tools. Infect. Genet. Evol. 2013, 19, 337–348. [Google Scholar] [CrossRef]
  20. Struck, D.; Lawyer, G.; Ternes, A.M.; Schmit, J.C.; Bercoff, D.P. COMET: Adaptive context-based modeling for ultrafast HIV-1 subtype identification. Nucleic Acids Res. 2014, 42, e144. [Google Scholar] [CrossRef]
  21. Verhofstede, C.; Fransen, K.; Van Den Heuvel, A.; Van Laethem, K.; Ruelle, J.; Vancutsem, E.; Stoffels, K.; Van den Wijngaert, S.; Delforge, M.L.; Vaira, D.; et al. Decision tree for accurate infection timing in individuals newly diagnosed with HIV-1 infection. BMC Infect. Dis. 2017, 17, 738. [Google Scholar] [CrossRef]
  22. Hall, T.A. Bioedit: A user-friendly biological sequence alignment editor and analysis program for Windows 95/98/INT. Nucl. Acids. Symp. Ser. 1999, 41, 95–98. [Google Scholar]
  23. Guindon, S.; Dufayard, J.F.; Lefort, V.; Anisimova, M.; Hordijk, W.; Gascuel, O. New Algorithms and Methods to Estimate Maximum-Likelihood Phylogenies: Assessing the Performance of PhyML 3.0. Syst. Biol. 2010, 59, 307–321. [Google Scholar] [CrossRef] [PubMed]
  24. Anisimova, M.; Gascuel, O. Approximate likelihood-ratio test for branches: A fast, accurate, and powerful alternative. Syst. Biol. 2006, 55, 539–552. [Google Scholar] [CrossRef] [PubMed]
  25. Schlusser, K.E.; Pilcher, C.; Kallas, E.G.; Santos, B.R.; Deeks, S.G.; Facente, S.; Keating, S.M.; Busch, M.P.; Murphy, G.; Welte, A.; et al. Comparison of cross-sectional HIV incidence assay results from dried blood spots and plasma. PLoS ONE 2017, 12, e0172283. [Google Scholar] [CrossRef] [PubMed]
  26. Dobbs, T.; Kennedy, S.; Pau, C.P.; McDougal, J.S.; Parekh, B.S. Performance characteristics of the immunoglobulin G-capture BED-enzyme immunoassay, an assay to detect recent human immunodeficiency virus type 1 seroconversion. J. Clin. Microbiol. 2004, 42, 2623–2628. [Google Scholar] [CrossRef]
  27. Hanson, D.L.; Song, R.G.; Masciotra, S.; Hernandez, A.; Dobbs, T.L.; Parekh, B.S.; Owen, S.M.; Green, T.A. Mean Recency Period for Estimation of HIV-1 Incidence with the BED-Capture EIA and Bio-Rad Avidity in Persons Diagnosed in the United States with Subtype B. PLoS ONE 2016, 11, e0152327. [Google Scholar] [CrossRef]
  28. Chalmet, K.; Staelens, D.; Blot, S.; Dinakis, S.; Pelgrom, J.; Plum, J.; Vogelaers, D.; Vandekerckhove, L.; Verhofstede, C. Epidemiological study of phylogenetic transmission clusters in a local HIV-1 epidemic reveals distinct differences between subtype B and non-B infections. BMC Infect. Dis. 2010, 10, 262. [Google Scholar] [CrossRef] [PubMed]
  29. Dauwe, K.; Mortier, V.; Schauvliege, M.; Van den Heuvel, A.; Fransen, K.; Servais, J.Y.; Bercoff, D.P.; Seguin-Devaux, C.; Verhofstede, C. Characteristics and spread to the native population of HIV-1 non-B subtypes in two European countries with high migration rate. BMC Infect. Dis. 2015, 15, 524. [Google Scholar] [CrossRef]
  30. Bezemer, D.; Cori, A.; Ratmann, O.; van Sighem, A.; Hermanides, H.S.; Dutilh, B.E.; Gras, L.; Faria, N.R.; van den Hengel, R.; Duits, A.J.; et al. Dispersion of the HIV-1 Epidemic in Men Who Have Sex with Men in the Netherlands: A Combined Mathematical Model and Phylogenetic Analysis. PLoS Med. 2015, 12, e1001898. [Google Scholar] [CrossRef]
  31. Grande, K.M.; Schumann, C.L.; Ocfemia MC, B.; Vergeront, J.M.; Wertheim, J.O.; Oster, A.M. Transmission Patterns in a Low HIV-Morbidity State-Wisconsin, 2014–2017. MMWR-Morb. Mortal. Wkly. Rep. 2019, 68, 149–152. [Google Scholar] [CrossRef]
  32. Whiteside, Y.O.; Song, R.G.; Wertheim, J.O.; Oster, A.M. Molecular analysis allows inference into HIV transmission among young men who have sex with men in the United States. AIDS 2015, 29, 2517–2522. [Google Scholar] [CrossRef]
  33. Robineau, O.; Frange, P.; Barin, F.; Cazein, F.; Girard, P.M.; Chaix, M.L.; Kreplak, G.; Boelle, P.Y.; Morand-Joubert, L. Combining the Estimated Date of HIV Infection with a Phylogenetic Cluster Study to Better Understand HIV Spread: Application in a Paris Neighbourhood. PLoS ONE 2015, 10, e0135367. [Google Scholar] [CrossRef] [PubMed]
  34. Brenner, B.G.; Roger, M.; Stephens, D.; Moisi, D.; Hardy, I.; Weinberg, J.; Turgel, R.; Charest, H.; Koopman, J.; Wainberg, M. Transmission Clustering Drives the Onward Spread of the HIV Epidemic Among Men Who Have Sex with Men in Quebec. J. Infect. Dis. 2011, 204, 1115–1119. [Google Scholar] [CrossRef] [PubMed]
  35. Chan, P.A.; Hogan, J.W.; Huang, A.; DeLong, A.; Salemi, M.; Mayer, K.H.; Kantor, R. Phylogenetic Investigation of a Statewide HIV-1 Epidemic Reveals Ongoing and Active Transmission Networks Among Men Who Have Sex with Men. J. Acq. Immun. Def. Synd. 2015, 70, 428–435. [Google Scholar] [CrossRef] [PubMed] [Green Version]
  36. Brenner, B.; Ibanescu, R.I.; Roger, M.; Oliveira, M.; Hardy, I.; Wainberg, M. Phylogenetic, epidemiological and virological insights on the rise of large cluster outbreaks fuelling the HIV-1 epidemic among men having sex with men within Quebec. J. Int. Aids Soc. 2017, 20, 98–99. [Google Scholar]
  37. Patino-Galindo, J.A.; Torres-Puente, M.; Bracho, M.A.; Alastrue, I.; Juan, A.; Navarro, D.; Galindo, M.J.; Ocete, D.; Ortega, E.; Gimeno, C.; et al. The molecular epidemiology of HIV-1 in the Comunidad Valenciana (Spain): Analysis of transmission clusters. Sci. Rep. 2017, 7, 11584. [Google Scholar] [CrossRef] [Green Version]
  38. Ragonnet-Cronin, M.L.; Shilaih, M.; Günthard, H.F.; Hodcroft, E.B.; Böni, J.; Fearnhill, E.; Dunn, D.; Yerly, S.; Klimkait, T.; Aubert, V.; et al. A direct comparison of two densely sampled HIV epidemics: The UK and Switzerland. Sci. Rep. 2016, 6, 32251. [Google Scholar] [CrossRef] [Green Version]
  39. Voltz, E.M.; Koopman, J.S.; Ward, M.J.; Brown, A.L.; Frost, S.D.W. Simple epidemiological dynamics explain phylogenetic clustering of HIV from patients with recent infection. PLos Comput. Biol. 2012, 8, e1002552. [Google Scholar]
  40. Volz, E.M.; Ionides, E.; Romero-Severson, E.O.; Brandt, M.G.; Mokotoff, E.; Koopman, J.S. HIV-1 Transmission during Early Infection in Men Who Have Sex with Men: A Phylodynamic Analysis. PLoS Med. 2013, 10, e1001568. [Google Scholar] [CrossRef]
  41. Ratmann, O.; van Sighem, A.; Bezemer, D.; Gavryushkina, A.; Jurriaans, S.; Wensing, A.; de Wolf, F.; Reiss, P.; Fraser, C. Sources of HIV infection among men having sex with men and implications for prevention. Sci. Transl. Med. 2016, 8, 320ra2. [Google Scholar] [CrossRef] [Green Version]
  42. Audelin, A.M.; Cowan, S.A.; Obel, N.; Nielsen, C.; Jorgensen, L.B.; Gerstoft, J. Phylogenetics of the Danish HIV Epidemic: The Role of Very Late Presenters in Sustaining the Epidemic. J. Acq. Immun. Def. Synd. 2013, 62, 102–108. [Google Scholar] [CrossRef]
  43. Montaner, J.S.G.; Lima, V.D.; Barrios, R.; Yip, B.; Wood, E.; Kerr, T.; Shannon, K.; Harrigan, P.R.; Hogg, R.S.; Daly, P.; et al. Association of highly active antiretroviral therapy coverage, population viral load, and yearly new HIV diagnoses in British Columbia, Canada: A population-based study. Lancet 2010, 376, 532–539. [Google Scholar] [CrossRef] [Green Version]
  44. Brown, A.E.; Gifford, R.J.; Clewley, J.P.; Kucherer, C.; Masquelier, B.; Porter, K.; Balotta, C.; Back NK, T.; Jorgensen, L.B.; de Mendoza, C.; et al. Phylogenetic Reconstruction of Transmission Events from Individuals with Acute HIV Infection: Toward More-Rigorous Epidemiological Definitions. J. Infect. Dis. 2009, 199, 427–431. [Google Scholar] [CrossRef]
  45. Coburn, B.J.; Blower, S. A Major HIV Risk Factor for Young Men Who Have Sex With Men Is Sex with Older Partners. J. Acq. Immun. Def. Syndr. 2010, 54, 113–114. [Google Scholar] [CrossRef]
  46. Hurt, C.B.; Matthews, D.D.; Calabria, M.S.; Green, K.A.; Adimora, A.A.; Golin, C.E.; Hightow-Weidman, L.B. Sex With Older Partners Is Associated With Primary HIV Infection Among Men Who Have Sex with Men in North Carolina. J. Acq. Immun. Def. Syndr. 2010, 54, 185–190. [Google Scholar] [CrossRef] [Green Version]
  47. Nikolopoulos, G.K.; Pavlitina, E.; Muth, S.Q.; Schneider, J.; Psichogiou, M.; Williams, L.D.; Paraskevis, D.; Sypsa, V.; Magiorkinis, G.; Smyrnov, P.; et al. A network intervention that locates and intervenes with recently HIV-infected persons: The Transmission Reduction Intervention Project (TRIP). Sci. Rep. 2016, 6, 38100. [Google Scholar] [CrossRef]
  48. Vasylyeva, T.I.; Friedman, S.R.; Paraskevis, D.; Magiorkinis, G. Integrating molecular epidemiology and social network analysis to study infectious diseases: Towards a socio-molecular era for public health. Infect. Genet. Evol. 2016, 46, 248–255. [Google Scholar] [CrossRef] [Green Version]
  49. Kostaki, E.G.; Frampton, D.; Paraskevis, D.; Pantavou, K.; Ferns, B.; Raffle, J.; Grants, P.; Kozlakidis, Z.; Hadjikou, A.; Pavlitina, E.; et al. Near Full-length Genomic Sequencing and Molecular Analysis of HIV-Infected Individuals in a Network-based Intervention (TRIP) in Athens, Greece: Evidence that Transmissions Occur More Frequently from those with High HIV-RNA. Curr. HIV Res. 2018, 16, 345–353. [Google Scholar] [CrossRef]
  50. Smyrnov, P.; Williams, L.D.; Korobchuk, A.; Sazonova, Y.; Nikolopoulos, G.K.; Skaathun, B.; Morgan, E.; Schneider, J.; Vasylyeva, T.I.; Friedman, S.R. Risk network approaches to locating undiagnosed HIV cases in Odessa, Ukraine. J. Int. Aids Soc. 2018, 21, e25040. [Google Scholar] [CrossRef]
  51. Schueler, K.; Ferreira, M.; Nikolopoulos, G.; Skaathun, B.; Paraskevis, D.; Hatzakis, A.; Friedman, S.R.; Schneider, J.A. Pre-exposure Prophylaxis (PrEP) Awareness and Use Within High HIV Transmission Networks. AIDS Behav. 2019, 23, 1893–1903. [Google Scholar] [CrossRef]
  52. Vuylsteke, B.; Reyniers, T.; Lucet, C.; Nostlinger, C.; Deblonde, J.; Libois, A.; Sauvage, A.S.; Deprez, E.; Goffard, J.C.; Allard, S.D.; et al. High uptake of pre-exposure prophylaxis (PrEP) during early roll-out in Belgium: Results from surveillance reports. Sex. Health 2019, 16, 80–83. [Google Scholar] [CrossRef]
Figure 1. Phylogenetic tree of sequences from human immunodeficiency virus (HIV)-1 infected patients newly diagnosed in Belgium between 2013 and 2017. Tree branches are colored according to subtype. The tree is rooted on a reference subtype J sequence.
Viruses 11 01096 g001
Figure 2. Position in the phylogenetic tree (isolated, paired or clustered, %) for the complete study population (all, n = 927), the early diagnosed (n = 265), late diagnosed (n = 662), early diagnosed of Belgian origin (n = 134), late diagnosed of Belgian origin (n = 224), early diagnosed of Sub-Saharan African origin (n = 24), late diagnosed of Sub-Saharan African origin (n = 172), early diagnosed locally infected (n = 127), and late diagnosed locally infected (n = 185).
Viruses 11 01096 g002
Table 1. Characteristics associated with being diagnosed early. Results of univariate and multivariate stepwise logistic regression analysis.
Univariate AnalysisMultivariate Analysis
nORp-Value95% Confidence IntervalORp-Value95% Confidence Interval
Age (per year increase)
9270.9910.181(0.979–1.004)
Year of diagnosis
20144371.000-Ref
20164901.0200.893(0.767–1.357)
Gender NS
Male7171.000-Ref
Female2100.373<0.001(0.248–0.561)
Position in tree
Isolated4791.000-Ref1.000-Ref
Clustered1062.939<0.001(2.139–4.038)2.076<0.001(1.475–2.921)
Paired3423.075<0.001(1.957–4.833)2.65<0.001(1.648–4.263)
Transmission risk
MSM4131.000-Ref1.000-Ref
Heterosexual3060.340<0.001(0.240–0.483)0.486<0.001(0.334–0.707)
Other130.1270.048(0.016–0.982)0.2240.164(0.027–1.839)
Unknown1950.442<0.001(0.300–0.653)0.7020.116(0.451–1.091)
Origin NS
Belgian3581.000-Ref
African1960.233<0.001(0.145–0.376)
European980.7030.153(0.433–1.140)
Other660.5800.071(0.321–1.048)
Unknown2090.6890.047(0.477–0.995)
Location of infection
Belgium3121.000-Ref1.000-Ref
Africa730.062<0.001(0.019–0.203)0.1400.001(0.042–0.470)
Europe320.7630.488(0.356–1.638)0.9390.878(0.421–2.092)
Other320.6620.301(0.303–1.145)1.2410.613(0.538–2.865)
Unknown4780.456<0.001(0.335–0.621)0.620.008(0.436–0.881)
Subtype NS
B4551.000-Ref
02_AG1080.7320.191(0.458–1.168)
F791.2200.430(0.744–2.001)
A780.4360.008(0.237–0.803)
C660.3150.002(0.152–0.653)
01_AE330.9970.993(0.471–2.109)
Other/undefined1080.4530.003(0.269–0.764)
OR: odds ratio; Ref: used as reference.; NS: non-significant after multivariate analysis; MSM: men having sex with men.
Table 2. Characteristics associated with being of African origin (in comparison with being of Belgian origin). Results of univariate and multivariate stepwise logistic regression analysis.
Univariate AnalysisMultivariate Analysis
Risk FactorsnORp-Value95% Confidence IntervalORp-Value95% Confidence Interval
Age (per year increase)
5540.958<0.001(0.958–0.974)0.928<0.001(0.904–0.953)
Year of diagnosis
20142761.000-Ref
20162780.8990.551(0.635–1.274)
Infection Stage NS
Early1581.000-Ref
Late3964.287<0.001(2.659–6.913)
Gender
Male4181.000-Ref1.000-Ref
Female13613.639<0.001(8.504–21.876)2.5290.013(1.214–5.266)
Position in tree NS
Isolated2731.000-Ref
Clustered730.153<0.001(0.097–0.241)
Paired2080.4180.002(0.242–0.723)
Transmission risk
MSM2801.000-Ref1.000-Ref
Heterosexual23411.339<0.001(7.221–17.806)3.4140.001(1.710–6.816)
Other1018.083<0.001(4.452–73.457)2.8850.267(0.445–18.710)
Unknown3011.625<0.001(5.130–26.341)6.7940.001(2.124–21.728)
Location of infection
Belgium2451.000-Ref1.000-Ref
Africa70104.963<0.001(38.861–283.506)17.405<0.001(5.551–54.574)
Europe140.6210.652(0.078–4.936)0.8540.894(0.083–8.755)
Other140.6210.652(0.078–4.936)3.8330.281(0.333–44.090)
Not reported2117.556<0.001(4.664–12.241)4.799<0.001(2.554–9.017)
Subtype
B2591.000-Ref1.000-Ref
02_AG8021.311<0.001(11.303–40.181)8.875<0.001(3.963–19.873)
F511.9090.144(0.802–4.546)1.1960.729(0.433–3.301)
A3626.678<0.001(11.452–62.149)8.423<0.001(2.878–24.648)
C4541.043<0.001(17.601–95.707)22.628<0.001(7.247–70.653)
01_AE130.8550.883(0.106–6.875)0.5640.629(0.055–5.745)
Other/undefined7022.387<0.001(11.550–43.392)6.581<0.001(2.753–15.728)
OR: odds ratio; Ref: used as reference. NS: non-significant after multivariate analysis.

