Article

Analysis of Acute and Short-Term Fluoride Toxicity in Zebrafish Embryo and Sac–Fry Stages Based on Bayesian Model Averaging

1
Department of Toxicology, School of Public Health, Jiangsu Key Laboratory of Preventive and Translational Medicine for Major Chronic Non-communicable Diseases, MOE Key Laboratory of Geriatric Diseases and Immunology, Suzhou Medical College of Soochow University, Suzhou 215123, China
2
School of Public Health, The Key Laboratory of Environmental Pollution Monitoring and Disease Control, Ministry of Education, Guizhou Medical University, No.6 Ankang Road, Guian New Area, Guizhou 561113, China
3
School of Environmental Studies, China University of Geosciences, Wuhan 430074, China
*
Authors to whom correspondence should be addressed.
These authors contributed equally to this work.
Toxics 2024, 12(12), 902; https://doi.org/10.3390/toxics12120902
Submission received: 12 November 2024 / Revised: 4 December 2024 / Accepted: 9 December 2024 / Published: 11 December 2024

Abstract

:
Acute and short-term toxicity tests are foundational to toxicology research. These tests offer preliminary insights into the fundamental toxicity characteristics of the chemicals under evaluation and provide essential data for chronic toxicity assessments. Fluoride is a common chemical in aquatic environments; however, the findings of toxicological data, such as LC50 for aquatic organisms, often exhibit inconsistency. Consequently, this study employed zebrafish as a model organism during their early life stages to assess the acute and short-term toxicity of fluoride exposure. Bayesian model averaging was utilized to calculate the LC50/EC50 values and establish baseline concentrations. The results indicated a dose–response relationship between water fluoride concentration and harmful outcomes. The 20 mg/L group was identified as the lowest observed adverse effect level (LOAEL) for the majority of toxicity indicators and warrants special attention. Based on the BBMD model averages, the LC50 of fluoride for 1 to 5 days post-fertilization (dpf) zebrafish was 147.00, 80.80, 61.25, 56.50, and 37.50 mg/L, while the EC50 of cumulative malformation rate for 5 dpf zebrafish was 59.75 mg/L. As the benchmark response (BMR) increased, both the benchmark concentrations (BMCs) and benchmark dose levels (BMDLs) also increased. The research aims to provide essential data for the development of environmental water guidelines and to mitigate ecological risks associated with fluoride in aquatic ecosystems.

Graphical Abstract

1. Introduction

Acute and short-term toxicity tests are fundamental components of toxicology research. These tests provide essential toxicological data regarding the test chemical, including median lethal dose (LC50), effect concentration for 50% effect (EC50), No Observed Adverse Effect Level (NOAEL), and Lowest observed adverse effect level (LOAEL). The acute toxicity test is specifically designed to determine the lethal dose or concentration of the test chemical in experimental animals, offering a preliminary estimation of the associated toxicity risk [1,2]. Furthermore, it seeks to elucidate the dose–response relationship between acute toxicity and the toxic characteristics of the test chemical [3]. The short-term toxicity test, as an extension, is designed to identify both lethal and limited sublethal effects of chemicals on specific stages and species. This test serves as a bridge between lethal and sublethal assessments, providing foundational data that support more complex investigations into sublethal effects, including physiological and behavioral changes, ecological toxicity, and the screening for chronic toxicity or whole-life stage tests [4]. The acute and short-term toxicity of chemicals is not entirely consistent across organisms at different life stages [5]. The early life stage, which encompasses the period from embryo to birth, represents a critical ‘window of opportunity’ for growth and development. Conducting acute and short-term toxicity tests during this timeframe not only yields traditional toxicological data but also facilitates the observation of stillbirths, deformities, and developmental delays induced by the tested chemicals. Furthermore, constructing dose–response models from these experimental results can provide valuable data for assessing potential ecological risks associated with the tested chemicals.
Fluoride is widely present in natural environments, being one of the strongest oxidants among known elements and the thirteenth most abundant element in the Earth’s crust [6]. The fluoride generated by both natural and anthropogenic factors constitutes the fluoride cycle within the ecosystem. The weathering of the mineral fluorite releases fluoride into the soil and groundwater [7]. Volcanic activity contributes fluoride to the soil through solidified magma following an eruption, while gas emissions containing hydrofluoric acid can contaminate the atmosphere with fluoride [8]. Additionally, marine aerosols release approximately 20,000 kg of inorganic fluoride into the atmosphere annually, with certain fluorinated gases being transported to the stratosphere [9]. These gaseous fluorides eventually settle in the soil over time [10]. Fluoride can also enter the environment through industrial and agricultural activities, as well as the discharge of domestic pollutants [11,12,13,14,15]. This fluoride subsequently enters biological organisms via various pathways, leading to a range of health risks [16,17,18,19].
Water is the most prevalent source of fluoride exposure in the environment [20]. Therefore, conducting acute and short-term toxicity experiments on fluoride exposure during the early life stages of aquatic organisms, along with calculating benchmark concentrations, can provide essential data for the formulation of environmental water guidelines and for reducing the ecological risks linked to fluoride in aquatic ecosystems. However, the findings of toxicological data, such as LC50 for aquatic organisms, often exhibit inconsistency, which primarily stems from the use of different experimental fish species across related studies and varying exposure durations [21,22,23,24,25]. Zebrafish are recognized as a sentinel species in aquatic environments and rank as the third most commonly used model organism in scientific research. They are endorsed as a standard model organism for chemical toxicity testing by the Organization for Economic Cooperation and Development (OECD), as well as in the Chinese technical guidelines for developing water quality standards for freshwater aquatic organisms [26,27]. Zebrafish are widely utilized in fields such as chemical toxicity assessment and ecological risk research to evaluate the potential toxicity of various compounds, including industrial wastewater, insecticides, herbicides, detergents, and pharmaceuticals [27,28,29,30]. Moreover, advancements in computational toxicology are increasing the potential for establishing human exposure thresholds based on findings from zebrafish toxicology research [31]. Consequently, conducting acute and short-term toxicity studies on fluoride exposure during the early life stages of zebrafish can provide a comprehensive understanding of fluoride toxicity and furnish essential information for updating fluoride water guidelines, thereby promoting the sustainable development of aquatic environments in the future. Furthermore, these tests are anticipated to yield fundamental data that can be used to extrapolate human exposure thresholds following technological advancements.
The LC50 and NOAEL of zebrafish larvae are derived from observations made during acute and short-term toxicity testing [4]. These values are determined based on the concentration of the test chemical and the corresponding mortality rate in the test animals. However, the choice of experimental design and mathematical modeling can significantly influence the results. The calculation of LC50 can utilize various methods, including Litchfield and Wilcoxon’s method, Karber’s method, and regression analysis. Notably, Karber’s method assumes that the response variable adheres to a normal distribution and that the exposure concentrations are organized in a proportional order [32]. Additionally, regression analysis must consider the goodness of fit for the models employed [33,34]. Litchfield and Wilcoxon’s method is widely regarded for its capacity to provide estimates of effective doses, even when data are limited. However, this strength is accompanied by a notable drawback: the method depends on the subjective placement of a straight line through hand-drawn points on graph paper. This process demands considerable time and attention, and it can yield inconsistent estimates that are vulnerable to human error [35]. The traditional NOAEL methods, as another fundamental datum, are influenced by factors including the number of experimental groups, sample size per group, and dose group spacing [32,36,37]. Consequently, the U.S. environmental protection agency (EPA) recommends utilizing the benchmark dose (BMD) and benchmark concentration (BMC), along with their respective lower limits of the 95% confidence interval (BMDL/BMCL), as substitutes [38,39]. However, selecting the appropriate model from a range of acceptable dose–response models remains a significant challenge, as common practices often fail to consider that different models may only partially represent the true dose–response relationship [40]. In order to account for uncertainty in model selection, the Bayesian model averaging (BMA) is proposed [41,42,43], which is a method to combine results from multiple models, allowing for a probabilistic interpretation of the combined cluster structure and quantification of model-based uncertainties [44]. In 2022, the European Food Safety Authority (EFSA) proposed a shift from the frequentist to the Bayesian paradigm for risk assessment. The frequentist approach measures uncertainty using confidence and significance levels, interpreted under hypothetical repetition, while the Bayesian approach assigns probability distributions to unknown parameters, extending the notion of probability to reflect the uncertainty of knowledge [45].
In summary, our study aims to calculate the LC50/EC50 and BMC/BMCL for various toxicity indicators related to water fluoride (W-F) exposure by utilizing BMA in zebrafish embryos and sac–fry stages.

2. Methods and Materials

2.1. Chemicals and Reagents

The sodium fluoride (NaF) used in this study was obtained from Zhiyuan Chemical Reagent Co., Ltd. (Tianjin, China). with a purity of 99% (CB/T: 1264-1997). Standard stock solutions of fluoride (100 mg/L) and standard solutions of fluoride (10 mg/L) were prepared following the national standard of the People’s Republic of China for water quality determination of fluoride using the ion selective electrode method (GB 7484-87) [46] by E3 water [47]. To ensure consistent concentrations throughout the research, standard stock solutions of fluoride and standard solutions of fluoride solution were stored at 4 °C, and working solutions were prepared using E3 water immediately before each experiment.

2.2. Selection Rationale of Fluoride Concentrations in the Current Study

To ensure that the fluoride exposure concentrations in this study reflect the potential fluoride levels present in the environment, we reviewed previous studies [21,22,23,24,25] and referenced the ‘Environmental Standard Limit Concentration’ (ESLC) for water standards to establish the fluoride exposure concentrations used in the experiment. The ESLCs used in this research were based on water environmental standards from the World Health Organization (WHO), China, and the US EPA. These standards include 0.5 mg/L [48], 1 mg/L [49,50,51,52], ≤4 mg/L [53], 10 mg/L [54], 20 mg/L [54], 50 mg/L [55], and 100 mg/L [55]; with the goal of protecting human health and aquatic organisms [56]. The final water fluoride concentrations were chosen as 0.5, 1, 4, 10, 20, 50, 80, 100, 120, 150, 200, 250 and 300 μg/L in our research. The control was E3 water.

2.3. Environmental Conditions for Zebrafish Experiments

Adult zebrafish were obtained from the Institute of Hydrobiology, Chinese Academy of Sciences (Wuhan, China). All fish were acclimated to their new environment for at least 2 weeks in a 50 L aquarium conditioned with water from reverse osmosis reconstituted with marine salt (Instant Ocean, Blacksburg, VA, USA) at 28 ± 2 °C, pH of 7.4, ammonia < 0.02 mg/L, nitrite < 0.01 mg/L and a conductivity of 500 μS under light/dark 14/10 photoperiod (lights on at 8:00 a.m.). The fish were used according to the OECD test guidelines No. 203 and No. 212 [2,4]. Animals were fed twice a day with live food (Artemia salina) and supplemented with 300 μm granules of dry feed (Haisheng Biological Experimental Equipment Co., Ltd, Shanghai, China.). The afternoon before spawning, several groups of females and males (1:1) were introduced into 1.7 L breeding tanks. Immediately after spawning, which was initiated by morning light, fertilized eggs were collected with a sieve and rinsed thoroughly with deionized water and E3 water. Eggs were transferred to Petri dishes, and eggs that were not fertilized or embryos with injuries were eliminated (30 embryos per dish with 10 cm diameter) for subsequent experiments. The Ethics Committee of the Guizhou Medical University approved the protocol under the number 2303063.

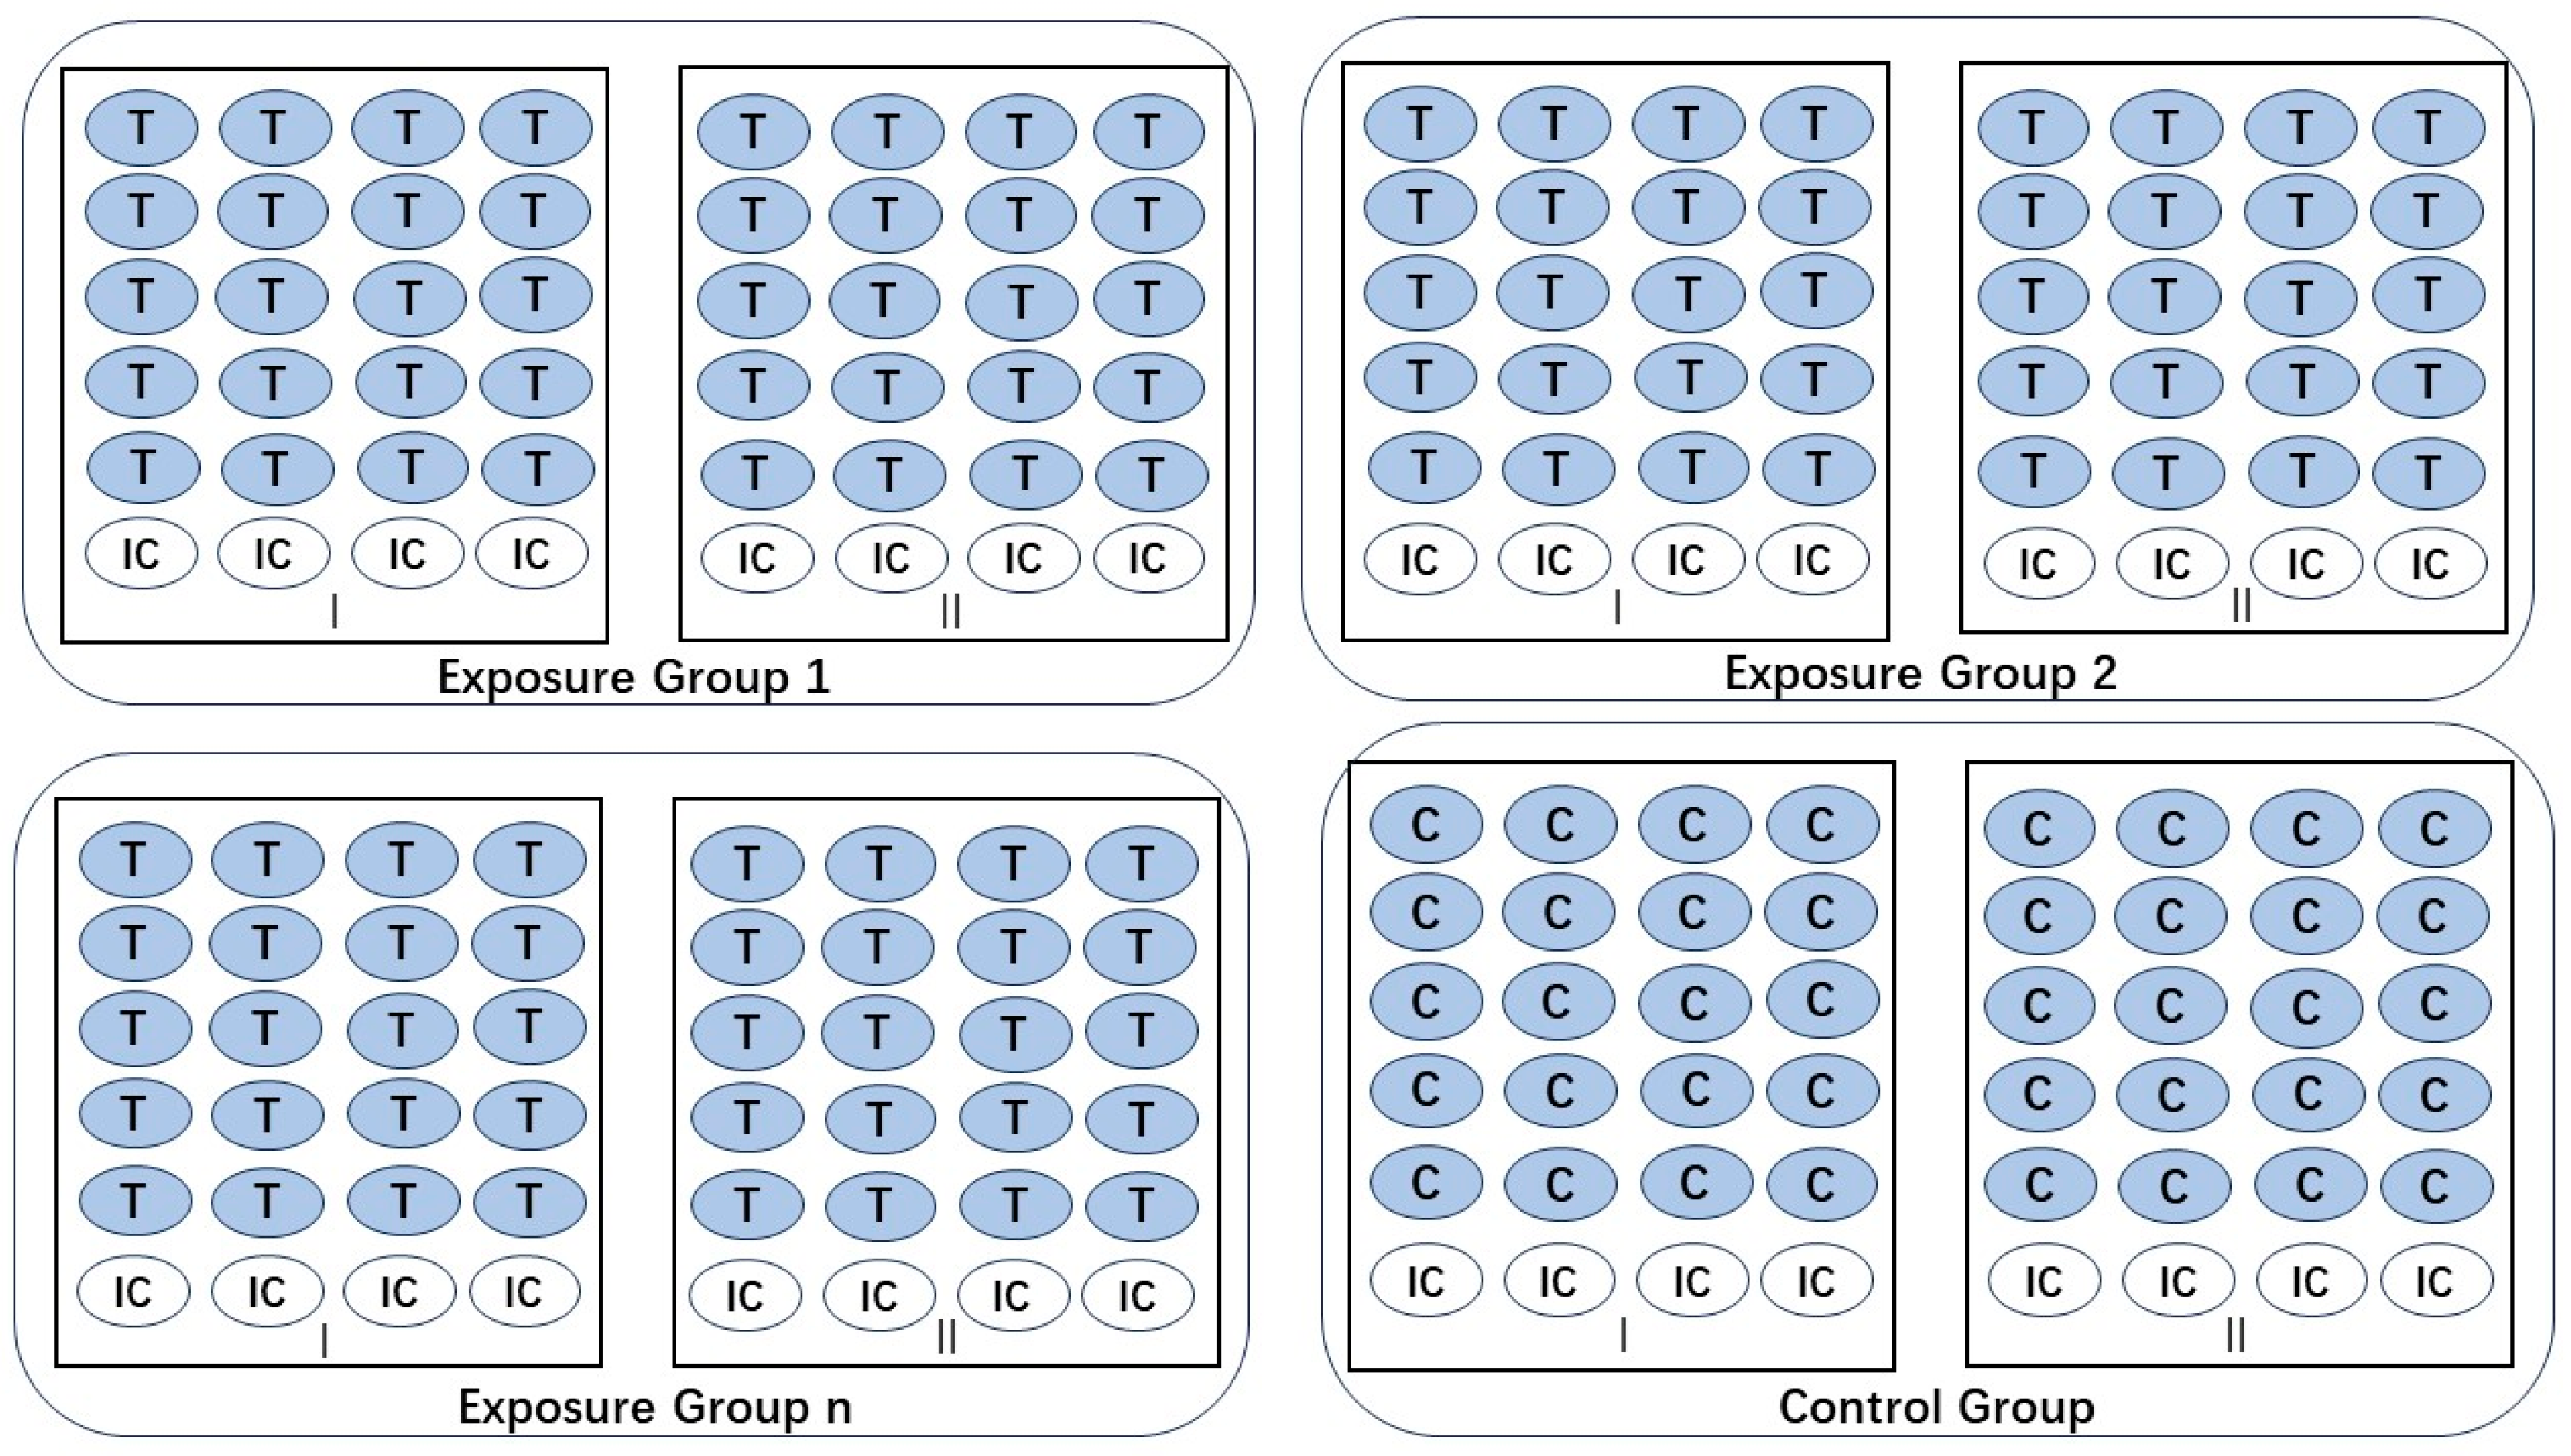
2.4. The Environmental Exposure of Embryo and Sac–Fry Stages Zebrafish to Fluoride

To investigate the toxic effects of W-F concentrations on zebrafish embryos and sac–fry stages, zebrafish embryos were continuously exposed to different W-F concentrations from 2 h post-fertilization (hpf) (embryos) to 5 d post-fertilization (dpf) (sac–fry stages) [4]. Two parallel 24-well plates were used for each concentration group, with 40 embryos per concentration (2 embryos per well) exposed to W-F with eight internal plate controls (ICs). E3 water was used as a control group, and ICs were used for comparison. Three independent experiments were conducted, as detailed in Figure 1. The W-F solutions were changed daily, and dead embryos and larvae were removed daily.

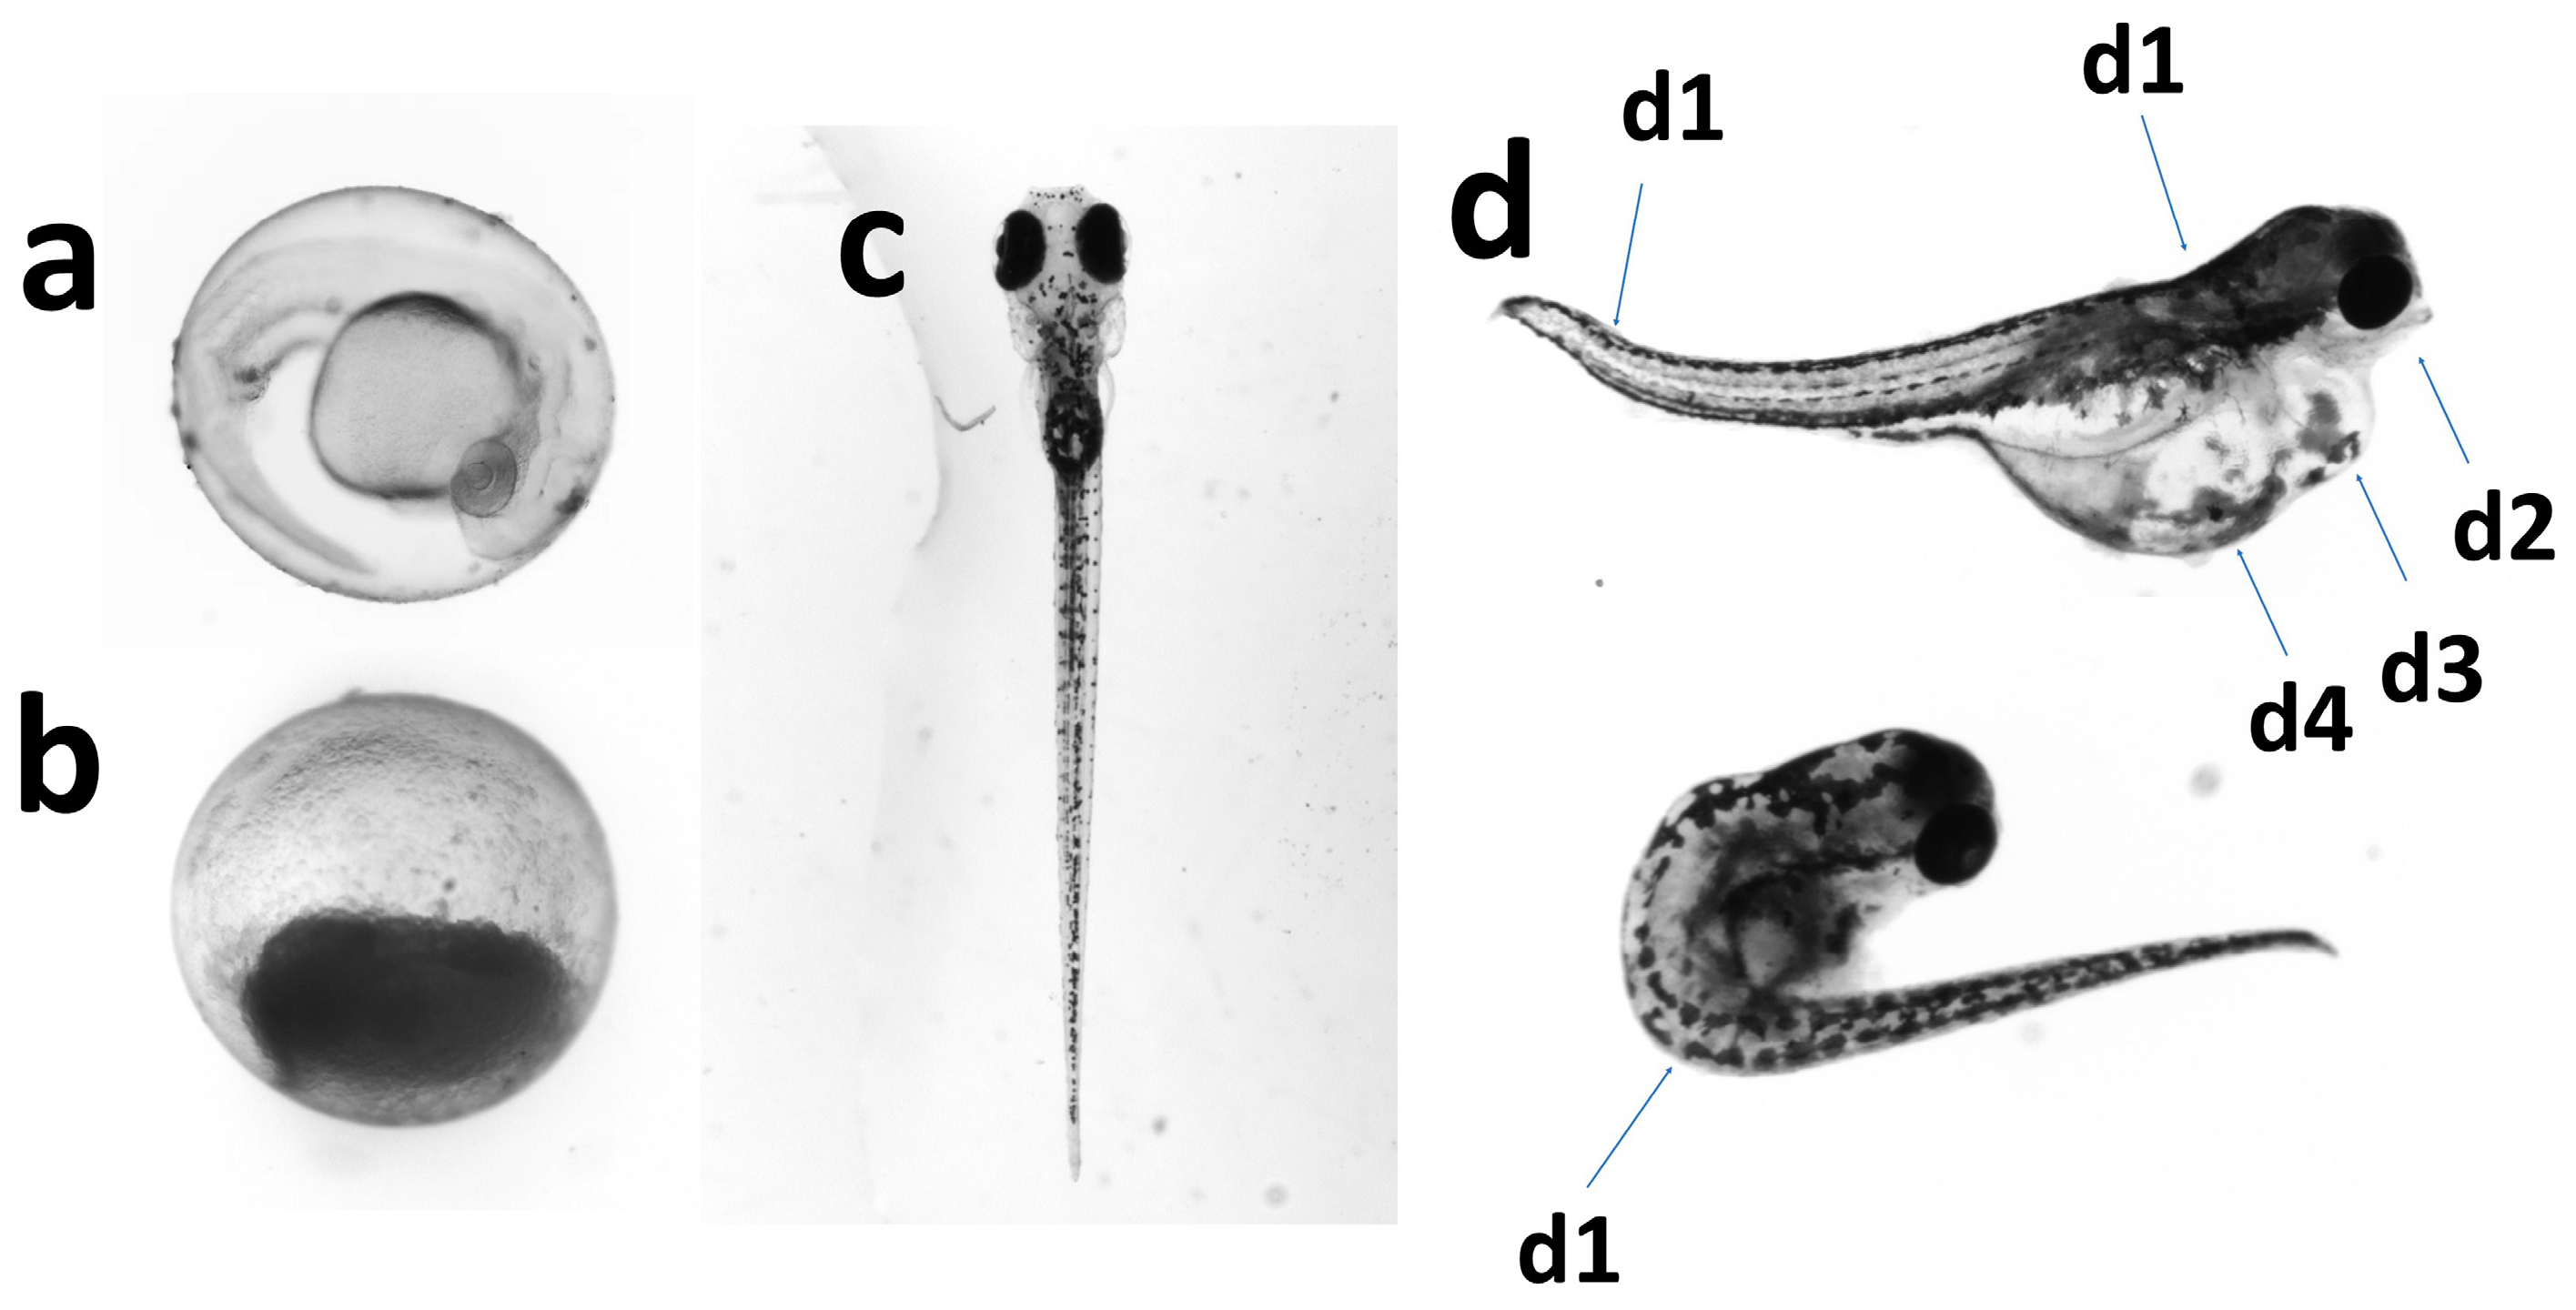
2.5. Toxicological Indicators

Toxicity indicators were assessed according to OECD guidelines No. 210 and No. 212 [4,57]. The study included tracking cumulative dead numbers and cumulative mortality (CM) at concentrations on 1, 2, 3, 4, and 5 dpf, as well as cumulative numbers and cumulative malformation rate (CMA) of larvae with deformities or abnormal appearances at 5 dpf (Table 1). Observations were conducted twice daily with an 8 h interval between each observation.

2.6. LC/EC50 and BMC/BMCL Estimates

The dose–response relationship between W-F concentration and toxicity indicators were analyzed using Bayesian Benchmark Dose Analysis System (BBMD) (https://benchmarkdose.org, accessed on 28 March 2024). In order to perform the Monte Carlo approximation, a Markov chain Monte Carlo (MCMC) was constructed within the BBMD. The MCMC parameters were set as follows: MCMC iterations: 30,000; number of chains: 1; warmup fraction: 0.5; random seed: 65,323. Subsequently, the dose–response data were fitted using eight models (Table 2) in the BBMD system. The model fitting was evaluated using Rhat (1–1.05) and posterior predictive p value (0.05–0.95) as per the system manual [58]. The median lethal dose/effect concentration for 50% effect (LC50/EC50) of each mode was reported at the response of 50% (5th, 95th). Then, the BMC distributions estimated by each model were combined, taking into account their weights, and BMA BMC was calculated. The weight of each model was calculated based on how well it fits the data. The calculation of the BMA BMC is influenced more by models with greater weight, indicating a better overall fit. The BMC represents the dose at which there is a higher toxicological risk compared to the control group [59]. In this study, the BMCs and BMCLs for W-F were estimated given benchmark response (BMR) = 0.1 (10%).

2.7. Statistical Analysis

The data were analyzed using SPSS software (version 20.0, SPSS Inc., Chicago, IL, USA). Incidence data on toxicity indicators were reported as rates and the mean ± standard deviation (SD). All experimental data underwent homoscedasticity testing, and pair-wise comparisons of sample means were conducted using the least significant difference (LSD) test following a one-way analysis of variance (ANOVA). Statistical significance was determined at p < 0.05.

2.8. Quality Control and Quality Assurance

To ensure the accuracy of our study, we utilized pure water to prepare solutions of NaF and E3 water. Fluoride concentrations in all experimental groups were tested daily following the protocol outlined in GB/T 7484-87 for assessing fluoride levels in water quality [46]. It was mandated that the fluoride concentration in each group’s water should not deviate by more than 5% from the experimental design. Prior to feeding, each batch of feed was analyzed using the National Standard Method for Determination of Fluorine in Food GB/T 5009.18-2003 [60], with a requirement of less than 6.20 mg/kg.

3. Results

3.1. General Situation and Toxicological Indicators Results

The results indicated that as the W-F concentration increased, the CM for each day post-fertilization and CMA at 5 dpf of zebrafish embryos and larvae also increased (see Table 3). Adverse effects observed included embryo coagulation, mortality, and various types of malformations (refer to Figure 2).
A dose–response relationship was observed between W-F concentration and harmful outcomes. The 20 mg/L group was identified as the lowest observed adverse effect level (LOAEL) for the majority of toxicity indicators and warrants special attention (Figure 3).

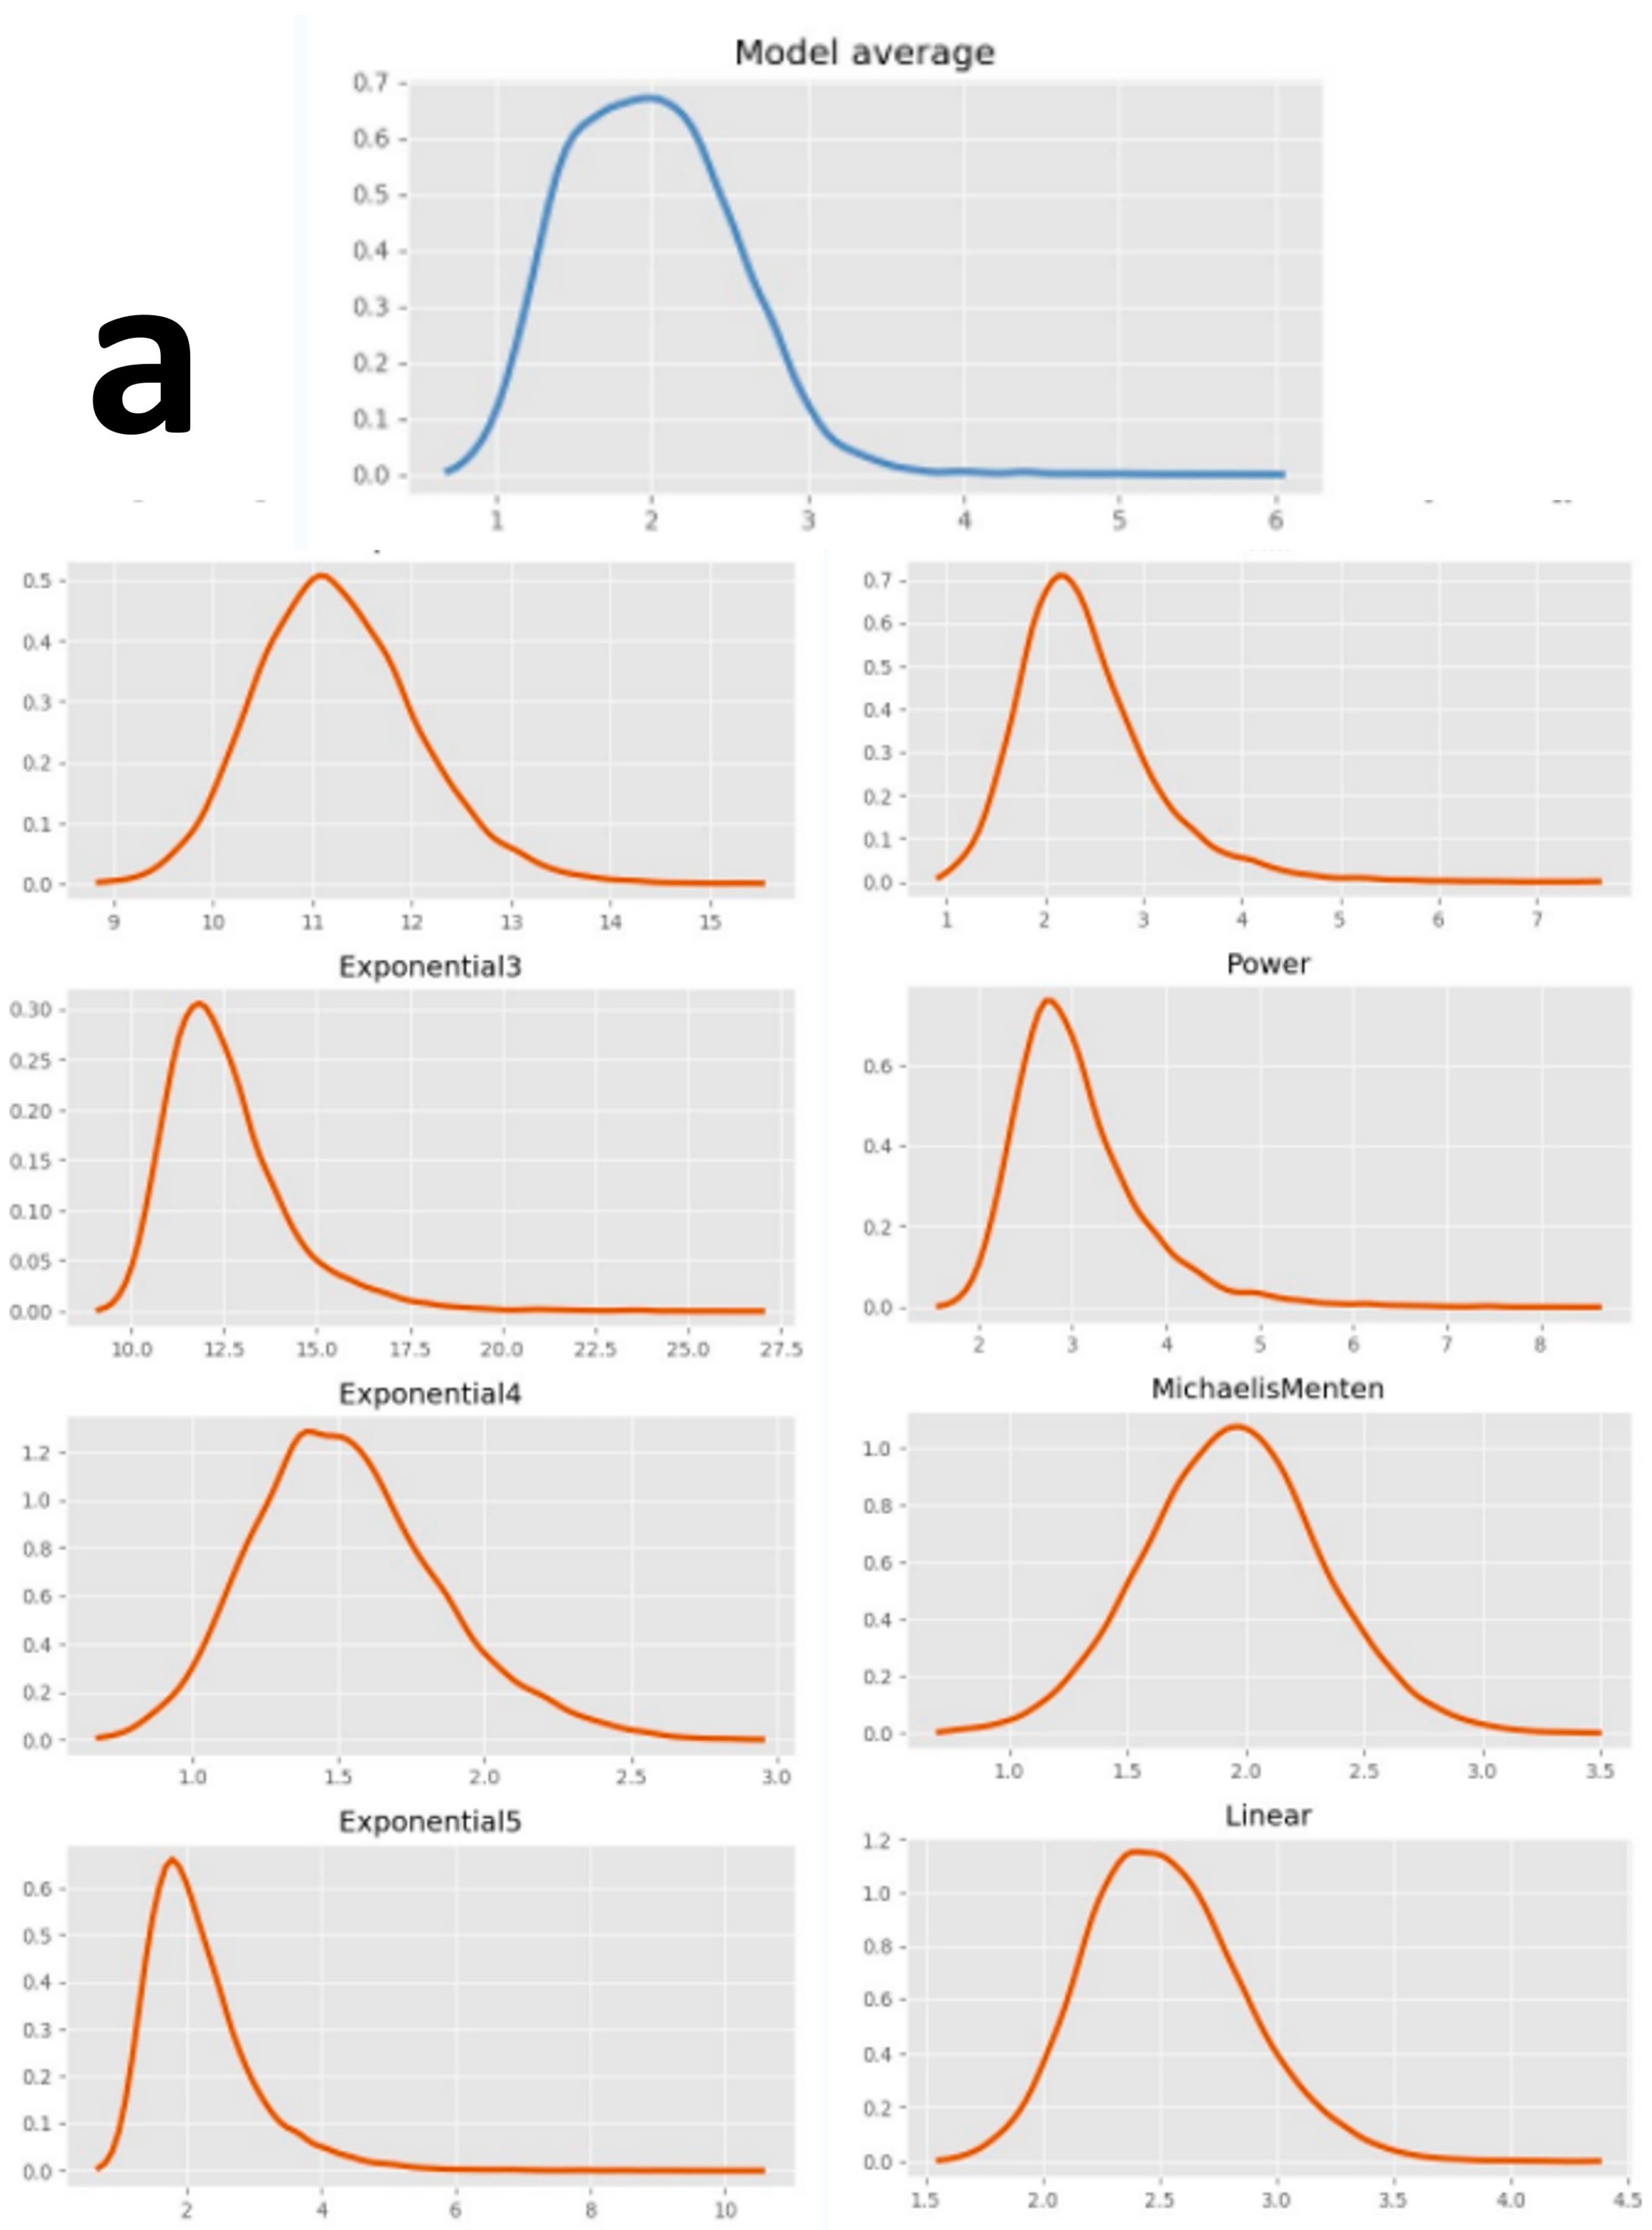
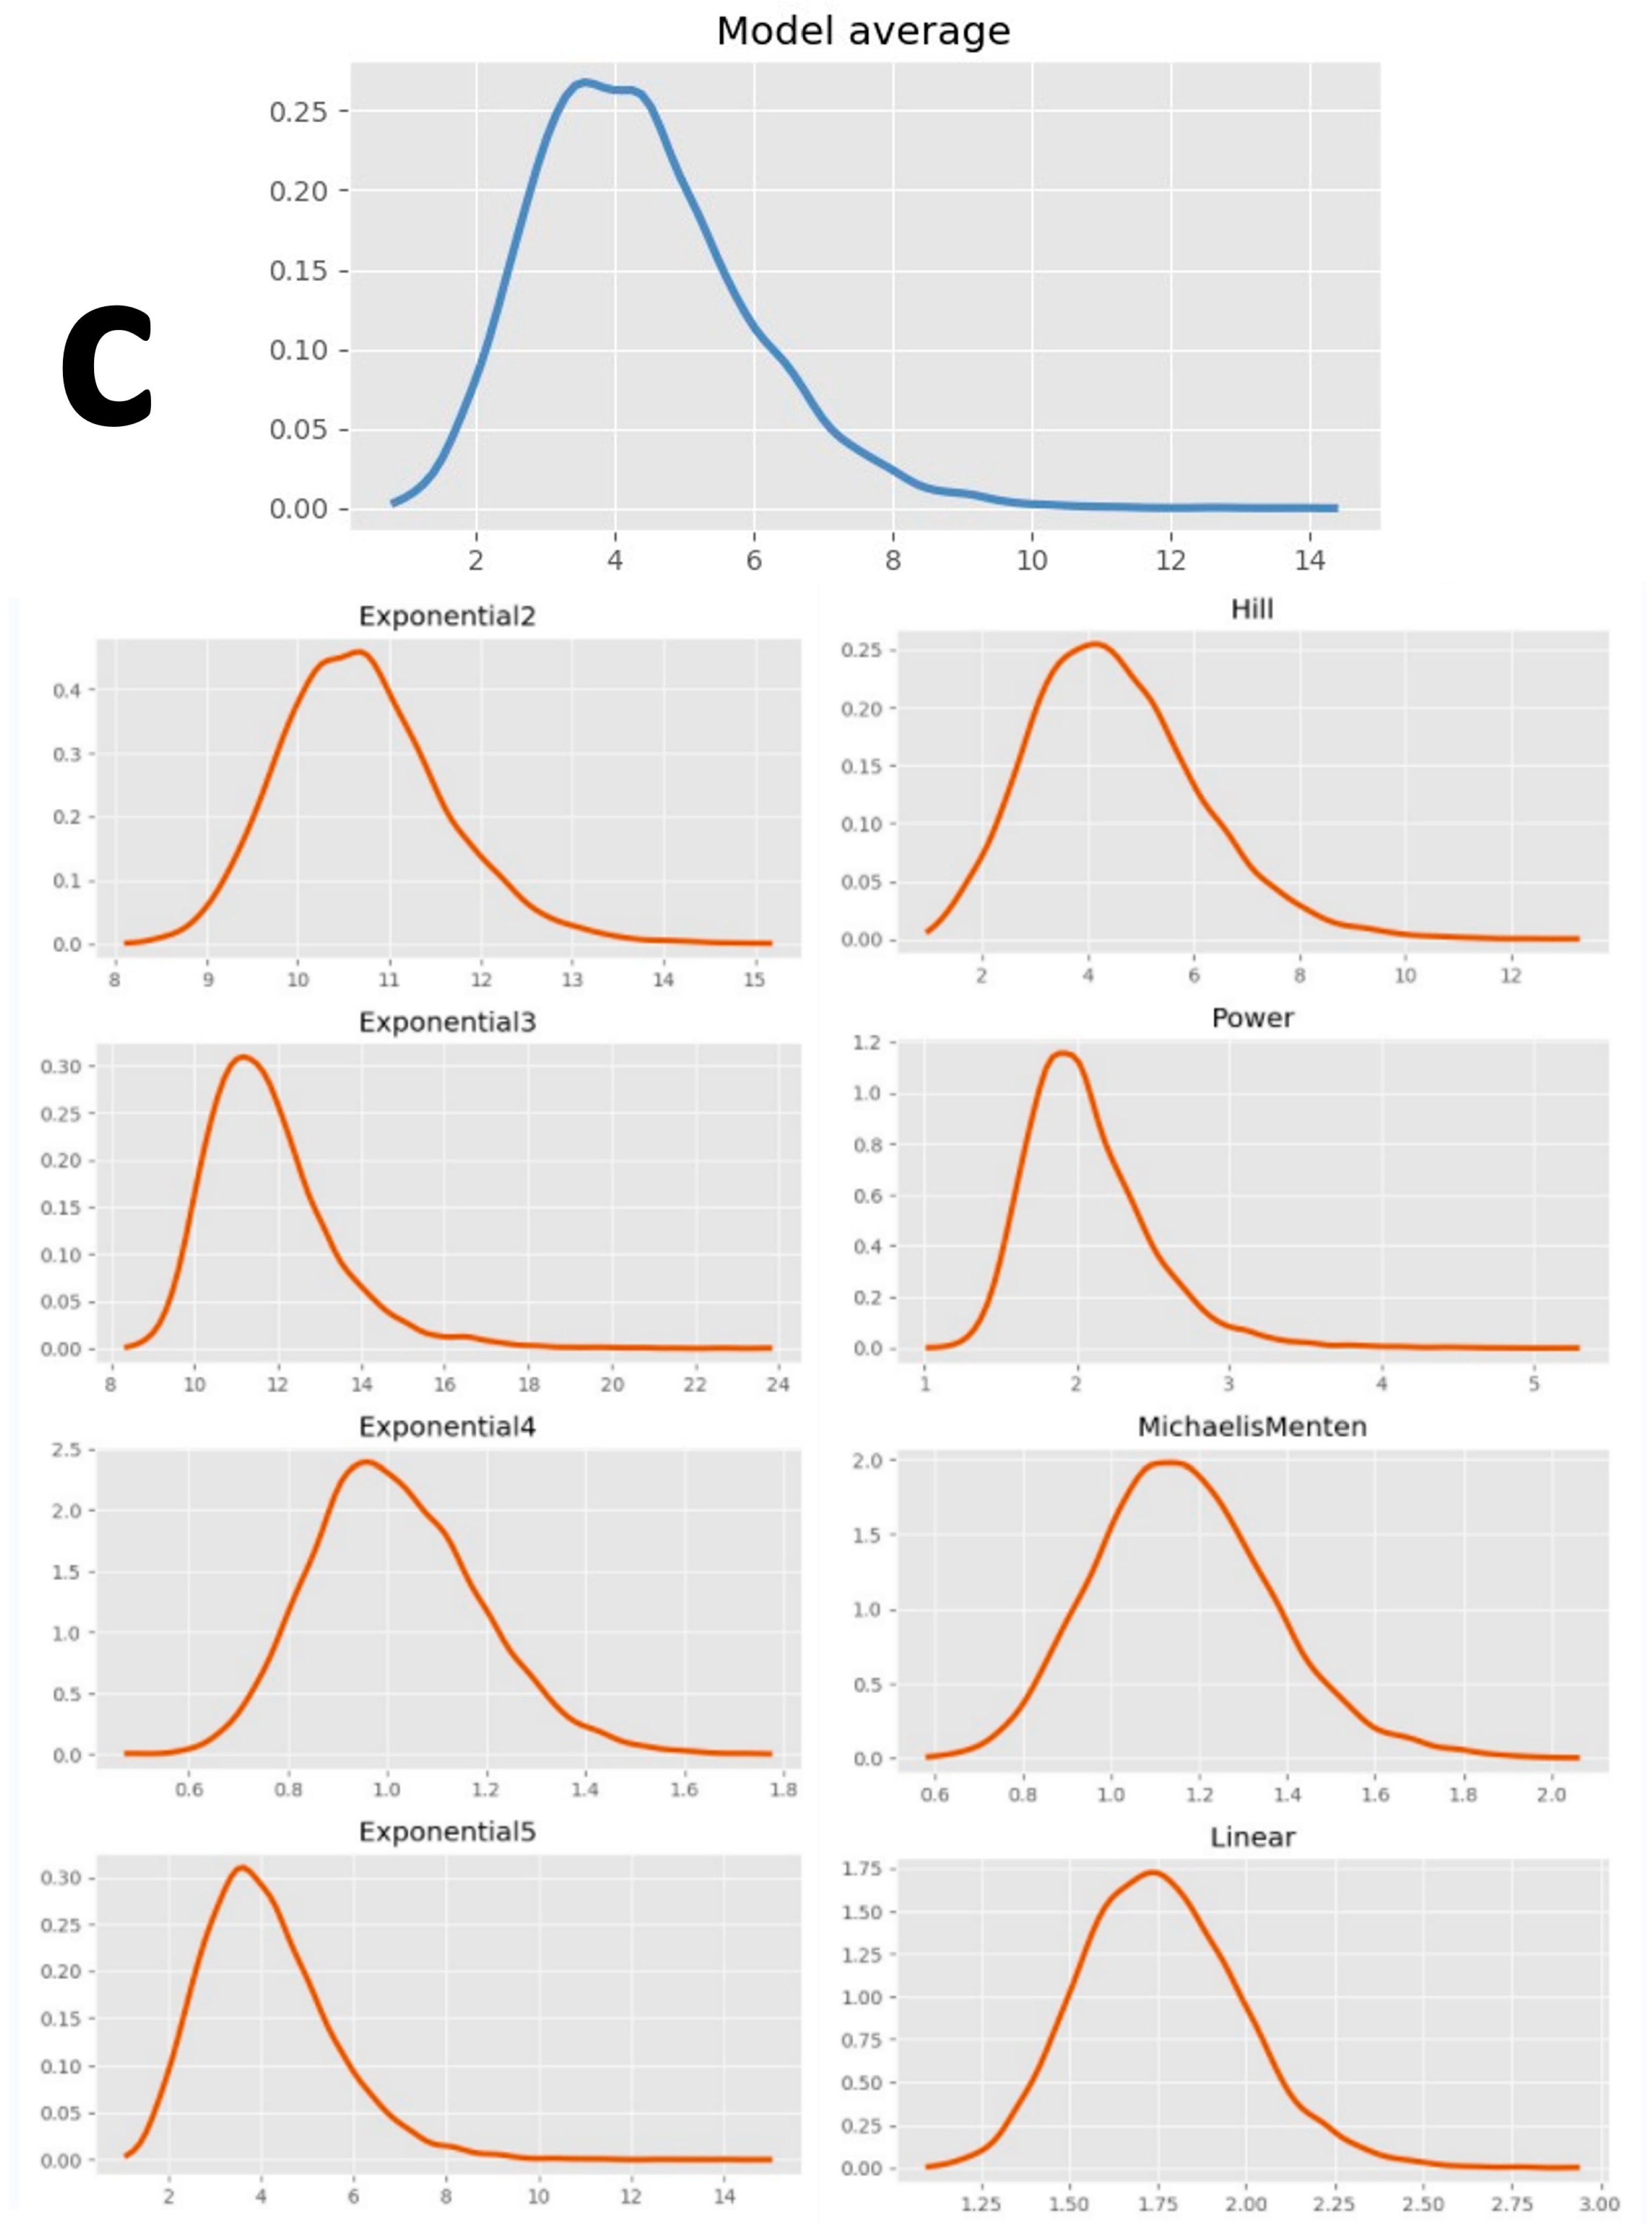
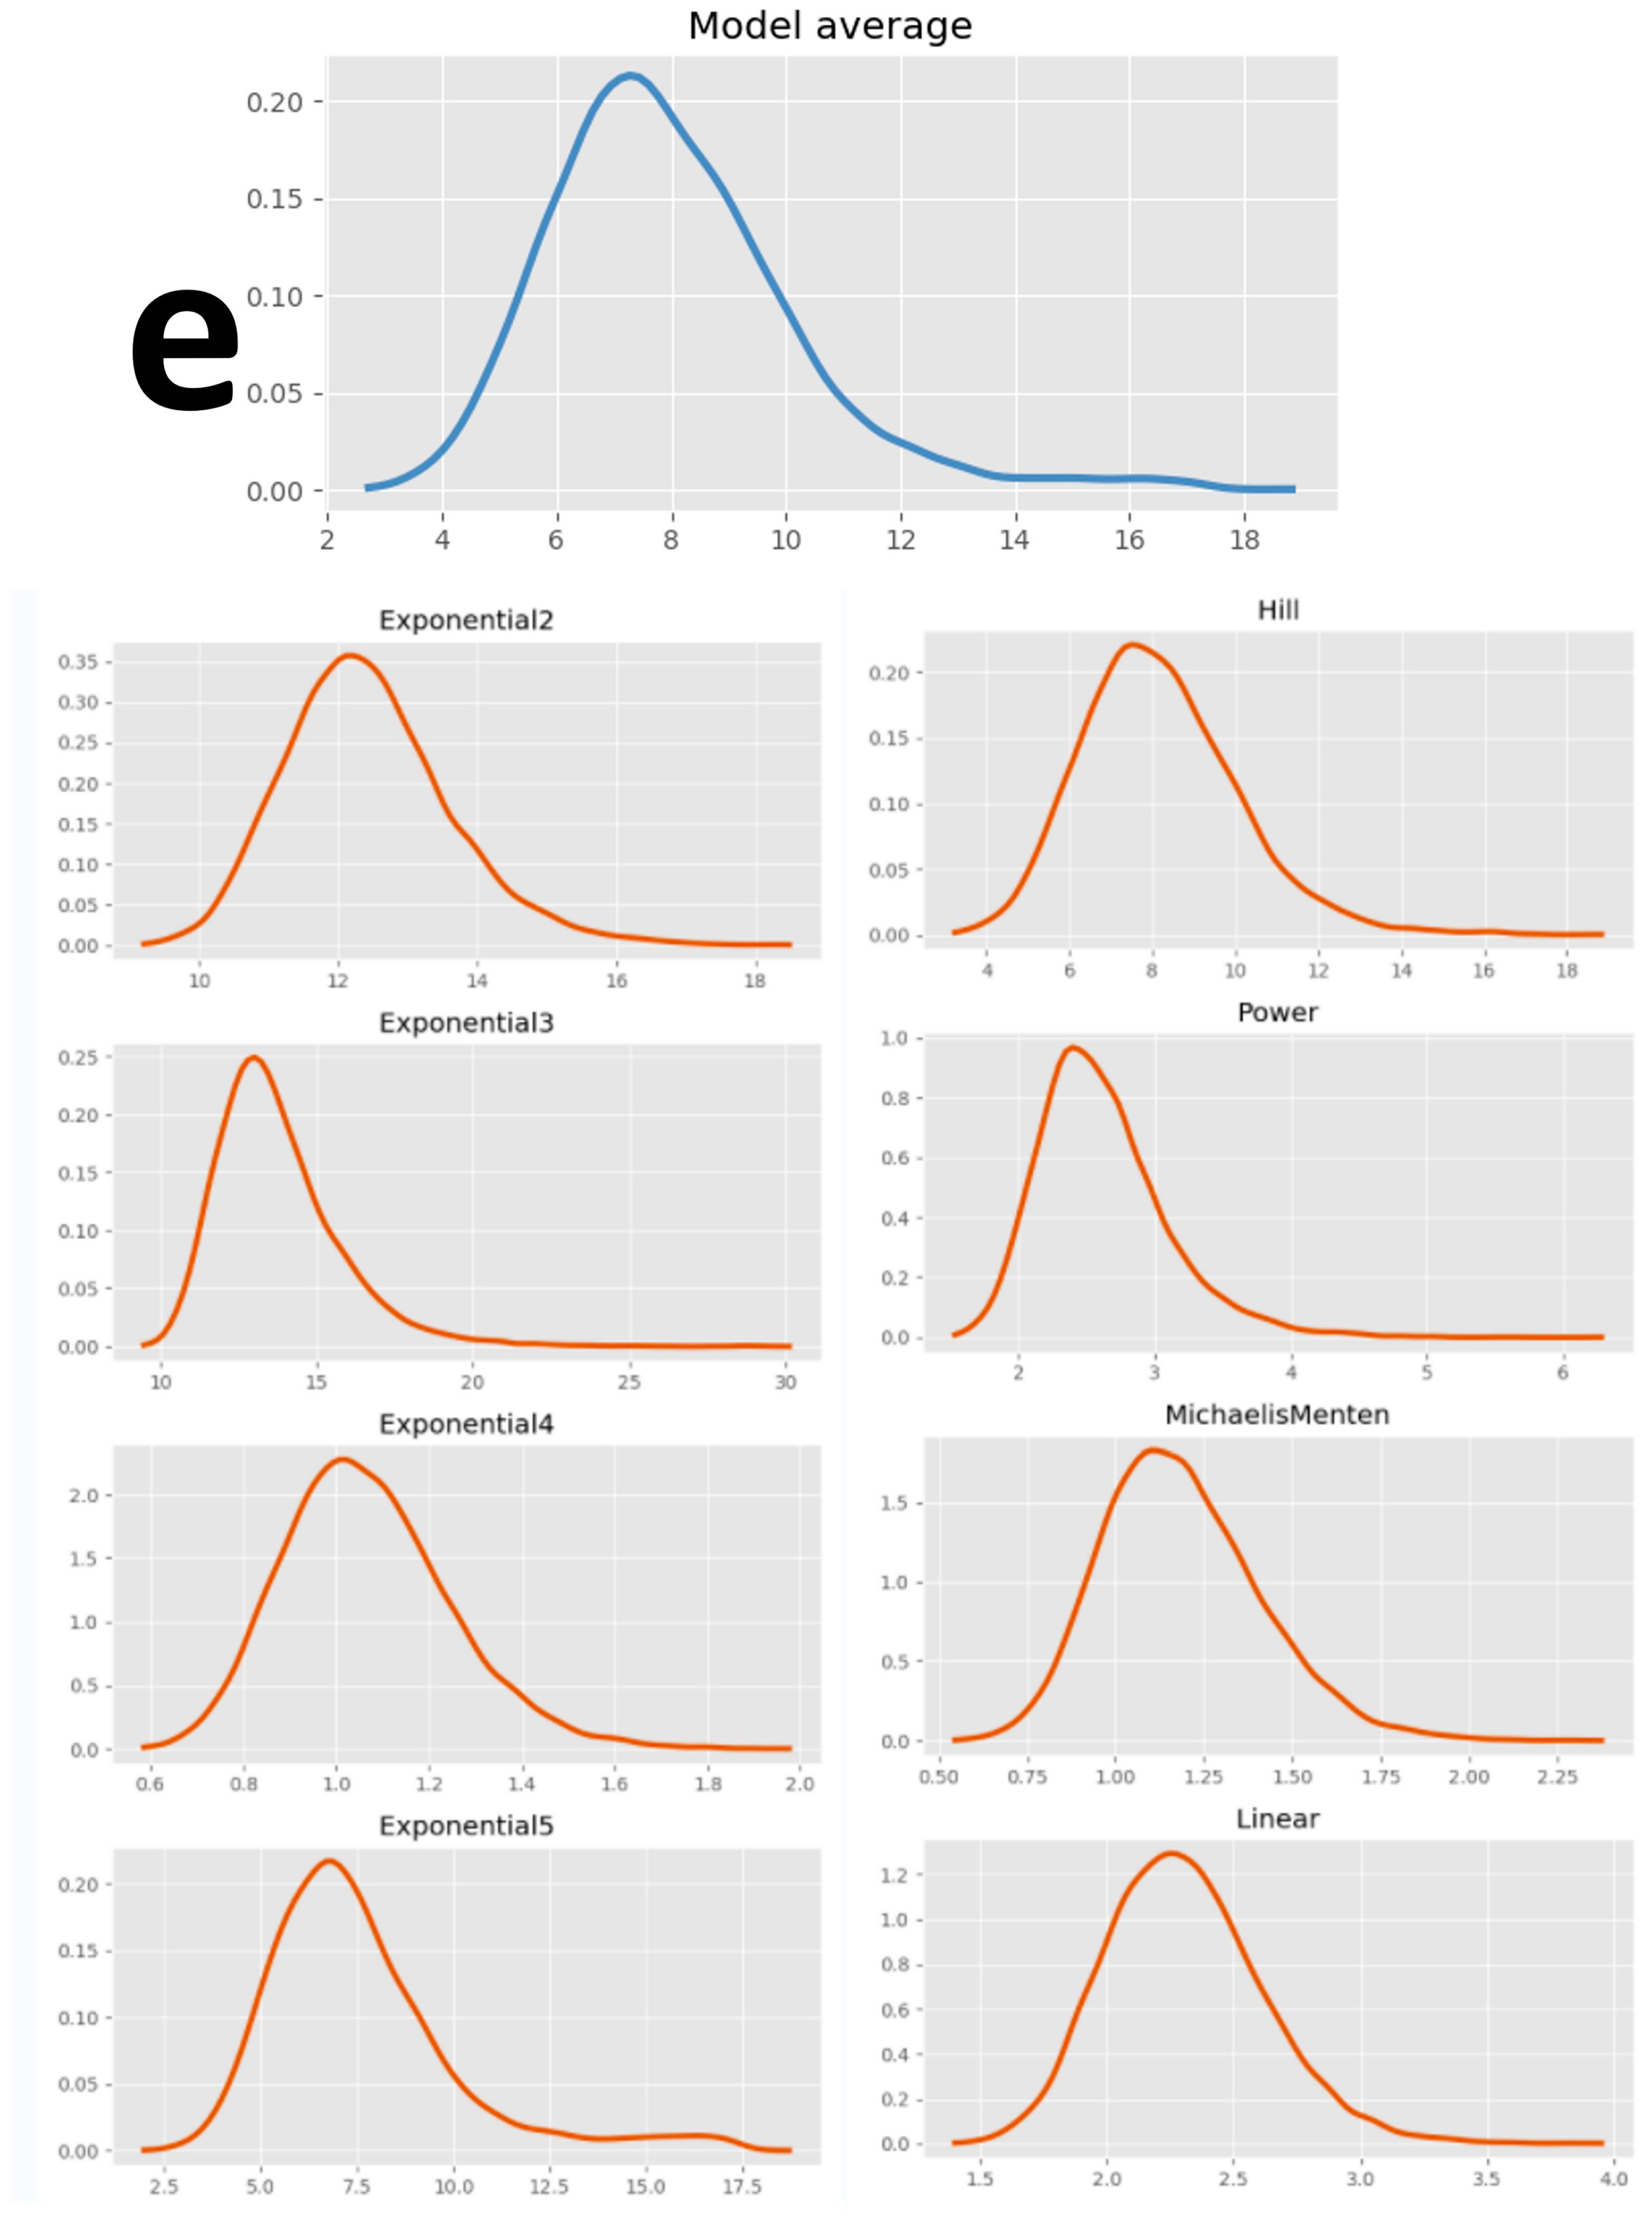
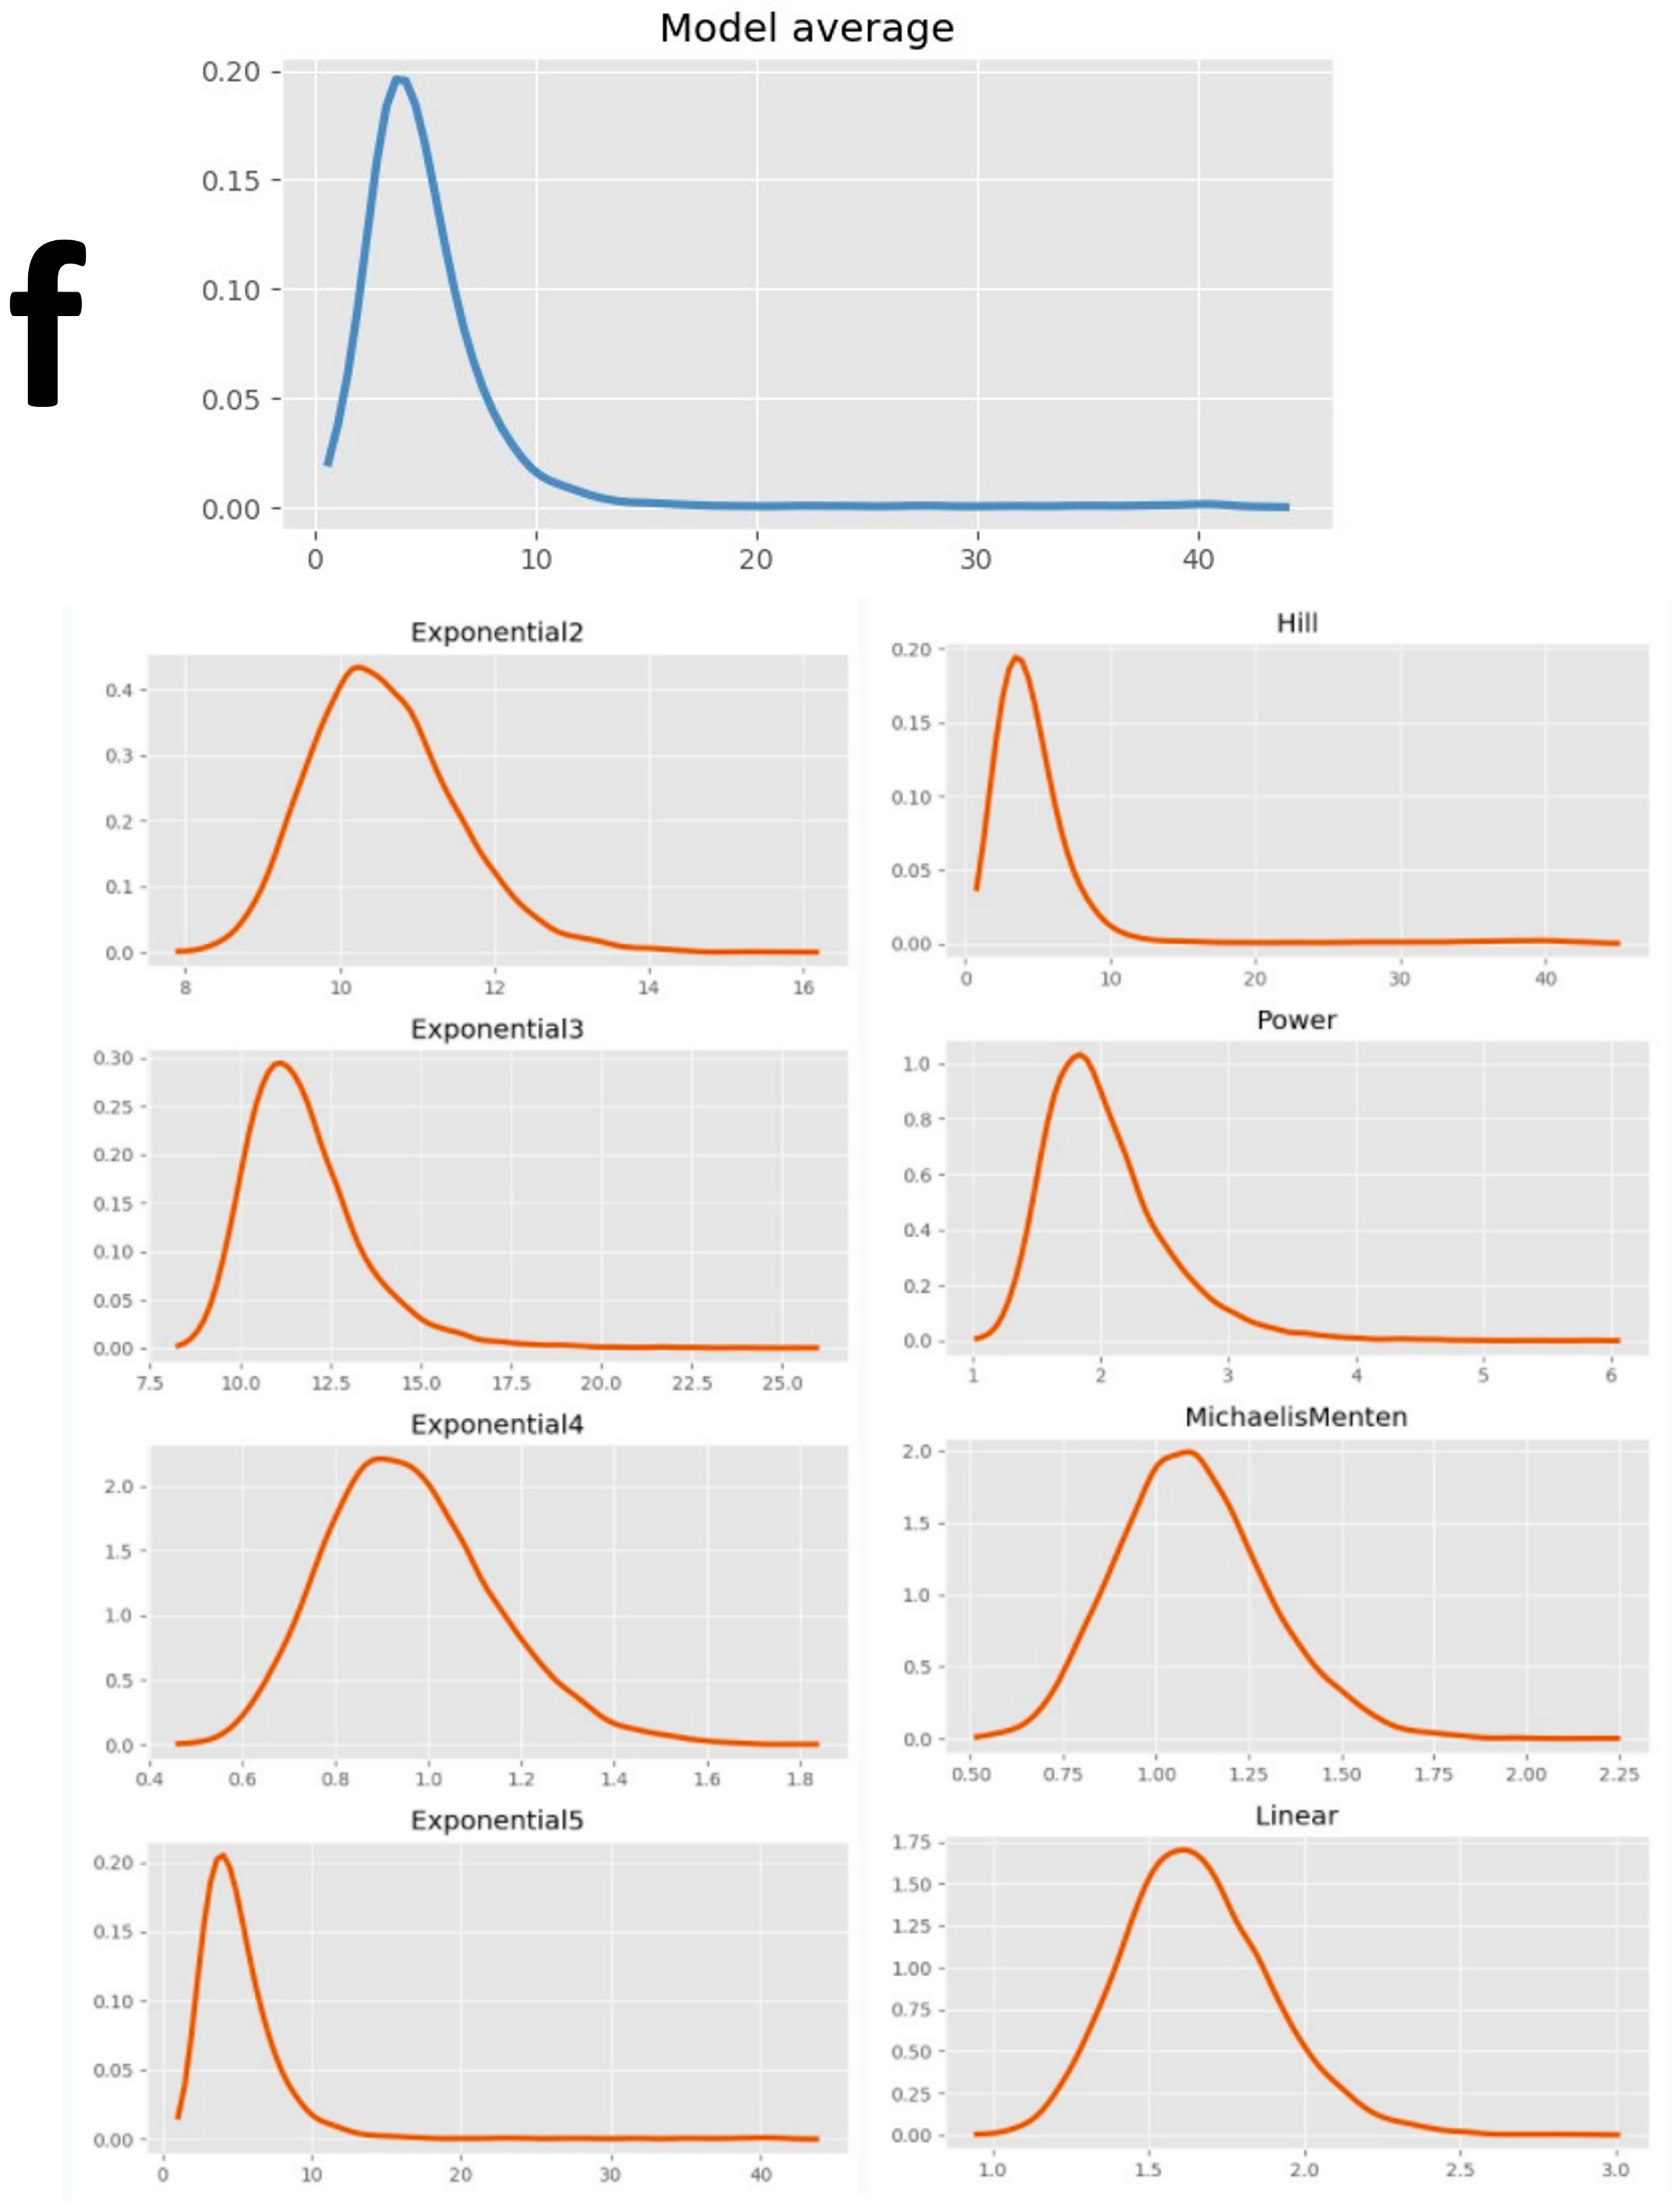
3.2. The LC50/EC50 and BMC/BMCL Estimation Results

Based on the BBMD analysis, the posterior predictive p-value for model fit (PPP values) ranged from 0.05 to 0.95, indicating that all models adequately fit the data. The majority of r ^ values suggests that the MCMC sampling converged well. The results revealed an appropriate dose–response relationship between W-F concentration and toxicological indicators in the eight standard BMD models, implying a correlation between them (Supplementary Figures S1 and S2). The LC50/EC50 are presented in Table 4. Table 5 displays the estimated individual models and model-averaged BMCs for a 10% increase in risk for toxicity indicators (BMR10). As the BMR increased, both the BMCs/BMDLs also increased (Figure 4).

4. Discussion

The toxicity assessment of environmental pollutants should encompass acute, short-term, subchronic, reproductive, developmental, and chronic effects to ascertain the types and degrees of adverse health impacts that these pollutants may exert [61]. Prior to evaluation, it is essential to consult the toxicity database to gather fundamental toxicity data. Acute and short-term toxicity tests were conducted using zebrafish embryos and yolk sac larvae, which provide essential data, including LC50, NOAEL, and LOAEL. These data serve as critical support for longer-term toxicity experiments and informs future updates to relevant water quality standards [47]. Previous studies investigating acute and short-term toxicological effects of fluoride exposure during the early life stage of aquatic fish have reported varying concentrations, ranging from 51 mg/L to 1045.8 mg/L [24,25,50,51,54]. This variability can primarily be attributed to the use of different species of experimental fish, including zebrafish, rainbow trout, blackhead catfish, and peacock fish, as well as variations in exposure duration, which range from 24 h to extended periods. Additionally, fluoride’s capacity to interact with calcium ions in water to form precipitates leads to a reduction in fluoride concentration, thereby establishing a positive correlation between the LC50 of fluoride and water hardness [62]. Consequently, differences in calcium ion concentration across previous studies have also contributed to the observed variations in LC50 results. To obtain fundamental data, this study conducted tests using zebrafish from 2 hpf to 5 dpf, calculating the LC50/EC50 from 1 to 5 dpf. Moreover, E3 water was used to prepare a fluoride exposure solution to mitigate the influence of calcium ions in the water. The results indicated a dose–response relationship between fluoride concentration in the water and CM rates at 1, 2, 3, 4, and 5 dpf, as well as the CMA rate at 5 dpf in early-life-stage zebrafish. Additionally, there were no statistically significant differences in the primary toxicity observation indicators between the fluoride exposure groups at the ‘ESLC’ and the control group. In this study, the concentration of fluoride at 20 mg/L is highlighted as the LOAEL for most toxicity indicators. It is important to note that there are numerous areas in natural water environments where concentrations exceed 20 mg/L. For instance, a survey revealed that the highest fluoride concentration in surface water and groundwater in 16 major cities in Pakistan was 24.48 mg/L [61], while in the Naivasha Basin of Kenya, groundwater reached levels of 43.6 mg/L [62]. Furthermore, lakes and basins in central Ethiopia showed fluoride concentrations as high as 68.9 mg/L [63]. These findings serve as a reminder of the importance of considering the toxic risks of fluoride in natural aquatic environments on aquatic ecosystems. It is essential for academia and policymakers to work together in developing comprehensive solutions to mitigate and decrease fluoride concentrations in water environments.
In our research, the BMCs and BMCLs were analyzed using the BBMD system [58] based on BMA. Addressing the ongoing challenge of variable selection for risk factor modeling in statistical practice, BMA considers all models with non-negligible probabilities and summarizes the posterior probabilities for all variables at the end, leading to more reliable and robust effect estimates [64,65,66,67]. BMA BMC has been widely utilized in various fields [68,69,70,71,72]. In our study, the BMCL10 for W-F exposure in zebrafish embryos and sac–fry stage ranged from 1.02 to 4.98 mg/L. These results were calculated based on a benchmark response of 10 (BMR = 10). The BMR represents a level of response in a specific endpoint that is measurable, considered relevant to humans or model species, and is used to estimate the associated dose (the ‘true’ BMD) [45]. For quantal data, the BMR is defined as an increase in the incidence of the lesion/response scored compared to the background incidence [45]. Previous guidance from the EFSA Scientific Committee (EFSA SC) on BMD modeling indicated that several studies estimated that the median of the upper bounds of extra risk at the NOAEL was around 10%, implying that the BMDL10 might be suitable in many instances [73,74,75]. In this study, it was found that when the fluoride concentration in water exceeded 1.02 mg/L, there was a 10% increased risk of mortality for zebrafish embryos. When an external source of mortality impacts a population, it can affect the number of individuals or the total biomass in a particular stage [76,77,78,79,80,81]. Population fluctuations can influence species diversity and have significant consequences for ecosystems [82]. Additionally, many developmental abnormalities can be attributed to mutations in genes that encode enzymes and structural proteins [83]. Genomic alterations and mutations are recognized as hallmark insults resulting from environmental chemicals [84]. Currently, we are conducting a study on the effects of transcriptomics during the embryonic and sac–fry stages of zebrafish exposed to ‘ESLC’ of W-F. Therefore, based on the three dimensions of biodiversity—gene diversity, species diversity, and ecosystem diversity—we recommend calculating the BMCs and BMCLs of W-F, from the genetic to the species level, to separately assess toxicity risk in the future. This approach will contribute to the protection of biodiversity and promote the sustainable development of the ecological environment.
When establishing safety limits for chemicals, toxicological data obtained from animal experiments serve as a critical reference point. The selection of safety coefficients and uncertainty factors is significantly influenced by species and individual differences among experimental animals, making these data the most important in computational toxicology research when extrapolating results from animal models to humans. Currently, data from mammalian experiments are predominantly utilized, and a tenfold uncertainty factor (UF) is commonly applied in the derivation process [85]. However, due to cost and ethical considerations, there are inherent limitations to the use of mammals in toxicology experiments [86]. In contrast, zebrafish models align more closely with the 4R principles of reduction, refinement, substitution, and responsibility [87,88]. Consequently, extrapolating research results from zebrafish to humans presents not only a significant challenge in computational toxicology but also represents a prominent topic and future direction for development. With the ongoing advancement of technology, progress has been made in this field. An invention patent titled “Conversion Method of Zebrafish to Human Dose for Safety Evaluation” (patent number: ZL2020 10256136.8) was approved by China Huante Biotechnology Co., Ltd. in 2020, serving as an example [31]. The patent proposes an approach for converting acute and short-term toxicity test data from zebrafish to mammals, followed by the extrapolation of these concentrations to humans. The specific calculation method is (1) UFszebrafish = UFsmammals ÷ 10Average(Log LC50zebrafish/Log LC50mammals); (2) HBGVhumans = NOAELhumans ÷ UFszebrafish. Although this represents only the beginning, advancements in technology and the emergence of novel methodologies will enhance the feasibility of extrapolating human data using findings from zebrafish. The foundational toxicological data obtained from zebrafish at the early life stage in this study, which includes BMC, BMCL, LC50, and EC50 values in response to fluoride exposure, lays the groundwork for future research.
There are several limitations to our research. Firstly, although the zebrafish used in this study is a standard model animal for environmental chemical toxicity risk assessment recommended by the OECD [4], it cannot fully represent the diversity of fish species in different water regions. Secondly, variations in calcium ion concentrations across different water bodies need to be taken into account when assessing the toxicity risks of fluoride ions [89]. Toxicity calculations should be conducted separately based on the specific calcium concentrations in water. The E3 water utilized in this study has low calcium levels [47]; thus, our research only provides baseline BMCs and BMCLs. Thirdly, the OECD emphasizes the importance of testing chemicals throughout the entire fish life cycle to accurately estimate aquatic ecotoxicity risks [4]. Additionally, it is important to note that the results of this study cannot be directly extrapolated to humans at this stage. Future research should consider incorporating population epidemiology studies for a more comprehensive understanding [90].

5. Conclusions

Our study indicates that the range of BMCL10 for W-F exposure during the zebrafish’s early life is between 1.02 and 4.98 mg/L. The basic toxicity data for the early life stages of zebrafish, obtained through BMA BMD calculations, are expected to inform future research aimed at promoting sustainable environmental development. To this end, we propose the concept of ‘One Health of Fluoride’ (Figure 5), which advocates for a comprehensive approach that encompasses environmental, animal, and human health while establishing the W-F guideline based on the Eco Evo Devo framework [91,92]. This concept underscores the significance of social factors, encourages interdisciplinary collaboration, and aims to mitigate the adverse effects of fluoride on the environment, improve equitable health outcomes, preserve biodiversity, and lay a foundation for sustainability.

Supplementary Materials

The following supporting information can be downloaded at: https://www.mdpi.com/article/10.3390/toxics12120902/s1, Figure S1: Linear fit summary. The dose-response relationship between the W-F concentration (mg/L) and CM; Figure S2: Linear fit summary. The dose-response relationship between the W-F concentration (mg/L) and CMA at 5 dpf.

Author Contributions

Conceptualization, T.J.; methodology, T.J.; software, Y.Z.; validation, X.Y.; formal analysis, Q.Y.; investigation, X.Y. and H.H.; resources, C.Y. and Y.A.; data curation, R.Y.; writing—original draft preparation, X.Y.; writing—review and editing, T.J.; visualization, T.J. and X.Y.; supervision, C.Y. and Y.A.; project administration, T.J. and Y.A.; funding acquisition, T.J. and Y.A. All authors have read and agreed to the published version of the manuscript.

Funding

This work was supported in part by the National Natural Science Foundation of China (Grant Nos. 81872646, 81811540034, 82381240027), the Priority Academic Program Development of Jiangsu Higher Education Institutions, the Science and Technology Foundation of Guizhou, Science and Technology Department of Guizhou Province (qian ke he support No. [2020].4Y235) and the Science and Technology Foundation of Guizhou, Health Commission Department of Guizhou Province (gzwkj 2024-481).

Institutional Review Board Statement

The fish were tested following OECD guidelines No. 203 and No. 212. The Ethics Committee of Guizhou Medical University approved the protocol with the reference number 2303063.

Informed Consent Statement

Not applicable.

Data Availability Statement

The original contributions presented in this study are included in the article/Supplementary Material. Further inquiries can be directed to the corresponding authors.

Acknowledgments

Acknowledgements are extended to Chen Yingying, Wang Rong, Fan Yue, Zhao Xi, Han Junyu, Peng Xiaokun, Chen Zhicheng, and Jia Haoqi for their contributions to the zebrafish breeding and breeding process.

Conflicts of Interest

The authors declare no conflicts of interest.

Abbreviations

BBMDBayesian benchmark dose analysis system.
BMABayesian model averaging.
BMCbenchmark concentration.
BMCLlower bound of the credible interval of benchmark concentration.
BMDbenchmark dose.
BMDLlower bound of the credible interval of benchmark dose.
BMRbenchmark response.
CMcumulative mortality.
CMAcumulative malformation rate.
dpfdays post-fertilization.
EC50effect concentration for 50% effect.
EFSAEuropean Food Safety Authority.
EFSA SCEFSA Scientific Committee.
EPAU.S. environmental protection agency.
ESLCenvironmental standard limit concentration.
hpfhours post-fertilization.
ICsinternal plate controls.
LC50median lethal dose.
LOAELlowest observed adverse effect level.
LSDleast significant difference.
NaFsodium fluoride.
NOAELno observed adverse effect level.
OECDOrganization for Economic Cooperation and Development.
SDstandard deviation.
UFsuncertainty factors.
W-Fwater fluoride.
WHOWorld health organization.

References

  1. Botham, P.A. Acute Systemic Toxicity. ILAR J. 2002, 43 (Suppl. S1), S27–S30. [Google Scholar] [CrossRef] [PubMed]
  2. OECD. Test No. 203: Fish, Acute Toxicity Test; OECD: Paris, France, 2019. [Google Scholar]
  3. OECD. Test No. 236: Fish, Embryo Acute Toxicity (FET) Test; OECD: Paris, France, 2013. [Google Scholar]
  4. OECD. Test No. 212: Fish, Short-term Toxicity Test. on Embryo and Sac-Fry. Stages; OECD: Paris, France, 1998. [Google Scholar]
  5. Sobanska, M.; Scholz, S.; Nyman, A.-M.; Cesnaitis, R.; Alonso, S.G.; Klüver, N.; Kühne, R.; Tyle, H.; de Knecht, J.; Dang, Z.; et al. Applicability of the fish embryo acute toxicity (FET) test (OECD 236) in the regulatory context of Registration, Evaluation, Authorisation, and Restriction of Chemicals (REACH). Environ. Toxicol. Chem. 2018, 37, 657–670. [Google Scholar] [CrossRef]
  6. Vithanage, M.; Bhattacharya, P. Fluoride in the environment: Sources, distribution and defluoridation. Environ. Chem. Lett. 2015, 13, 131–147. [Google Scholar] [CrossRef]
  7. Saether, O.M.; Andreassen, B.T.; Semb, A. Amounts and sources of fluoride in precipitation over southern Norway. Atmos. Environ. 1995, 29, 1785–1793. [Google Scholar] [CrossRef]
  8. Ravishankara, A.R.; Solomon, S.; Turnipseed, A.A.; Warren, R.F. Atmospheric Lifetimes of Long-Lived Halogenated Species. Science 1993, 259, 194–199. [Google Scholar] [CrossRef]
  9. De Angelis, M.; Legrand, M. Origins and variations of fluoride in Greenland precipitation. J. Geophys. Res. Atmos. 1994, 99, 1157–1172. [Google Scholar] [CrossRef]
  10. Ozsvath, D.L. Fluoride and environmental health: A review. Rev. Environ. Sci. Bio/Technol. 2009, 8, 59–79. [Google Scholar] [CrossRef]
  11. Singh, G.; Kumari, B.; Sinam, G.; Kriti; Kumar, N.; Mallick, S. Fluoride distribution and contamination in the water, soil and plants continuum and its remedial technologies, an Indian perspective–A review. Environ. Pollut. 2018, 239, 95–108. [Google Scholar] [CrossRef]
  12. Yadav, R.; Sharma, S.; Bansal, M.; Singh, A.; Panday, V.; Maheshwari, R. Effects of fluoride accumulation on growth of vegetables and crops in Dausa District, Rajasthan, India. Adv. Biores. 2012, 3, 14–16. [Google Scholar]
  13. Chae, Y.; Kim, D.; An, Y.-J. Effects of fluorine on crops, soil exoenzyme activities, and earthworms in terrestrial ecosystems. Ecotoxicol. Environ. Saf. 2018, 151, 21–27. [Google Scholar] [CrossRef]
  14. Kabir, H.; Gupta, A.K.; Tripathy, S. Fluoride and human health: Systematic appraisal of sources, exposures, metabolism, and toxicity. Crit. Rev. Environ. Sci. Technol. 2020, 50, 1116–1193. [Google Scholar] [CrossRef]
  15. Jayarathne, T.; Stockwell, C.E.; Yokelson, R.J.; Nakao, S.; Stone, E.A. Emissions of Fine Particle Fluoride from Biomass Burning. Environ. Sci. Technol. 2014, 48, 12636–12644. [Google Scholar] [CrossRef]
  16. Skórka-Majewicz, M.; Goschorska, M.; Żwierełło, W.; Baranowska-Bosiacka, I.; Styburski, D.; Kapczuk, P.; Gutowska, I. Effect of fluoride on endocrine tissues and their secretory functions—Review. Chemosphere 2020, 260, 127565. [Google Scholar] [CrossRef]
  17. Srivastava, S.; Flora, S.J.S. Fluoride in Drinking Water and Skeletal Fluorosis: A Review of the Global Impact. Curr. Environ. Health Rep. 2020, 7, 140–146. [Google Scholar] [CrossRef]
  18. Barberio, A.M.; Quiñonez, C.; Hosein, F.S.; McLaren, L. Fluoride exposure and reported learning disability diagnosis among Canadian children: Implications for community water fluoridation. Can. J. Public. Health 2017, 108, e229–e239. [Google Scholar] [CrossRef] [PubMed]
  19. Zulfiqar, S.; Ajaz, H.; Rehman, S.U.; Elahi, S.; Shakeel, A.; Yasmeen, F.; Altaf, S. Effect of excess Fluoride consumption on Urine-Serum Fluorides, Dental state and Thyroid Hormones among children in “Talab Sarai” Punjab Pakistan. Open Chem. 2020, 18, 119–128. [Google Scholar] [CrossRef]
  20. Podgorski, J.; Berg, M. Global analysis and prediction of fluoride in groundwater. Nat. Commun. 2022, 13, 4232. [Google Scholar] [CrossRef] [PubMed]
  21. Pearcy, K.; Elphick, J.; Burnett-Seidel, C. Toxicity of fluoride to aquatic species and evaluation of toxicity modifying factors. Environ. Toxicol. Chem. 2015, 34, 1642–1648. [Google Scholar] [CrossRef]
  22. Krzykwa, J.C.; Saeid, A.; Jeffries, M.K.S. Identifying sublethal endpoints for evaluating neurotoxic compounds utilizing the fish embryo toxicity test. Ecotoxicol. Environ. Saf. 2019, 170, 521–529. [Google Scholar] [CrossRef]
  23. McPherson, C.A.; Lee, D.H.Y.; Chapman, P.M. Development of a fluoride chronic effects benchmark for aquatic life in freshwater. Environ. Toxicol. Chem. 2014, 33, 2621–2627. [Google Scholar] [CrossRef] [PubMed]
  24. Pimentel, R.; Bulkley, R.V. Influence of water hardness on fluoride toxicity to rainbow trout. Environ. Toxicol. Chem. 1983, 2, 381–386. [Google Scholar] [CrossRef]
  25. Kaur, R.; Saxena, A.; Batra, M. Acute toxicity bioassay in sodium fluoride exposed amur carp (cyprinus carpio haematopterus) fry. J. Exp. Zool. India 2020, 23, 99–100. [Google Scholar]
  26. Andreev, P.S.; Sansom, I.J.; Li, Q.; Zhao, W.; Wang, J.; Wang, C.-C.; Peng, L.; Jia, L.; Qiao, T.; Zhu, M. Spiny chondrichthyan from the lower Silurian of South China. Nature 2022, 609, 969–974. [Google Scholar] [CrossRef]
  27. Zhang, H.; Zhao, L. Influence of sublethal doses of acetamiprid and halosulfuron-methyl on metabolites of zebra fish (Brachydanio rerio). Aquat. Toxicol. 2017, 191, 85–94. [Google Scholar] [CrossRef]
  28. Diniz, M.S.; Salgado, R.; Pereira, V.J.; Carvalho, G.; Oehmen, A.; Reis, M.A.M.; Noronha, J.P. Ecotoxicity of ketoprofen, diclofenac, atenolol and their photolysis byproducts in zebrafish (Danio rerio). Sci. Total Environ. 2015, 505, 282–289. [Google Scholar] [CrossRef]
  29. Lee, Y.-L.; Shih, Y.-S.; Chen, Z.-Y.; Cheng, F.-Y.; Lu, J.-Y.; Wu, Y.-H.; Wang, Y.-J. Toxic Effects and Mechanisms of Silver and Zinc Oxide Nanoparticles on Zebrafish Embryos in Aquatic Ecosystems. Nanomaterials 2022, 12, 717. [Google Scholar] [CrossRef]
  30. Zhuang, S.; Zhang, Z.; Zhang, W.; Bao, L.; Xu, C.; Zhang, H. Enantioselective developmental toxicity and immunotoxicity of pyraclofos toward zebrafish (Danio rerio). Aquat. Toxicol. 2015, 159, 119–126. [Google Scholar] [CrossRef]
  31. Yichao, J.; Chunqi, L. Conversion Method for Zebrafish Quasi Human Dose for Safety Evaluation. CN113496072A, 2 July 2024. [Google Scholar]
  32. Finney, D.J. Probit Analysis, 3rd ed.; Cambridge University Press: New York, NY, USA, 1971; Volume 60, p. 1432. [Google Scholar]
  33. Hosmer, D.W.; Hosmer, T.; Le Cessie, S.; Lemeshow, S. A comparison of goodness-of-fit tests for the logistic regression model. Stat. Med. 1997, 16, 965–980. [Google Scholar] [CrossRef]
  34. Lei, C.; Sun, X. Comparing lethal dose ratios using probit regression with arbitrary slopes. BMC Pharmacol. Toxicol. 2018, 19, 61. [Google Scholar] [CrossRef]
  35. Adams, J.V.; Slaght, K.S.; Boogaard, M.A. An automated approach to Litchfield and Wilcoxon’s evaluation of dose–effect experiments using the R package LW1949. Environ. Toxicol. Chem. 2016, 35, 3058–3061. [Google Scholar] [CrossRef]
  36. Nair, R.S.; Stevens, M.W.; Martens, M.A.; Ekuta, J. Comparison of BMD with NOAEL and LOAEL Values Derived from Subchronic Toxicity Studies. In Toxicology in Transition; Springer: Berlin/Heidelberg, Germany, 1995. [Google Scholar]
  37. Slob, W. The difference between NOAEL and BMD approach. Toxicol. Lett. 2018, 295, S4. [Google Scholar] [CrossRef]
  38. National Research Council. Risk Assessment in the Federal Government: Managing the Process; The National Academies Press: Washington, DC, USA, 1983. [Google Scholar]
  39. Corbett, S. Quantitative Health Risk Assessment. NSW Public Health Bull. 2003, 14, 161–165. [Google Scholar] [CrossRef] [PubMed]
  40. Shao, K.; Gift, J.S. Model Uncertainty and Bayesian Model Averaged Benchmark Dose Estimation for Continuous Data. Risk Anal. 2014, 34, 101–120. [Google Scholar] [CrossRef] [PubMed]
  41. Kaplan, D. On the Quantification of Model Uncertainty: A Bayesian Perspective. Psychometrika 2021, 86, 215–238. [Google Scholar] [CrossRef] [PubMed]
  42. Madigan, D.; Raftery, A.E. Model Selection and Accounting for Model Uncertainty in Graphical Models Using Occam’s Window. J. Am. Stat. Assoc. 1994, 89, 1535–1546. [Google Scholar] [CrossRef]
  43. Raftery, A.E. Approximate Bayes factors and accounting for model uncertainty in generalised linear models. Biometrika 1996, 83, 251–266. [Google Scholar] [CrossRef]
  44. Forbes, O.; Santos-Fernandez, E.; Wu, P.P.-Y.; Xie, H.-B.; Schwenn, P.E.; Lagopoulos, J.; Mills, L.; Sacks, D.D.; Hermens, D.F.; Mengersen, K. clusterBMA: Bayesian model averaging for clustering. PLoS ONE 2023, 18, e0288000. [Google Scholar] [CrossRef]
  45. Committee, E.S.; More, S.J.; Bampidis, V.; Benford, D.; Bragard, C.; Halldorsson, T.I.; Hernández-Jerez, A.F.; Bennekou, S.H.; Koutsoumanis, K.; Lambré, C.; et al. Guidance on the use of the benchmark dose approach in risk assessment. EFSA J. 2022, 20, e07584. [Google Scholar]
  46. Ministry of Ecology and Environment of the People’s Republic of China. Water Quality-Determination of Fluoride-Ion Selective Electrode Method. [GB 7484-87]. 1987. Available online: https://www.mee.gov.cn/ywgz/fgbz/bz/bzwb/jcffbz/198708/t19870801_66705.shtml (accessed on 18 October 2024).
  47. Cold Spring Harbor Protocols. E3 Medium (for Zebrafish Embryos). Available online: https://cshprotocols.cshlp.org/content/2011/10/pdb.rec66449 (accessed on 5 November 2024).
  48. World Health Organization. Guidelines for Drinking-Water Quality. Available online: https://www.who.int/publications/i/item/9789240045064 (accessed on 6 November 2024).
  49. National Disease Control and Prevention Administration. Standards for Drinking Water Quality. [GB 5749-2022]. 2022. Available online: https://www.ndcpa.gov.cn/jbkzzx/c100201/common/content/content_1665979083259711488.html (accessed on 18 October 2024).
  50. Ministry of Natural Resources of the People’s Republic of China. Standard for Groundwater Quality. [GB/T14848-2017]. 2017. Available online: https://openstd.samr.gov.cn/bzgk/gb/newGbInfo?hcno=F745E3023BD5B10B9FB5314E0FFB5523 (accessed on 18 October 2024).
  51. Ministry of Natural Resources of the People’s Republic of China. Environmental Quality Standards for Surface Water. [GB 3838-2002]. 2003. Available online: https://www.mee.gov.cn/ywgz/fgbz/bz/bzwb/shjbh/shjzlbz/200206/t20020601_66497.htm (accessed on 18 October 2024).
  52. Ministry of Ecology and Environment of the People’s Republic of China. Water Quality Standard for Fisheries. [GB 11607-89]. 1989. Available online: https://www.mee.gov.cn/ywgz/fgbz/bz/bzwb/shjbh/shjzlbz/199003/t19900301_66502.shtml (accessed on 18 October 2024).
  53. United States Environmental Protection Agency. Secondary Drinking Water Standards: Guidance for Nuisance Chemicals. Available online: https://www.epa.gov/sdwa/secondary-drinking-water-standards-guidance-nuisance-chemicals (accessed on 6 November 2024).
  54. Ministry of Ecology and Environment of the People’s Republic of China. Integrated Wastewater Discharge Standard. [GB 8978-1996]. 1996. Available online: https://www.mee.gov.cn/ywgz/fgbz/bz/bzwb/shjbh/swrwpfbz/199801/t19980101_66568.shtml (accessed on 18 October 2024).
  55. Ministry of Natural Resources of the People’s Republic of China. Identification Standards for Hazardous Wastes-Identification for Extraction Toxicity. [GB 5085.3-2007]. 2007. Available online: https://www.mee.gov.cn/ywgz/fgbz/bz/bzwb/gthw/wxfwjbffbz/200705/t20070522_103957.shtml (accessed on 18 October 2024).
  56. United States Environmental Protection Agency. National Recommended Water Quality Criteria—Aquatic Life Criteria Table. Available online: https://www.epa.gov/wqc/national-recommended-water-quality-criteria-aquatic-life-criteria-table (accessed on 6 November 2024).
  57. OECD. Test No. 210: Fish, Early-life Stage Toxicity Test; OECD: Paris, France, 2013. [Google Scholar]
  58. Shao, K.; Andrew, J.S. A Web-Based System for Bayesian Benchmark Dose Estimation. Environ. Health Perspect. 2018, 126, 017002. [Google Scholar] [CrossRef]
  59. Zhang, H.-c.; Wang, X.-P. Standardization research on Raven’s Standard Progressive Matrices in China. Acta Psychol. Sin. 1989, 21, 113–121. [Google Scholar]
  60. National Health Commission of the People’s Republic of China. Determination of Fluorine in Foods. [GB/T 5009.18-2003]. 2003. Available online: https://openstd.samr.gov.cn/bzgk/gb/newGbInfo?hcno=53B882FC979093D5333F58A5AE68172E (accessed on 18 October 2024).
  61. Tahir, M.A.; Rasheed, H. Fluoride in the drinking water of Pakistan and the possible risk of crippling fluorosis. Drink. Water Eng. Sci. 2013, 6, 17–23. [Google Scholar] [CrossRef]
  62. Olaka, L.A.; Wilke, F.D.H.; Olago, D.O.; Odada, E.O.; Mulch, A.; Musolff, A. Groundwater fluoride enrichment in an active rift setting: Central Kenya Rift case study. Sci. Total Environ. 2016, 545–546, 641–653. [Google Scholar] [CrossRef] [PubMed]
  63. Ghiglieri, G.; Pistis, M.; Abebe, B.; Azagegn, T.; Engidasew, T.A.; Pittalis, D.; Soler, A.; Barbieri, M.; Navarro-Ciurana, D.; Carrey, R.; et al. Three-dimensional hydrostratigraphical modelling supporting the evaluation of fluoride enrichment in groundwater: Lakes basin (Central Ethiopia). J. Hydrol. Reg. Stud. 2020, 32, 100756. [Google Scholar] [CrossRef]
  64. Mu, Y.; See, I.; Edwards, J.R. Bayesian model averaging: Improved variable selection for matched case-control studies. Epidemiol. Biostat. Public. Health 2022, 16. [Google Scholar] [CrossRef] [PubMed]
  65. Wang, D.; Zhang, W.; Bakhai, A. Comparison of Bayesian model averaging and stepwise methods for model selection in logistic regression. Stat. Med. 2004, 23, 3451–3467. [Google Scholar] [CrossRef]
  66. Genell, A.; Nemes, S.; Steineck, G.; Dickman, P.W. Model selection in Medical Research: A simulation study comparing Bayesian Model Averaging and Stepwise Regression. BMC Med. Res. Methodol. 2010, 10, 108. [Google Scholar] [CrossRef]
  67. Jennifer, A.H.; David, M.; Adrian, E.R.; Chris, T.V. Bayesian model averaging: A tutorial (with comments by M. Clyde, David Draper and E. I. George, and a rejoinder by the authors). Stat. Sci. 1999, 14, 382–417. [Google Scholar]
  68. Kaplan, D.; Yavuz, S. An Approach to Addressing Multiple Imputation Model Uncertainty Using Bayesian Model Averaging. Multivar. Behav. Res. 2020, 55, 553–567. [Google Scholar] [CrossRef]
  69. Baran, S.; Möller, A. Joint probabilistic forecasting of wind speed and temperature using Bayesian model averaging. Environmetrics 2015, 26, 120–132. [Google Scholar] [CrossRef]
  70. Yeung, K.Y.; Bumgarner, R.E.; Raftery, A.E. Bayesian model averaging: Development of an improved multi-class, gene selection and classification tool for microarray data. Bioinformatics 2005, 21, 2394–2402. [Google Scholar] [CrossRef]
  71. Montgomery, J.M.; Nyhan, B. Bayesian Model Averaging: Theoretical Developments and Practical Applications. Political Anal. 2010, 18, 245–270. [Google Scholar] [CrossRef]
  72. Fernández, C.; Ley, E.; Steel, M.F.J. Benchmark priors for Bayesian model averaging. J. Econom. 2001, 100, 381–427. [Google Scholar] [CrossRef]
  73. Fowles, J.R.; Alexeeff, G.V.; Dodge, D. The Use of Benchmark Dose Methodology with Acute Inhalation Lethality Data. Regul. Toxicol. Pharmacol. 1999, 29, 262–278. [Google Scholar] [CrossRef]
  74. Sand, S.; Christopher, J.P.; Krewski, D. A Signal-to-Noise Crossover Dose as the Point of Departure for Health Risk Assessment. Environ. Health Perspect. 2011, 119, 1766–1774. [Google Scholar] [CrossRef]
  75. Allen, B.C.; Kavlock, R.J.; Kimmel, C.A.; Faustman, E.M. Dose-Response Assessment for Developmental Toxicity: II. Comparison of Generic Benchmark Dose Estimates with No Observed Adverse Effect Levels. Fundam. Appl. Toxicol. 1994, 23, 487–495. [Google Scholar] [CrossRef] [PubMed]
  76. McIntire, K.M.; Juliano, S.A. How can mortality increase population size? A test of two mechanistic hypotheses. Ecology 2018, 99, 1660–1670. [Google Scholar] [CrossRef]
  77. Huss, M.; Nilsson, K.A. Experimental evidence for emergent facilitation: Promoting the existence of an invertebrate predator by killing its prey. J. Anim. Ecol. 2011, 80, 615–621. [Google Scholar] [CrossRef]
  78. Ohlberger, J.; Langangen, Ø.; Edeline, E.; Claessen, D.; Winfield, I.J.; Stenseth, N.C.; Vøllestad, L.A. Stage-specific biomass overcompensation by juveniles in response to increased adult mortality in a wild fish population. Ecology 2011, 92, 2175–2182. [Google Scholar] [CrossRef] [PubMed]
  79. Pardini, E.A.; Drake, J.M.; Chase, J.M.; Knight, T.M. Complex population dynamics and control of the invasive biennial Alliaria petiolata (garlic mustard). Ecol. Appl. 2009, 19, 387–397. [Google Scholar] [CrossRef]
  80. Zipkin, E.F.; Sullivan, P.J.; Cooch, E.G.; Kraft, C.E.; Shuter, B.J.; Weidel, B.C. Overcompensatory response of a smallmouth bass (Micropterus dolomieu) population to harvest: Release from competition? Can. J. Fish. Aquat. Sci. 2008, 65, 2279–2292. [Google Scholar] [CrossRef]
  81. Jonzén, N.; Lundberg, P. Temporally structured density-dependence and population management. Ann. Zool. Fenn. 1999, 36, 39–44. [Google Scholar]
  82. Xu, Q.; Yang, X.; Yan, Y.; Wang, S.; Loreau, M.; Jiang, L. Consistently positive effect of species diversity on ecosystem, but not population, temporal stability. Ecol. Lett. 2021, 24, 2256–2266. [Google Scholar] [CrossRef] [PubMed]
  83. Epstein, C.J. Developmental genetics. Experientia 1986, 42, 1117–1128. [Google Scholar] [CrossRef] [PubMed]
  84. Peters, A.; Nawrot, T.S.; Baccarelli, A.A. Hallmarks of environmental insults. Cell 2021, 184, 1455–1468. [Google Scholar] [CrossRef] [PubMed]
  85. Kang, M.; Long, T.; Chang, C.; Meng, T.; Ma, H.; Li, Z.; Li, P.; Chen, Y. A Review of the Ethical Use of Animals in Functional Experimental Research in China Based on the “Four R” Principles of Reduction, Replacement, Refinement, and Responsibility. Med. Sci. Monit. 2022, 28, e938807. [Google Scholar] [CrossRef]
  86. Embry, M.R.; Belanger, S.E.; Braunbeck, T.A.; Galay-Burgos, M.; Halder, M.; Hinton, D.E.; Léonard, M.A.; Lillicrap, A.; Norberg-King, T.; Whale, G. The fish embryo toxicity test as an animal alternative method in hazard and risk assessment and scientific research. Aquat. Toxicol. 2010, 97, 79–87. [Google Scholar] [CrossRef]
  87. Van Bockstaele, E.J.; Ross, J.A. Catecholamine dysregulation and neurodegenerative disease: From molecular mechanisms to circuit dysfunction. Brain Res. 2019, 1702, 1–2. [Google Scholar] [CrossRef]
  88. Reid, S.G.; Bernier, N.J.; Perry, S.F. The adrenergic stress response in fish: Control of catecholamine storage and release. Communicated by Dr P.W. Hochachka, Editor.1. Comp. Biochem. Physiol. Part C Pharmacol. Toxicol. Endocrinol. 1998, 120, 1–27. [Google Scholar]
  89. Nawale, V.P.; Malpe, D.B.; Marghade, D.; Yenkie, R. Non-carcinogenic health risk assessment with source identification of nitrate and fluoride polluted groundwater of Wardha sub-basin, central India. Ecotoxicol. Environ. Saf. 2021, 208, 111548. [Google Scholar] [CrossRef]
  90. Jin, T.; Huang, T.; Zhang, T.; Li, Q.; Yan, C.; Wang, Q.; Chen, X.; Zhou, J.; Sun, Y.; Bo, W.; et al. A Bayesian benchmark concentration analysis for urinary fluoride and intelligence in adults in Guizhou, China. Sci. Total Environ. 2024, 925, 171326. [Google Scholar] [CrossRef]
  91. Abouheif, E.; Favé, M.-J.; Ibarrarán-Viniegra, A.S.; Lesoway, M.P.; Rafiqi, A.M.; Rajakumar, R. Eco-Evo-Devo: The Time Has Come, in Ecological Genomics: Ecology and the Evolution of Genes and Genomes; Landry, C.R., Aubin-Horth, N., Eds.; Springer: Dordrecht, The Netherlands, 2014; pp. 107–125. [Google Scholar]
  92. Skúlason, S.; Parsons, K.J.; Svanbäck, R.; Räsänen, K.; Ferguson, M.M.; Adams, C.E.; Amundsen, P.-A.; Bartels, P.; Bean, C.W.; Boughman, J.W.; et al. A way forward with eco evo devo: An extended theory of resource polymorphism with postglacial fishes as model systems. Biol. Rev. 2019, 94, 1786–1808. [Google Scholar] [CrossRef] [PubMed]
Figure 1. Layout of 24-well plates. T = test group; C = control group; IC = internal plate control.
Toxics 12 00902 g001
Figure 2. Normal and harmful outcome on embryo and sac–fry stages of zebrafish. (a) normal development embryo; (b) coagulation of the embryo; (c) normal larva; (d) malformed larva: d1, tail and spine curved; d2, mandible shorter malformation; d3, pericardial hydrops; d4, yolk sac edema.
Toxics 12 00902 g002
Figure 3. The outcome of toxicity indicators. (ae) cumulative mortality at 1–5 dpf; (f) cumulative malformation rate at 5 dpf. a Compared with the control group, p < 0.000; b Compared with the control group, p < 0.05; c Compared with the control group, p < 0.01.
Toxics 12 00902 g003
Figure 4. Model average and the eight BMD models of BMC estimates in BMR = 10%. (ae) CM at 1–5 dpf; (f) CMA at 5 dpf.
Toxics 12 00902 g004aToxics 12 00902 g004bToxics 12 00902 g004cToxics 12 00902 g004dToxics 12 00902 g004eToxics 12 00902 g004f
Figure 5. One health conception in fluoride for sustainability development of the environment. F- represents fluoride ions.
Toxics 12 00902 g005
Table 1. The formulas for toxicity indicators estimate.
Toxicity IndicatorsFormula
CMN = cumulative dead numbers each day/total
CMA at 5 dpfN = CMA numbers from hatch to 5 dpf/hatched numbers
Table 2. The models for dose–response and BMC/BMCL estimates.
ModelFormula
Exponential model 2 f d o s e = a × e b × d o s e
Exponential model 3 f d o s e = a × e b × d o s e g
Exponential model 4 f d o s e = a × c c 1 × e b   ×   d o s e
Exponential model 5 f d o s e = a × c c 1 × e b   ×   d o s e g
Hill model f d o s e = a + b × d o s e g c g + d o s e g
Power mode f d o s e = a + b × d o s e g
Michaelis Menten model f d o s e = a + b × d o s e c + d o s e
Linear model f d o s e = a + b × d o s e
Table 3. The outcome of toxicity indicators for each concentration group ( x ¯ ± SD).
Fluoride Dose (mg/L)CM atCMA at 5 dpf
1 dpf2 dpf3 dpf4 dpf5 dpf
0.06.11 ± 2.3610.67 ± 3.8210.67 ± 3.8210.67 ± 3.8213.89 ± 3.289.45 ± 3.10
0.58.56 ± 4.4510.89 ± 3.5410.89 ± 3.5410.89 ± 3.5414.78 ± 3.9910.66 ± 5.38
1.08.00 ± 4.569.33 ± 3.509.33 ± 3.509.33 ± 3.5014.56 ± 4.3910.56 ± 8.43
4.010.00 ± 9.7810.56 ± 9.7810.56 ± 9.7810.56 ± 9.7812.22 ± 10.308.55 ± 8.49
10.013.00 ± 8.9913.17 ± 8.7313.17 ± 8.7314.17 ± 8.3316.83 ± 8.5216.98 ± 4.34
20.023.93 ± 6.2724.93 ± 7.7425.43 ± 8.2126.26 ± 7.7227.93 ± 11.1024.86 ± 9.23
50.024.44 ± 7.7951.11 ± 24.1051.11 ± 24.1060.56 ± 22.7566.67 ± 16.7327.46 ± 10.06
80.035.00 ± 10.9051.11 ± 16.2957.78 ± 22.7778.33 ± 19.4185.56 ± 7.5087.24 ± 12.26
100.033.89 ± 7.1361.11 ± 29.3485.00 ± 17.9897.22 ± 3.90100.00 ± 0100 ± 0
120.046.11 ± 2.5176.11 ± 15.4183.89 ± 14.2190.00 ± 10.75100.00 ± 090.00 ± 10.75
150.042.78 ± 9.2976.67 ± 22.1198.33 ± 4.08100.00 ± 0100.00 ± 0100.00 ± 0
200.054.45 ± 16.8298.33 ± 2.7999.45 ± 1.36100.00 ± 0100.00 ± 0100.00 ± 0
250.066.67 ± 5.27100.00 ± 0100.00 ± 0100.00 ± 0100.00 ± 0100.00 ± 0
300.0100.00 ± 0100.00 ± 0100.00 ± 0100.00 ± 0100.00 ± 0100.00 ± 0
Table 4. The LC50/EC50 of toxicity indicators on embryo and sac–fry stages of zebrafish.
Model1 dpf CM2 dpf CM3 dpf CM4 dpf CM5 dpf CM5 dpf CMA
RhatPPPvLC50RhatPPPvLC50RhatPPPvLC50RhatPPPvLC50RhatPPPvLC50RhatPPPvEC50
Exponential model 21.00.259186.001.00.2631421.00.2671351.00.2621351.00.2601141.00.266132
Exponential model 31.00.268186.001.00.2591431.00.2631341.00.2611341.00.2631151.00.265134
Exponential model 41.00.266147.001.00.261751.00.261631.00.265631.00.260451.00.26060
Exponential model 51.00.269143.001.00.259701.00.272571.00.265571.00.259381.00.26356
Hill model1.00.254145.001.00.260741.00.267561.00.264561.00.264371.00.26558
Michaelis Menten
model
1.00.263150.001.00.259931.00.266821.00.266821.00.266691.00.25879
Linear model1.00.271148.001.00.256811.00.269691.00.265691.00.267501.00.25865
Power model1.00.268149.001.00.258921.00.262811.00.264811.00.263671.00.25977
Average\\147.00\\80.80\\61.25\\56.50\\37.50\\59.75
Table 5. W-F BMCs/BMCLs (mg/L) for the zebrafish on embryo and sac–fry stages based on BMRs of 10% reduction in toxicity indicators.
Model1 dpf CM2 dpf CM3 dpf CM4 dpf CM5 dpf CM5 dpf CMA
Weight
(%)
BMCBMCLBMCUWeight
(%)
BMCBMCLBMCUWeight
(%)
BMCBMCLBMCUWeight
(%)
BMCBMCLBMCUWeight
(%)
BMCBMCLBMCUWeight
(%)
BMCBMCLBMCU
Model average\1.961.192.88\1.801.025.07\4.192.197.19\5.073.067.87\7.694.9811.82\3.731.697.82
Exponential model 20.0011.2010.0312.690.0010.859.6612.410.0010.649.3612.330.0010.829.4012.720.0012.3210.6714.590.0010.318.9612.13
Exponential model 30.0012.2610.5415.850.0011.7610.0814.870.0011.569.8614.670.0011.819.9315.180.0013.4211.2417.430.0011.279.5014.65
Exponential model 427.401.501.052.1223.101.200.891.611.701.010.761.320.000.810.621.050.001.050.801.393.700.870.641.17
Exponential model 54.602.041.273.8024.603.011.595.6045.603.952.186.740.404.542.757.260.417.124.5612.6762.203.881.988.04
Hill model6.402.311.513.7428.602.771.445.7751.504.372.207.440.605.343.328.020.598.005.4011.5329.803.301.366.91
Michaelis Menten model33.101.951.332.5823.301.401.031.821.101.150.851.520.000.890.651.210.001.170.861.594.200.990.711.33
Linear model24.702.512.013.140.202.021.642.500.001.751.412.160.001.591.281.990.002.291.842.850.001.521.191.93
Power model3.802.932.214.390.302.351.803.410.002.011.542.830.001.791.372.470.002.551.983.500.001.791.332.64
Disclaimer/Publisher’s Note: The statements, opinions and data contained in all publications are solely those of the individual author(s) and contributor(s) and not of MDPI and/or the editor(s). MDPI and/or the editor(s) disclaim responsibility for any injury to people or property resulting from any ideas, methods, instructions or products referred to in the content.

