Application of Convolutional Neural Networks for Automated Ulcer Detection in Wireless Capsule Endoscopy Images


Abstract
1. Introduction
2. Wireless Capsule Endoscopy Image Ulcer Detection Techniques
2.1. Wireless Capsule Endoscopy
2.2. Deep Learning Network in WCE
3. Literature Review
4. Methods
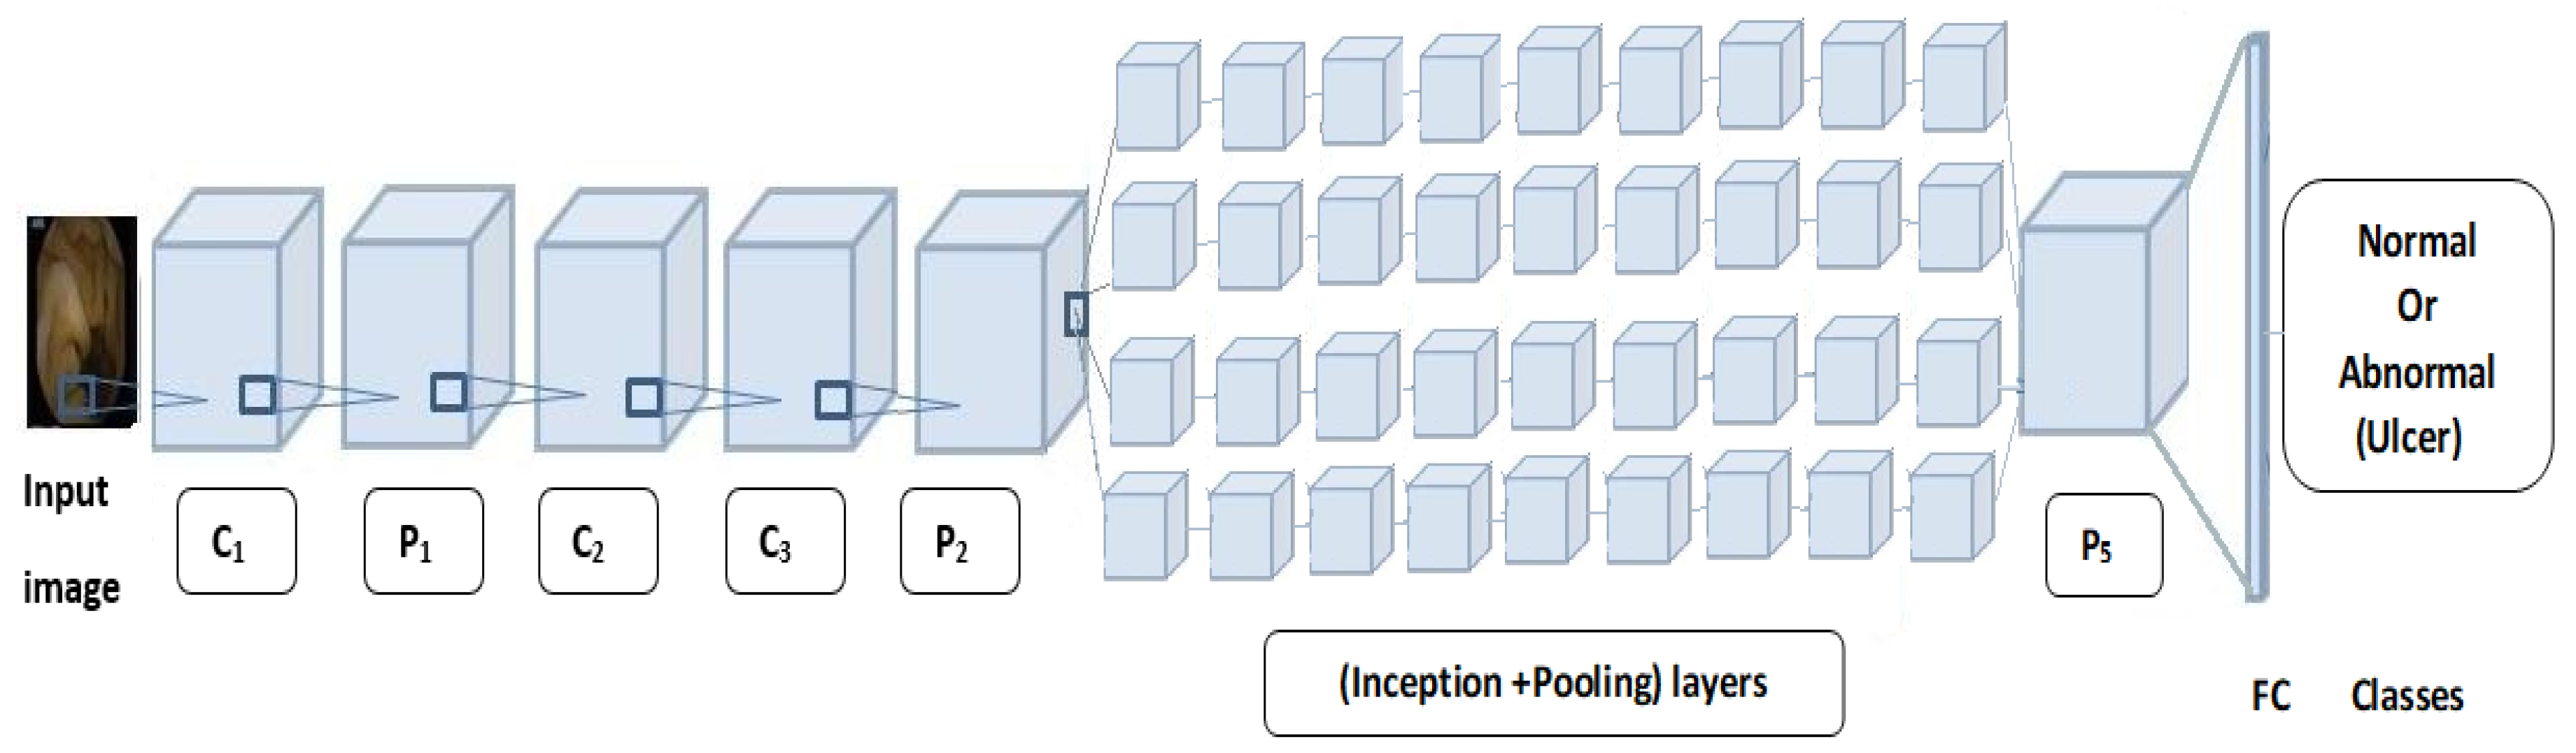
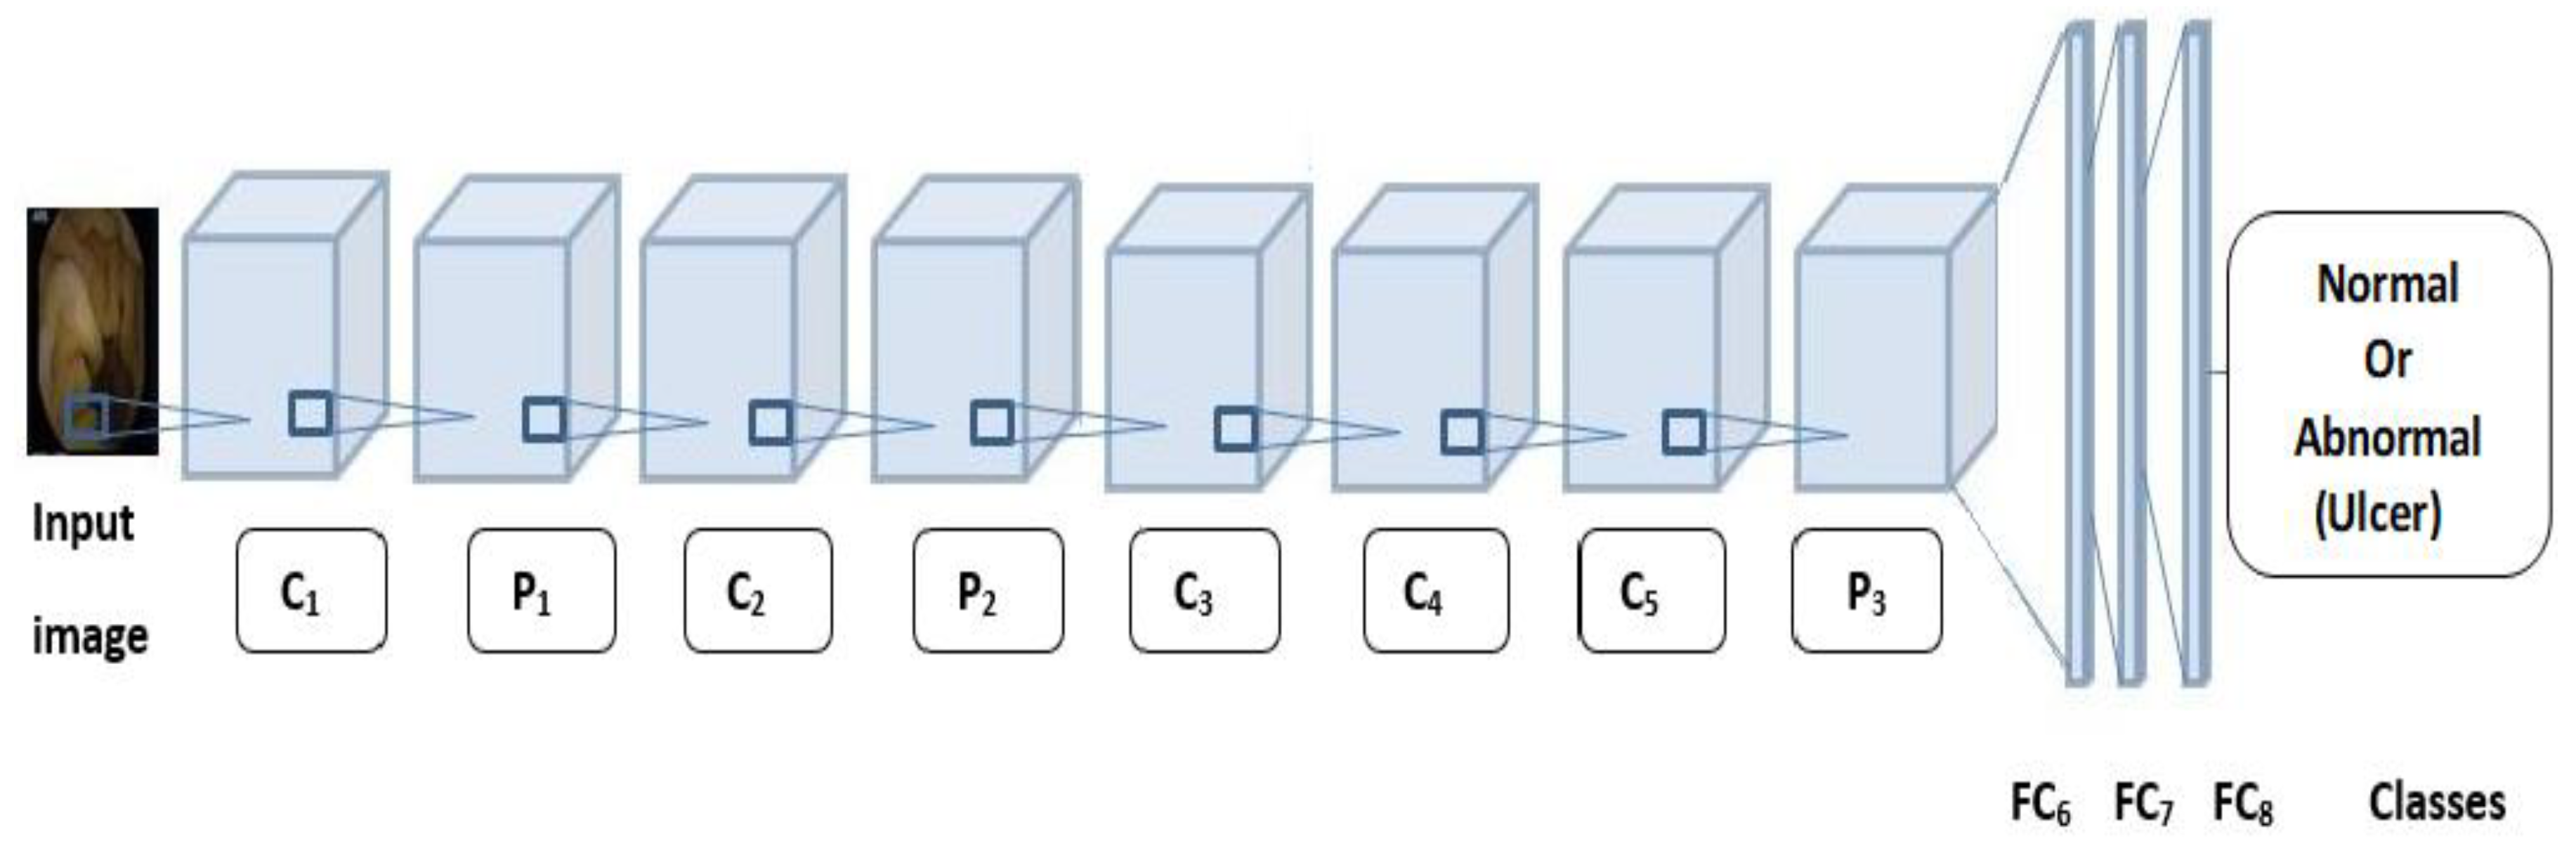
4.1. Convolutional Neural Networks
4.2. Pretrained Networks
| Algorithm 1. |
| ∀ x ∈X, ∃ i ∈ X: i resize of x Let G be GoogLeNet a pretrained network ∈CNN Let A be AlexNet a pretrained network ∈CNN Let M be a set of measures: M = {Accuracy, Sensitivity, Specificity, Loss, AUC} ∀ G & A∈CNN, ∃ m | m [Sensitivity] = {S_sen: S_sen ⇒CNN(x)} & m[Specificity] = {S_sp: S_sp ⇒CNN(x)} & m[Accuracy]= {S_ac: S_ac⇒CNN(x)} & m[AreaUnderCurve] = {S_AUC: S_AUC ⇒CNN(x)} |
5. Experiments and Results
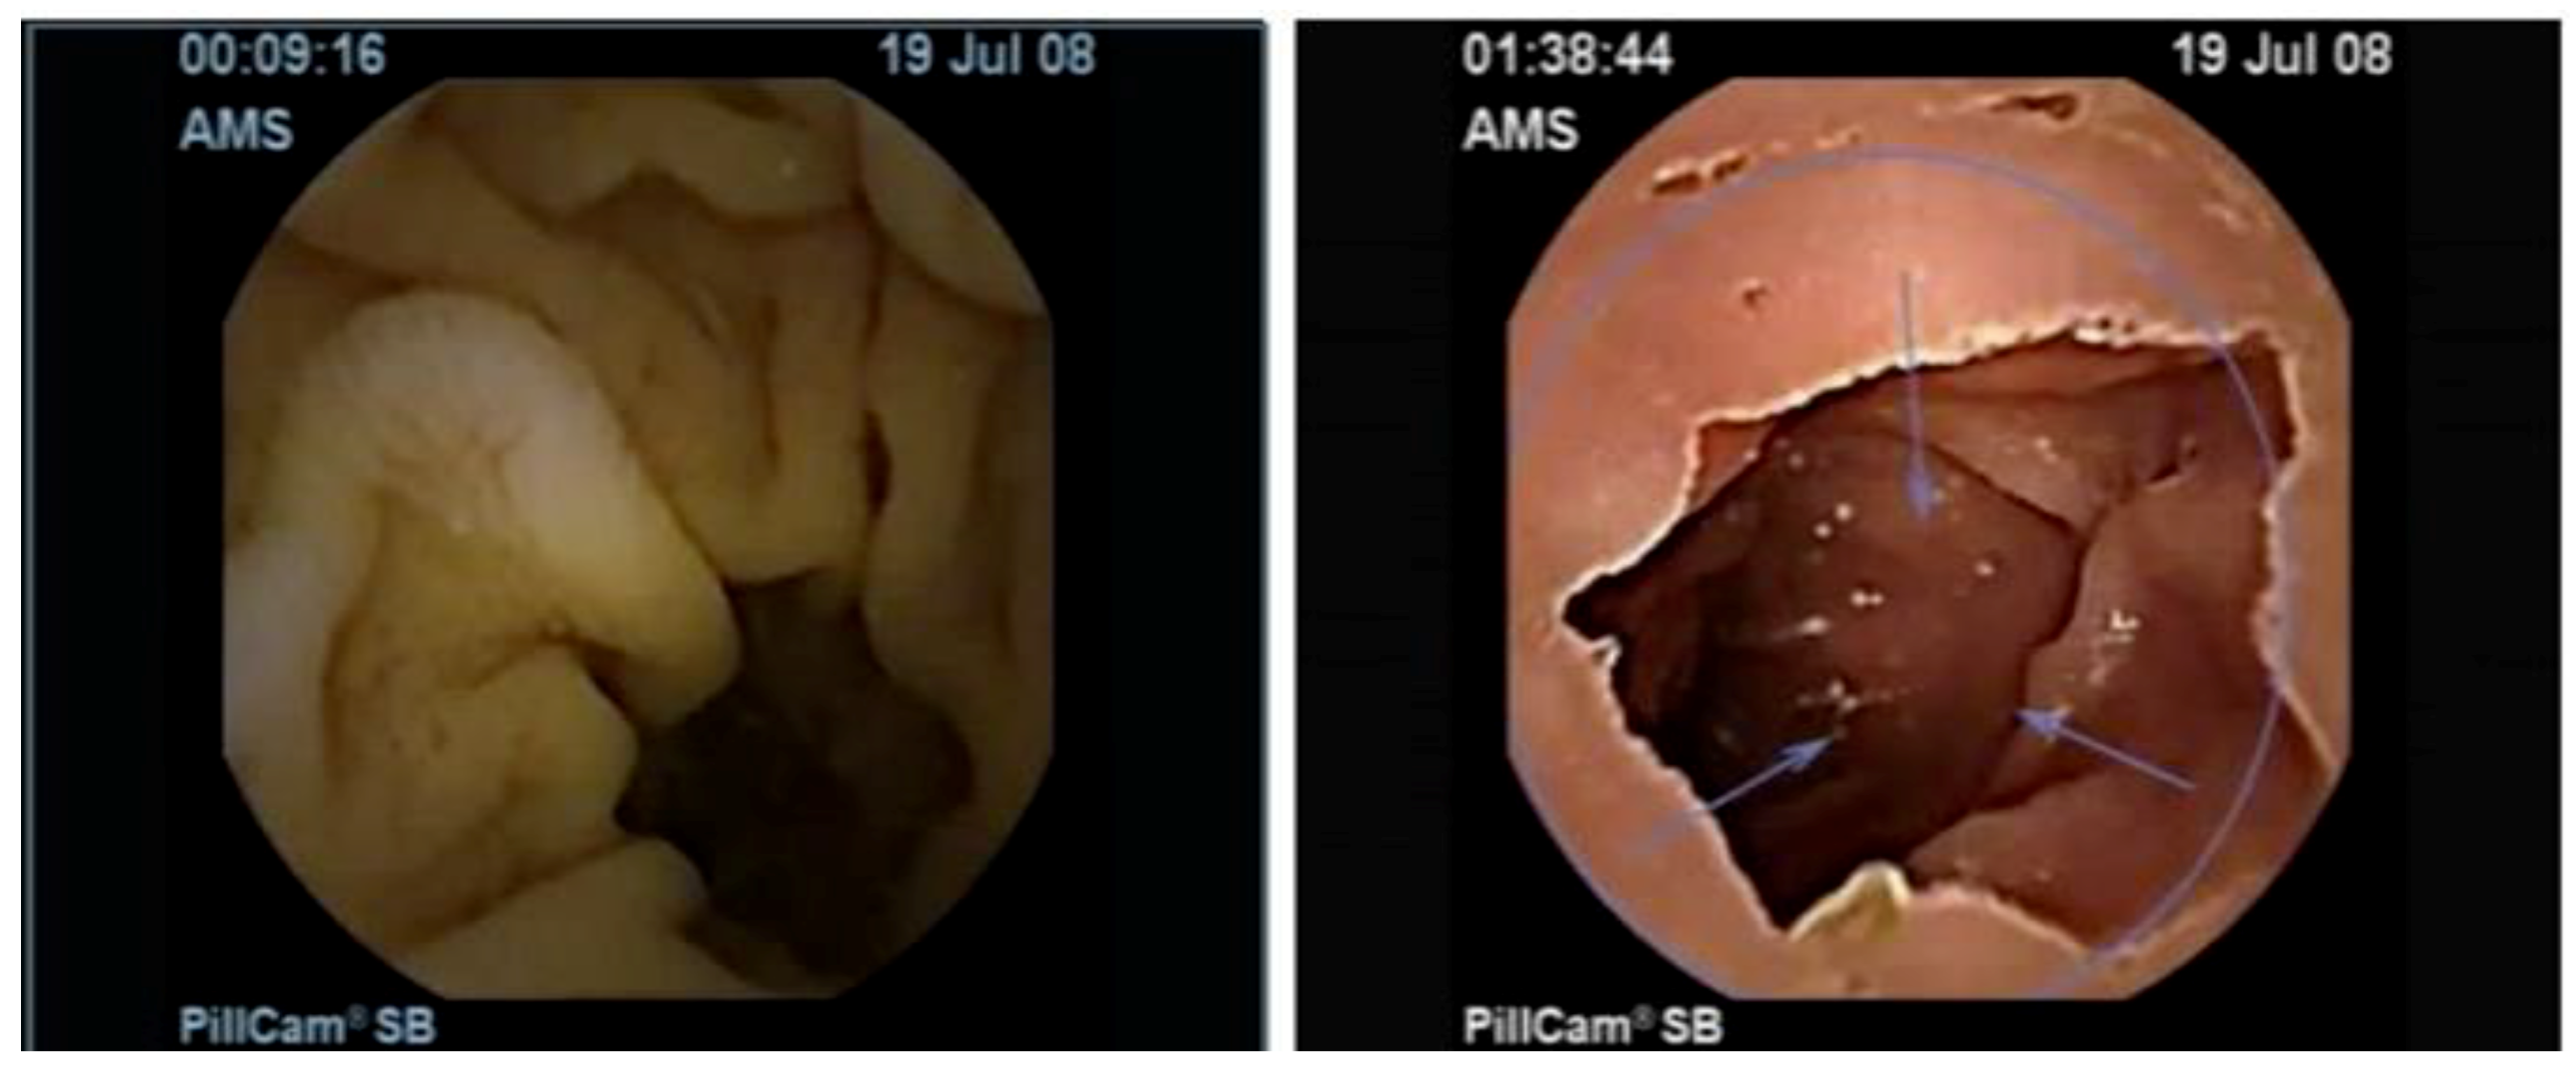
5.1. Dataset
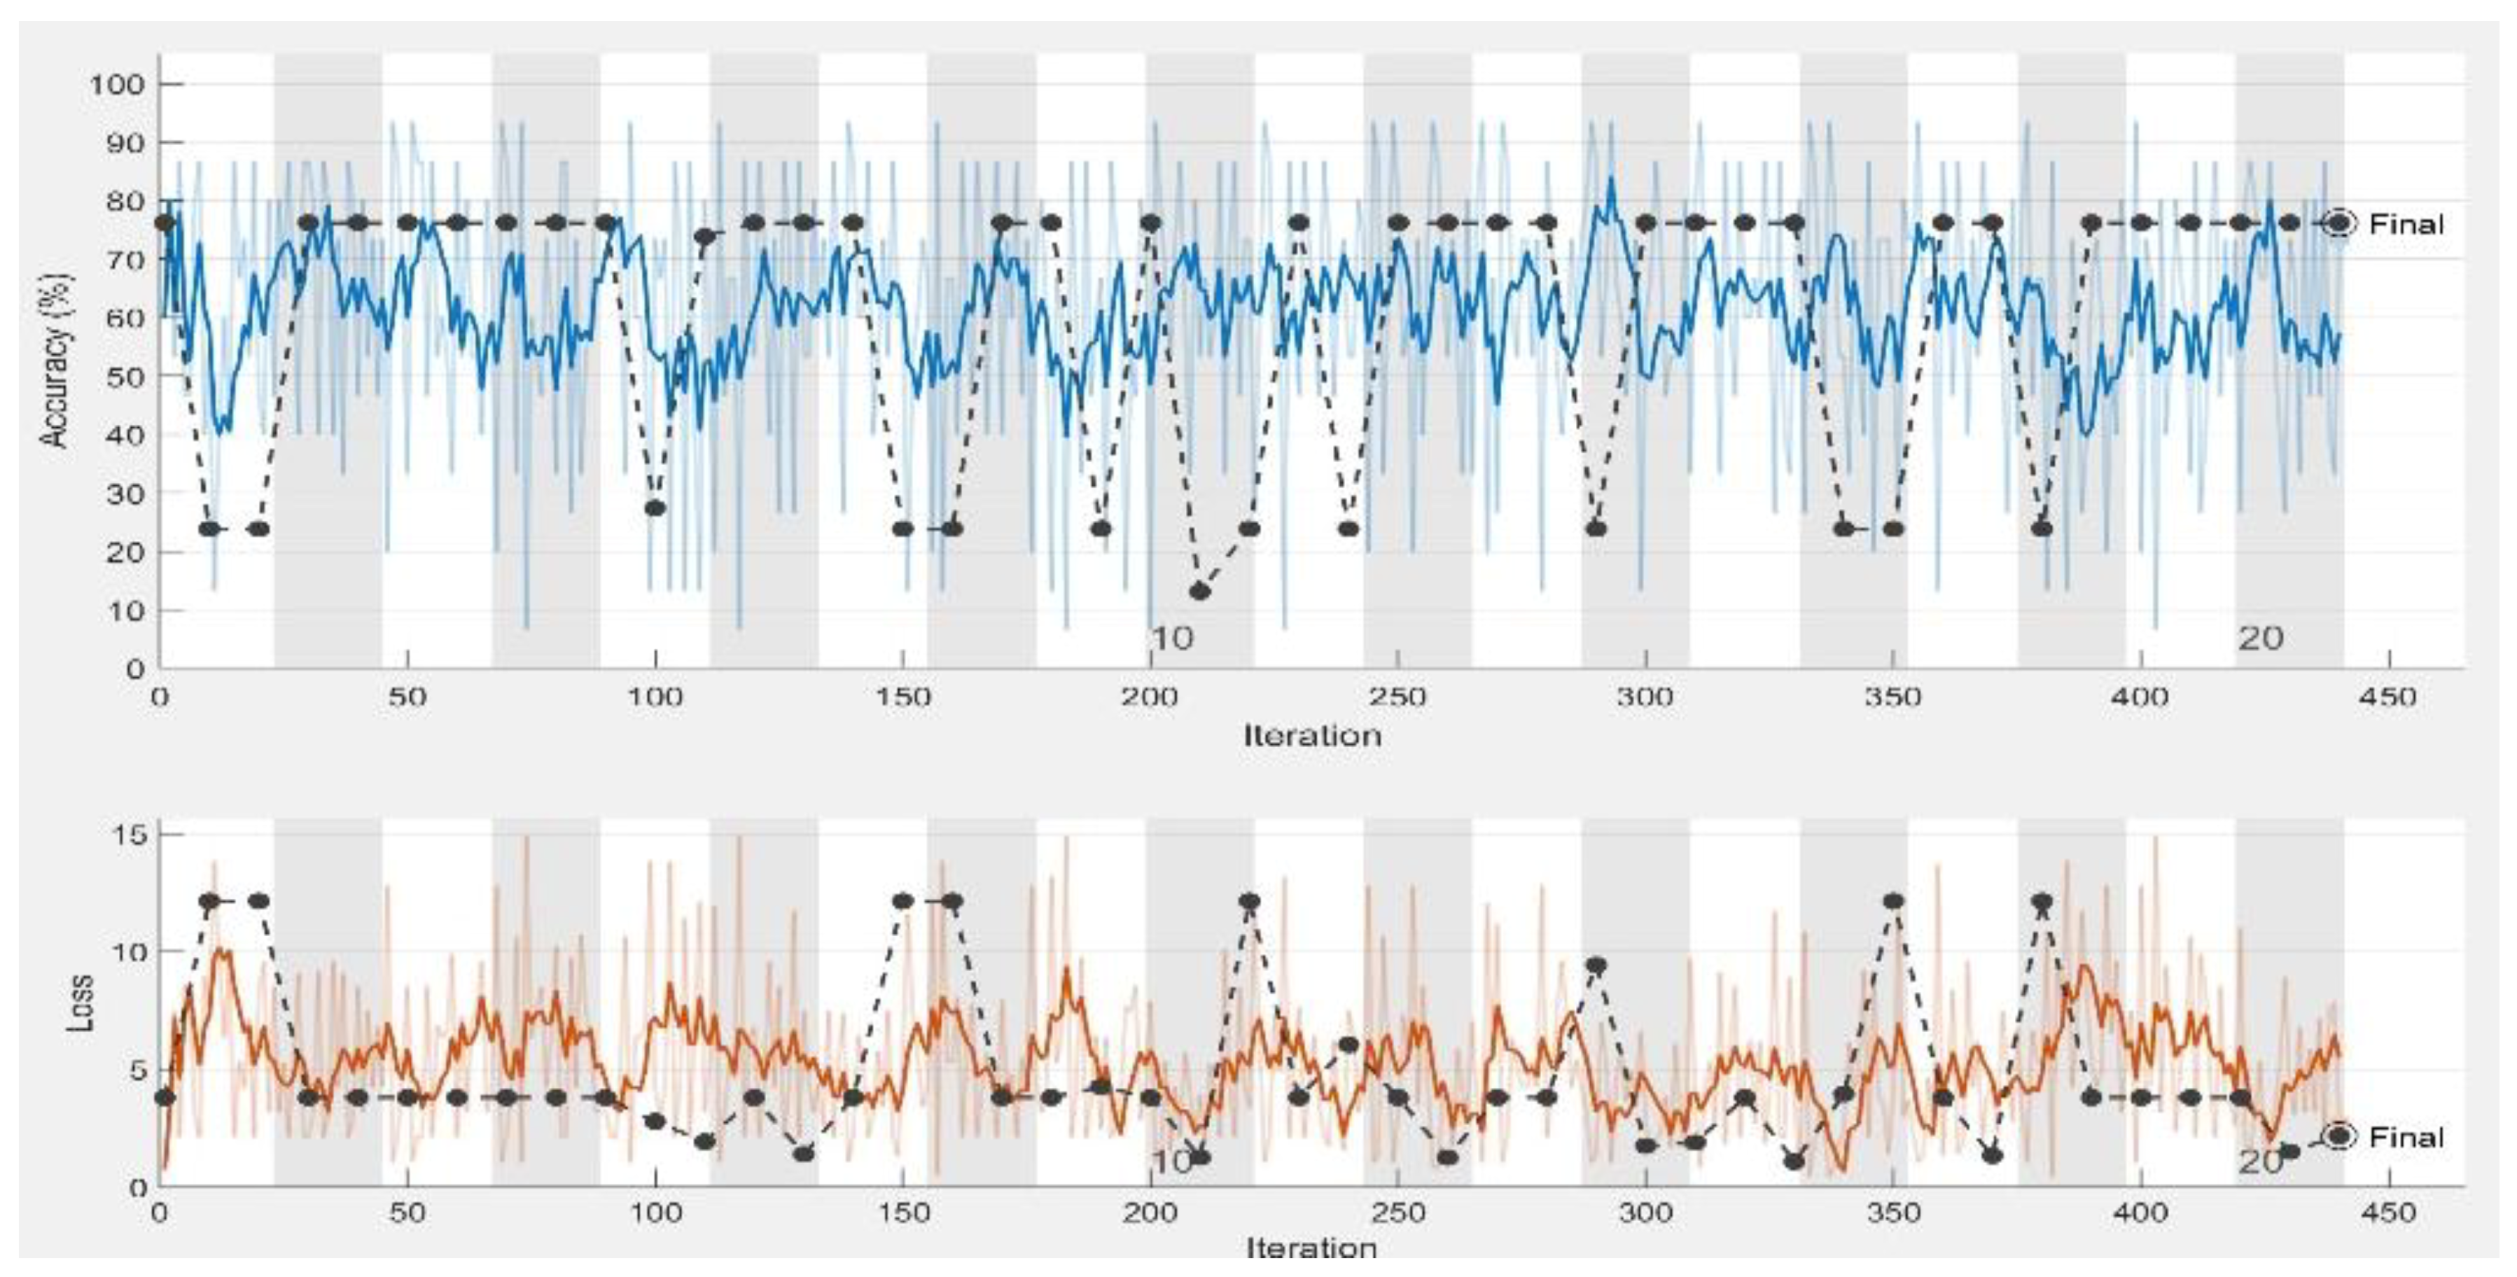
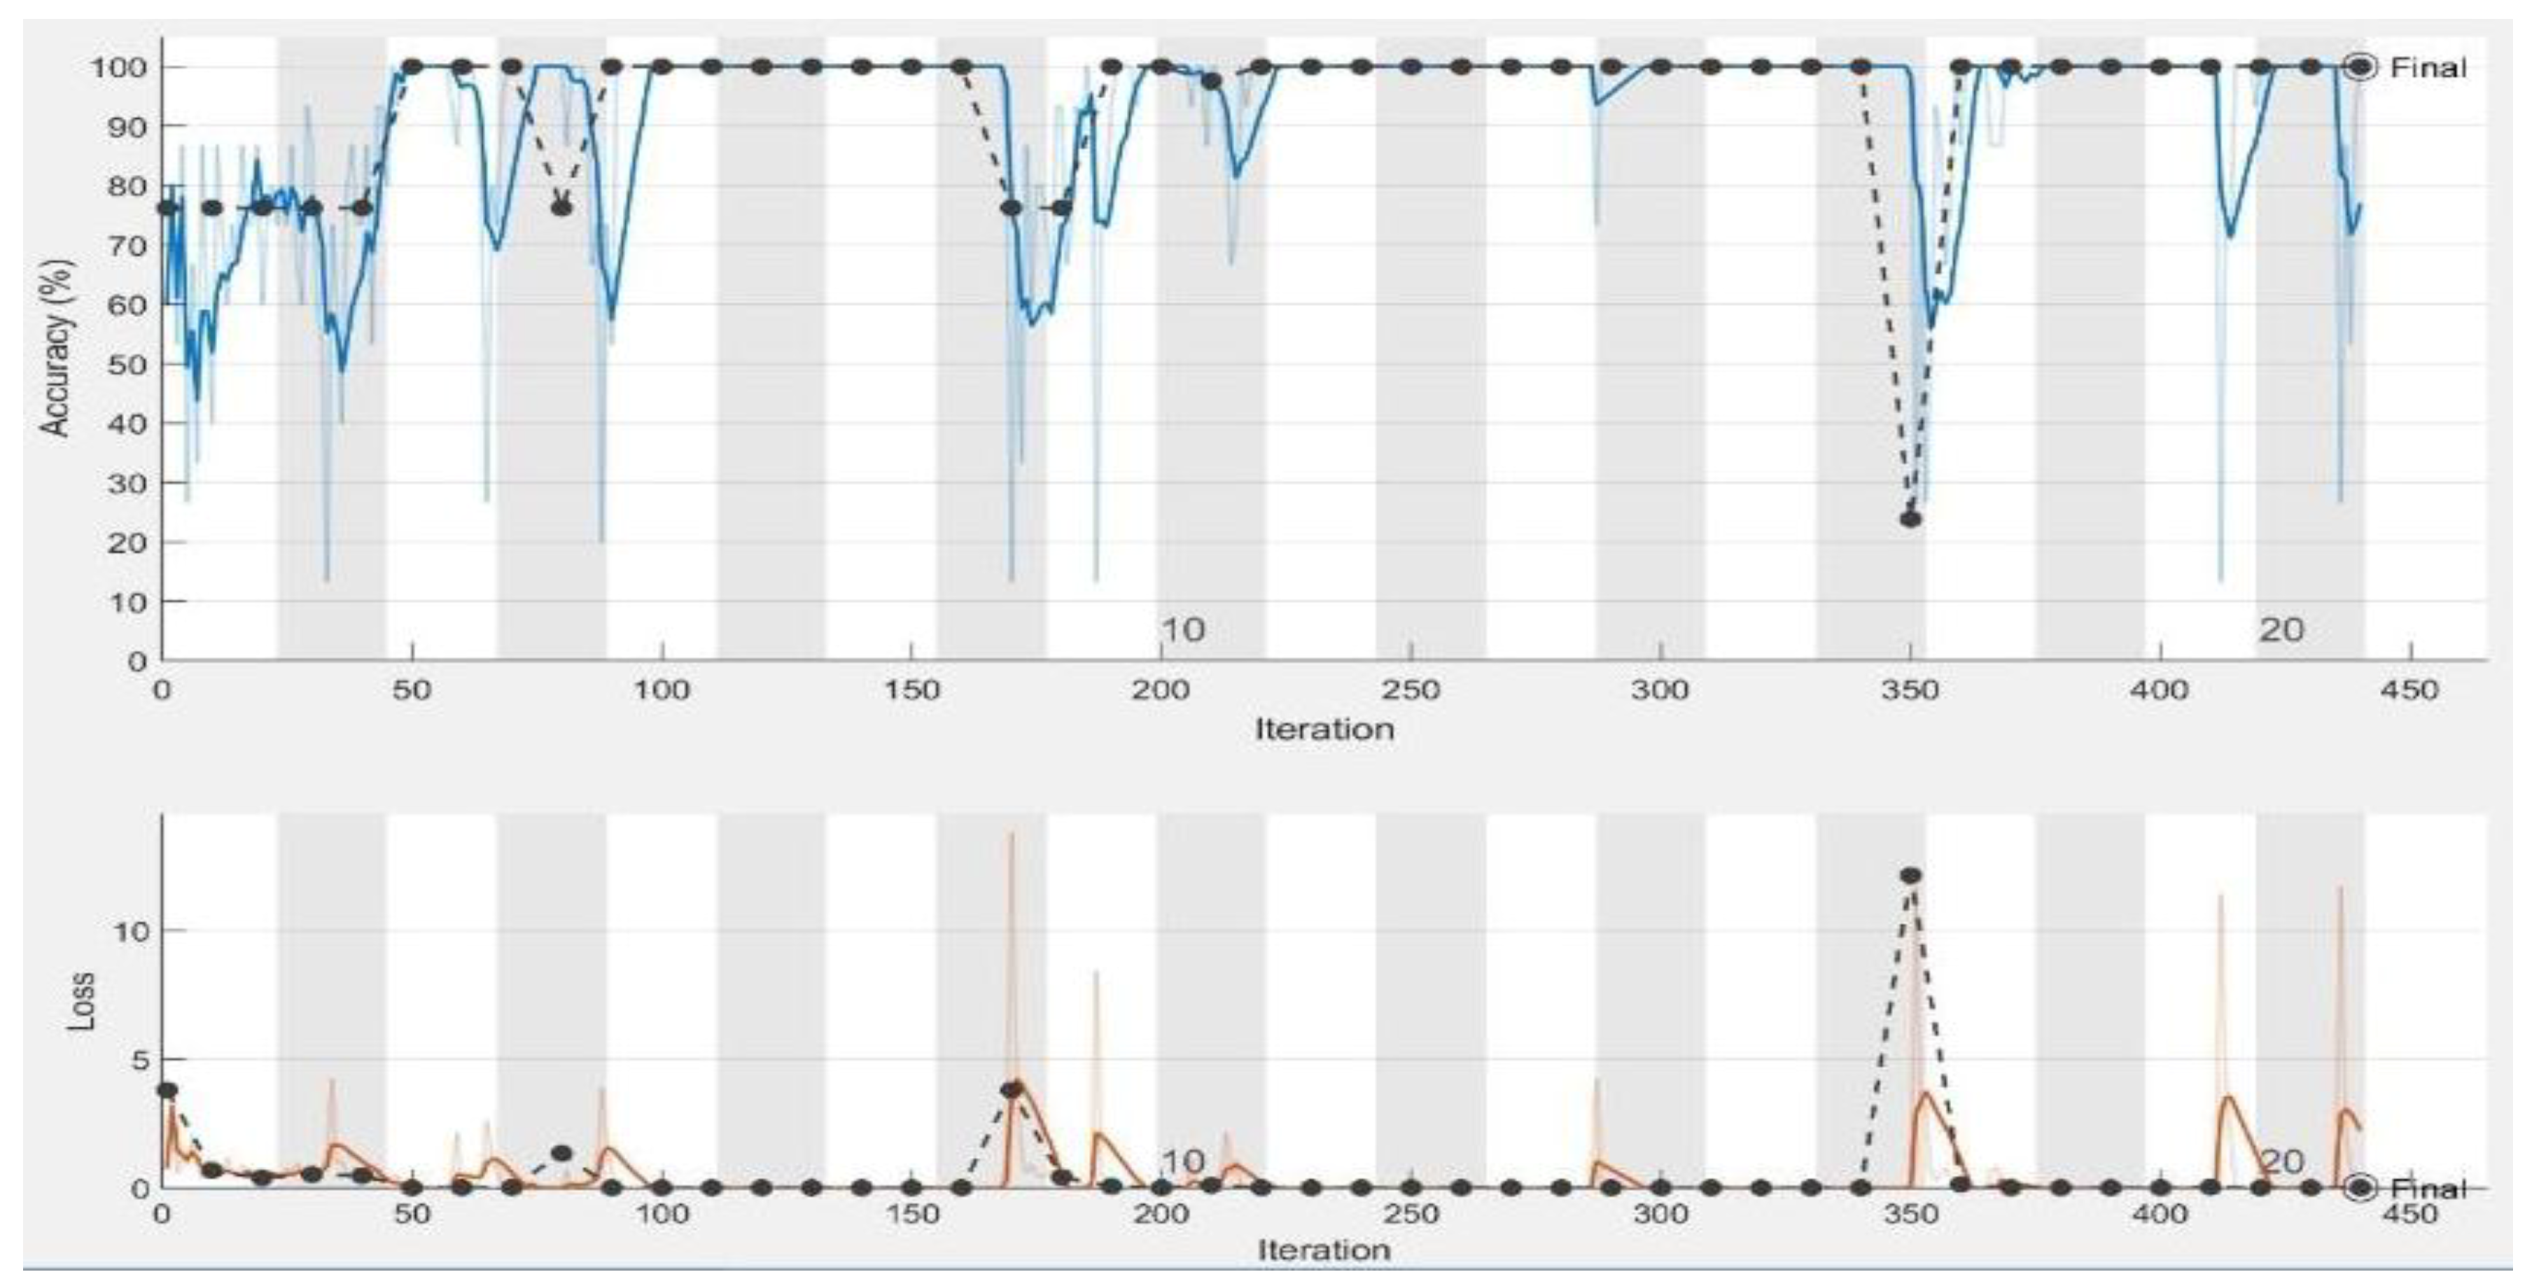
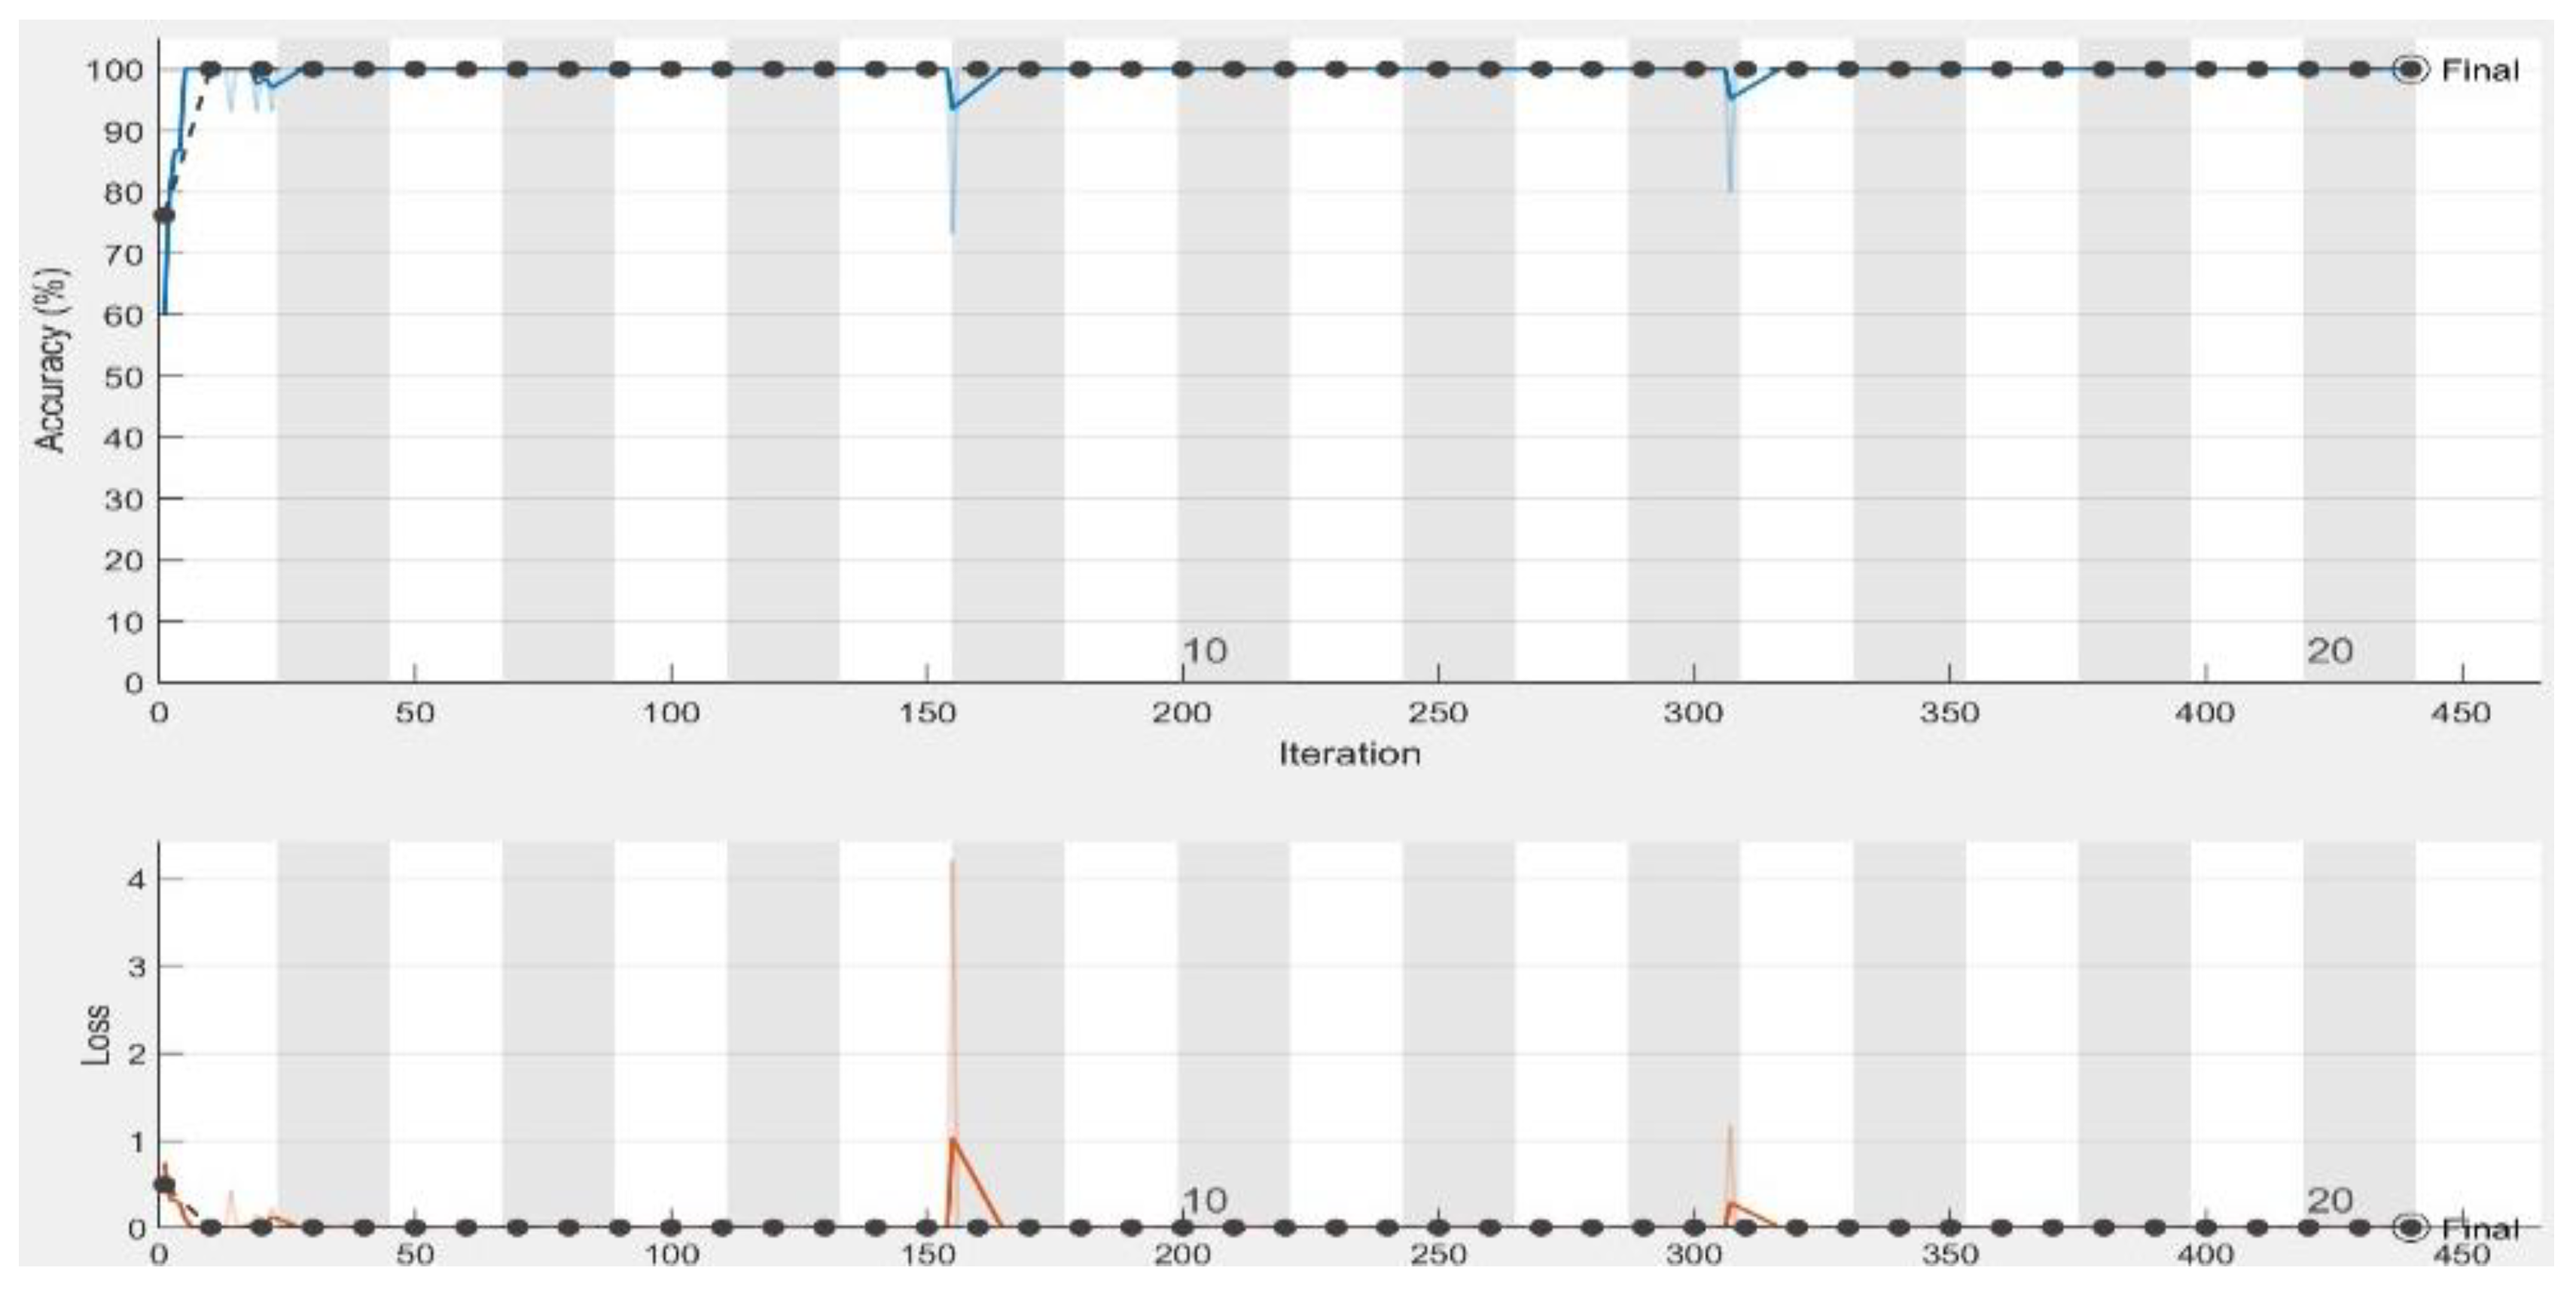
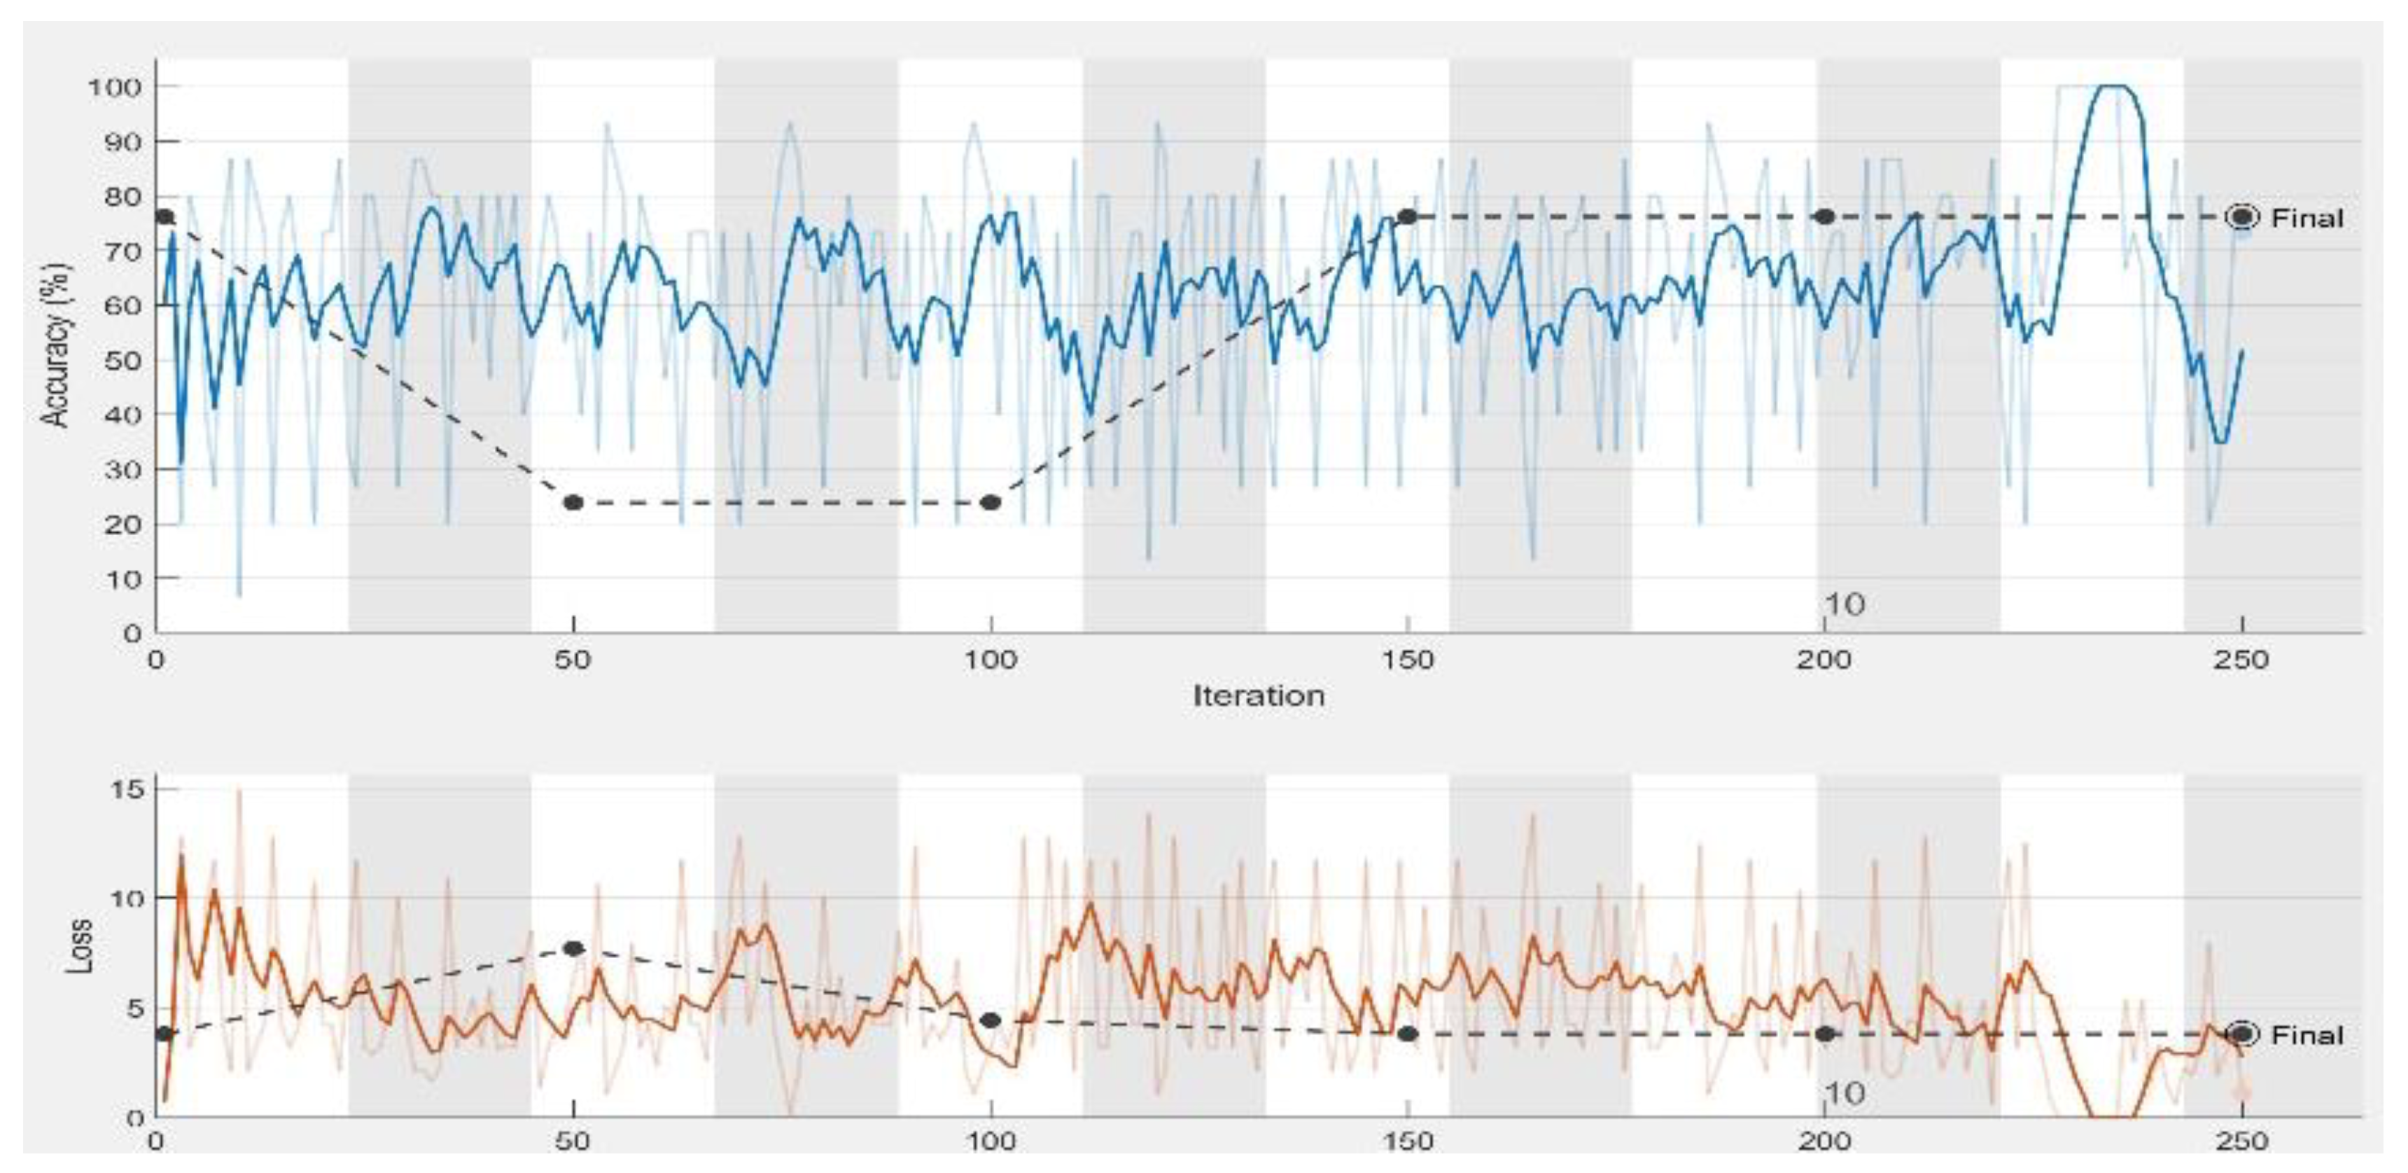
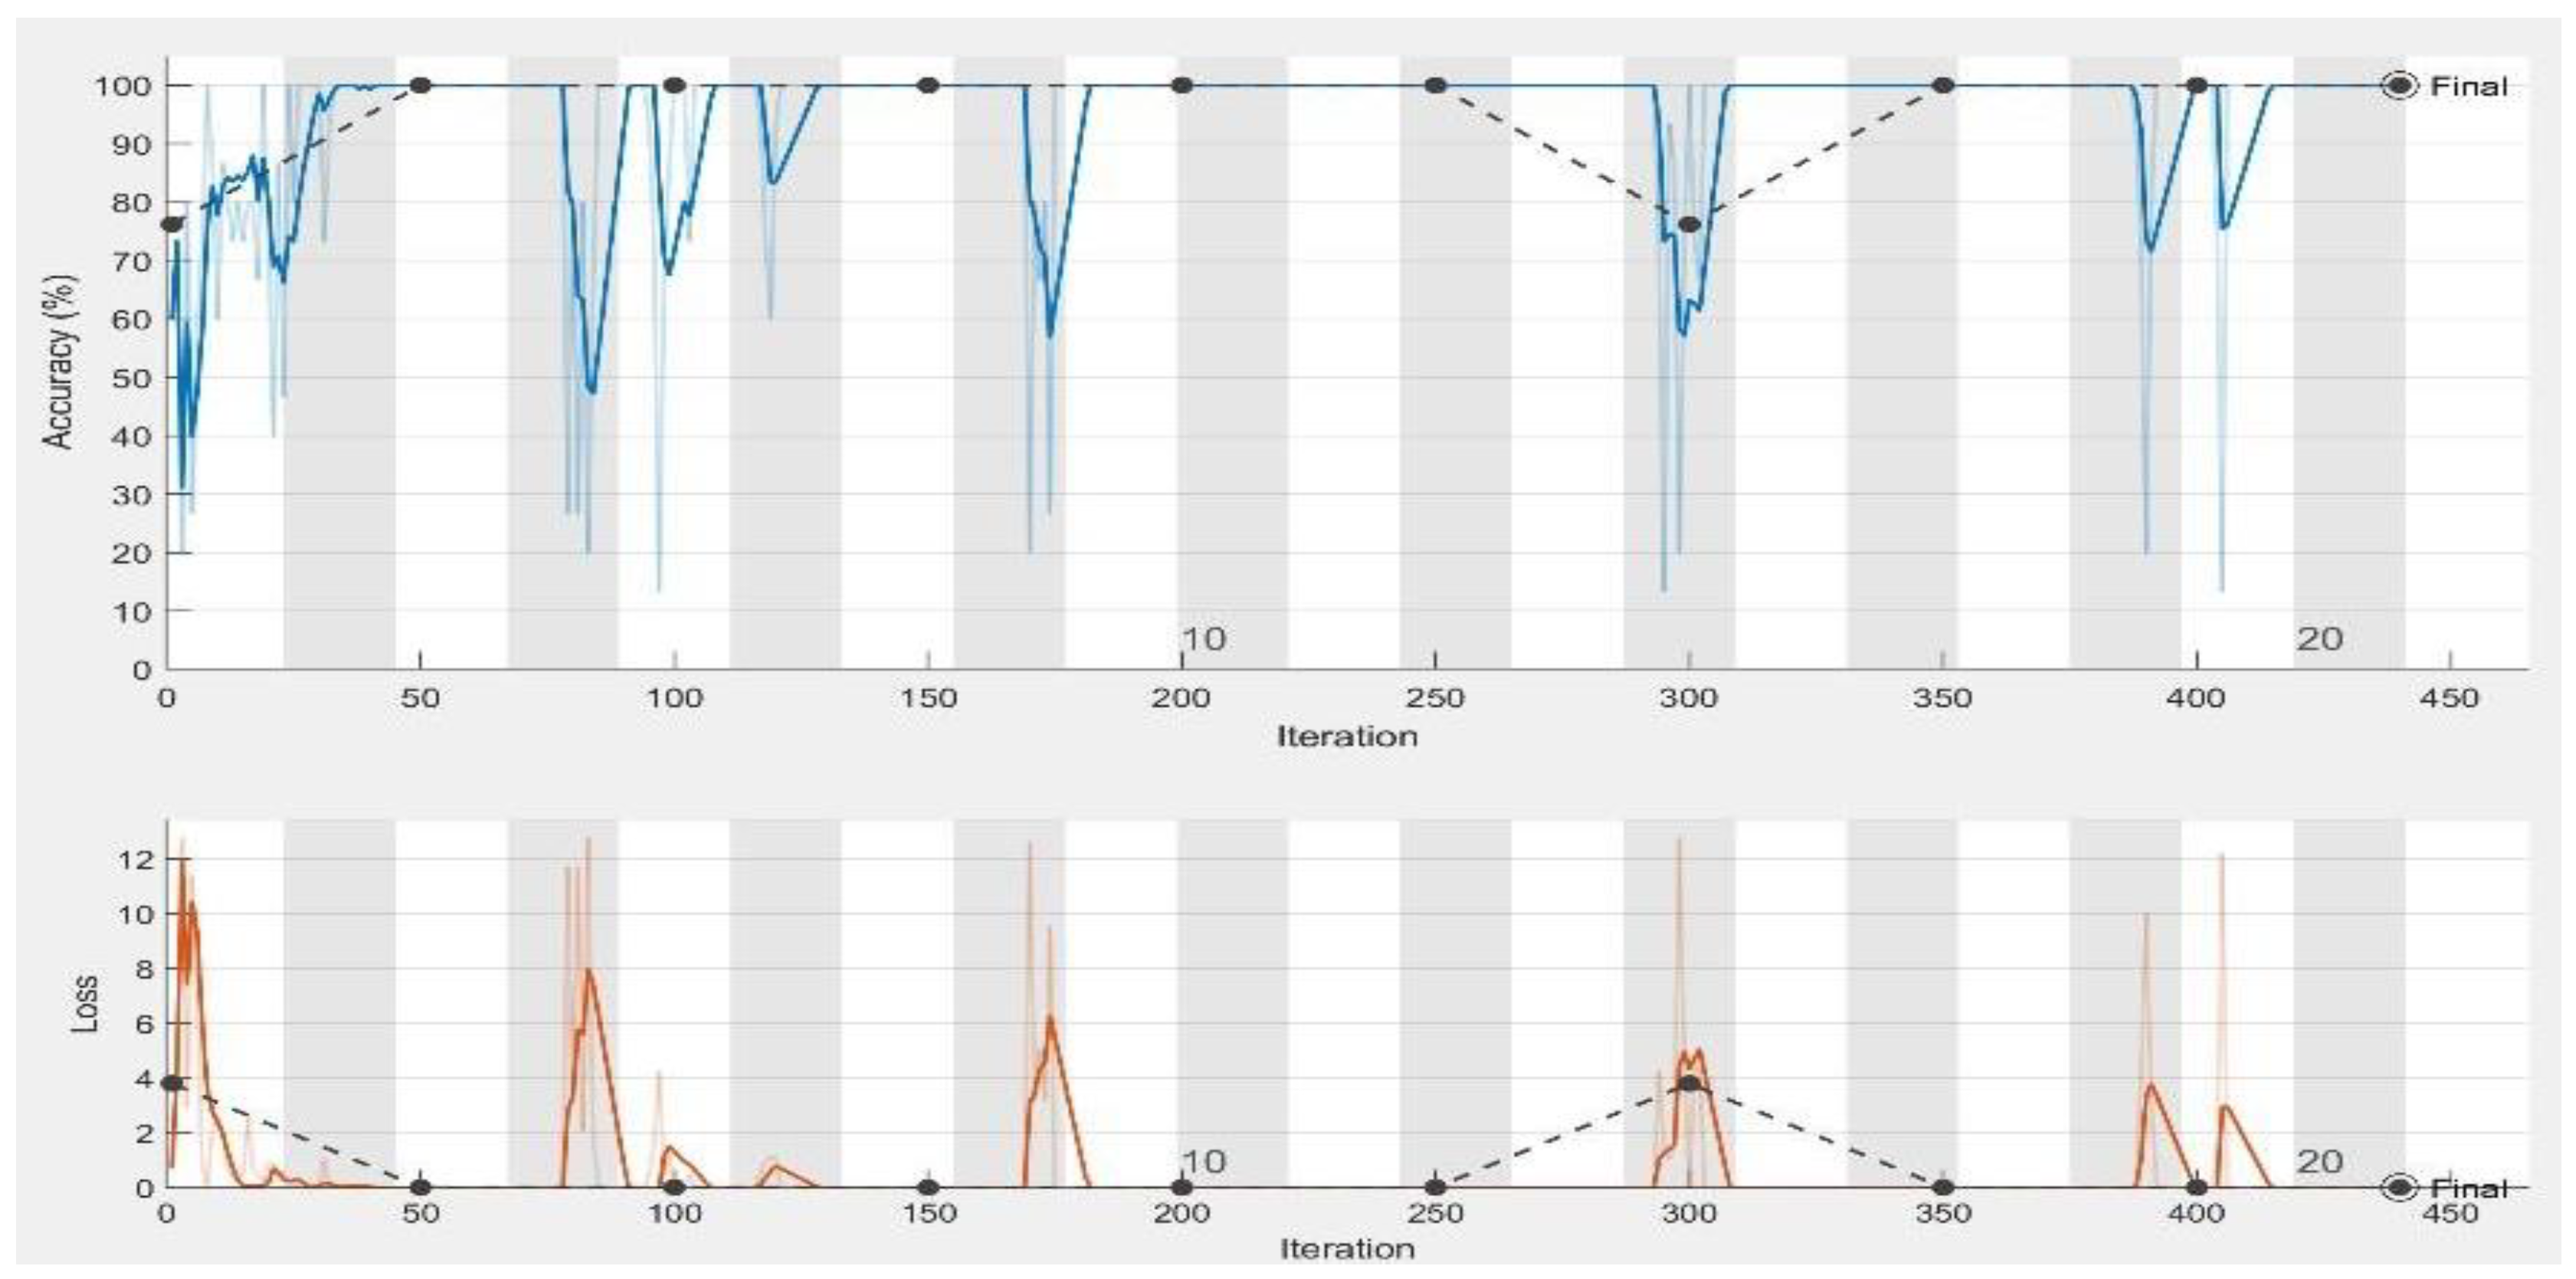
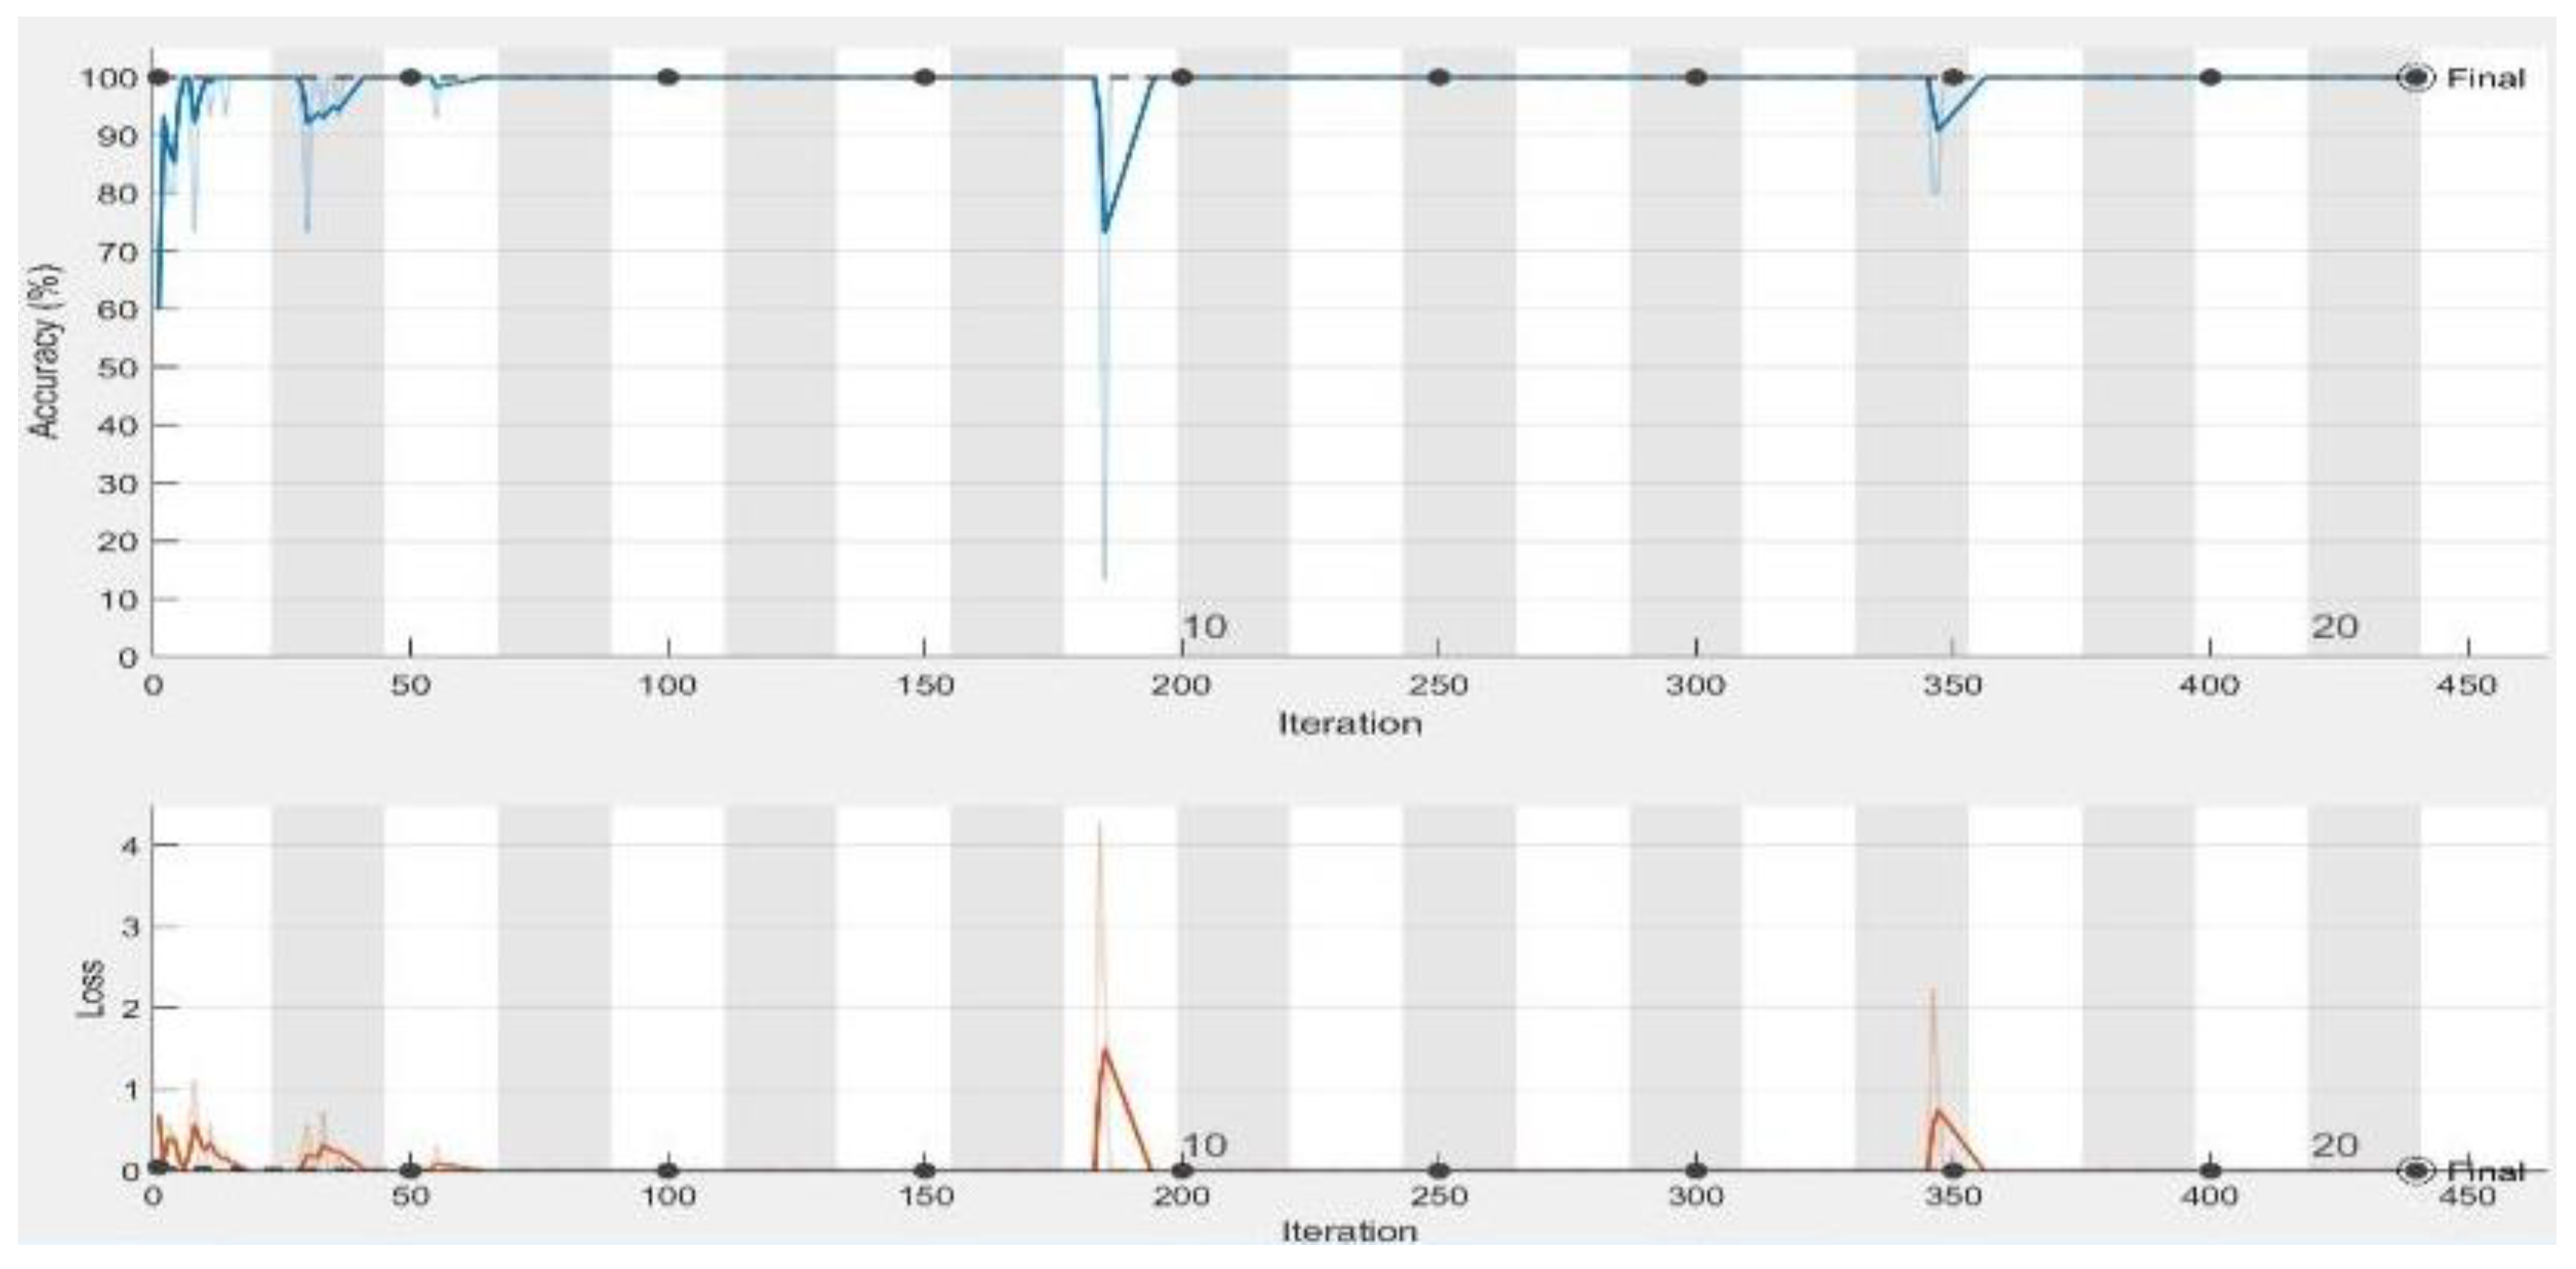
5.2. Results
6. Discussion
7. Conclusions
Author Contributions
Funding
Acknowledgments
Conflicts of Interest
References
- Cireşan, D.C.; Giusti, A.; Gambardella, L.M.; Schmidhuber, J. Mitosis Detection in Breast Cancer Histology Images with Deep Neural Networks. In Proceedings of the International Conference on Medical Image Computing and Computer-assisted Intervention, Nagoya, Japan, 22–26 September 2013; pp. 411–418. [Google Scholar]
- Deng, L.; Yu, D. Deep learning: Methods and applications. Found. Trends® Signal Process. 2014, 7, 197–387. [Google Scholar] [CrossRef]
- Dong, Y.; Jiang, Z.; Shen, H.; Pan, W.; Williams, L.; Reddy, V.; Benjamin, W.; Bryan, A. Evaluations of deep convolutional neural networks for automatic identification of malaria infected cells. In Proceedings of the IEEE EMBS International Conference on Biomedical & Health Informatics (BHI), Orlando, FL, USA, 16–19 February 2017; pp. 101–104. [Google Scholar]
- Esteva, A.; Kuprel, B.; Novoa, R.; Ko, J.; Swetter, S.; Blau, H.; Thrun, S. Dermatologist-level classification of skin cancer with deep neural networks. Nature 2017, 542, 115. [Google Scholar] [CrossRef] [PubMed]
- Hoo-Chang, S.; Holger, R.; Mingchen, G.; Le, L.; Ziyue, X.; Isabella, N.; Jianhua, Y.; Daniel, M.; Ronald, M.S. Deep convolutional neural networks for computer-aided detection: CNN architectures, dataset characteristics and transfer learning. IEEE Trans. Med. Imag. 2016, 35, 1285. [Google Scholar]
- Khan, S.; Yong, S.P. A Deep Learning Architecture for Classifying Medical Images of Anatomy Object. In Proceedings of the Asia-Pacific Signal and Information Processing Association Annual Summit and Conference (APSIPA ASC), Kuala Lumpur, Malayasia, 12–15 December 2017; pp. 1661–1668. [Google Scholar]
- Wolterink, J.M.; Leiner, T.; de Vos, B.; van Hamersvelt, R.W.; Viergever, M.A.; Išgum, I. Automatic coronary artery calcium scoring in cardiac CT angiography using paired convolutional neural networks. Med. Image Anal. 2016, 34, 123–136. [Google Scholar] [CrossRef] [PubMed]
- Litjens, G.; Kooi, T.; Bejnordi, B.E.; Setio, A.A.A.; Ciompi, F.; Ghafoorian, M.; Van Der Laak, J.A.; Van Ginneken, B.; Sánchez, C.I. A survey on deep learning in medical image analysis. Med. Image Anal. 2017, 42, 60–88. [Google Scholar] [CrossRef]
- Fan, S.; Xu, L.; Fan, Y.; Wei, K.; Li, L. Computer-aided detection of small intestinal ulcer and erosion in wireless capsule endoscopy images. Phys. Med. Biol 2018, 63, 165001. [Google Scholar] [CrossRef] [PubMed]
- Xu, Y.; Mo, T.; Qiwei, F.; Zhong, P.; Lai, M.; Chang, E. Deep Learning of Feature Representation with Multiple Instance Learning for Medical Image Analysis. In Proceedings of the IEEE International Conference on Acoustics, Speech and Signal Processing (ICASSP), Florence, Italy, 4–9 May 2014; pp. 1626–1630. [Google Scholar]
- Szegedy, C.; Liu, W.; Jia, Y.; Sermant, P.; Reed, S.; Anguelov, D.; Erhan, D.; Vanhoucke, V.; Rabinovich, A. Going Deeper with Convolutions. In Proceedings of the IEEE Conference on Computer Vision and Pattern Recognition (CVPR), Boston, MA, USA, 7–12 June 2015. [Google Scholar]
- Krizhevsky, A.; Sutskever, I.; Hinton, G. Image Net Classification with Deep Convolutional Neural Networks. In Proceedings of the Advances in neural information processing systems, Lake Tahoe, NV, USA, 3–6 December 2012; pp. 1097–1105. [Google Scholar]
- Yuan, Y.; Meng, M. Deep learning for polyp recognition in wireless capsule endoscopy images. Med. Phys. 2017, 44, 1379–1389. [Google Scholar] [CrossRef]
- Ronneberger, O.; Fischer, P.; Brox, T. U-Net: Convolutional Networks for Biomedical Image Segmentation. In Proceedings of the International Conference on Medical Image Computing and Computer-Assisted Intervention, Munich, Germany, 5–9 October 2015; pp. 234–241. [Google Scholar]
- Tajbakhsh, N.; Gurudu, S.R.; Liang, J. Automatic Polyp Detection in Colonoscopy Videos Using an Ensemble of Convolutional Neural Networks. In Proceedings of the IEEE 12th International Symposium on Biomedical Imaging (ISBI), New York, NY, USA, 16–19 April 2015; pp. 79–83. [Google Scholar]
- Linder, T.; Jigin, O. Organ Detection and Localization in Radiological Image Volumes. Master’s Thesis, Linköping University, Linköping, Sweden, 9 June 2017. [Google Scholar]
- Adler, D.G.; Gostout, C.J. Wireless capsule endoscopy. Hosp. Physician 2003, 39, 14–22. [Google Scholar]
- Fireman, Z.; Glukhovsky, A.; Jacob, H.; Lavy, A.; Lewkowicz, S.; Scapa, E. Wireless capsule endoscopy. IMAJ-RAMAT GAN 2002, 4, 717–719. [Google Scholar]
- Ojala, T.; Pietikäinen, M. Unsupervised texture segmentation using feature distributions. Pattern Recognit. 1999, 32, 477–486. [Google Scholar] [CrossRef]
- Gevers, T.; Smeulders, A.W. Color-based object recognition. Pattern Recognit. 1999, 32, 453–464. [Google Scholar] [CrossRef]
- Shafer, S.A. Using color to separate reflection components. Color Res. Appl. 1985, 10, 210–218. [Google Scholar] [CrossRef]
- Finlayson, G.D.; Hordley, S.D.; Tastl, I. Gamut constrained illuminant estimation. Int. J. Comput. Vis. 2006, 67, 93–109. [Google Scholar] [CrossRef]
- Liaqat, A.; Khan, M.A.; Shah, J.H.; Sharif, M.; Yasmin, M.; Fernandes, S.L. Automated ulcer and bleeding classification from WCE images using multiple features fusion and selection. J. Mech. Med. Biol. 2018, 1850038. [Google Scholar] [CrossRef]
- Li, B.; Meng, M. Texture analysis for ulcer detection in capsule endoscopy images. Image Vis. Comput. 2009, 27, 1336–1342. [Google Scholar] [CrossRef]
- Charfi, S.; El Ansari, M. Computer-aided diagnosis system for colon abnormalities detection in wireless capsule endoscopy images. Multimed. Tools Appl. 2018, 77, 4047–4064. [Google Scholar] [CrossRef]
- Li, B.; Meng, M. Ulcer Recognition in Capsule Endoscopy Images by Texture Features. In Proceedings of the 7th World Congress on Intelligent Control and Automation, WCICA, Chongqing, China, 25–27 June 2008; pp. 234–239. [Google Scholar]
- Souaidi, M.; Abdelouahed, A.; El Ansari, M. Multi-scale completed local binary patterns for ulcer detection in wireless capsule endoscopy images. Multimed. Tools Appl. 2018, 1–18. [Google Scholar] [CrossRef]
- Szczypiński, P.; Klepaczko, A.; Pazurek, M.; Daniel, P. Texture and color based image segmentation and pathology detection in capsule endoscopy videos. Comput. Methods Programs Biomed. 2014, 113, 396–411. [Google Scholar] [CrossRef]
- Wang, C.; Luo, Z.; Liu, X.; Bai, J.; Liao, G. Detection of Protruding Lesion in Wireless Capsule Endoscopy Videos of Small Intestine. In Proceedings of the SPIE Medical Imaging; Medical Imaging 2018: Computer-Aided Diagnosis, Houston, TX, USA, 10–15 February 2018; Volume 10575, p. 1057513. [Google Scholar]
- Bchir, O.; Ismail, M.; AL_Aseem, N. Empirical comparison of visual descriptors for ulcer recognition in wireless capsule endoscopy video. Comput. Sci. Inf. Technol. 2018, 1. [Google Scholar] [CrossRef]
- Georgakopoulos, S.V.; Iakovidis, D.; Vasilakakis, M.; Plagianakos, V.P.; Koulaouzidis, A. Weakly-Supervised Convolutional Learning for Detection of Inflammatory Gastrointestinal Lesions. In Proceedings of the IEEE International Conference on Imaging Systems and Techniques (IST), Chania, Crete Island, Greece, 4–6 October 2016; pp. 510–514. [Google Scholar]
- Jia, X.; Meng, M. A Deep Convolutional Neural Network for Bleeding Detection in Wireless Capsule Endoscopy Images. In Proceedings of the IEEE 38th Annual International Conference on the Engineering in Medicine and Biology Society (EMBC), Orlando, FL, USA, 16–20 August 2016; pp. 639–642. [Google Scholar]
- Wimmer, G.; Hegenbart, S.; Vécsei, A.; Uhl, A. Convolutional Neural Network Architectures for the Automated Diagnosis of Celiac Disease. In Proceedings of the International Workshop on Computer-Assisted and Robotic Endoscopy, Munich, Germany, 5 October 2016; pp. 104–113. [Google Scholar]
- Seguí, S.; Drozdzal, M.; Pascual, G.; Radeva, P.; Malagelada, C.; Azpiroz, F.; Vitria, J. Generic feature learning for wireless capsule endoscopy analysis. Comput. Biol. Med. 2016, 79, 163–172. [Google Scholar] [CrossRef]
- Pei, M.; Wu, X.; Guo, Y.; Fujita, H. Small bowel motility assessment based on fully convolutional networks and long short-term memory. Knowl. Based Syst. 2017, 121, 163–172. [Google Scholar] [CrossRef]
- Yuan, Y.; Wang, J.; Li, B.; Meng, M. Saliency based ulcer detection for wireless capsule endoscopy diagnosis. IEEE Trans. Med. Imaging 2015, 34, 2046–2057. [Google Scholar] [CrossRef]
- Yeh, J.-Y.; Wu, T.-H.; Tsai, W.-J. Bleeding and ulcer detection using wireless capsule endoscopy images. J. Softw. Eng. Appl. 2014, 7, 422–432. [Google Scholar] [CrossRef]
- Nawarathna, R.; Oh, J.H.; Muthukudage, J.; Tavanapong, W.; Wong, J.; de Groen, P.C.; Tang, S.J. Abnormal image detection in endoscopy videos using a filter bank and local binary patterns. Neurocomputing 2014, 144, 70–90. [Google Scholar] [CrossRef]
- Goodfellow, I.; Bengio, Y.; Courville, A. Deep Learning; MIT Press: Cambridge, MA, USA, 2016. [Google Scholar]
- Cheng, P.M.; Malhi, H.S. Transfer learning with convolutional neural networks for classification of abdominal ultrasound images. J. Digit. Imaging 2017, 30, 234–243. [Google Scholar] [CrossRef]
- Tajbakhsh, N.; Shin, J.; Gurudu, S.; Hurst, R.; Kendall, C.; Gotway, M.; Liang, J. Convolutional neural networks for medical image analysis: Full training or fine tuning? IEEE Trans. Med. Imag. 2016, 35, 1299–1312. [Google Scholar] [CrossRef]
- Yosinski, J.; Clune, J.; Bengio, Y.; Lipson, H. How Transferable are Features in Deep Neural Networks. In Advances in Neural Information Processing Systems; MIT Press: Cambridge, MA, USA, 2014; pp. 3320–3328. [Google Scholar]
- Khan, S.A.; Yong, S.P. An Evaluation of Convolutional Neural Nets for Medical Image Anatomy Classification. In Advances in Machine Learning and Signal Processing; Springer: Berlin, Germany, 2016; pp. 293–303. [Google Scholar]
- Sugimori, H. Classification of computed tomography images in different slice positions using deep learning. J. Healthc. Eng. 2018, 2018. [Google Scholar] [CrossRef]
- Alaskar, H. Deep learning of EMG time frequency representations for identifying normal and aggressive action. IJCSNS Int. J. Comput. Sci. Netw. Secur. 2018, 18. [Google Scholar] [CrossRef]
- Alaskar, H. Deep learning-based model architecture for time-frequency images analysis. Int. J. Adv. Comput. Sci. Appl. 2018, 9. [Google Scholar] [CrossRef]
- Dr Khoroo’s Medical Clinic/Trust. Available online: http://www.drkhuroo.in/# (accessed on 6 September 2016).
- Iakovidis, D.K.; Koulaouzidis, A. Automatic lesion detection in capsule endoscopy based on color saliency: Closer to an essential adjunct for reviewing software. Gastrointest. Endosc. 2014, 80, 877–883. [Google Scholar] [CrossRef]
- Vasilakakis, M.D.; Iakovidis, D.K.; Spyrou, E.; Koulaouzidis, A. DINOSARC: Color features based on selective aggregation of chromatic image components for wireless capsule endoscopy. Comput. Math. Methods Med. 2018, 2018. [Google Scholar] [CrossRef]
- Souaidi, M.; Abdelouahad, A.A.; El Ansari, M. A Fully Automated Ulcer Detection System for Wireless Capsule Endoscopy Images. In Proceedings of the International Conference on Advanced Technologies for Signal and Image Processing (ATSIP), Sousse, Tunisia, 21–24 March 2017; pp. 1–6. [Google Scholar]


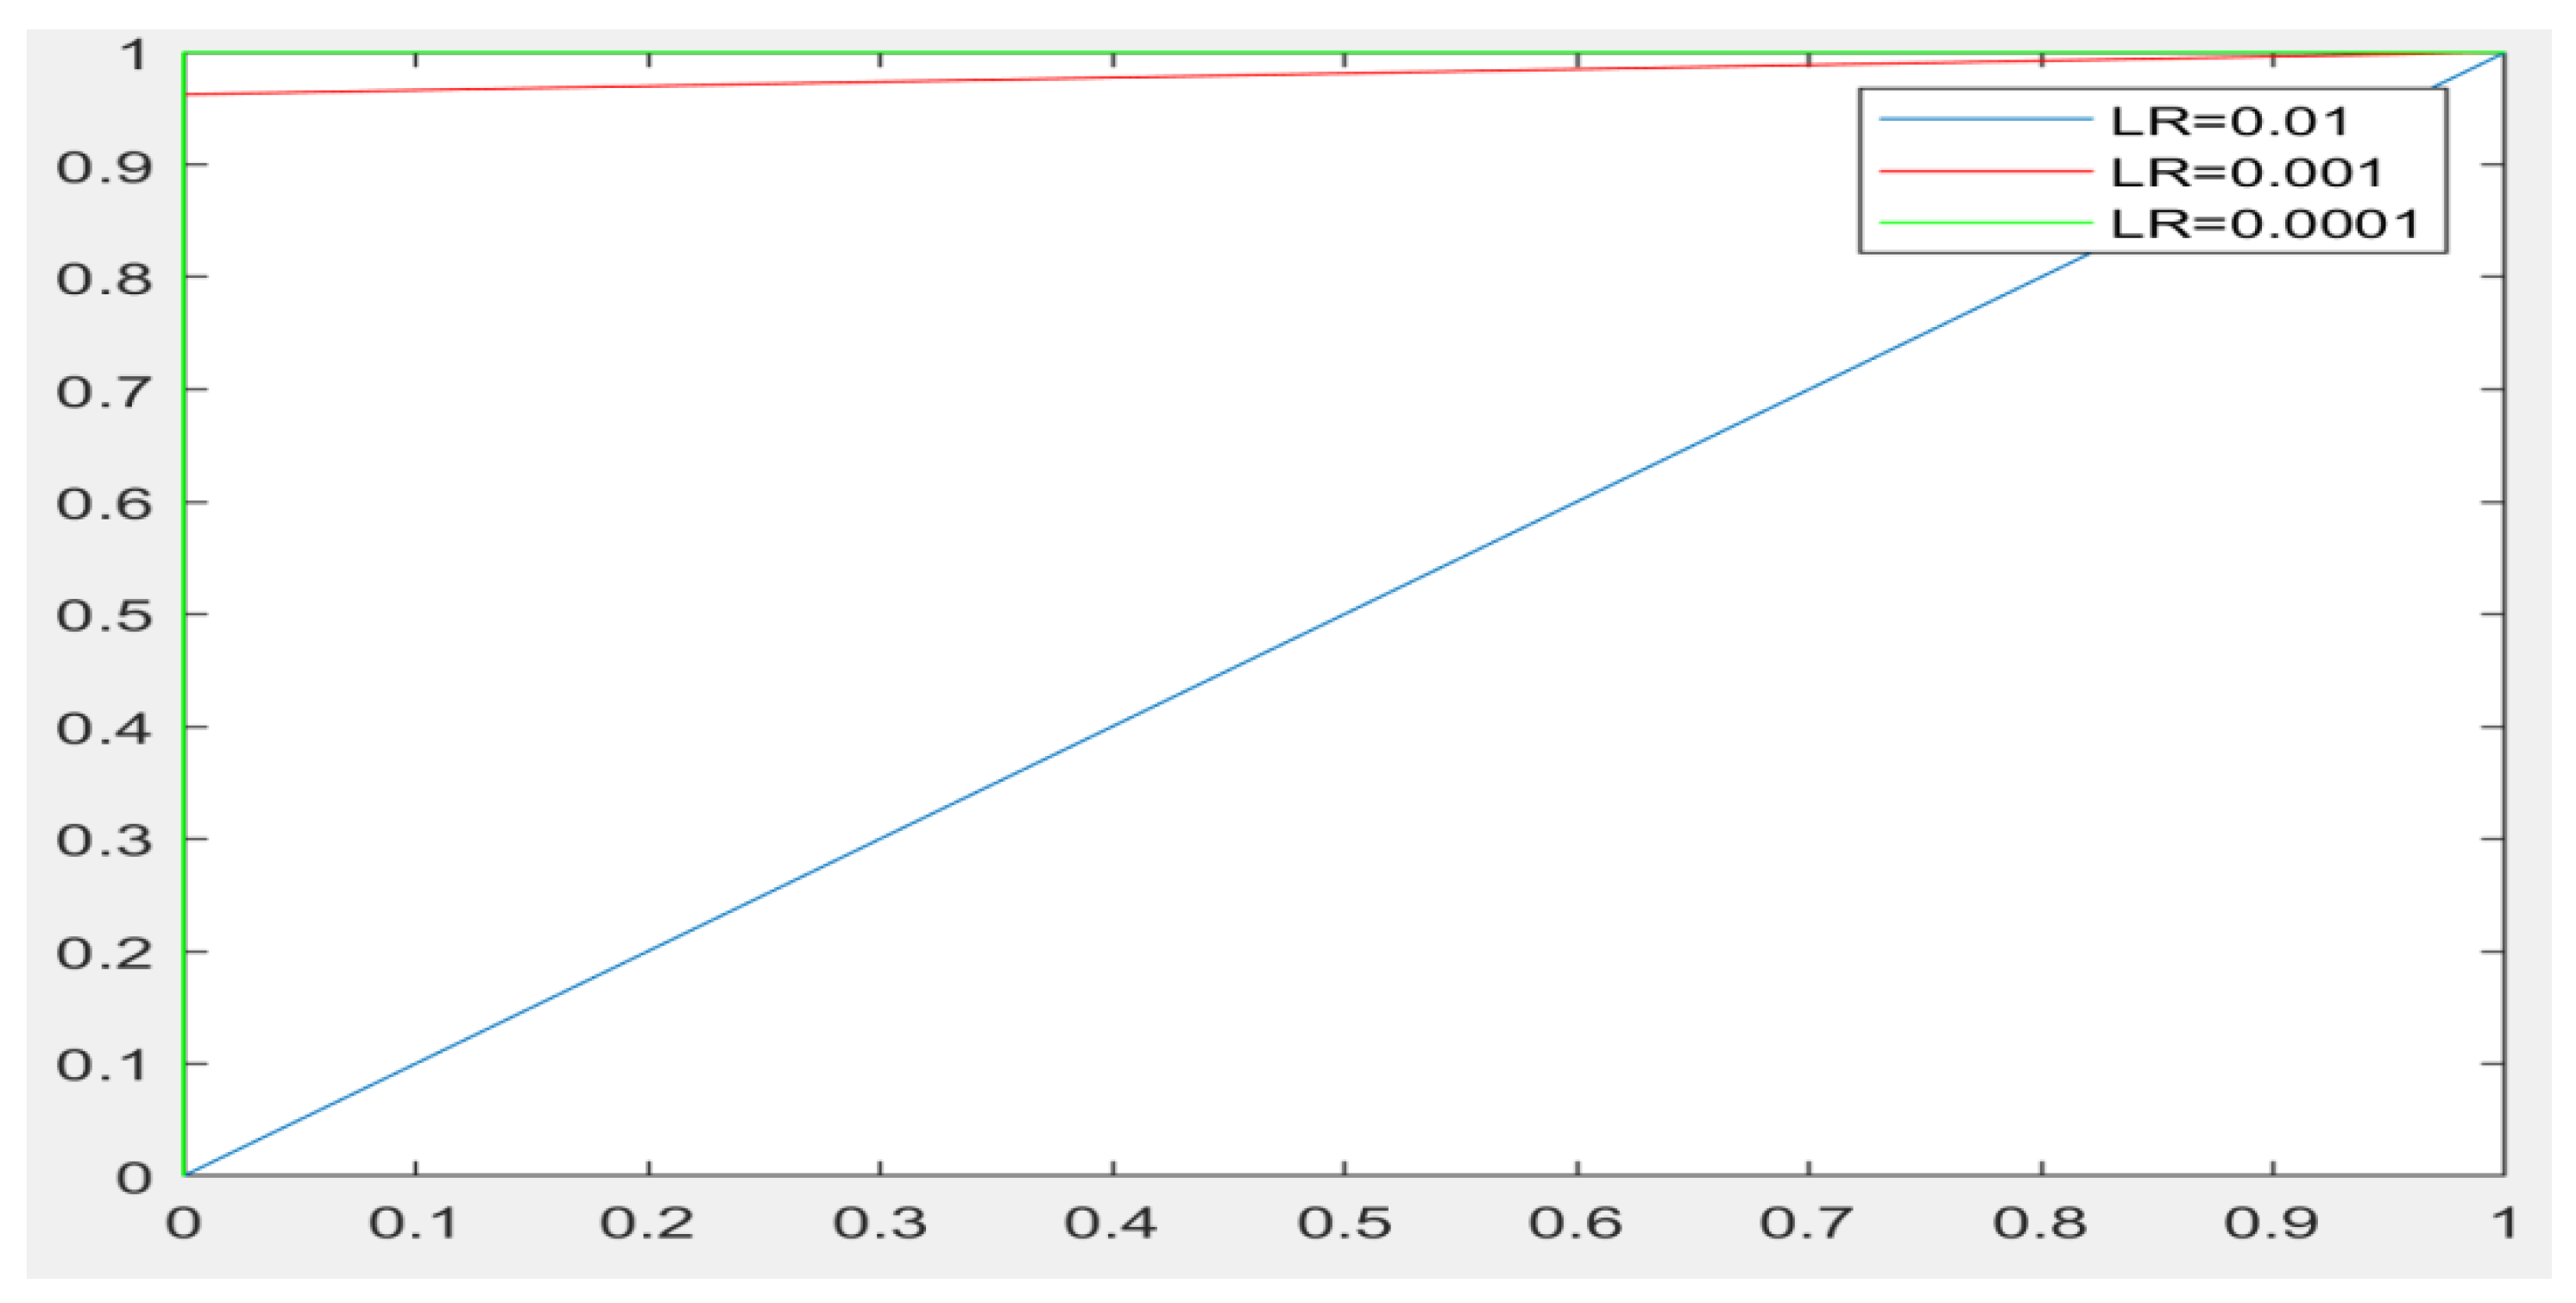
| Performance Measurements | LR = 0.0001 | LR = 0.001 | LR = 0.01 | |||
|---|---|---|---|---|---|---|
| Training Set | Testing Set | Training Set | Testing Set | Training Set | Testing Set | |
| Accuracy | 100% | 100% | 100% | 97.143% | 73.33% | 76.19% |
| Loss | 1.0093 × 10⁻⁶ | 8.6569 × 10⁻⁸ | 0.0298 | 0.001 | 2.7444 | 2.1683 |
| Sensitivity | 1 | 1 | 1 | 1 | 0.73 | 0.76 |
| Specificity | 1 | 1 | 1 | 1 | 0 | 0 |
| AUC | 1 | 1 | 1 | 0.9864 | 0.50 | 0.50 |
| Performance Measurements | LR = 0.0001 | LR = 0.001 | LR = 0.01 | |||
|---|---|---|---|---|---|---|
| Training Set | Testing Set | Training Set | Testing Set | Training Set | Testing Set | |
| Accuracy | 100% | 100% | 100% | 100% | 73.33% | 76.19% |
| Loss | 3.9736 × 10⁻⁸ | 3.1221 × 10⁻⁸ | 3.9736 × 10⁻⁸ | 8.5150 × 10⁻⁸ | 1.0933 | 3.7958 |
| Sensitivity | 1 | 1 | 1 | 1 | 0.73 | 0.76 |
| Specificity | 1 | 1 | 1 | 1 | 0 | 0 |
| AUC | 1 | 1 | 1 | 1 | 0.50 | 0.50 |
| Learning Rate | LR = 0.0001 | LR = 0.001 | LR = 0.01 |
|---|---|---|---|
| AlexNet | 18:37 | 14 | 08:09 |
| GoogleNet | 37:41 | 35:22 | 33:21 |
| References | Data Type | Classifiers | Result |
|---|---|---|---|
| [31] | Ulcer images | SVM | 96% sensitivity |
| [35] | Small bowel | CNN | The accuracy is 96% |
| [10] | Ulcer images | AlexNet | 96% sensitivity |
| [33] | Bleeding images | CNN | 99% in F measure |
| [32] | Inflammatory gastrointestinal disease | CNN with SVM | The accuracy is 90% |
| [14] | Polyps images | SSAEIM | The accuracy is 98% |
| [50] | Ulcer images | SVM | 97.68% sensitivity |
| [24] | Ulcer, bleeding images | SVM | 98% sensitivity |
| Performance Measurements | CIE_lab Color Histogram | Local Binary Pattern | Color Coherence Vector | |||
|---|---|---|---|---|---|---|
| Training Set | Testing Set | Training Set | Testing Set | Training Set | Testing Set | |
| Accuracy | 83.7% | 85% | 85.199.6% | 85% | 77.3%% | 76.5% |
| Loss | 0.1530 | 0.1495 | 0.1467 | 0.1469 | 0.3115 | 0.3267 |
| Sensitivity | 97.5% | 98.9% | 99.1% | 98.9% | 90% | 89.1% |
| Specificity | 0% | 0% | 0% | 0% | 0% | 0% |
| AUC | 33.68% | 34.67% | 36.45% | 32.85% | 60.41% | 59.96% |
© 2019 by the authors. Licensee MDPI, Basel, Switzerland. This article is an open access article distributed under the terms and conditions of the Creative Commons Attribution (CC BY) license (http://creativecommons.org/licenses/by/4.0/).
Share and Cite
Alaskar, H.; Hussain, A.; Al-Aseem, N.; Liatsis, P.; Al-Jumeily, D. Application of Convolutional Neural Networks for Automated Ulcer Detection in Wireless Capsule Endoscopy Images. Sensors 2019, 19, 1265. https://doi.org/10.3390/s19061265
Alaskar H, Hussain A, Al-Aseem N, Liatsis P, Al-Jumeily D. Application of Convolutional Neural Networks for Automated Ulcer Detection in Wireless Capsule Endoscopy Images. Sensors. 2019; 19(6):1265. https://doi.org/10.3390/s19061265
Chicago/Turabian StyleAlaskar, Haya, Abir Hussain, Nourah Al-Aseem, Panos Liatsis, and Dhiya Al-Jumeily. 2019. "Application of Convolutional Neural Networks for Automated Ulcer Detection in Wireless Capsule Endoscopy Images" Sensors 19, no. 6: 1265. https://doi.org/10.3390/s19061265
APA StyleAlaskar, H., Hussain, A., Al-Aseem, N., Liatsis, P., & Al-Jumeily, D. (2019). Application of Convolutional Neural Networks for Automated Ulcer Detection in Wireless Capsule Endoscopy Images. Sensors, 19(6), 1265. https://doi.org/10.3390/s19061265