Estimation of Temporal Gait Parameters Using a Human Body Electrostatic Sensing-Based Method

Abstract
1. Introduction
2. Method
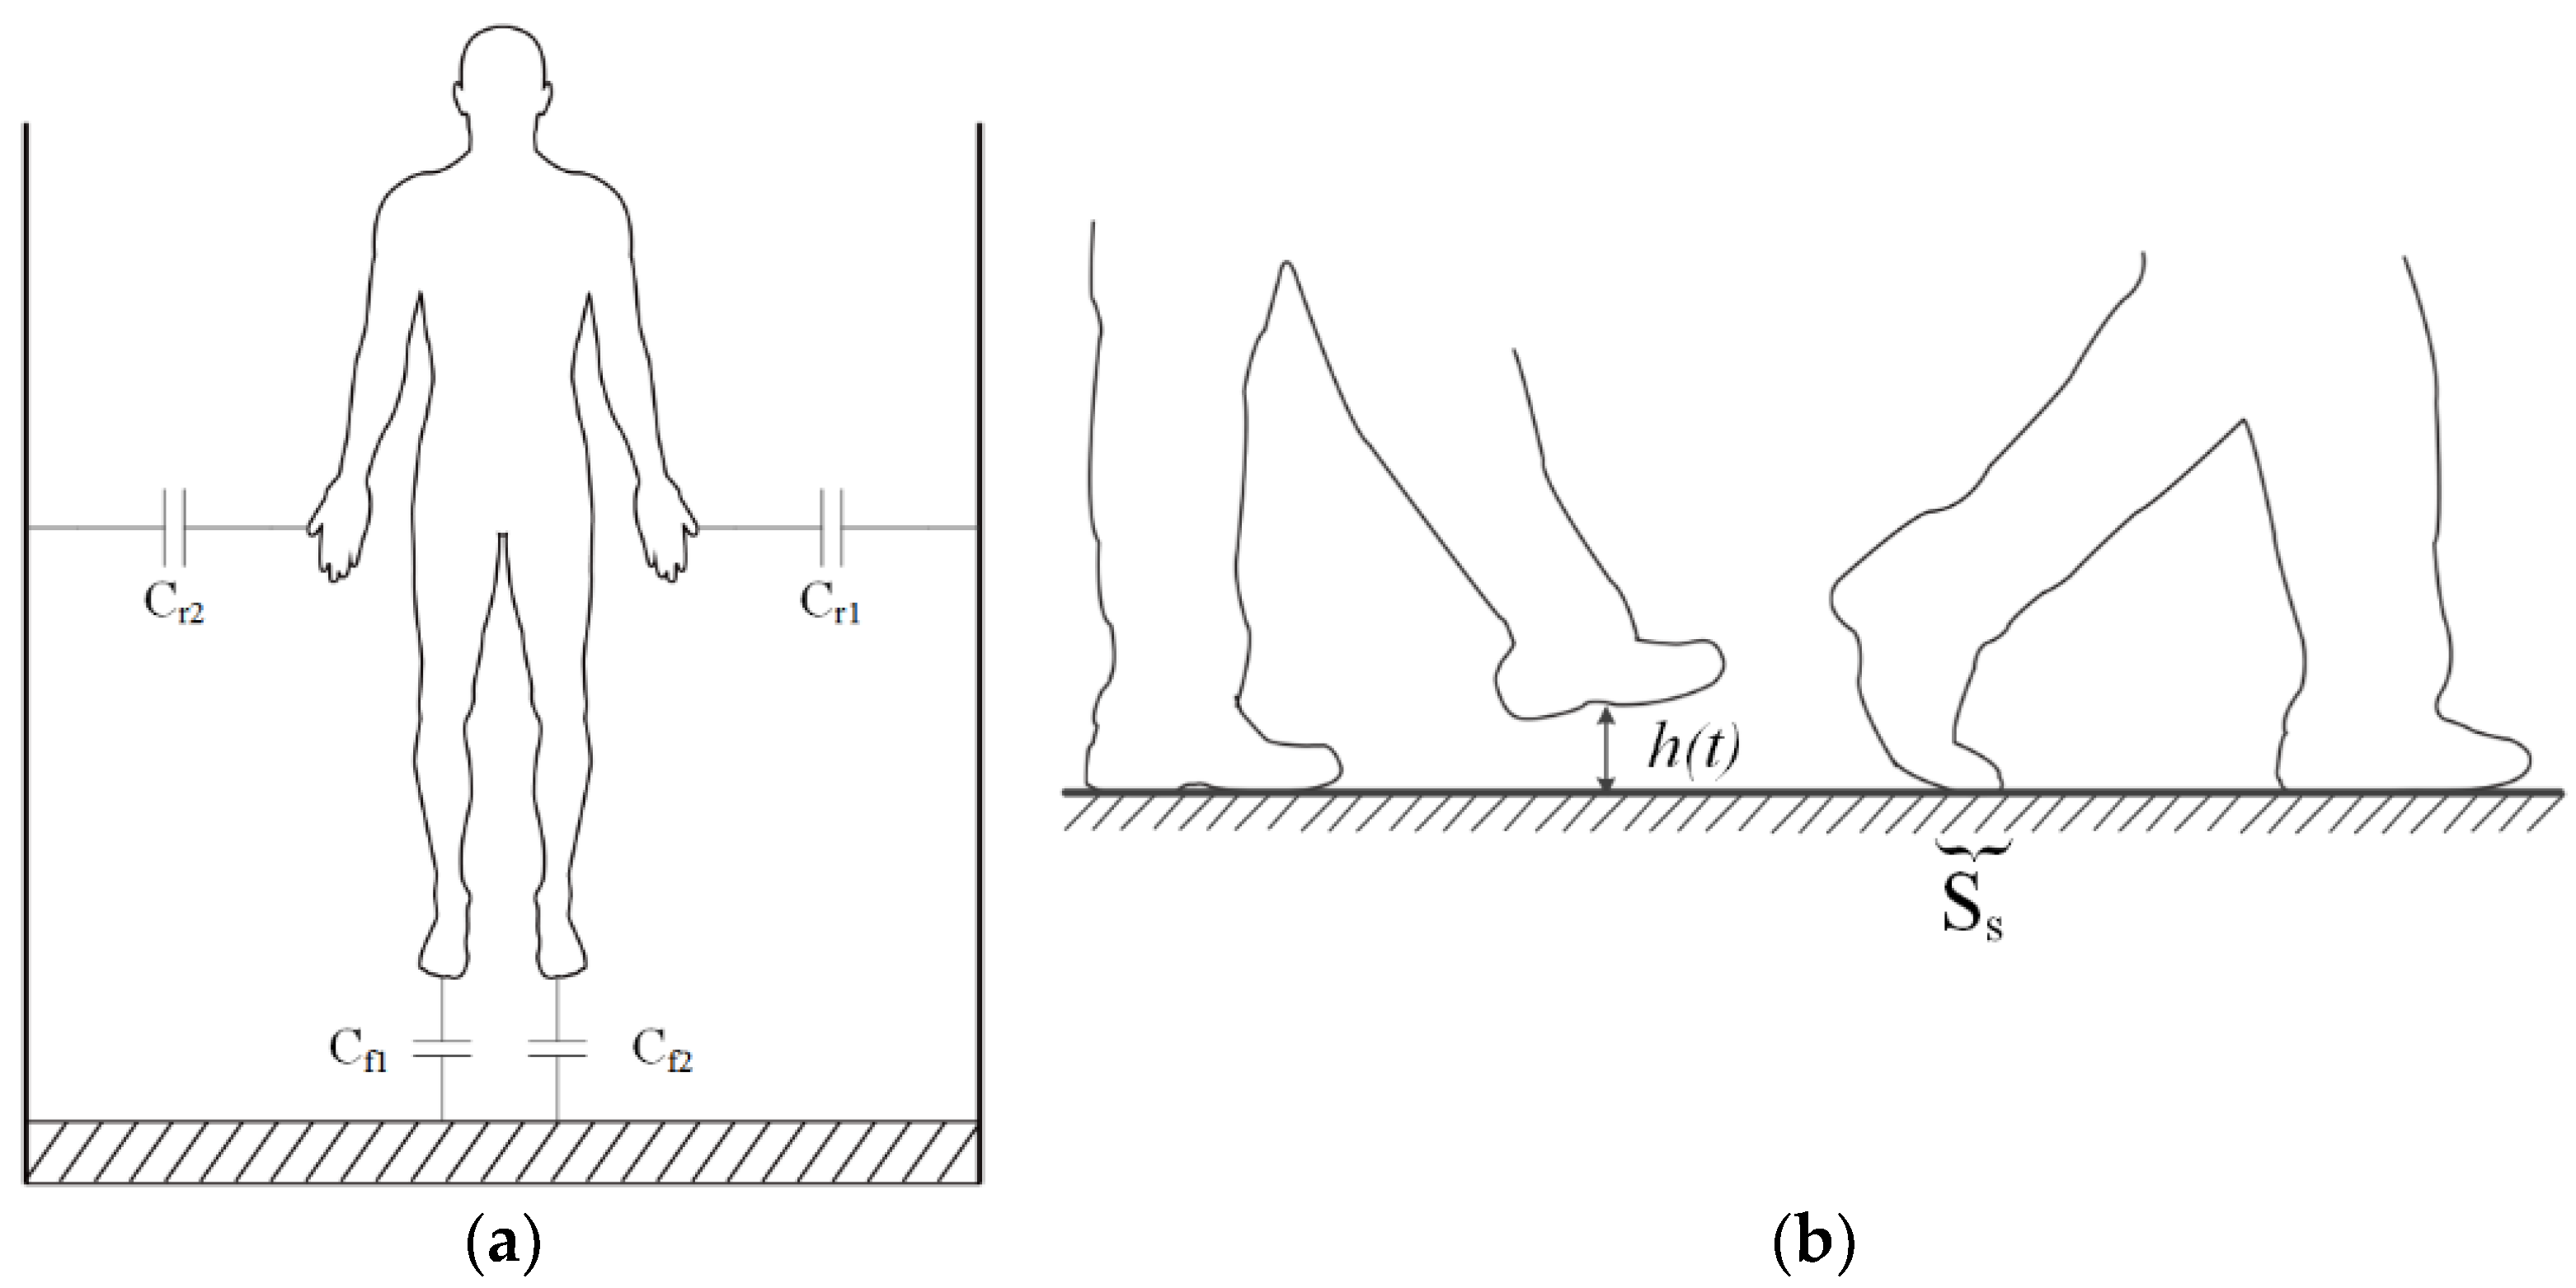
2.1. Principle of Electrostatic Field Sensing
2.2. Instrumentation and Configurations
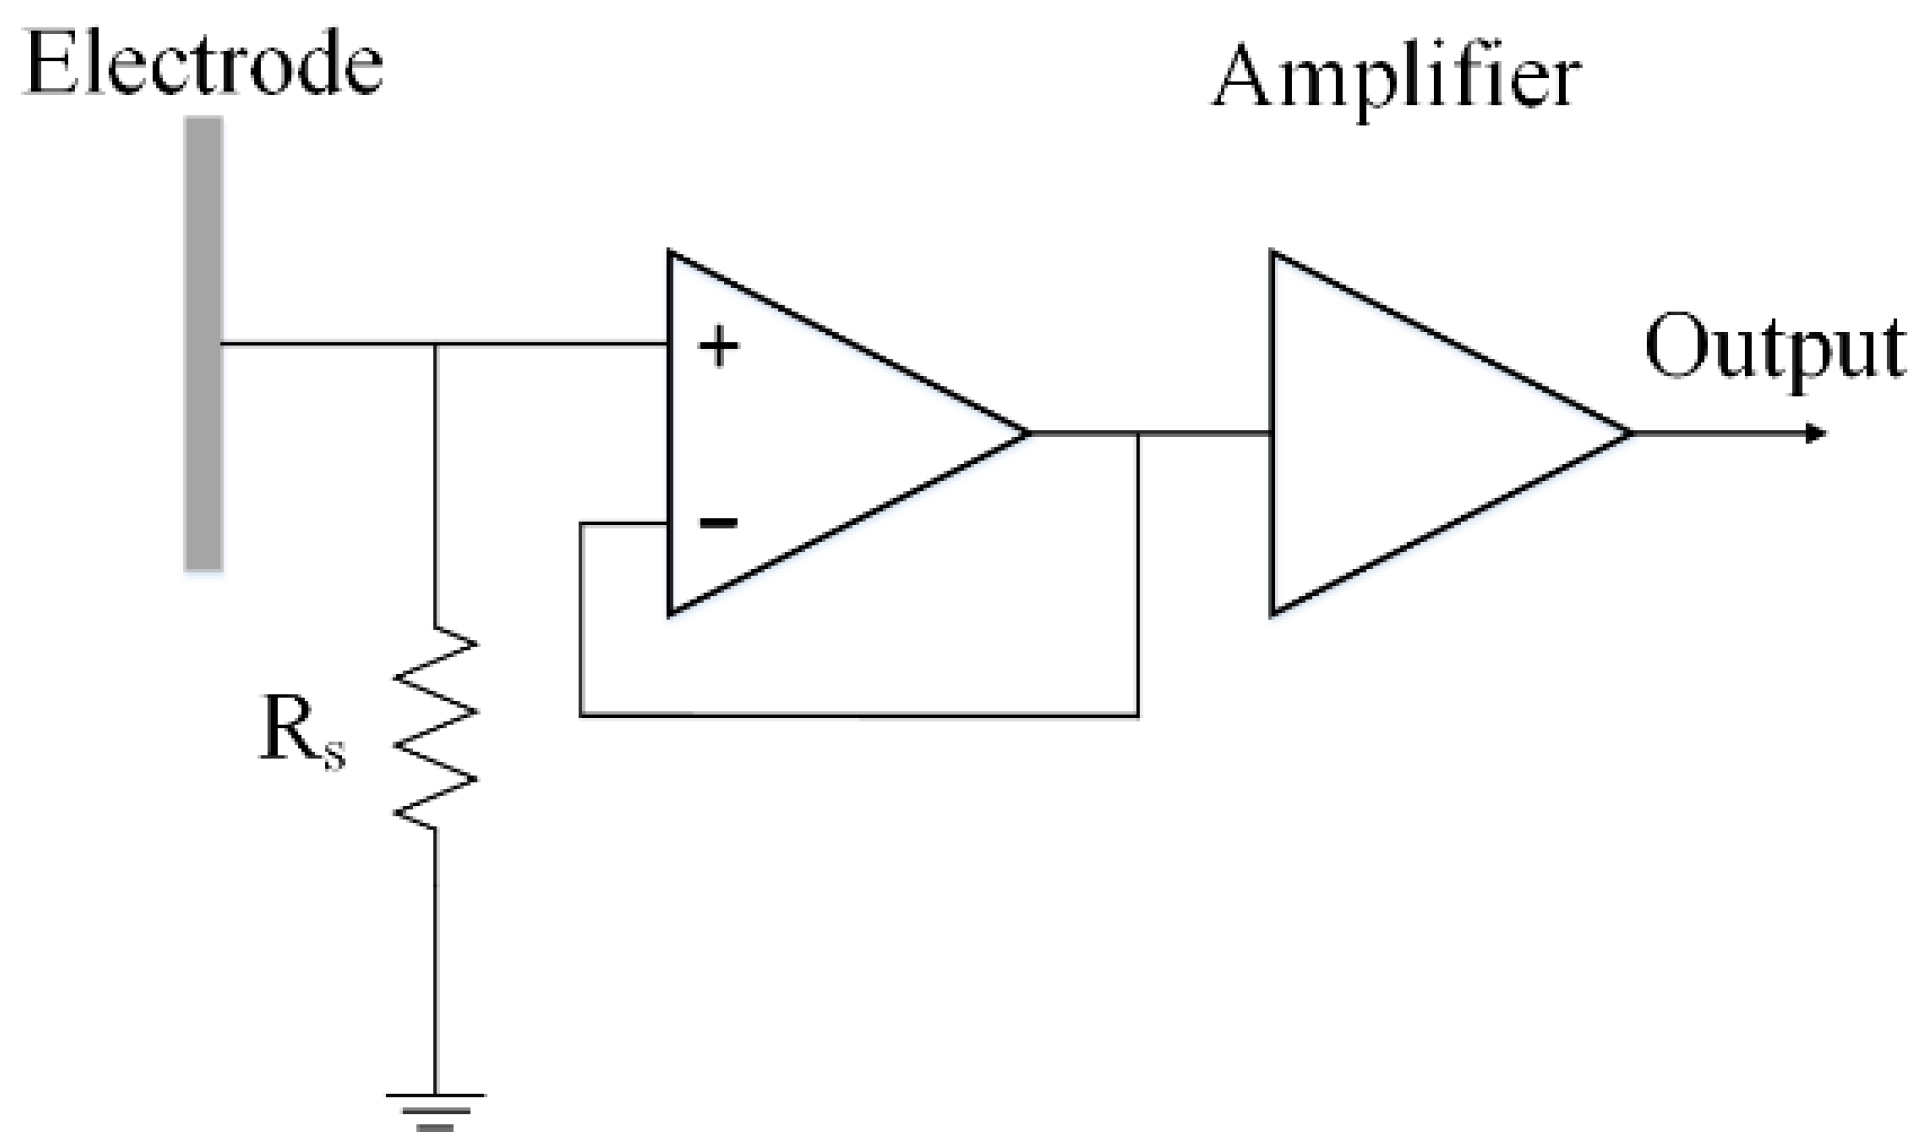
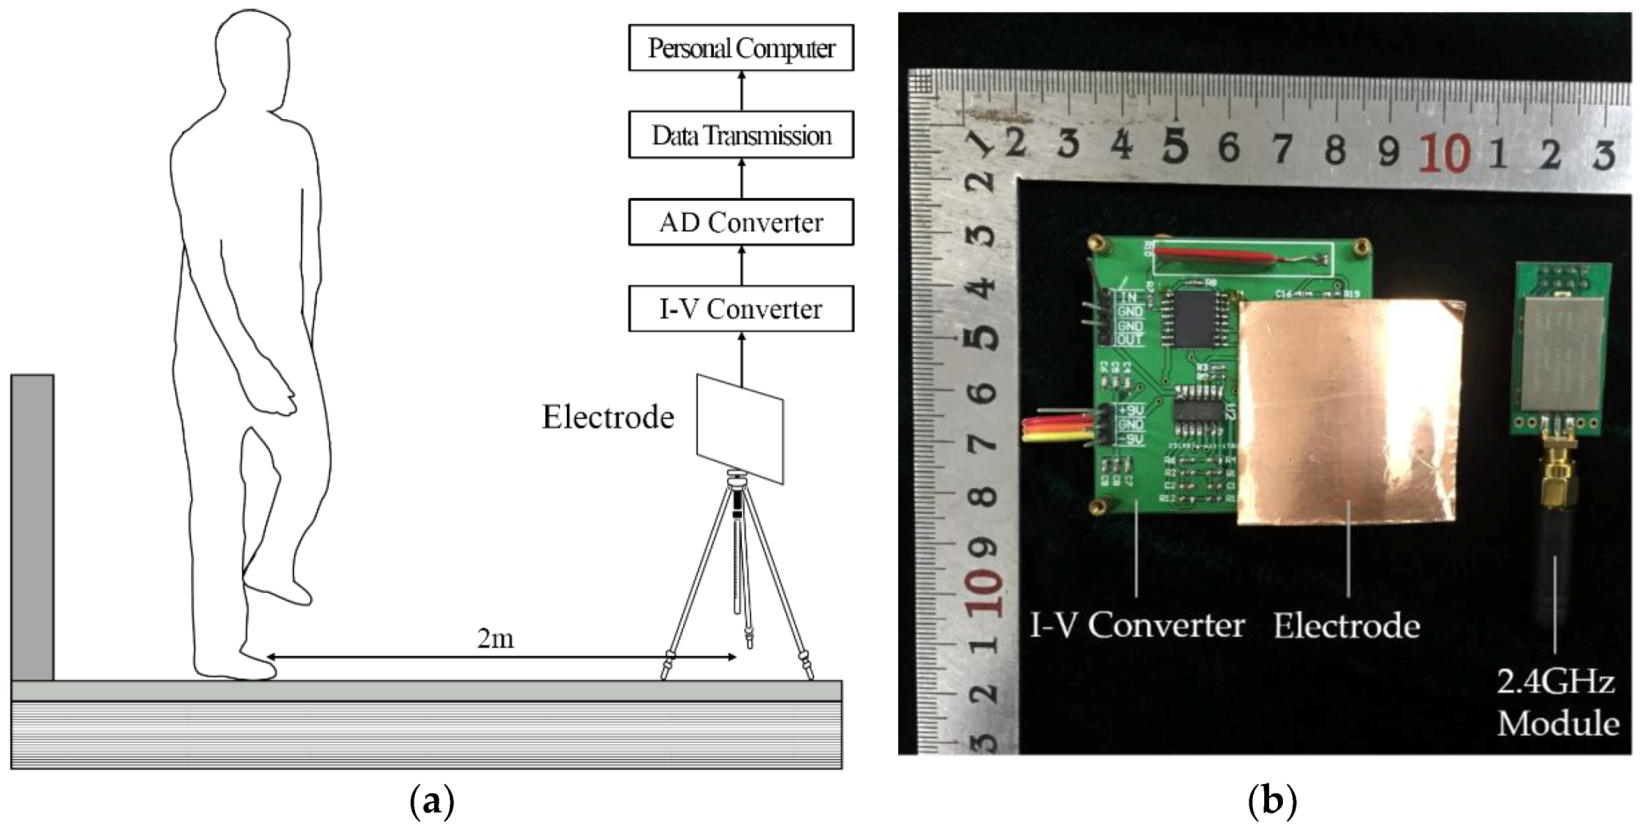
2.2.1. Electrostatic Field Sensing Measurement Installation
2.2.2. Foot Pressure Measurement System
2.3. Algorithm Development
2.3.1. Pressure-Based Foot Events Calculation Algorithm
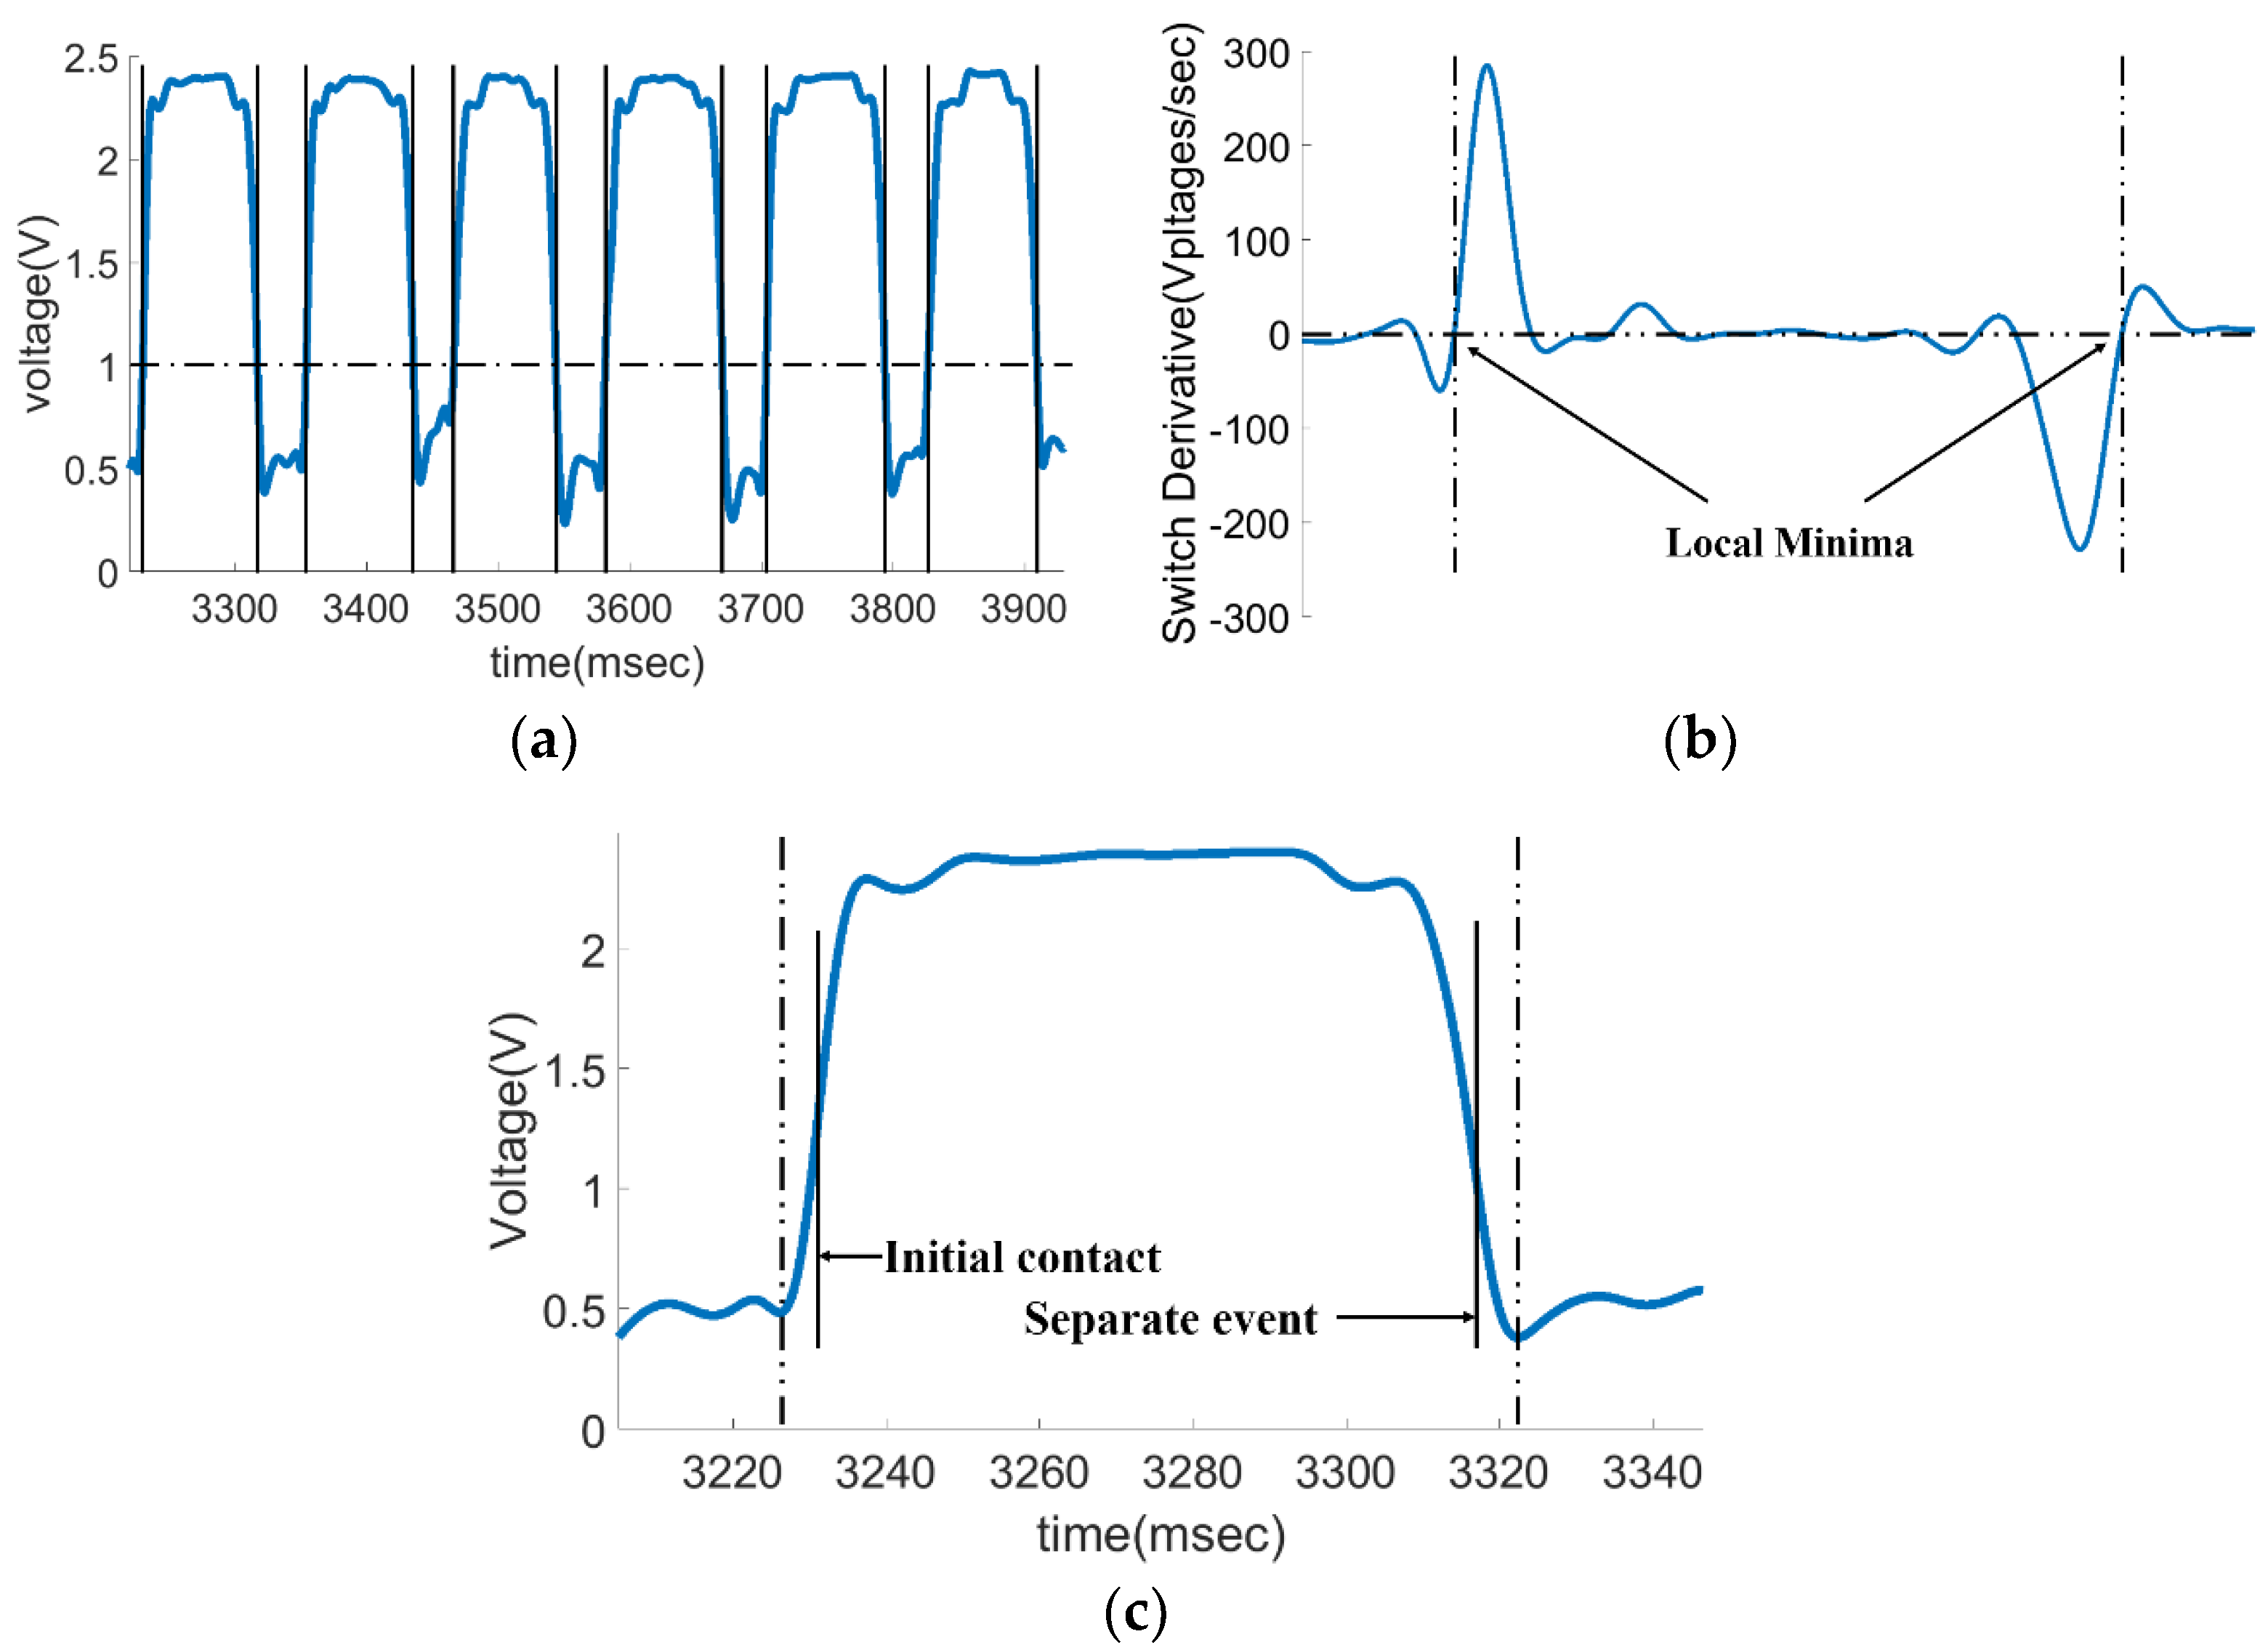
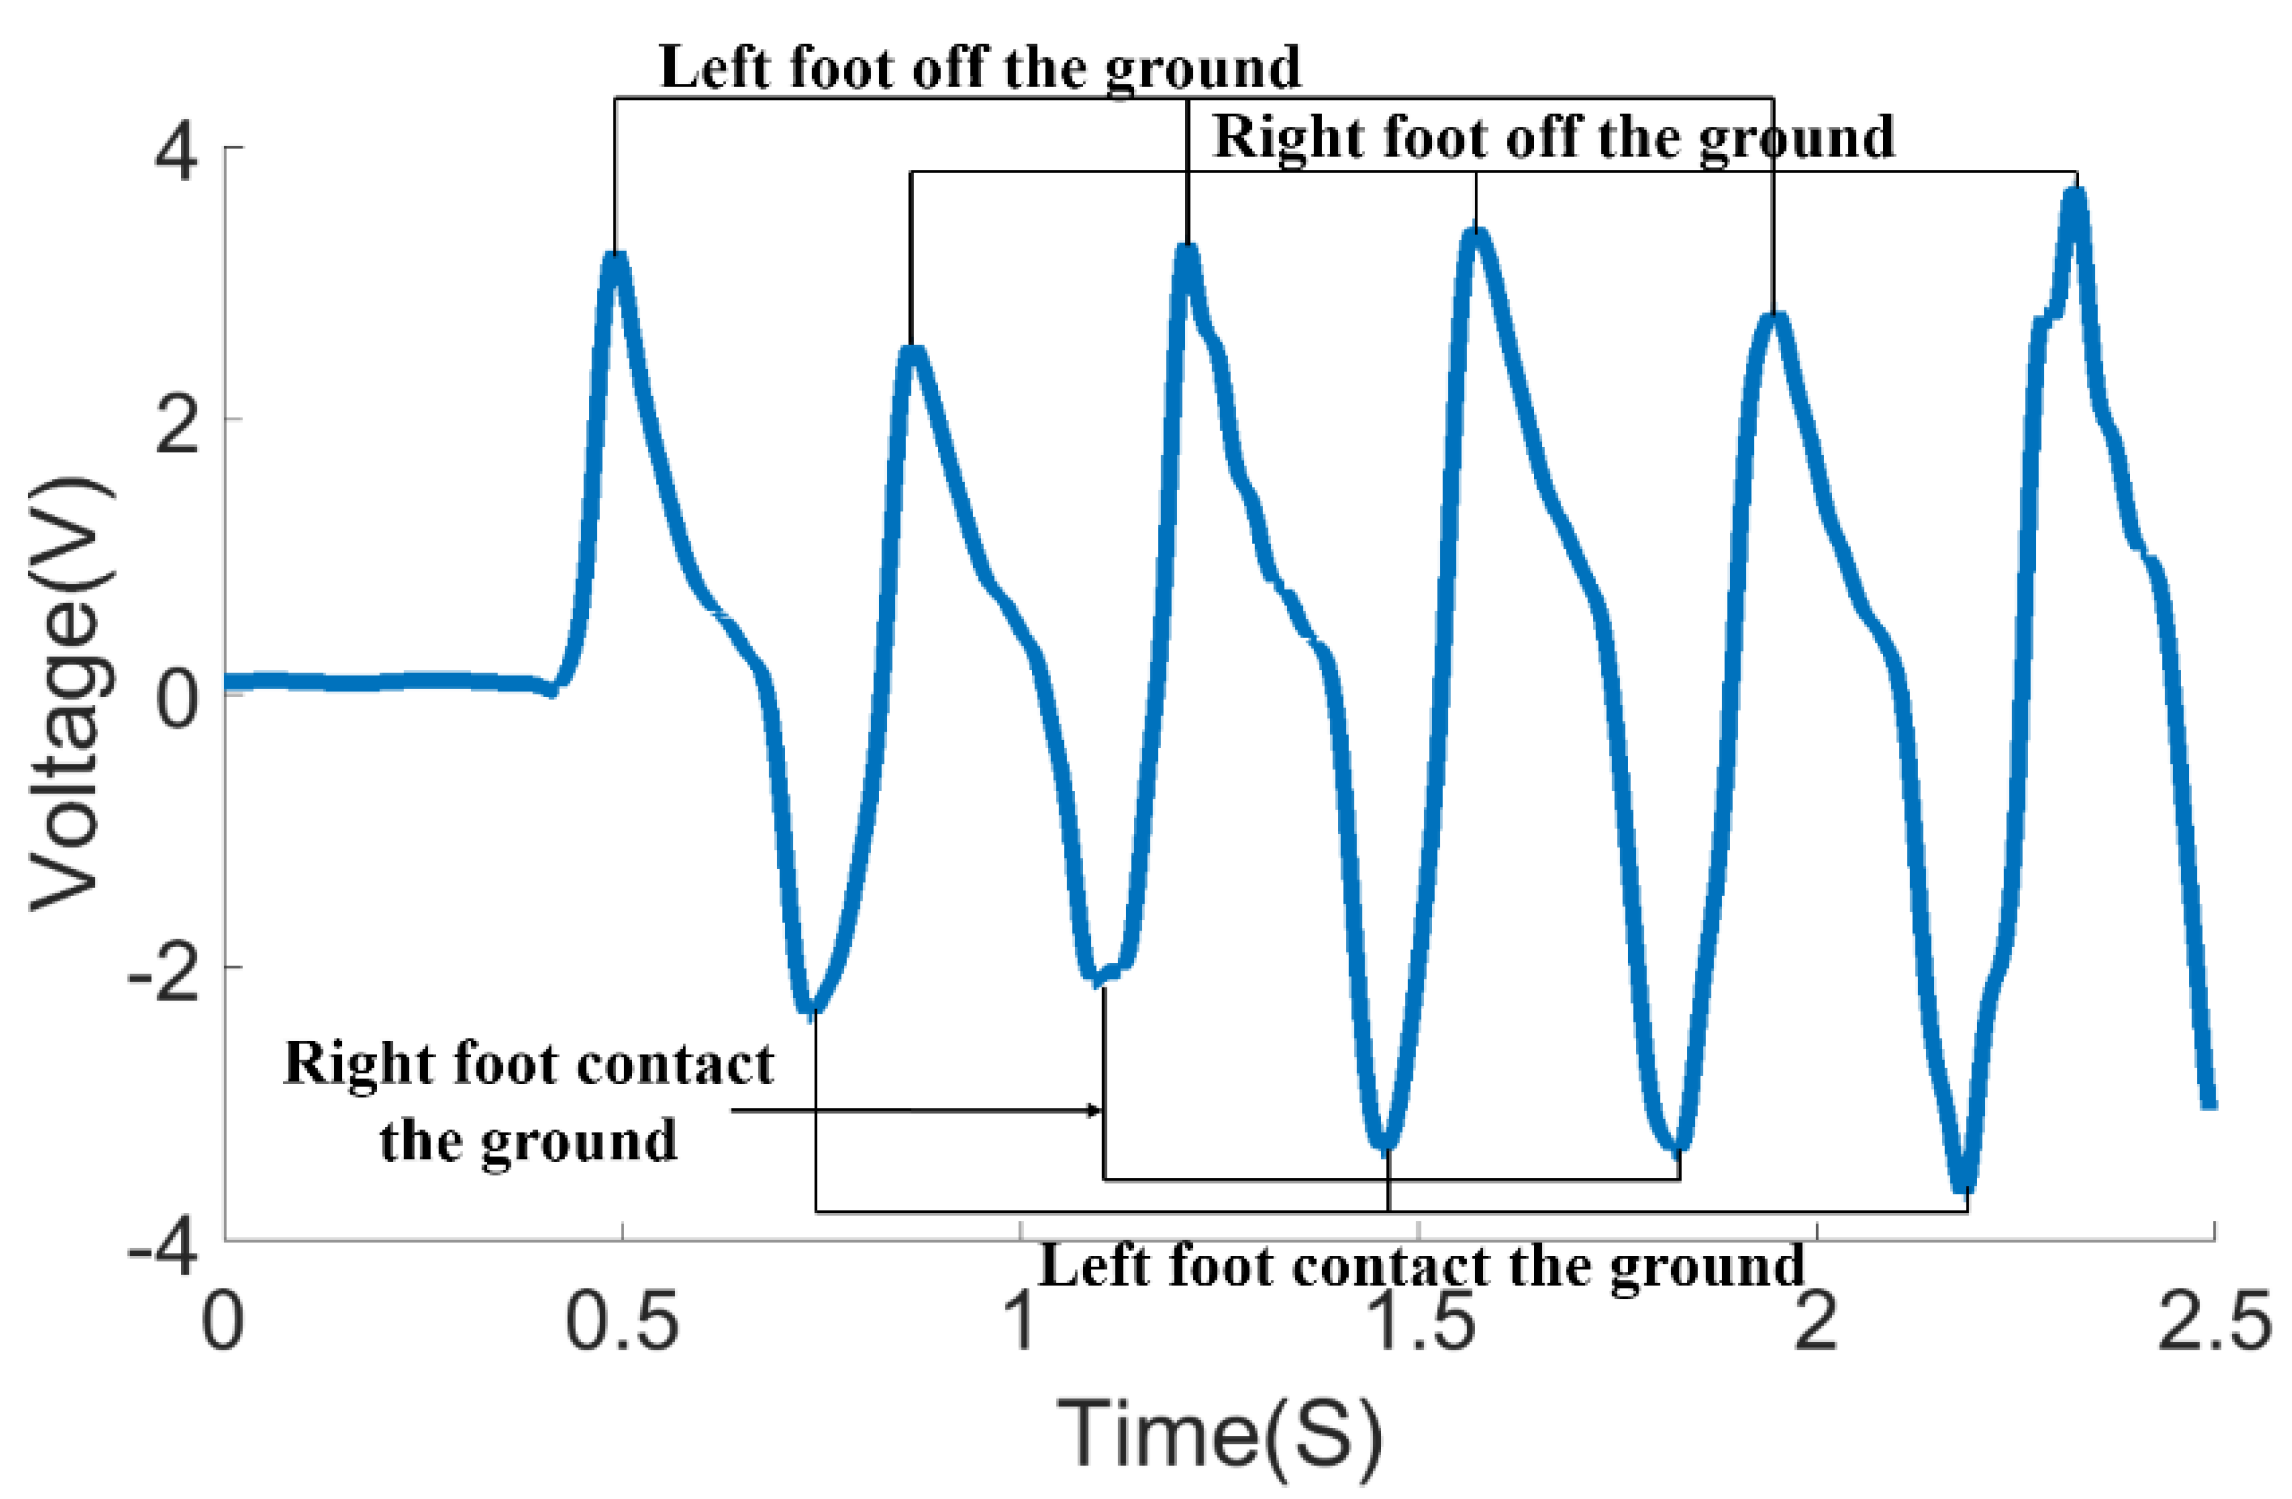
2.3.2. Electrostatic Signal-Based Foot Events Calculation Algorithm
2.4. Subjects
2.5. Experimental Conditions
2.6. Analysis
3. Results
4. Discussions
5. Conclusions
Author Contributions
Acknowledgments
Conflicts of Interest
References
- Mohammed, S.; Samé, A.; Oukhellou, L.; Kong, K.; Huo, W.; Amirat, Y. Recognition of gait cycle phases using wearable sensors. Rob. Auton. Syst. 2016, 75, 50–59. [Google Scholar] [CrossRef]
- Tunca, C.; Pehlivan, N.; Ak, N.; Arnrich, B.; Salur, G.; Ersoy, C. Inertial sensor-based robust gait analysis in non-hospital settings for neurological disorders. Sensors (Switzerland) 2017, 17, 825. [Google Scholar] [CrossRef] [PubMed]
- Alaqtash, M.; Yu, H.; Brower, R.; Abdelgawad, A.; Sarkodie-Gyan, T. Application of wearable sensors for human gait analysis using fuzzy computational algorithm. Eng. Appl. Artif. Intell. 2011, 24, 1018–1025. [Google Scholar] [CrossRef]
- Mannini, A.; Sabatini, A.M. Gait phase detection and discrimination between walking-jogging activities using hidden Markov models applied to foot motion data from a gyroscope. Gait Posture 2012, 36, 657–661. [Google Scholar] [CrossRef] [PubMed]
- Mariani, B.; Rouhani, H.; Crevoisier, X.; Aminian, K. Quantitative estimation of foot-flat and stance phase of gait using foot-worn inertial sensors. Gait Posture 2013, 37, 229–234. [Google Scholar] [CrossRef] [PubMed]
- Muro-de-la-Herran, A.; García-Zapirain, B.; Méndez-Zorrilla, A. Gait analysis methods: An overview of wearable and non-wearable systems, highlighting clinical applications. Sensors (Switzerland) 2014, 14, 3362–3394. [Google Scholar] [CrossRef] [PubMed]
- Abdul Razak, A.H.; Zayegh, A.; Begg, R.K.; Wahab, Y. Foot plantar pressure measurement system: A review. Sensors (Switzerland) 2012, 12, 9884–9912. [Google Scholar] [CrossRef] [PubMed]
- Wearing, S.C.; Reed, L.F.; Urry, S.R. Agreement between temporal and spatial gait parameters from an instrumented walkway and treadmill system at matched walking speed. Gait Posture 2013, 38, 380–384. [Google Scholar] [CrossRef] [PubMed]
- González, I.; Fontecha, J.; Hervás, R.; Bravo, J. Estimation of Temporal Gait Events from a Single Accelerometer through the Scale-Space Filtering Idea. J. Med. Syst. 2016, 40, 1–10. [Google Scholar] [CrossRef] [PubMed]
- Gouwanda, D.; Gopalai, A.A.; Khoo, B.H. A Low Cost Alternative to Monitor Human Gait Temporal Parameters-Wearable Wireless Gyroscope. IEEE Sens. J. 2016, 16, 9029–9035. [Google Scholar] [CrossRef]
- Wentink, E.C.; Schut, V.G.H.; Prinsen, E.C.; Rietman, J.S.; Veltink, P.H. Detection of the onset of gait initiation using kinematic sensors and EMG in transfemoral amputees. Gait Posture 2014, 39, 391–396. [Google Scholar] [CrossRef] [PubMed]
- Boutaayamou, M.; Denoël, V.; Brüls, O.; Demonceau, M.; Maquet, D.; Forthomme, B.; Croisier, J.L.; Schwartz, C.; Verly, J.G.; Garraux, G. Algorithm for Temporal Gait Analysis Using Wireless Foot-Mounted Accelerometers. In International Joint Conference on Biomedical Engineering Systems and Technologies; Springer: Cham, Switzerland, 2016; pp. 236–254. [Google Scholar]
- Ngo, T.T.; Makihara, Y.; Mukaigawa, Y.; Mukaigawa, Y.; Yagi, Y. Similar gait action recognition using an inertial sensor. Pattern Recognit. 2015, 48, 1289–1301. [Google Scholar] [CrossRef]
- Washabaugh, E.P.; Kalyanaraman, T.; Adamczyk, P.G.; Claflin, E.S.; Krishnan, C. Validity and repeatability of inertial measurement units for measuring gait parameters. Gait Posture 2017, 55, 87–93. [Google Scholar] [CrossRef] [PubMed]
- González, I.; López-Nava, I.H.; Fontecha, J.; Muñoz-Meléndez, A.; Pérez-SanPablo, A.I.; Quiñones-Urióstegui, I. Comparison between passive vision-based system and a wearable inertial-based system for estimating temporal gait parameters related to the GAITRite electronic walkway. J. Biomed. Inform. 2016, 62, 210–223. [Google Scholar] [CrossRef] [PubMed]
- Caldas, R.; Mundt, M.; Potthast, W.; Buarque de Lima Neto, F.; Markert, B. A systematic review of gait analysis methods based on inertial sensors and adaptive algorithms. Gait Posture 2017, 57, 204–210. [Google Scholar] [CrossRef] [PubMed]
- Bötzel, K.; Marti, F.M.; Rodríguez, M.Á.C.; Plate, A.; Vicente, A.O. Gait recording with inertial sensors—How to determine initial and terminal contact. J. Biomech. 2016, 49, 332–337. [Google Scholar] [CrossRef] [PubMed]
- Khandelwal, S.; Wickström, N. Novel methodology for estimating Initial Contact events from accelerometers positioned at different body locations. Gait Posture 2018, 59, 278–285. [Google Scholar] [CrossRef] [PubMed]
- Mertz, L. Convergence Revolution Comes to Wearables: Multiple Advances are Taking Biosensor Networks to the Next Level in Health Care. IEEE Pulse 2016, 7, 13–17. [Google Scholar] [CrossRef] [PubMed]
- Yang, S.; Zhang, J.T.; Novak, A.C.; Brouwer, B.; Li, Q. Estimation of spatio-temporal parameters for post-stroke hemiparetic gait using inertial sensors. Gait Posture 2013, 37, 354–358. [Google Scholar] [CrossRef] [PubMed]
- Toebes, M.J.; Hoozemans, M.J.; Furrer, R.; Dekker, J.; van Dieën, J.H. Associations between measures of gait stability, leg strength and fear of falling. Gait Posture 2015, 41, 76–80. [Google Scholar] [CrossRef] [PubMed]
- Anwary, A.R.; Yu, H.; Vassallo, M. Optimal Foot Location for Placing Wearable IMU Sensors and Automatic Feature Extraction for Gait Analysis. IEEE Sens. J. 2018, 18, 2555–2567. [Google Scholar] [CrossRef]
- Taborri, J.; Palermo, E.; Rossi, S.; Cappa, P. Gait partitioning methods: A systematic review. Sensors (Switzerland) 2016, 16, 66. [Google Scholar] [CrossRef] [PubMed]
- Kurita, K.; Fujii, Y.; Shimada, K. A new technique for touch sensing based on measurement of current generated by electrostatic induction. Sens. Actuators A Phys. 2011, 170, 66–71. [Google Scholar] [CrossRef]
- Chen, X.; Zheng, Z.; Cui, Z.; Zheng, W. A novel remote sensing technique for recognizing human gait based on the measurement of induced electrostatic current. J. Electrostat. 2012, 70, 105–110. [Google Scholar] [CrossRef]
- Chubb, J.N. A Standard proposed for assessing the electrostatic suitability of materials. J. Electrostat. 2007, 65, 607–610. [Google Scholar] [CrossRef]
- Castle, G.S.P. Contact charging between insulators. J. Electrostat. 1997, 40–41, 13–20. [Google Scholar] [CrossRef]
- Watanabe, H.; Ghadiri, M.; Matsuyama, T.; Long Ding, Y.; Pitt, K.G. New instrument for tribocharge measurement due to single particle impacts. Rev. Sci. Instrum. 2007, 78. [Google Scholar] [CrossRef]
- Gady, B.; Schleef, D.; Reifenberger, R.; Rimai, D.; DeMejo, L. Identification of electrostatic and van der Waals interaction forces between a micrometer-size sphere and a flat substrate. Phys. Rev. B 1996, 53, 8065–8070. [Google Scholar] [CrossRef]
- Forward, K.M.; Lacks, D.J.; Sankaran, R.M. Charge segregation depends on particle size in triboelectrically charged granular materials. Phys. Rev. Lett. 2009, 102, 1–4. [Google Scholar] [CrossRef] [PubMed]
- Ficker, T. Charging by walking. J. Phys. D Appl. Phys. 2006, 39, 410. [Google Scholar] [CrossRef]
- Kurita, K.; Ueta, S. A new motion control method for bipedal robot based on noncontact and nonattached human motion sensing technique. IEEE Trans. Ind. Appl. 2011, 47, 1022–1027. [Google Scholar] [CrossRef]
- Kurita, K. Novel non-contact and non-attached technique for detecting sports motion. Meas. J. Int. Meas. Confed. 2011, 44, 1361–1366. [Google Scholar] [CrossRef]
- Hausdorff, J.M.; Ladin, Z.; Wei, J.Y. Footswitch system for measurement of the temporal parameters of gait. J. Biomech. 1995, 28, 347–351. [Google Scholar] [CrossRef]
- Zhu, M.; Huang, Z.; Ma, C.; Li, Y. An objective balance error scoring system for sideline concussion evaluation using duplex kinect sensors. Sensors (Switzerland) 2017, 17, 2398. [Google Scholar] [CrossRef] [PubMed]
- Kluge, F.; Gaßner, H.; Hannink, J.; Pasluosta, C.; Klucken, J.; Eskofier, B.M. Towards mobile gait analysis: Concurrent validity and test-retest reliability of an inertial measurement system for the assessment of spatio-temporal gait parameters. Sensors (Switzerland) 2017, 17, 1522. [Google Scholar] [CrossRef] [PubMed]
- Wang, C.; Wang, X.; Long, Z.; Yuan, J.; Qian, Y.; Li, J. Estimation of temporal gait parameters using a wearable microphone-sensor-based system. Sensors (Switzerland) 2016, 16, 2167. [Google Scholar] [CrossRef] [PubMed]
- Qi, Y.; Soh, C.B.; Gunawan, E.; Low, K.S.; Thomas, R. Estimation of spatial-temporal gait parameters using a low-cost ultrasonic motion analysis system. Sensors (Switzerland) 2014, 14, 15371–15386. [Google Scholar] [CrossRef] [PubMed]


| Gait Parameters | EFS Result | Foot Pressure Result | Pearson Coefficient r |
|---|---|---|---|
| Stance phase duration (Ts) | 741.83 ± 117.97 | 775.03 ± 125.68 | 0.98 |
| Swing phase duration (Tw) | 431.32 ± 94.12 | 396.58 ± 94.10 | 0.99 |
| Gait cadence (C) | 102.53 ± 15.34 | 102.66 ± 15.42 | 0.99 |
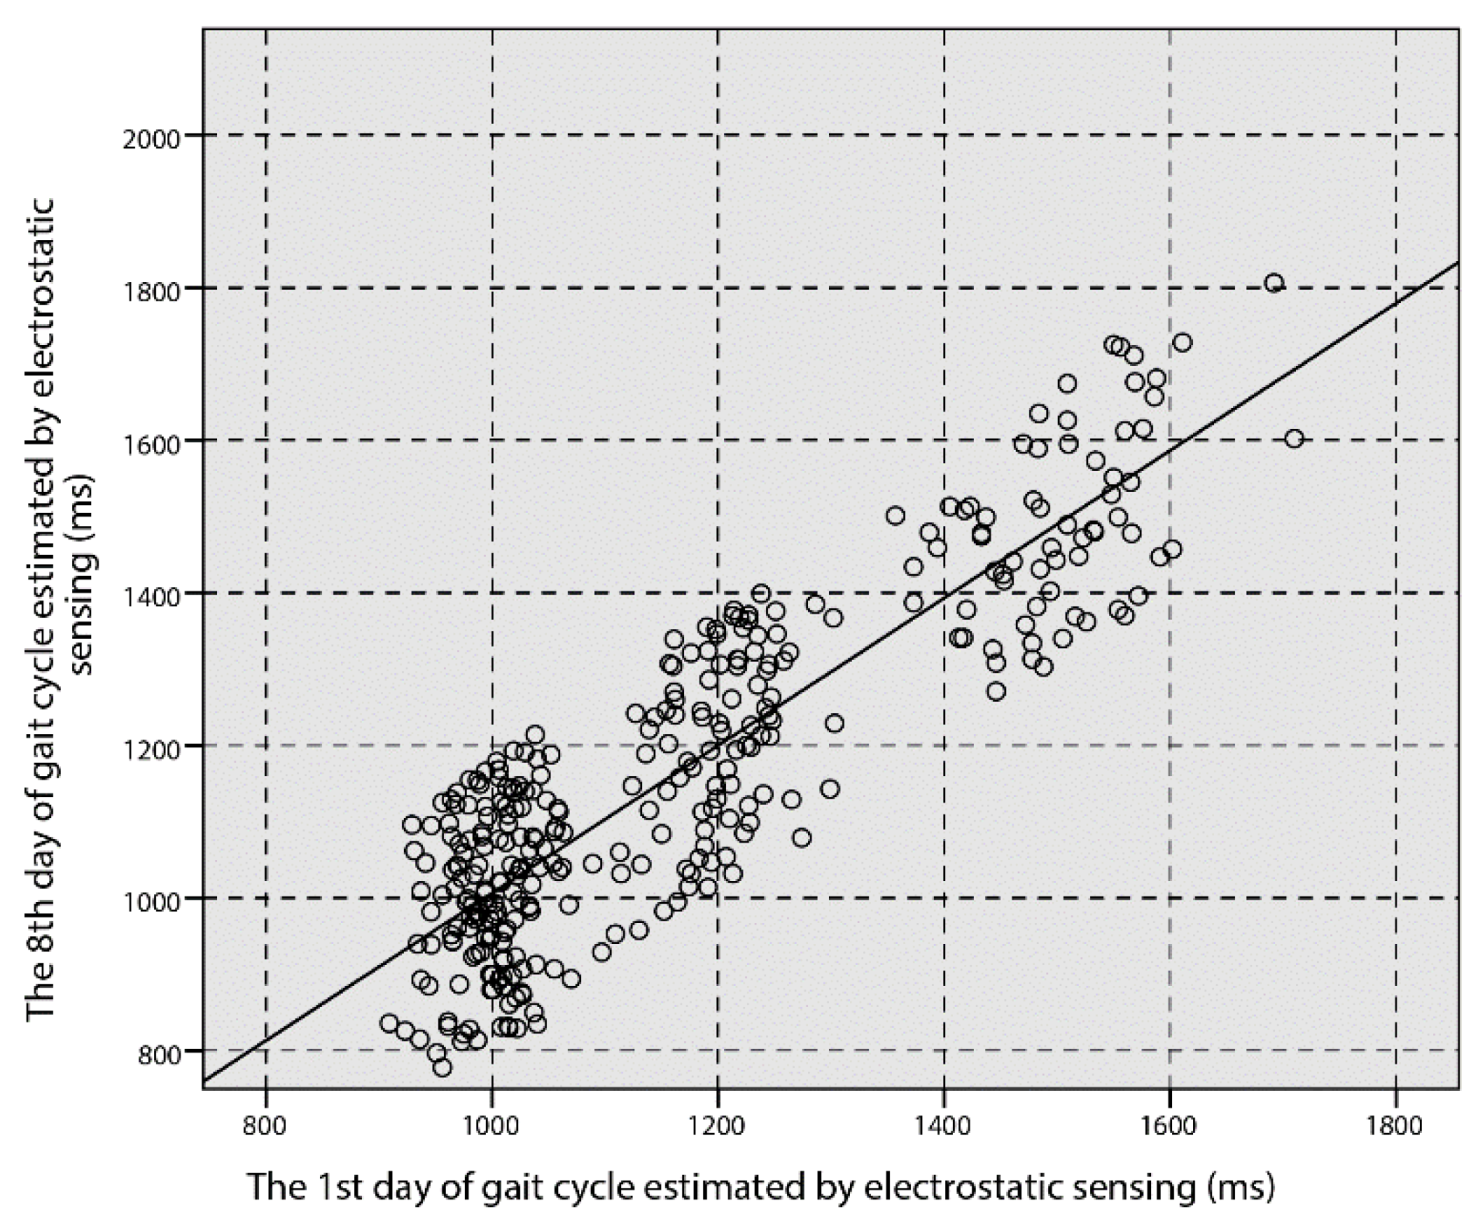
| Gait Parameters | Day 1 | Day 8 | ICC | p |
|---|---|---|---|---|
| Stance phase duration (Ts) | 741.83 ± 117.97 | 805.56 ± 120.64 | 0.86 | <0.001 |
| Swing phase duration (Tw) | 431.32 ± 94.12 | 458.79 ± 102.35 | 0.87 | <0.001 |
| Gait cadence (C) | 102.53 ± 15.34 | 95.23 ± 16.49 | 0.85 | <0.001 |
© 2018 by the authors. Licensee MDPI, Basel, Switzerland. This article is an open access article distributed under the terms and conditions of the Creative Commons Attribution (CC BY) license (http://creativecommons.org/licenses/by/4.0/).
Share and Cite
Li, M.; Li, P.; Tian, S.; Tang, K.; Chen, X. Estimation of Temporal Gait Parameters Using a Human Body Electrostatic Sensing-Based Method. Sensors 2018, 18, 1737. https://doi.org/10.3390/s18061737
Li M, Li P, Tian S, Tang K, Chen X. Estimation of Temporal Gait Parameters Using a Human Body Electrostatic Sensing-Based Method. Sensors. 2018; 18(6):1737. https://doi.org/10.3390/s18061737
Chicago/Turabian StyleLi, Mengxuan, Pengfei Li, Shanshan Tian, Kai Tang, and Xi Chen. 2018. "Estimation of Temporal Gait Parameters Using a Human Body Electrostatic Sensing-Based Method" Sensors 18, no. 6: 1737. https://doi.org/10.3390/s18061737
APA StyleLi, M., Li, P., Tian, S., Tang, K., & Chen, X. (2018). Estimation of Temporal Gait Parameters Using a Human Body Electrostatic Sensing-Based Method. Sensors, 18(6), 1737. https://doi.org/10.3390/s18061737