Sustaining Effect of Intensive Nutritional Intervention Combined with Health Education on Dietary Behavior and Plasma Glucose in Type 2 Diabetes Mellitus Patients


 ,
,
Abstract
:1. Introduction
2. Methods
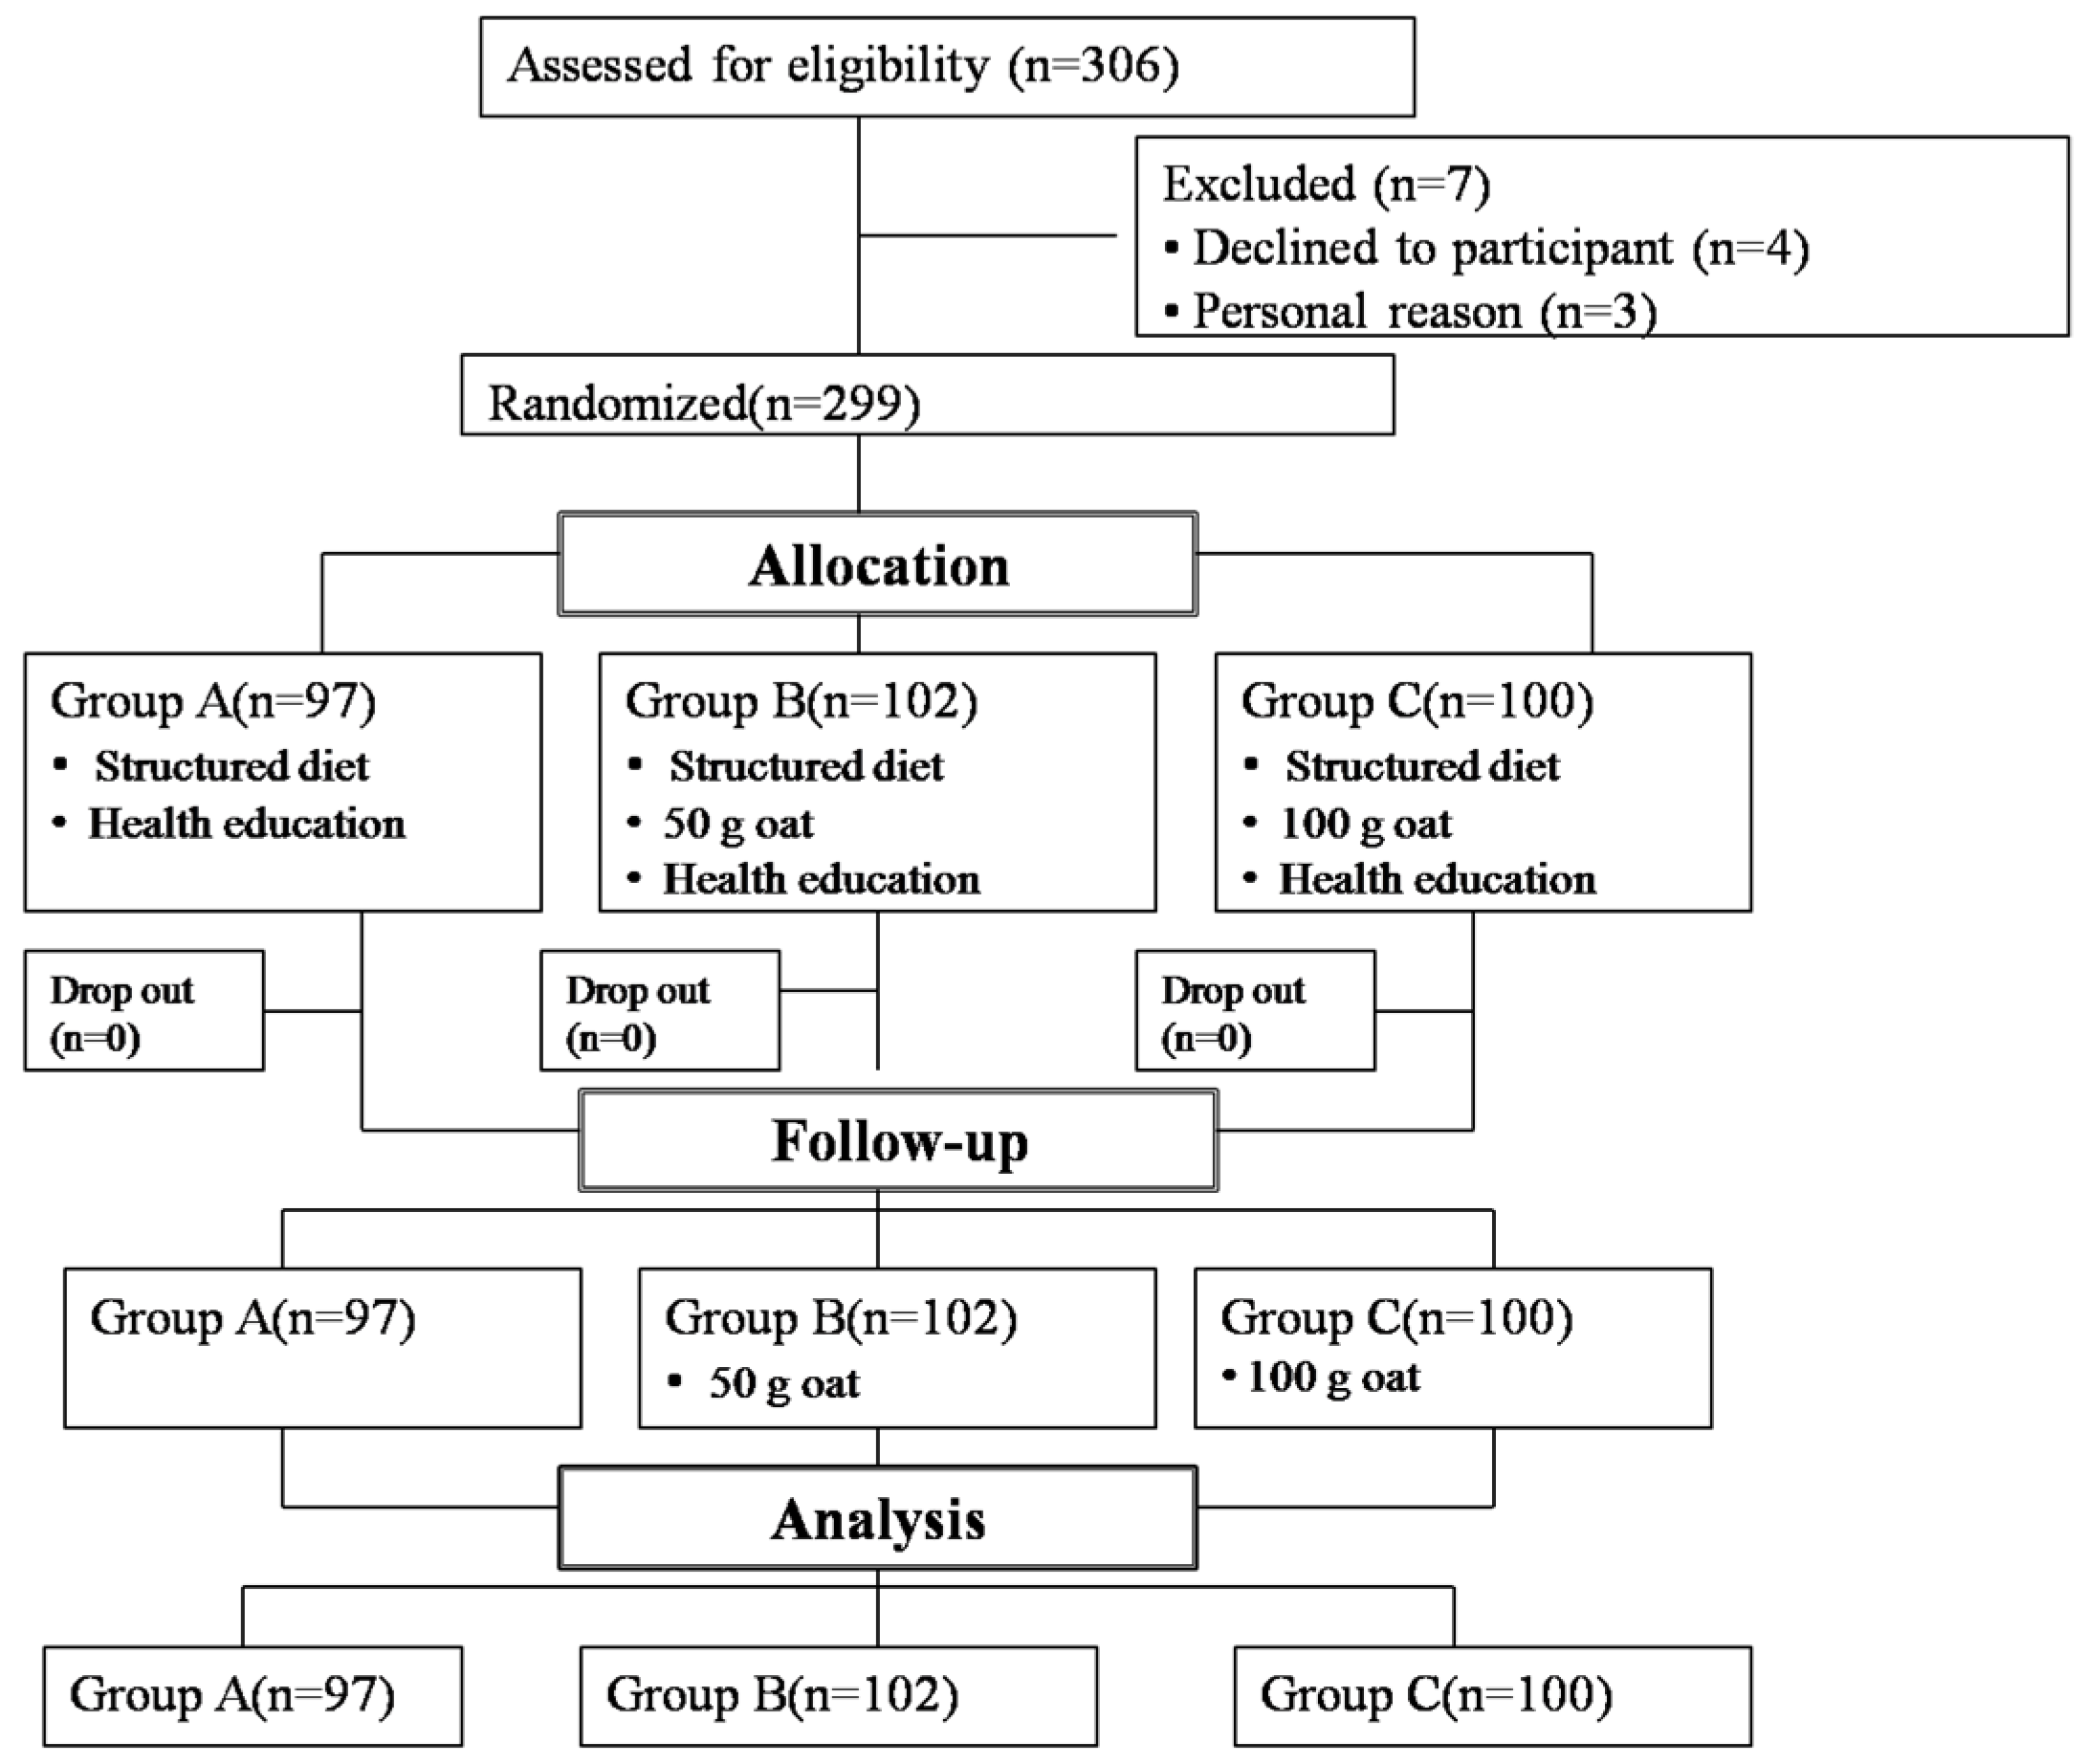
2.1. Study Design and Participants
2.1.1. Participants
2.1.2. Study Design
Phase I (Intensive Experiential Management)
Phase II (Follow-up Survey)
2.2. Outcome Measures
2.3. Desirable Dietary Pattern (DDP) Score
2.4. Statistical Analyses
3. Results
3.1. Dietary and Nutrient Intake
3.2. PCA for the Dietary Factors
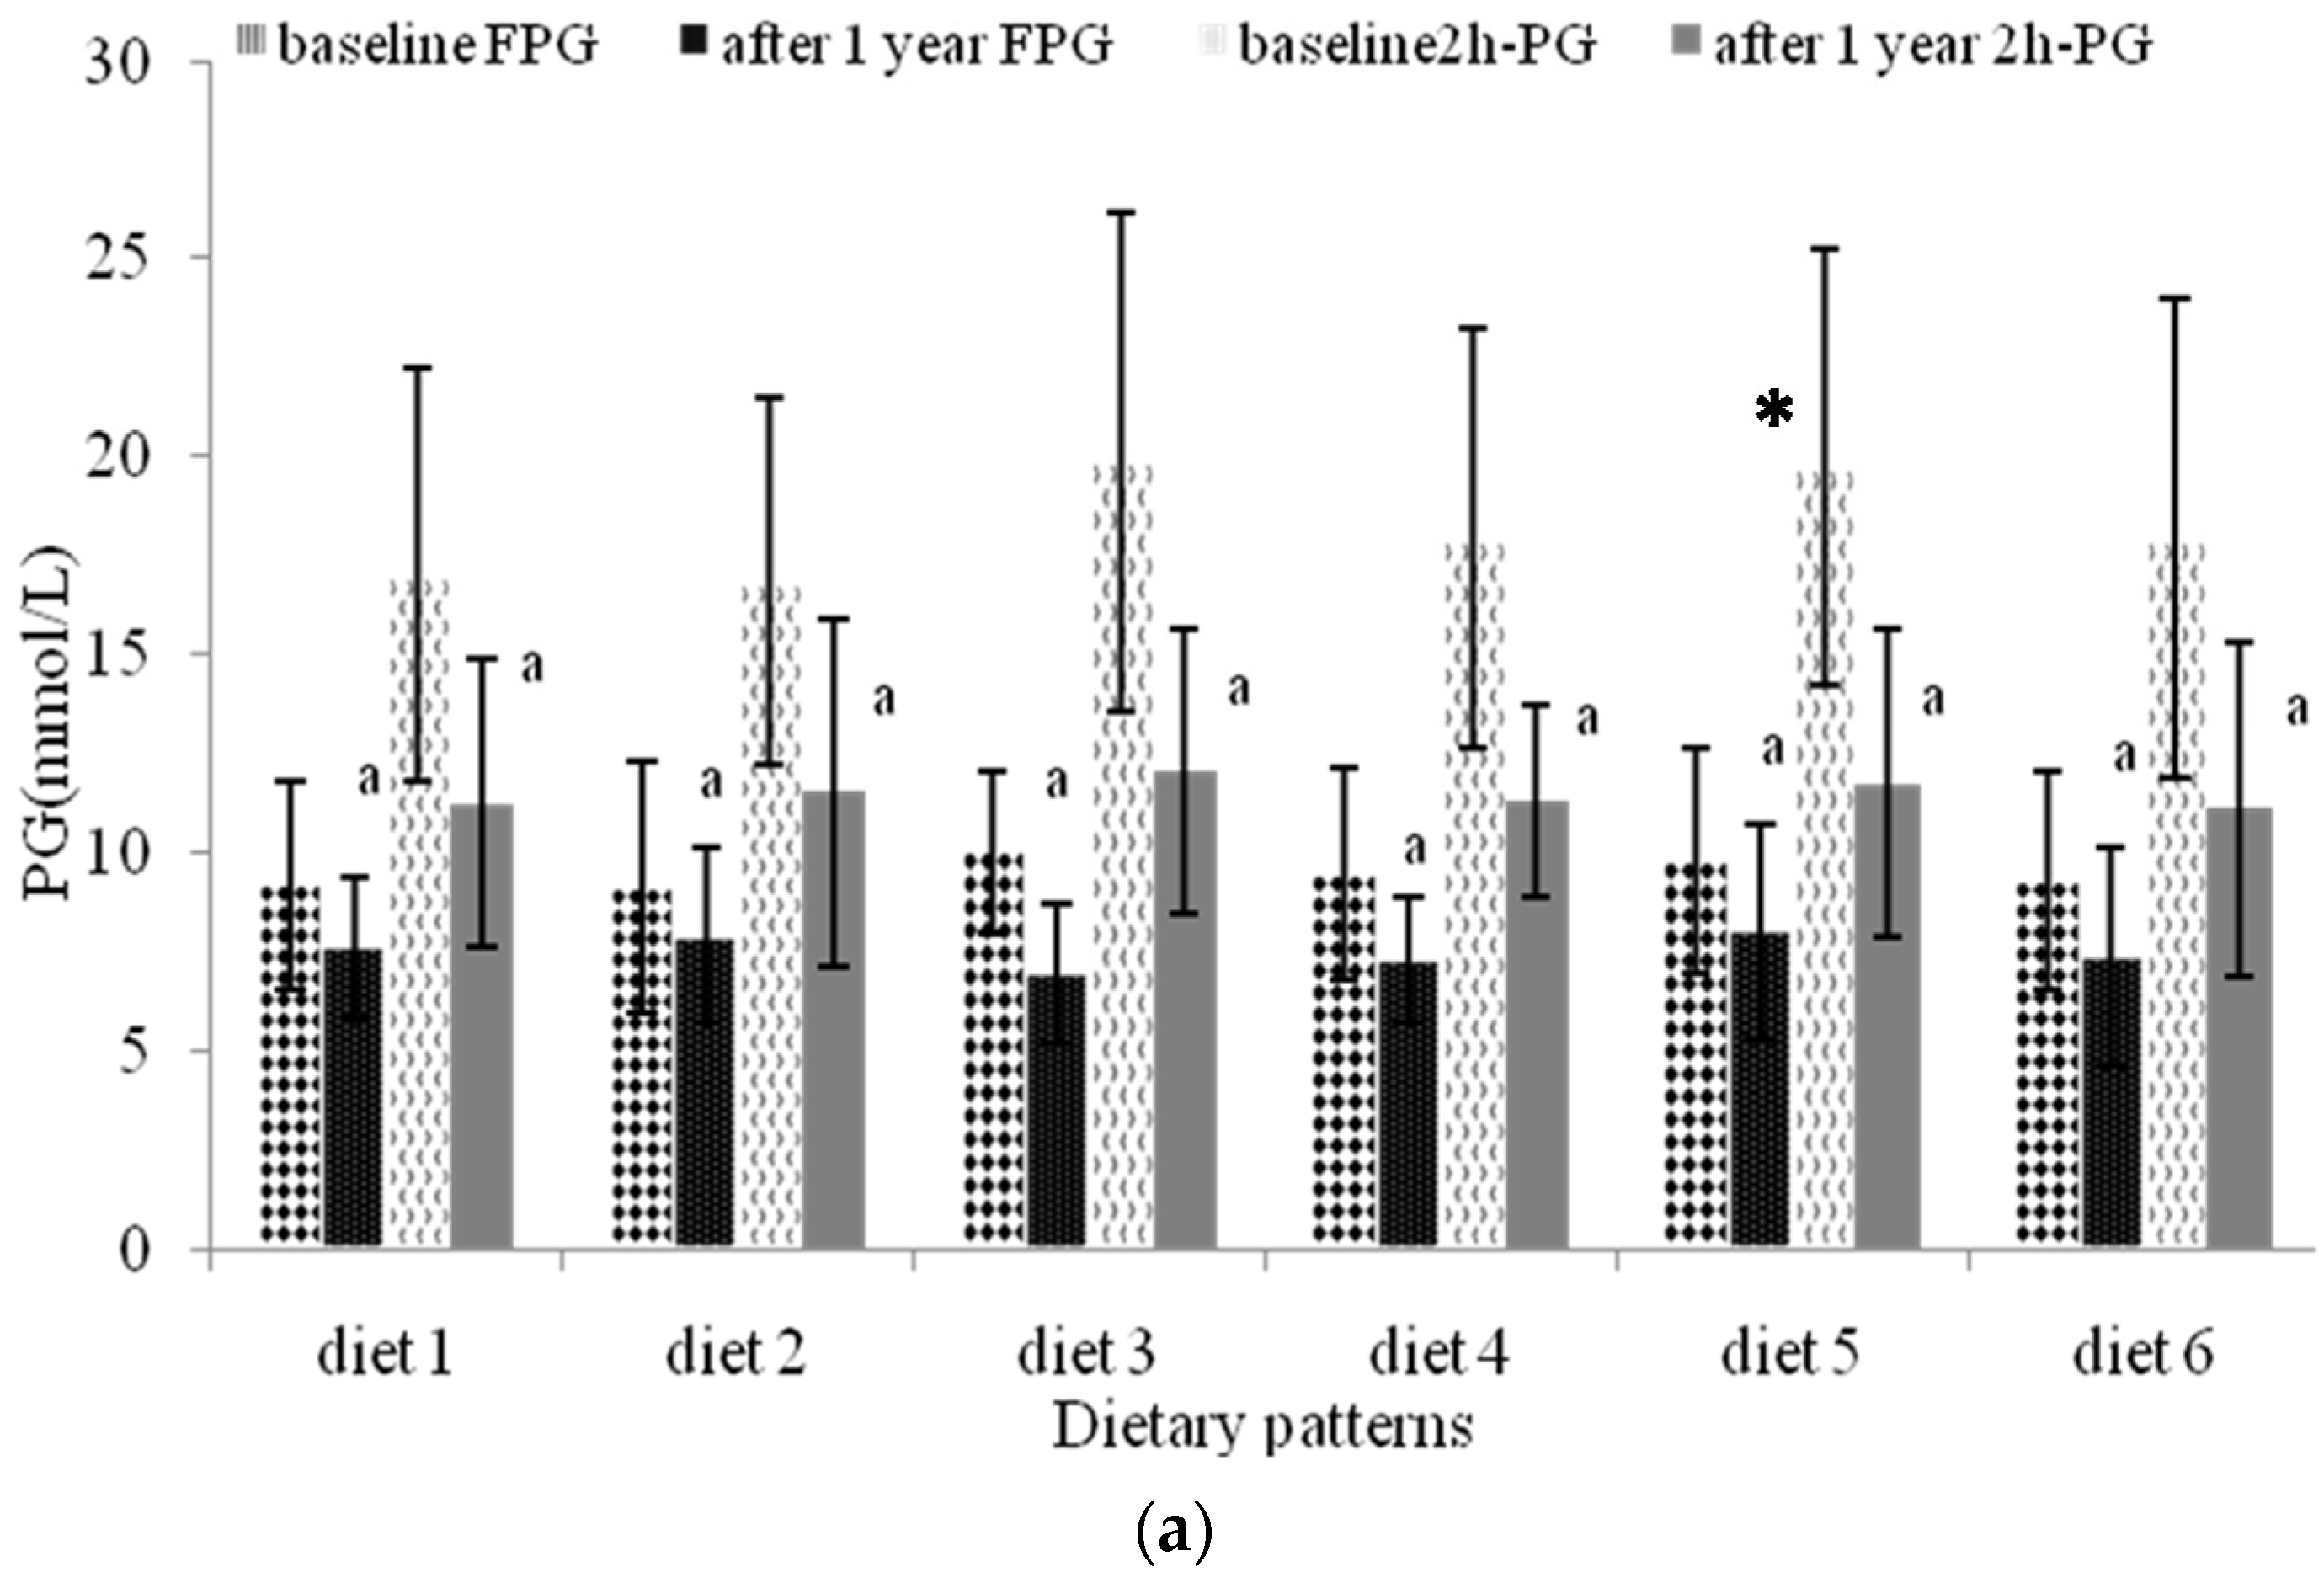
3.3. Evaluation of the Different Dietary Patterns (DDPs)
3.4. The Association between Dietary Patterns and Different Sociodemographic Variables
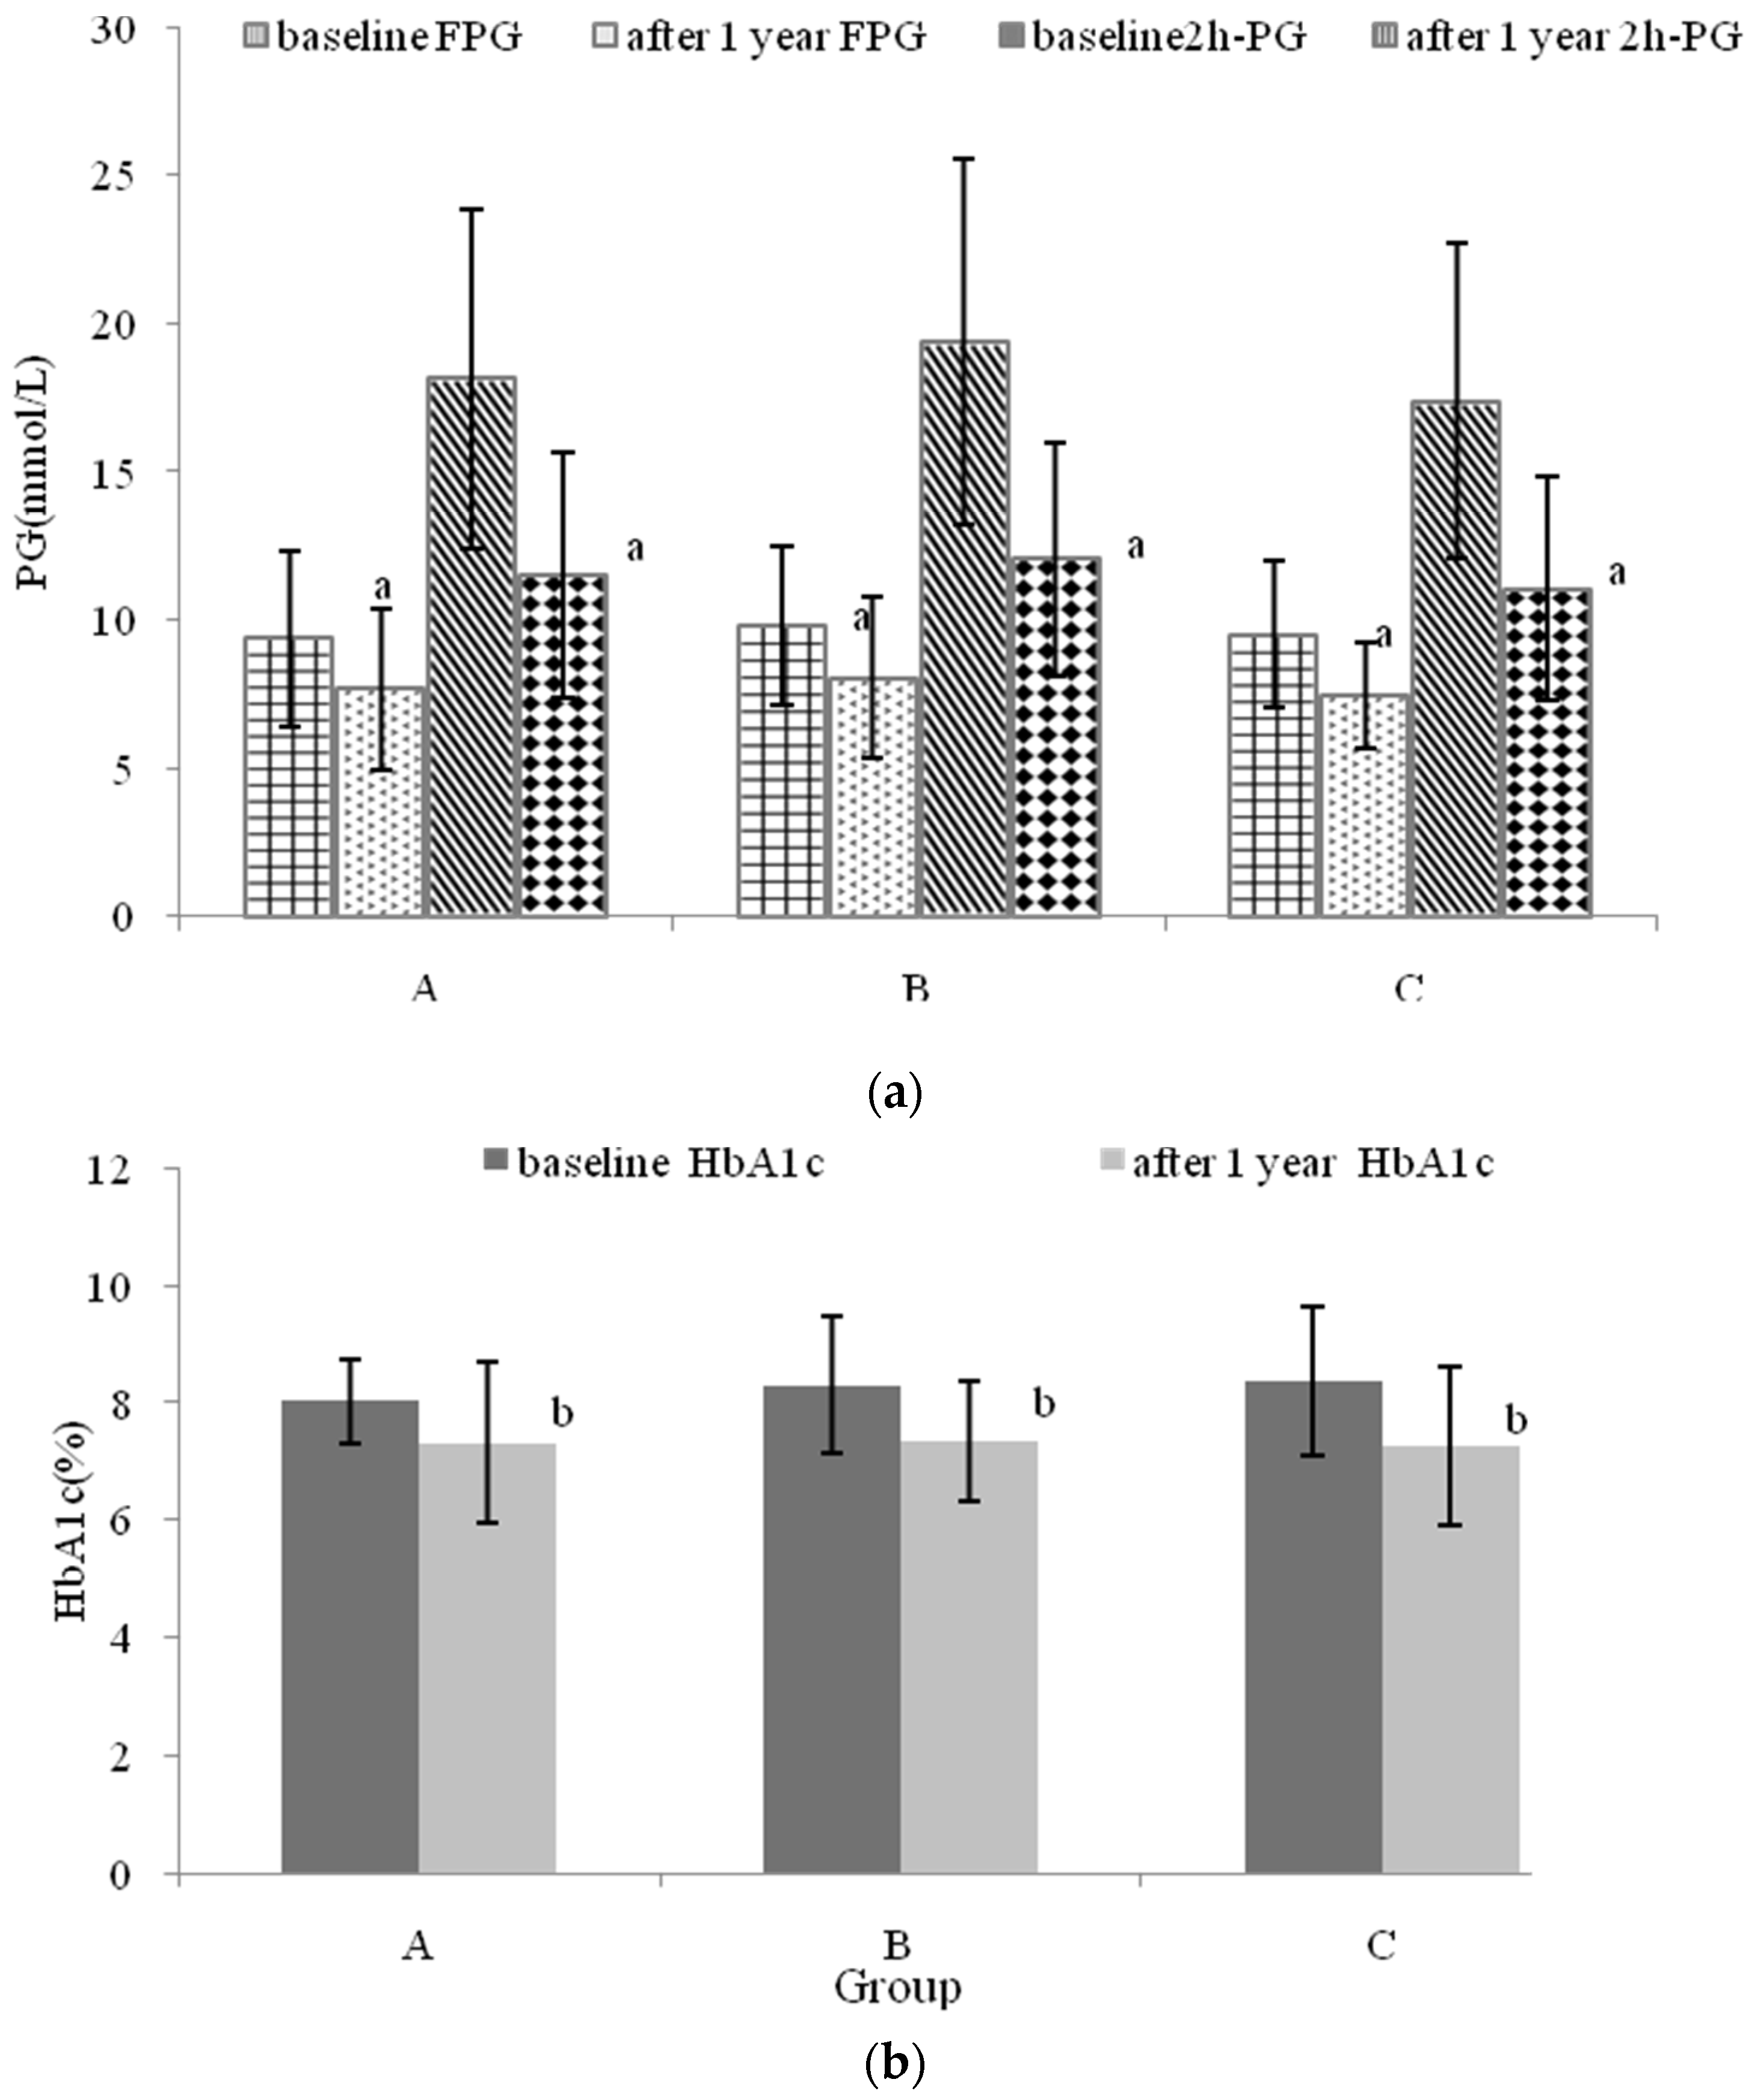
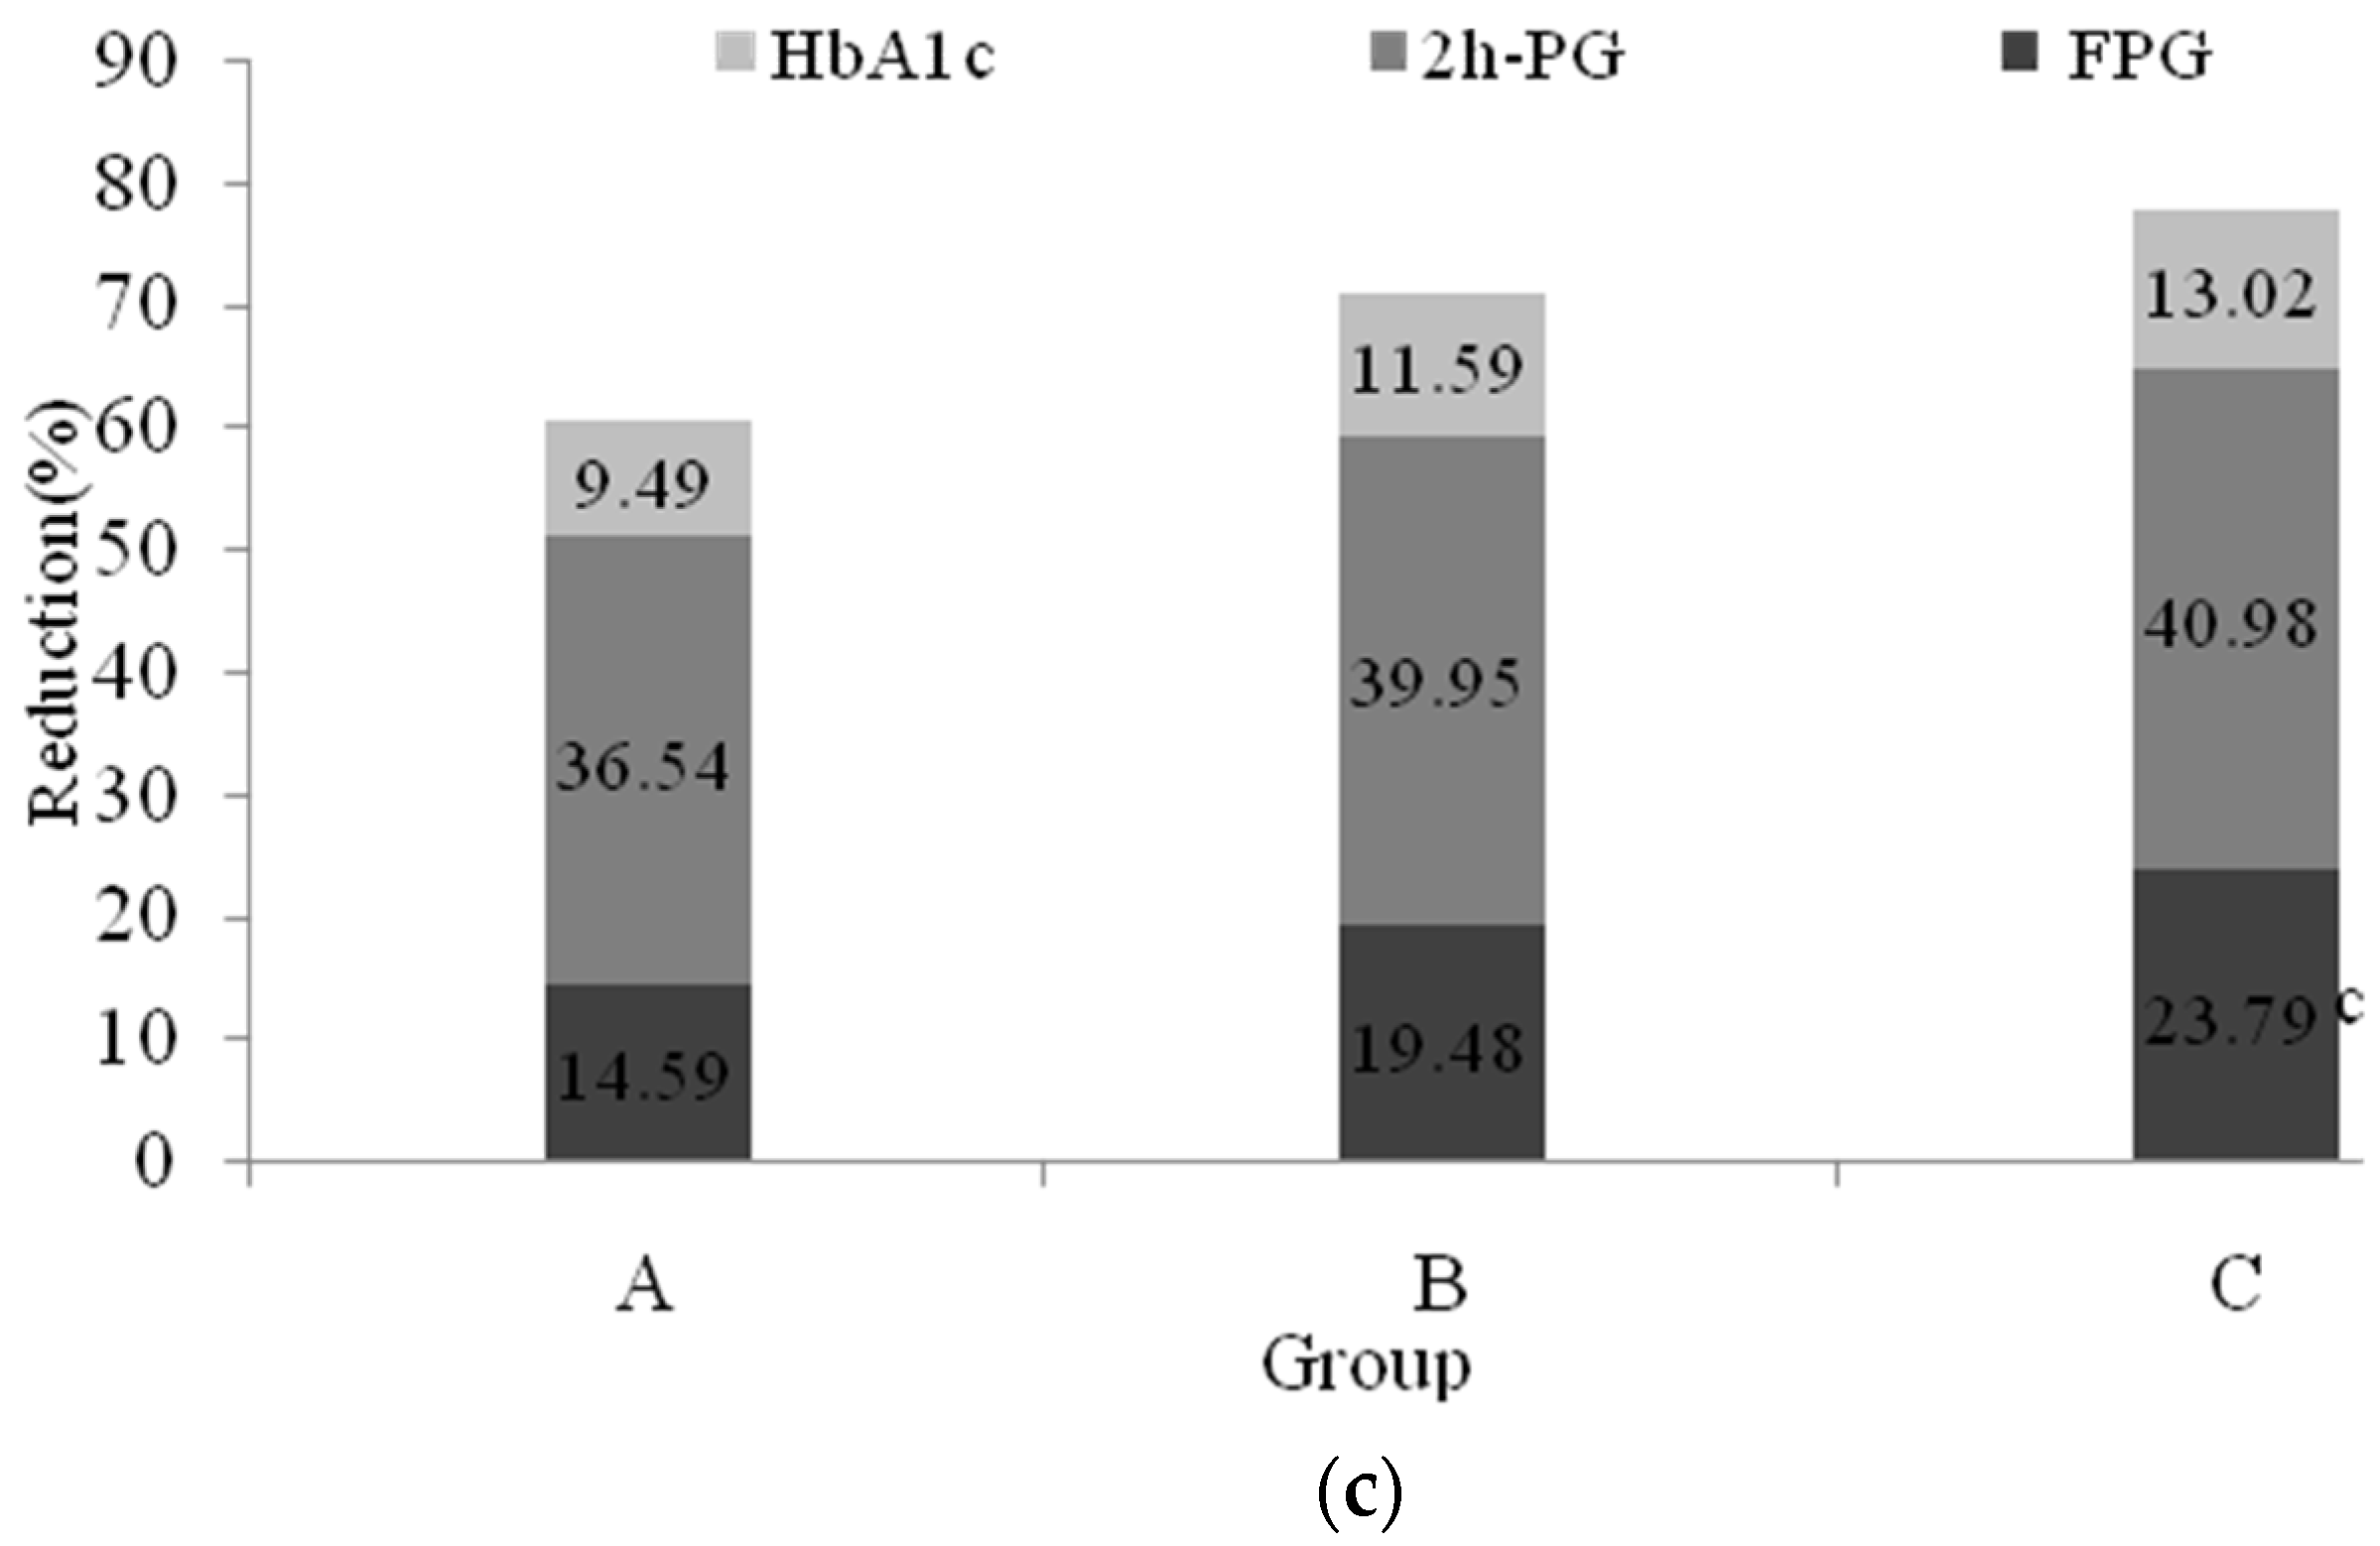
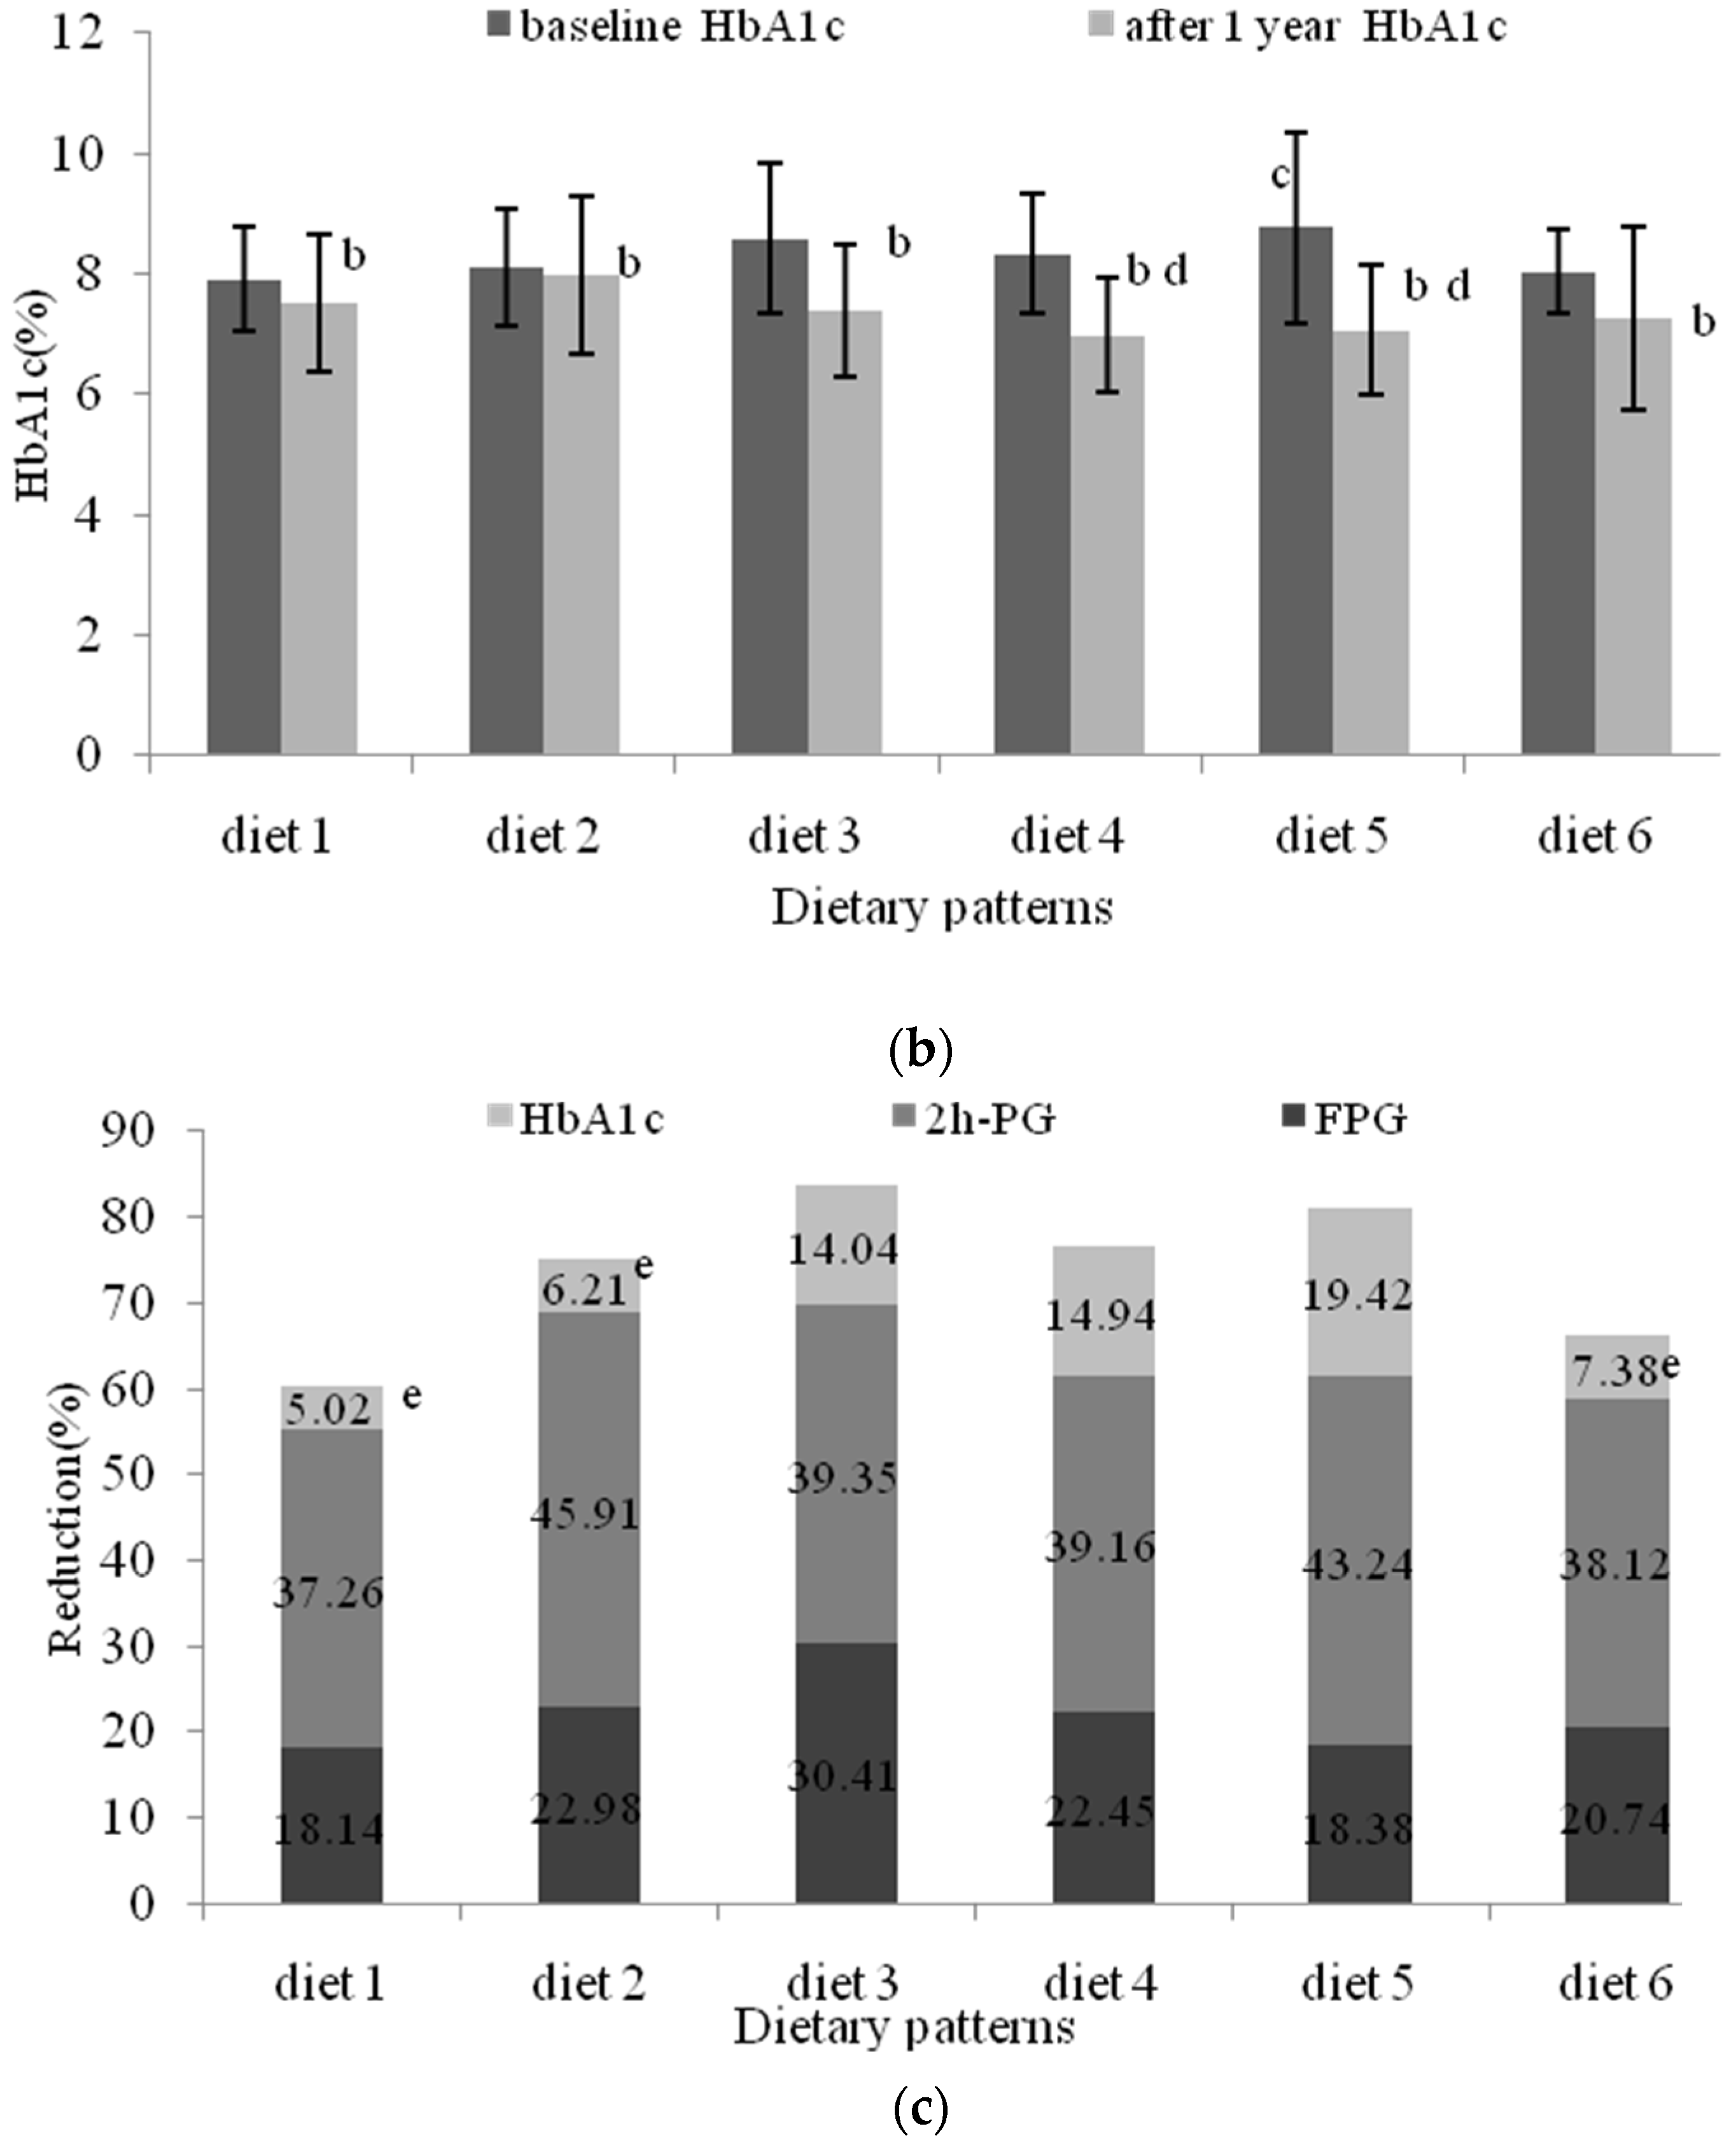
3.5. The Effects of Nutritional Intervention Combined with Healthy Education on Plasma Glucose
4. Discussion
5. Conclusions
Supplementary Materials
Acknowledgments
Author Contributions
Conflicts of Interest
References
- Danaei, G.; Finucane, M.M.; Lu, Y.; Singh, G.M.; Cowan, M.J.; Paciorek, C.J.; Lin, J.K.; Farzadfar, F.; Khang, Y.-H.; Stevens, G.A.; et al. National, regional, and global trends in fasting plasma glucose and diabetes prevalence since 1980: Systematic analysis of health examination surveys and epidemiological studies with 370 country-years and 2.7 million participants. Lancet 2011, 378, 31–40. [Google Scholar] [CrossRef]
- Shaw, J.E.; Sicree, R.A.; Zimmet, P.Z. Global estimates of the prevalence of diabetes for 2010 and 2030. Diabetes Res. Clin. Pract. 2010, 87, 4–14. [Google Scholar] [CrossRef] [PubMed]
- Martin, T. Global control of diabetes: Information for action. Lancet 2011, 378, 3–4. [Google Scholar]
- Ma, X.; Gu, J.; Zhang, Z.; Jing, L.; Xu, M.; Dai, X.; Jiang, Y.; Li, Y.; Bao, L.; Cai, X.; et al. Effects of Avena nuda L. on metabolic control and cardiovascular disease risk among Chinese patients with diabetes and meeting metabolic syndrome criteria: Secondary analysis of a randomized clinical trial. Eur. J. Clin. Nutr. 2013, 67, 1291–1297. [Google Scholar] [CrossRef] [PubMed]
- Gu, D.; Reynolds, K.; Duan, X.; Xin, X.; Chen, J.; Wu, X.; Mo, J.; Whelton, P.K.; He, J.; InterASIA Collaborative Group; et al. Prevalence of diabetes and impaired fasting glucose in the Chinese adult population, International Collaborative Study of Cardiovascular Disease in Asia (InterASIA). Diabetologia 2003, 46, 1190–1198. [Google Scholar] [CrossRef] [PubMed]
- Xu, Y.; Wang, L.; He, J.; Bi, Y.; Li, M.; Wang, T.; Wang, L.; Jiang, Y.; Dai, M.; Lu, J.; et al. Prevalence and control of diabetes in Chinese adults. JAMA 2013, 310, 948–959. [Google Scholar] [CrossRef] [PubMed]
- Chinese Diabetes Society. China guideline for Type 2 diabetes. Chin. J. Diabetes Mellit. 2014, 6, 447–449. [Google Scholar]
- Deakin, T.; McShane, C.E.; Cade, J.E.; Williams, R.D. Group based training for self-management strategies in people with type 2 diabetes. Cochrane Diabetes Syst. Rev. 2005, 2, 1–10. [Google Scholar]
- Karanja, L. Dieticians’ knowledge of diabetic management and patients recovery rate. Sch. J. Appl. Med. Sci. 2015, 3, 431–435. [Google Scholar]
- Franz, M.J.; Boucher, J.L.; Evert, A.B. Evidence-based diabetes nutrition therapy recommendations are effective, the key is individualization. Diabetes Metab. Syndr. Obes. Targets Ther. 2014, 7, 65–72. [Google Scholar] [CrossRef] [PubMed]
- Franz, M.J. Diabetes nutrition therapy: Effectiveness, macronutrients, eating patterns and weight management. Am. J. Med. Sci. 2016, 351, 374–379. [Google Scholar] [CrossRef] [PubMed]
- Moran, M. The evolution of the nutritional management of diabetes. Proc. Nutr. Soc. 2004, 63, 615–620. [Google Scholar] [CrossRef] [PubMed]
- Evert, A.B.; Boucher, J.L.; Cypress, M.; Dunbar, S.A.; Franz, M.J.; Mayer-Davis, E.J.; Neumiller, J.J.; Nwankwo, R.; Verdi, C.L.; Urbanski, P.; et al. Nutrition therapy recommendations for the management of adults with diabetes. Diabetes Care 2013, 36, 3821–3842. [Google Scholar] [CrossRef] [PubMed]
- Yan, M. Effects of Self-Management Education on Diabetic Control among Patients with Type 2 Diabetes: A Systematic Review; The University of Hong Kong: Hong Kong, China, 2013. [Google Scholar]
- Williamson, A.R.; Hunt, A.E.; Pope, J.F.; Tolman, N.M. Recommendations of dietitians for overcoming barriers to dietary adherence in individuals with diabetes. Diabetes Educ. 2000, 26, 272–279. [Google Scholar] [CrossRef] [PubMed]
- Harris, D.; Haughton, B. Model for multicultural nutrition counselling competencies. J. Am. Diet. Assoc. 2000, 100, 1178–1185. [Google Scholar] [CrossRef]
- Bazzano, L.A.; Serdula, M.; Liu, S. Prevention of type 2 diabetes by diet and lifestyle modification. J. Am. Coll. Nutr. 2005, 24, 310–319. [Google Scholar] [CrossRef] [PubMed]
- Chinese Nutrition Society. Dietary Guidelines for Chinese Residents 2011; Tibet People’s Publishing House: Lhasa, China, 2010. [Google Scholar]
- China. China Medical Nutrition Therapy Guideline for Diabetes 2010. Available online: http://cdschina.org/news_show.jsp?id=509 (accessed on 16 December 2012).
- Zhou, Z.H.; Hu, W.; Li, M.; Xu, R.; Shi, L.; Huang, C. Development and validation of a new model of desirable dietary pattern (N-DDP) score for Chinese diets. Public Health Nutr. 2014, 17, 519–528. [Google Scholar] [CrossRef] [PubMed]
- Dipnall, J.F.; Pasco, J.A.; Meyer, D.; Berk, M.; Williams, L.J.; Dodd, S.; Jacka, F.N. The association between dietary patterns, diabetes and depression. J. Affect. Disord. 2015, 174, 215–224. [Google Scholar] [CrossRef] [PubMed]
- De PinhoL, L.; Silveira, M.F.; de Carvalho Botelho, A.C.; Caldeira, A.P. Identification of dietary patterns of adolescents attending publicschools. J. Pediatr. (Rio J.) 2014, 90, 267–272. [Google Scholar] [CrossRef] [PubMed]
- Bao, L.; Cai, X.X.; Xu, M.H.; Li, Y. Effect of oat intake on glycaemic control and insulin sensitivity, a meta-analysis of randomised controlled trials. Br. J. Nutr. 2014, 112, 457–466. [Google Scholar] [CrossRef] [PubMed]
- Braaten, J.T.; Scott, F.W.; Wood, P.J.; Riedel, K.D.; Wolynetz, M.S.; Brule, D.; Collins, M.W. High beta-glucan oat bran and oat gum reduce postprandial blood glucose and insulin in subjects with and without type 2 diabetes. Diabet. Med. 1994, 11, 312–318. [Google Scholar] [CrossRef] [PubMed]
- Anderson, J.W.; Hamilton, C.C.; Horn, J.L.; Spencer, D.B.; Dillon, D.W.; Zeigler, J.A. Metabolic reffects of insoluble oat fiber on lean men with type II diabetes. Cereal Chem. 1991, 68, 291–294. [Google Scholar]
- Tapola, N.; Karvonen, H.; Niskanen, L.; Mikola, M.; Sarkkinen, E. Glycemic responses of oat bran products in type 2 diabetic patients. Nutr. Metab. Cardiovasc. Dis. 2005, 15, 255–261. [Google Scholar] [CrossRef] [PubMed]
- Jenkins, A.L.; Jenkins, D.J.; Zdravkovic, U.; Wursch, P.; Vuksan, V. Depression of the glycemic index by high levels of beta-glucan fiber in two functional foods tested in type 2 diabetes. Eur. J. Clin. Nutr. 2002, 56, 622–628. [Google Scholar] [CrossRef] [PubMed]
- Butt, M.S.; Tahir-Nadeem, M.; Khan, M.K.I.; Shabir, R.; Butt, M.S. Oat, unique among the cereals. Eur. J. Nutr. 2008, 47, 68–79. [Google Scholar] [CrossRef] [PubMed]
- Bartłomiej, S.; Justyna, R.K.; Ewa, N. Bioactive compounds in cereal grains-occurrence, structure, technological significance, nutritional benefits—A review. Food Sci. Technol. Int. 2012, 18, 559–568. [Google Scholar] [CrossRef] [PubMed]
- Gu, J.; Jing, L.; Ma, X.; Zhang, Z.; Xu, M.; Wang, J.; Li, Y. Naked oat combined with a structured dietary intervention affects oxidative stress but not inflammation in diabetic dyslipidemia. Nutr. Metab. Cardiovas. 2014, 24, 35–37. [Google Scholar] [CrossRef] [PubMed]
- Zhang, P.P.; Hu, X.Z.; Zhen, H.M.; Xu, C.; Fan, M.T. Oat β-Glucan increased ATPases activity and energy charge in small intestine of rats. J. Agric. Food Chem. 2012, 60, 9822–9827. [Google Scholar] [CrossRef] [PubMed]
- Dong, J.L.; Cai, F.L.; Shen, R.L.; Liu, Y.Q. Hypoglycaemic effects and inhibitory effect on intestinal disaccharidases of oat beta-glucan in streptozotocin-induced diabetic mice. Food Chem. 2011, 129, 1066–1071. [Google Scholar] [CrossRef] [PubMed]
- Lock, K.; Pomerleau, J.; Altmann, D.R.; Causer, L.; McKee, M. The global burdenof disease attributable to low consumption of fruit and vegeta-bles, implications for the global strategy on diet. Bull. World Health Organ. 2005, 83, 100–107. [Google Scholar]
- Guo, H.; Niu, K.; Monma, H.; Kobayashi, Y.; Guan, L.; Sato, M.; Minamishima, D.; Nagatomi, R. Association of Japanese dietary pattern with serum adiponectin concentration in Japanese adult men. Nutr. Metab. Cardiovas. 2012, 22, 277–284. [Google Scholar] [CrossRef] [PubMed]
- Okada, S. Effects of lifestyle education on Type 2 diabetes with an emphasis on a traditional Japanese diet. Diabetes Manag. 2011, 1, 571–574. [Google Scholar] [CrossRef]
- Sofi, F.; Macchi, C.; Abbate, R.; Gensini, G.F.; Casini, A. Mediterranean diet and health status, an updated meta-analysis and a proposal for a literature-based adherence score. Public Health Nutr. 2014, 17, 2769–2782. [Google Scholar] [CrossRef] [PubMed]
- Bonaccio, M.; Castelnuovo, A.D.; Costanzo, S.; de Lucia, M.; Olivieri, M.; Donati, M.B.; de Gaetan, G.; Iacoviello, L.; Bonanni, A. Nutrition knowledge is associated with higher adherence to Mediterranean diet and lower prevalence of obesity, results from the Moli-sani study. Appetite 2013, 68, 139–146. [Google Scholar] [CrossRef] [PubMed]
- Li, D.; Xiao, R.; Cai, C.; Xu, Z.Y.; Wang, S.S.; Pan, L.L.; Yuan, L.H. Diet, lifestyle and cognitive function in old Chinese adults. Arch. Gerontol. Geriat. 2016, 63, 36–42. [Google Scholar]
- Devlin, U.M.; McNulty, B.A.; Nugent, A.P.; Gibney, M.J. The use of cluster analysis to derive dietary patterns. Methodological considerations, reproducibility, validity and the effect of energy mis-reporting. Proc. Nutr. Soc. 2012, 71, 599–609. [Google Scholar] [CrossRef] [PubMed]
- Greenwood, D.C.; Cade, J.E.; Draper, A.; Barrett, J.H.; Calvert, C.; Greenhalgh, A. Seven unique food consumption patterns identified among women in the UK Women’s Cohort Study. Eur. J. Clin. Nutr. 2000, 54, 314–320. [Google Scholar] [CrossRef] [PubMed]
- Martikainen, P.; Brunner, E.; Marmot, M. Socioeconomic differences in dietary patterns among middle-aged men and women. Soc. Sci. Med. 2003, 56, 1397–1410. [Google Scholar] [CrossRef]
- Newby, P.; Tucker, K.L. Empirically derived eating patterns using factor or cluster analysis. A review. Nutr. Rev. 2004, 62, 177–203. [Google Scholar] [CrossRef] [PubMed]
- Walen, H.; Lachman, M. Social support and strain from partner, family, and friends, costs and benefits for men and women in adulthood. J. Soc. Pers. Relatsh. 2000, 17, 5–30. [Google Scholar] [CrossRef]
- Kim, Y. The dynamics of health and its determinants among the elderly in developing countries. Econ. Hum. Biol. 2015, 19, 1–12. [Google Scholar] [CrossRef] [PubMed]
- De Morais Sato, P.; da Rocha Pereira, P.; de Carvalho Stelmo, I.; Unsain, R.F.; Ulian, M.D.; Sabatini, F.; Martins, P.A.; Scagliusi, F.B. Eating practices and habitus in mothers. A Brazilian population-based survey. Appetite 2014, 82, 16–28. [Google Scholar] [CrossRef] [PubMed]
- Miller, C.K.; Gutschall, M.D.; Holloman, C. Self-monitoring predicts change in fiber intake and weight loss in adults with diabetes following an intervention regarding the glycemic index. Patient Educ. Couns. 2009, 76, 213–219. [Google Scholar] [CrossRef] [PubMed]
- Taylor, L.M.; Johnson, S.T.; Vallance, J.K.; Stadnyk, J.; Basualdo-Hammond, C. Food and physical activity behaviours of adults attending a prediabetes education class. Can. J. Diabetes 2014, 38, 432–438. [Google Scholar] [CrossRef] [PubMed]
- Campos, S.; Doxey, J.; Hammond, D. Nutrition labels on pre-packaged foods, a systematic review. Public Health Nutr. 2011, 14, 1496–1506. [Google Scholar] [CrossRef] [PubMed]
- Sabia, S.; Singh-Manoux, A.; Hagger-Johnson, G.; Cambois, E.; Brunner, E.J.; Kivimaki, M. Influence of individual and combined healthy behaviours on successful aging. Can. Med. Assoc. J. 2012, 184, 1985–1992. [Google Scholar] [CrossRef] [PubMed]
- Kim, C.O. Food choice patterns among frail older adults, the associations between social network, food choice values, and diet quality. Appetite 2016, 96, 116–121. [Google Scholar] [CrossRef] [PubMed]
- Lavigne-Robichaud, M.; Vermeer, A.; Azzi, S.; Blaine, S.; Whebby, B.; Barresi, T.; Comtois-Rousseau, É.; Giroux, I. Lessons learned from a type 2 diabetes prevention group program using a healthy lifestyle education approach. Can. J. Diabetes 2015, 39, S55. [Google Scholar] [CrossRef]
- Lewis, R.K.; Lasack, N.L.; Lambert, B.L.; Connor, S.E. Patient counseling-a focus on maintenance therapy. Am. J. Health. Syst. Pharm. 1997, 54, 2084–2098. [Google Scholar] [PubMed]
- Stam, D.M.; Graham, J.P. Important aspects of self-management education in patients with diabetes. Pharm. Pract. Manag. Q. 1997, 17, 12–25. [Google Scholar] [PubMed]
- Rashed, O.A.; Al Sabbah, H.; Younis, M.Z.; Kisa, A.; Parkash, J. Diabetes education program for people with type 2 diabetes, an international perspective. Eval. Progr. Plan. 2016, 56, 64–68. [Google Scholar] [CrossRef] [PubMed]
- Bibra, H.V.; Wulf, G.; Sutton, M.S.J.; Pfützner, A.; Schuster, T.; Heilmeyer, P. Low-carbohydrate/high-protein diet improves diastolic cardiac function and the metabolic syndrome in overweight-obese patients with type 2 diabetes. IJC Metab. Endocr. 2014, 2, 11–18. [Google Scholar] [CrossRef]
- Bondia-Pons, I.; Schroder, H.; Covas, M.-I.; Castellote, A.I.; Kaikkonen, J.; Poulsen, H.E.; Gaddi, A.V.; Machowetz, A.; Kiesewetter, H.; López-Sabater, M.C. Moderate consumption of olive oil by healthy European men reduces systolic blood pressure in non-Mediterranean participants. J. Nutr. 2007, 137, 84–87. [Google Scholar] [PubMed]
- Sánchez-Villegas, A.; Delgado-Rodríguez, M.; Alonso, A.; Schlatter, J.; Lahortiga, F.; Majem, L.S.; Martínez-González, M.A. Association of the Mediterranean dietary pattern with the incidence of depression, the Seguimiento Universidad de Navarra/University of Navarra follow-up (SUN) cohort. Arch. Gen. Psychiat. 2009, 66, 1090–1098. [Google Scholar] [CrossRef] [PubMed]
- Trichopoulou, A.; Bamia, C.; Trichopoulos, D. Mediterranean diet and survival among patients with coronary heart disease in Greece. Arch. Intern. Med. 2005, 165, 929–935. [Google Scholar] [CrossRef] [PubMed]
- Singh, B.; Parsaik, A.K.; Mielke, M.M.; Erwin, P.J.; Knopman, D.S.; Petersen, R.C.; Roberts, R.O. Association of mediterranean diet with mild cognitive impairment and Alzheimer’s disease, a systematic review and meta-analysis. J. Alzheimers Dis. 2014, 39, 271–282. [Google Scholar] [PubMed]
- Lynch, E.B.; Liebman, R.; Ventrelle, J.; Keim, K.; Appelhans, B.M.; Avery, E.F.; Tahsin, B.; Li, H.; Shapera, M.; Fogelfeld, L. Design of the Lifestyle Improvement through Food and Exercise (LIFE) study, a randomized controlled trial of self-management of type 2 diabetes among African American patients from safety net health centers. Contemp. Clin. Trials 2014, 39, 246–255. [Google Scholar] [CrossRef] [PubMed]


| Intervention | ||||||
|---|---|---|---|---|---|---|
| Group A | Group B | Group C | ||||
| Food Item (g/day) | Baseline | Post-Intervention | Baseline | Post-Intervention | Baseline | Post-Intervention |
| Oil | 30.54 (16.4) | 22.31 (8.6) a | 29.11 (16.4) | 24.07 (10.9) | 29.07 (11.3) | 24.51 (8.6) |
| Salt | 6.79 (3.8) | 4.58 (1.8) | 7.07 (3.5) | 5.87 (0.9) | 6.31 (3.0) | 6.10 (1.3) |
| Rice | 107.06 (88.9) | 135.30 (64.8) | 127.83 (66.2) | 131.13 (70.9) | 113.12 (89.7) | 136.67 (66.6) |
| Wheat | 110.75 (78.8) | 132.08 (84.5) | 115.98 (99.3) | 142.83 (86.3) | 119.46 (58.6) | 114.08 (49.9) |
| Whole grain | 84.49 (60.1) | 86.04 (59.0) | 90.4 (69.1) | 74.08 (34.3) | 87.33 (57.2) | 89.28 (51.3) |
| Vegetable | 514.30 (265.6) | 496.39 (74.4) | 452.78 (159.0) | 505.28 (185.8) | 501.58 (356.2) | 566.00 (234.0) |
| Fruit | 142.20 (123.5) | 157.1 (98.6) | 105.38 (78.2) | 128.62 (70.1) | 153.32 (70.2) | 188.00 (70.2) |
| Red meat | 68.63 (38.4) | 71.08 (48.5) | 58.86 (25.4) | 66.52 (39.5) | 62.33 (45.5) | 62.35 (30.4) |
| Poultry | 21.96 (20.3) | 56.00 (41.6) | 21.85 (11.3) | 49.75 (23.8) | 22.44 (22.0) | 54.88 (24.8) |
| Fish | 39.43 (22.4) | 64.13 (42.3) | 54.65 (47.7) | 66.81 (36.9) | 52.75 (44.8) | 75.00 (53.6) |
| Egg | 50.71 (24.2) | 60.75 (31.7) | 59.93 (32.0) | 50.18 (23.1) | 64.34 (33.5) | 58.33 (21.7) |
| Dairy | 187.99 (112.0) | 188.85 (94.5) | 153.9 (86.7) | 211.42 (58.4) | 200.83 (81.2) | 218.67 (68.5) |
| Bean | 52.83 (42.5) | 54.9 (35.7) | 45.61 (35.7) | 47.68 (26.3) | 47.29 (33.6) | 48.78 (30.4) |
| Oat | 0 | 0 | 0 | 50 a,b,c | 0 | 100 a,b,d |
| Intervention | ||||||
|---|---|---|---|---|---|---|
| Group A | Group B | Group C | ||||
| Nutrition | Baseline | Post-Intervention | Baseline | Post-Intervention | Baseline | Post-Intervention |
| Energy (kcal/day) | 2596.08 (964.9) | 2480.00 (776.8) | 2320.00 (886.0) | 2225.00 (475.9) | 2410.50 (709.5) | 2315.10 (314.8) |
| Protein (g/day) | 90.61 (30.5) | 96.70 (32.1) | 81.53 (39.1) | 85.04 (25.8) | 81.45 (23.6) | 99.32 (25.4) |
| Protein energize | 14.18% | 15.80% | 14.20% | 15.51% | 13.70% | 17.40% |
| Fat (g/day) | 78.51 (30.5) | 72.24 (24.6) | 75.87 (24.9) | 66.89 (17.4) | 70.56 (20.5) | 68.93 (14.2) |
| Fat energize | 27.47% | 27.45% | 29.7% | 27.30% | 26.60% | 27.00% |
| Carbohydrate (g/day) | 363.54 (135.6) | 355.61 (104.4) | 347.41 (118.8) | 338.81 (75.8) | 364.57 (120.2) | 347.00 (54.1) |
| Carbohydrate energize | 56.90% | 58.10% | 60.80% | 61.20% | 61.45% | 60.90% |
| Total fiber (g/day) | 39.90 (12.3) | 41.39 (12.2) | 38.54 (21.4) | 41.40 (7.6) | 38.86 (9.9) | 44.85 (14.9) |
| Fiber from oats (g/day) | 0 | 0 | 0 | 2.65 a,b,c | 0 | 5.3 a,b,d |
| Food Item | Factors | |||||
|---|---|---|---|---|---|---|
| Factor 1 | Factor 2 | Factor 3 | Factor 4 | Factor 5 | Factor 6 | |
| Non-Staple Food | Meal Replacement Food | Staple Food | Soup Food | High Protein Food | Pastry Food | |
| Red meat | 0.776 | 0.016 | 0.069 | 0.053 | 0.167 | −0.222 |
| Poultry | 0.727 | −0.126 | 0.201 | −0.142 | 0.118 | 0.170 |
| Fruit | 0.581 | 0.330 | −0.260 | −0.077 | −0.261 | −0.071 |
| Fish | 0.481 | −0.027 | 0.447 | 0.132 | 0.305 | 0.182 |
| Whole Grain | 0.004 | 0.754 | 0.113 | −0.180 | −0.043 | 0.084 |
| Vegetable | −0.066 | 0.654 | −0.105 | 0.311 | 0.271 | 0.130 |
| Rice | −0.040 | 0.029 | 0.768 | 0.163 | −0.321 | −0.178 |
| Bean | 0.137 | 0.072 | 0.657 | −0.093 | 0.217 | 0.105 |
| Salt | 0.138 | 0.228 | 0.238 | 0.741 | −0.068 | −0.187 |
| Oats | −0.144 | −0.151 | −0.091 | 0.719 | −0.012 | 0.105 |
| Dairy | 0.003 | 0.007 | 0.042 | −0.157 | 0.752 | −0.190 |
| Egg | 0.335 | 0.138 | −0.013 | 0.141 | 0.558 | 0.146 |
| Oil | 0.048 | 0.201 | 0.075 | 0.025 | −0.052 | 0.782 |
| Wheat | 0.203 | 0.499 | 0.172 | 0.116 | 0.023 | −0.538 |
| Dietary Patterns | |||||
|---|---|---|---|---|---|
| Pattern 1 | Pattern 2 | Pattern 3 | Pattern 4 | Pattern 5 | Pattern 6 |
| Traditional Diet | Vegetarian Diet | Japanese Diet | Low Energy Diet | Healthy Diet | Monotonous Diet |
| Red meat | Fruit | Red meat | Vegetable | Fruit | Red meat |
| Poultry | Whole Grain | Fruit | Salt | Fish | Oil |
| Fruit | Vegetable | Fish | Oats | Vegetable | Wheat |
| Fish | Salt | Rice | Rice | ||
| Egg | Oil | Bean | Bean | ||
| Wheat | Wheat | Salt | Dairy | ||
| Vegetable | Egg | ||||
| Diet | Score | Food Items (g/day) | Energy (kcal) |
|---|---|---|---|
| Traditional diet | 79.76 | cereal: 335, tuber: 65, meat: 274, fish: 96, egg: 51, milk: 188, bean: 34, vegetable: 528, fruit: 214, oil: 23 | 2556.6 |
| Vegetarian diet | 81.08 | cereal: 392, tuber: 74, meat: 140, fish: 71, egg: 40, milk: 176, bean: 39, vegetable: 599, fruit: 200, oil: 23 | 2170.5 |
| Japanese diet | 82.52 | cereal: 368, tuber: 53, meat: 164, fish: 94, egg: 41, milk: 163, bean: 58, vegetable: 428, fruit: 122, oil: 27 | 2236.4 |
| Low energy diet | 81.03 | cereal: 310, tuber: 67, meat: 149, fish: 67, egg: 45, milk: 150, bean: 25, vegetable: 545, fruit: 127, oil: 25 | 2114.1 |
| Healthy diet | 81.27 | cereal: 282, tuber: 79, meat: 171, fish: 71, egg: 58, milk: 224, bean: 41, vegetable: 642, fruit: 124, oil: 23 | 2241.0 |
| Monotonous diet | 78.08 | cereal: 329, tuber: 69, meat: 155, fish: 62, egg: 49, milk: 165, bean: 34, vegetable: 559, fruit: 156, oil: 42 | 2403.0 |
| Variables | Dietary Patterns | ||||||||||||||||||||||||||||
|---|---|---|---|---|---|---|---|---|---|---|---|---|---|---|---|---|---|---|---|---|---|---|---|---|---|---|---|---|---|
| Pattern 2 a Vegetarian Diet | Pattern 3 Japanese Diet | Pattern 4 Low Energy Diet | Pattern 5 Healthy Diet | Pattern 6 Monotonous Diet | |||||||||||||||||||||||||
| p | OR | 95% CI | p | OR | 95% CI | p | OR | 95% CI | p | OR | 95% CI | p | OR | 95% CI | |||||||||||||||
| Gender | |||||||||||||||||||||||||||||
| Female | 0.782 | 1.19 | 0.35–3.94 | 0.752 | 1.22 | 0.36–4.10 | 0.988 | 1.01 | 0.29–3.51 | 0.300 | 1.82 | 0.59–5.69 | 0.430 | 1.63 | 0.48–5.48 | ||||||||||||||
| Male | 1 b | 1 | 1 | 1 | 1 | ||||||||||||||||||||||||
| Age (year) | |||||||||||||||||||||||||||||
| 51–60 | 0.528 | 0.38 | 0.02–7.73 | 0.011 | 0.032 | 0.02–0.45 | 0.155 | 0.14 | 0.01–2.13 | 0.009 | 0.042 | 0.01–0.45 | 0.428 | 0.29 | 0.01–6.08 | ||||||||||||||
| 61–69 | 0.619 | 0.47 | 0.02–9.04 | 0.135 | 0.164 | 0.15–1.76 | 0.617 | 0.52 | 0.04–6.61 | 0.017 | 0.061 | 0.01–0.60 | 0.815 | 0.70 | 0.04–13.21 | ||||||||||||||
| >70 | 1 c | 1 | 1 | 1 | 1 | ||||||||||||||||||||||||
| Education | |||||||||||||||||||||||||||||
| Illiteracy | 0.504 | 2.54 | 0.16–39.26 | 0.812 | 0.68 | 0.03–16.39 | 0.986 | 0.01 | 0.01–0.04 | 0.413 | 0.27 | 0.01–6.15 | 0.246 | 7.19 | 0.26–201.7 | ||||||||||||||
| Primary school | 0.892 | 0.87 | 0.12–6.50 | 0.846 | 0.80 | 0.09–7.24 | 0.325 | 0.25 | 0.02–3.90 | 0.113 | 0.19 | 0.02–1.48 | 0.230 | 5.24 | 0.36–78.53 | ||||||||||||||
| Middle school | 0.643 | 0.66 | 0.12–3.73 | 0.721 | 1.34 | 0.26–6.80 | 0.777 | 0.79 | 0.15–4.10 | 0.089 | 0.29 | 0.06–1.22 | 0.046 | 11.44 | 1.04–125.2 | ||||||||||||||
| High school | 0.406 | 0.51 | 0.10–2.52 | 0.821 | 0.84 | 0.18–4.00 | 0.300 | 0.42 | 0.08–2.15 | 0.015 | 0.18 | 0.04–0.72 | 0.192 | 4.77 | 0.46–49.90 | ||||||||||||||
| >College | 1 d | 1 | 1 | 1 | 1 | ||||||||||||||||||||||||
| Group | |||||||||||||||||||||||||||||
| Group A | 0.409 | 1.98 | 0.39–10.04 | 0.492 | 0.59 | 0.13–2.65 | 0.970 | 0.01 | 0.01–0.09 | 0.458 | 1.75 | 0.40–7.68 | 0.407 | 0.513 | 0.11–2.49 | ||||||||||||||
| Group B | 0.253 | 2.68 | 0.49–14.58 | 0.663 | 1.39 | 0.32–6.00 | 0.013 | 0.13 | 0.03–1.65 | 0.179 | 2.80 | 0.62–12.58 | 0.160 | 2.88 | 0.66–12.61 | ||||||||||||||
| Group C | 1 e | 1 | 1 | 1 | 1 | ||||||||||||||||||||||||
| Varibles | 2h-PG Reduction Level a | ||||||||||||||||||||||||||||||||||||||||||
|---|---|---|---|---|---|---|---|---|---|---|---|---|---|---|---|---|---|---|---|---|---|---|---|---|---|---|---|---|---|---|---|---|---|---|---|---|---|---|---|---|---|---|---|
| Level b 0 | Level 1 | Level 2 | Level 3 | Level 4 | |||||||||||||||||||||||||||||||||||||||
| p | OR | 95% CI | p | OR | 95% CI | p | OR | 95% CI | p | OR | 95% CI | p | OR | 95% CI | |||||||||||||||||||||||||||||
| Gender | |||||||||||||||||||||||||||||||||||||||||||
| Female | 0.017 | 0.20 | 0.05–0.75 | 0.049 | 0.29 | 0.09–0.99 | 0.042 | 0.33 | 0.12–0.96 | 0.020 | 0.14 | 0.04–0.49 | 0.96 | 0.97 | 0.25–3.77 | ||||||||||||||||||||||||||||
| Male | 1 c | 1 | 1 | 1 | 1 | ||||||||||||||||||||||||||||||||||||||
| Age (year) | |||||||||||||||||||||||||||||||||||||||||||
| 51–60 | 0.207 | 5.62 | 0.29–81.78 | 0.415 | 0.42 | 0.05–3.44 | 0.551 | 1.84 | 0.25–13.78 | 0.681 | 1.58 | 0.18–13.86 | 0.681 | 0.65 | 0.08–5.00 | ||||||||||||||||||||||||||||
| 61–69 | 0.732 | 1.54 | 0.13–18.27 | 0.345 | 0.43 | 0.07–2.48 | 0.931 | 1.08 | 0.18–6.44 | 0.817 | 0.80 | 0.13–5.08 | 0.226 | 0.34 | 0.06–1.94 | ||||||||||||||||||||||||||||
| >70 | 1 d | 1 | 1 | 1 | 1 | ||||||||||||||||||||||||||||||||||||||
| Education | |||||||||||||||||||||||||||||||||||||||||||
| Illiteracy | 0.460 | 3.52 | 0.12–99.51 | 0.999 | 0.01 | 0.01–0.56 | 0.257 | 4.26 | 0.28–64.93 | 0.277 | 5.16 | 0.27–99.47 | 0.110 | 0.01 | 0.01–0.09 | ||||||||||||||||||||||||||||
| Primary school | 0.998 | 0.01 | 0.01–0.12 | 0.983 | 1.02 | 0.12–8.59 | 0.759 | 1.29 | 0.25–6.72 | 0.542 | 1.81 | 0.27–12.28 | 0.998 | 0.01 | 0.01–0.07 | ||||||||||||||||||||||||||||
| Middle school | 0.651 | 1.49 | 0.26–8.52 | 0.437 | 1.81 | 0.40–8.15 | 0.548 | 0.65 | 0.16–2.64 | 0.970 | 1.03 | 0.22–4.71 | 0.110 | 3.89 | 0.73–22.60 | ||||||||||||||||||||||||||||
| High school | 0.276 | 2.62 | 0.46–14.84 | 0.317 | 2.23 | 0.46–10.77 | 0.248 | 2.16 | 0.58–8.00 | 0.993 | 1.00 | 0.19–5.36 | 0.126 | 3.76 | 0.69–20.53 | ||||||||||||||||||||||||||||
| >College | 1 e | 1 | 1 | 1 | 1 | ||||||||||||||||||||||||||||||||||||||
| Group | |||||||||||||||||||||||||||||||||||||||||||
| Group A | 0.857 | 1.17 | 0.22–6.34 | 0.125 | 3.83 | 0.69–21.37 | 0.222 | 2.41 | 0.59–9.93 | 0.480 | 1.77 | 0.36–8.67 | 0.357 | 2.28 | 0.39–13.21 | ||||||||||||||||||||||||||||
| Group B | 0.476 | 0.54 | 0.10–2.99 | 0.576 | 1.60 | 0.31–8.43 | 0.579 | 1.45 | 0.39–5.32 | 0.770 | 0.80 | 0.16–3.66 | 0.390 | 2.07 | 0.39–10.83 | ||||||||||||||||||||||||||||
| Group C | 1 f | 1 | 1 | 1 | 1 | ||||||||||||||||||||||||||||||||||||||
| Diet | |||||||||||||||||||||||||||||||||||||||||||
| Diet 1 | 0.327 | 0.29 | 0.03–3.38 | 0.950 | 0.93 | 0.10–8.50 | 0.189 | 0.32 | 0.06–1.76 | 0.191 | 0.25 | 0.03–2.01 | 0.426 | 0.35 | 0.03–4.56 | ||||||||||||||||||||||||||||
| Diet 2 | 0.211 | 5.35 | 0.39–73.90 | 0.487 | 2.60 | 0.18–38.46 | 0.723 | 0.67 | 0.07–6.18 | 0.854 | 0.78 | 0.06–10.75 | 0.508 | 2.68 | 0.14–49.83 | ||||||||||||||||||||||||||||
| Diet 3 | 0.512 | 0.45 | 0.04–5.00 | 0.145 | 0.11 | 0.01–2.11 | 0.017 | 0.09 | 0.01–0.65 | 0.146 | 0.19 | 0.02–1.76 | 0.988 | 1.02 | 0.10–9.91 | ||||||||||||||||||||||||||||
| Diet 4 | 0.351 | 0.28 | 0.02–4.00 | 0.800 | 1.37 | 0.12–15.23 | 0.341 | 0.40 | 0.06–2.66 | 0.204 | 0.22 | 0.02–2.68 | 0.368 | 0.25 | 0.01–5.06 | ||||||||||||||||||||||||||||
| Diet 5 | 0.552 | 0.45 | 0.03–6.20 | 0.725 | 0.65 | 0.06–7.12 | 0.078 | 0.18 | 0.03–1.21 | 0.607 | 0.58 | 0.07–4.63 | 0.757 | 1.45 | 0.14–15.17 | ||||||||||||||||||||||||||||
| Diet 6 | 1 g | 1 | 1 | 1 | 1 | ||||||||||||||||||||||||||||||||||||||
| Varibles | FPG Reduction Level a | ||||||||||||||||||||||||||||||||||||||||||
|---|---|---|---|---|---|---|---|---|---|---|---|---|---|---|---|---|---|---|---|---|---|---|---|---|---|---|---|---|---|---|---|---|---|---|---|---|---|---|---|---|---|---|---|
| Level b 0 | Level 1 | Level 2 | Level 3 | Level 5 | |||||||||||||||||||||||||||||||||||||||
| p | OR | 95% CI | p | OR | 95% CI | p | OR | 95% CI | p | OR | 95% CI | p | OR | 95% CI | |||||||||||||||||||||||||||||
| Gender | |||||||||||||||||||||||||||||||||||||||||||
| Female | 0.232 | 0.35 | 0.06–1.97 | 0.250 | 0.37 | 0.07–2.02 | 0.240 | 0.37 | 0.07–1.96 | 0.561 | 0.59 | 0.10–3.45 | 0.276 | 4.54 | 0.29–69.11 | ||||||||||||||||||||||||||||
| Male | 1 c | 1 | 1 | 1 | 1 | ||||||||||||||||||||||||||||||||||||||
| Age (year) | |||||||||||||||||||||||||||||||||||||||||||
| 51–60 | 0.023 | 67.31 | 1.80–251.3 | 0.392 | 4.04 | 0.16–98.90 | 0.057 | 20.29 | 0.92–448.3 | 0.197 | 8.95 | 0.32–250.0 | 0.182 | 16.31 | 0.27–982.7 | ||||||||||||||||||||||||||||
| 61–69 | 0.069 | 13.75 | 0.80–232.5 | 0.744 | 1.43 | 0.15–13.75 | 0.310 | 3.08 | 0.35–26.84 | 0.226 | 4.13 | 0.42–41.06 | 0.388 | 4.34 | 0.15–127.8 | ||||||||||||||||||||||||||||
| >70 | 1 d | 1 | 1 | 1 | 1 | ||||||||||||||||||||||||||||||||||||||
| Education | |||||||||||||||||||||||||||||||||||||||||||
| Illiteracy | 0.994 | 23.52 | 0.01–0.51 | 1.000 | 2.50 | 0.01–0.06 | 0.994 | 11.2 | 0.08–9.93 | 0.993 | 25.16 | 0.07–19.47 | 0.994 | 14.85 | 0.01–9.09 | ||||||||||||||||||||||||||||
| Primary school | 0.715 | 1.70 | 0.10–29.76 | 0.746 | 1.59 | 0.10–26.36 | 0.850 | 0.08 | 0.08–20.17 | 0.301 | 5.25 | 0.23–119.1 | 0.816 | 1.52 | 0.05–51.18 | ||||||||||||||||||||||||||||
| Middle school | 0.830 | 1.26 | 0.15–10.88 | 0.852 | 1.22 | 0.15–9.60 | 0.991 | 0.13 | 0.13–7.50 | 0.074 | 8.08 | 0.82–79.91 | 0.288 | 4.05 | 0.31–53.62 | ||||||||||||||||||||||||||||
| High school | 0.605 | 1.78 | 0.20–15.87 | 0.960 | 0.95 | 0.11–8.42 | 0.578 | 0.23 | 0.23–13.95 | 0.103 | 7.11 | 0.67–75.08 | 0.986 | 23.83 | 0.69–120.5 | ||||||||||||||||||||||||||||
| >College | 1 e | 1 | 1 | 1 | 1 | ||||||||||||||||||||||||||||||||||||||
| Group | |||||||||||||||||||||||||||||||||||||||||||
| Group A | 0.593 | 1.72 | 0.23–13.10 | 0.05 | 7.50 | 0.99–58.96 | 0.149 | 4.07 | 0.60–27.41 | 0.947 | 1.08 | 0.12–9.75 | 0.771 | 1.53 | 0.09–27.00 | ||||||||||||||||||||||||||||
| Group B | 0.427 | 2.18 | 0.32–14.95 | 0.27 | 2.99 | 0.43–20.79 | 0.141 | 3.86 | 0.64–24.32 | 0.178 | 3.80 | 0.54–26.44 | 0.360 | 3.49 | 0.24–50.49 | ||||||||||||||||||||||||||||
| Group C | 1 f | 1 | 1 | 1 | 1 | ||||||||||||||||||||||||||||||||||||||
| Diet | |||||||||||||||||||||||||||||||||||||||||||
| Diet 1 | 0.759 | 1.52 | 0.11–21.65 | 0.736 | 0.66 | 0.06–7.23 | 0.706 | 0.64 | 0.06–6.53 | 0.939 | 0.11 | 0.07–16.89 | 0.444 | 3.82 | 0.12–118.7 | ||||||||||||||||||||||||||||
| Diet 2 | 0.164 | 9.98 | 0.39–254.5 | 0.947 | 0.89 | 0.04–21.74 | 0.732 | 1.70 | 0.08–36.07 | 0.904 | 0.26 | 0.03–54.40 | 0.532 | 3.80 | 0.06–250.0 | ||||||||||||||||||||||||||||
| Diet 3 | 0.800 | 1.45 | 0.08–26.14 | 0.019 | 0.08 | 0.03–0.90 | 0.735 | 0.65 | 0.05–7.88 | 0.227 | 5.13 | 0.36–72.68 | 0.590 | 2.64 | 0.08–90.03 | ||||||||||||||||||||||||||||
| Diet 4 | 0.990 | 0.88 | 0.01–0.10 | 0.990 | 0.01 | 0.02–0.23 | 0.990 | 70.60 | 0.96–49.66 | 0.989 | 35.43 | 0.02–0.68 | 0.990 | 24.6 | 0.21–345.0 | ||||||||||||||||||||||||||||
| Diet 5 | 0.149 | 10.88 | 0.43–277.4 | 0.622 | 2.16 | 0.10–46.33 | 0.418 | 3.40 | 0.18–65.83 | 0.050 | 1.52 | 0.15–0.94 | 0.559 | 3.54 | 0.05–246.4 | ||||||||||||||||||||||||||||
| Diet 6 | 1 g | 1 | 1 | 1 | 1 | ||||||||||||||||||||||||||||||||||||||
© 2016 by the authors; licensee MDPI, Basel, Switzerland. This article is an open access article distributed under the terms and conditions of the Creative Commons Attribution (CC-BY) license (http://creativecommons.org/licenses/by/4.0/).
Share and Cite
Fan, R.; Xu, M.; Wang, J.; Zhang, Z.; Chen, Q.; Li, Y.; Gu, J.; Cai, X.; Guo, Q.; Bao, L.; et al. Sustaining Effect of Intensive Nutritional Intervention Combined with Health Education on Dietary Behavior and Plasma Glucose in Type 2 Diabetes Mellitus Patients. Nutrients 2016, 8, 560. https://doi.org/10.3390/nu8090560
Fan R, Xu M, Wang J, Zhang Z, Chen Q, Li Y, Gu J, Cai X, Guo Q, Bao L, et al. Sustaining Effect of Intensive Nutritional Intervention Combined with Health Education on Dietary Behavior and Plasma Glucose in Type 2 Diabetes Mellitus Patients. Nutrients. 2016; 8(9):560. https://doi.org/10.3390/nu8090560
Chicago/Turabian StyleFan, Rui, Meihong Xu, Junbo Wang, Zhaofeng Zhang, Qihe Chen, Ye Li, Jiaojiao Gu, Xiaxia Cai, Qianying Guo, Lei Bao, and et al. 2016. "Sustaining Effect of Intensive Nutritional Intervention Combined with Health Education on Dietary Behavior and Plasma Glucose in Type 2 Diabetes Mellitus Patients" Nutrients 8, no. 9: 560. https://doi.org/10.3390/nu8090560