

The Effect of Probiotic Supplements on Metabolic Parameters of People with Type 2 Diabetes in Greece—A Randomized, Double-Blind, Placebo-Controlled Study


 ,
,  ,
,  and
and Highlights
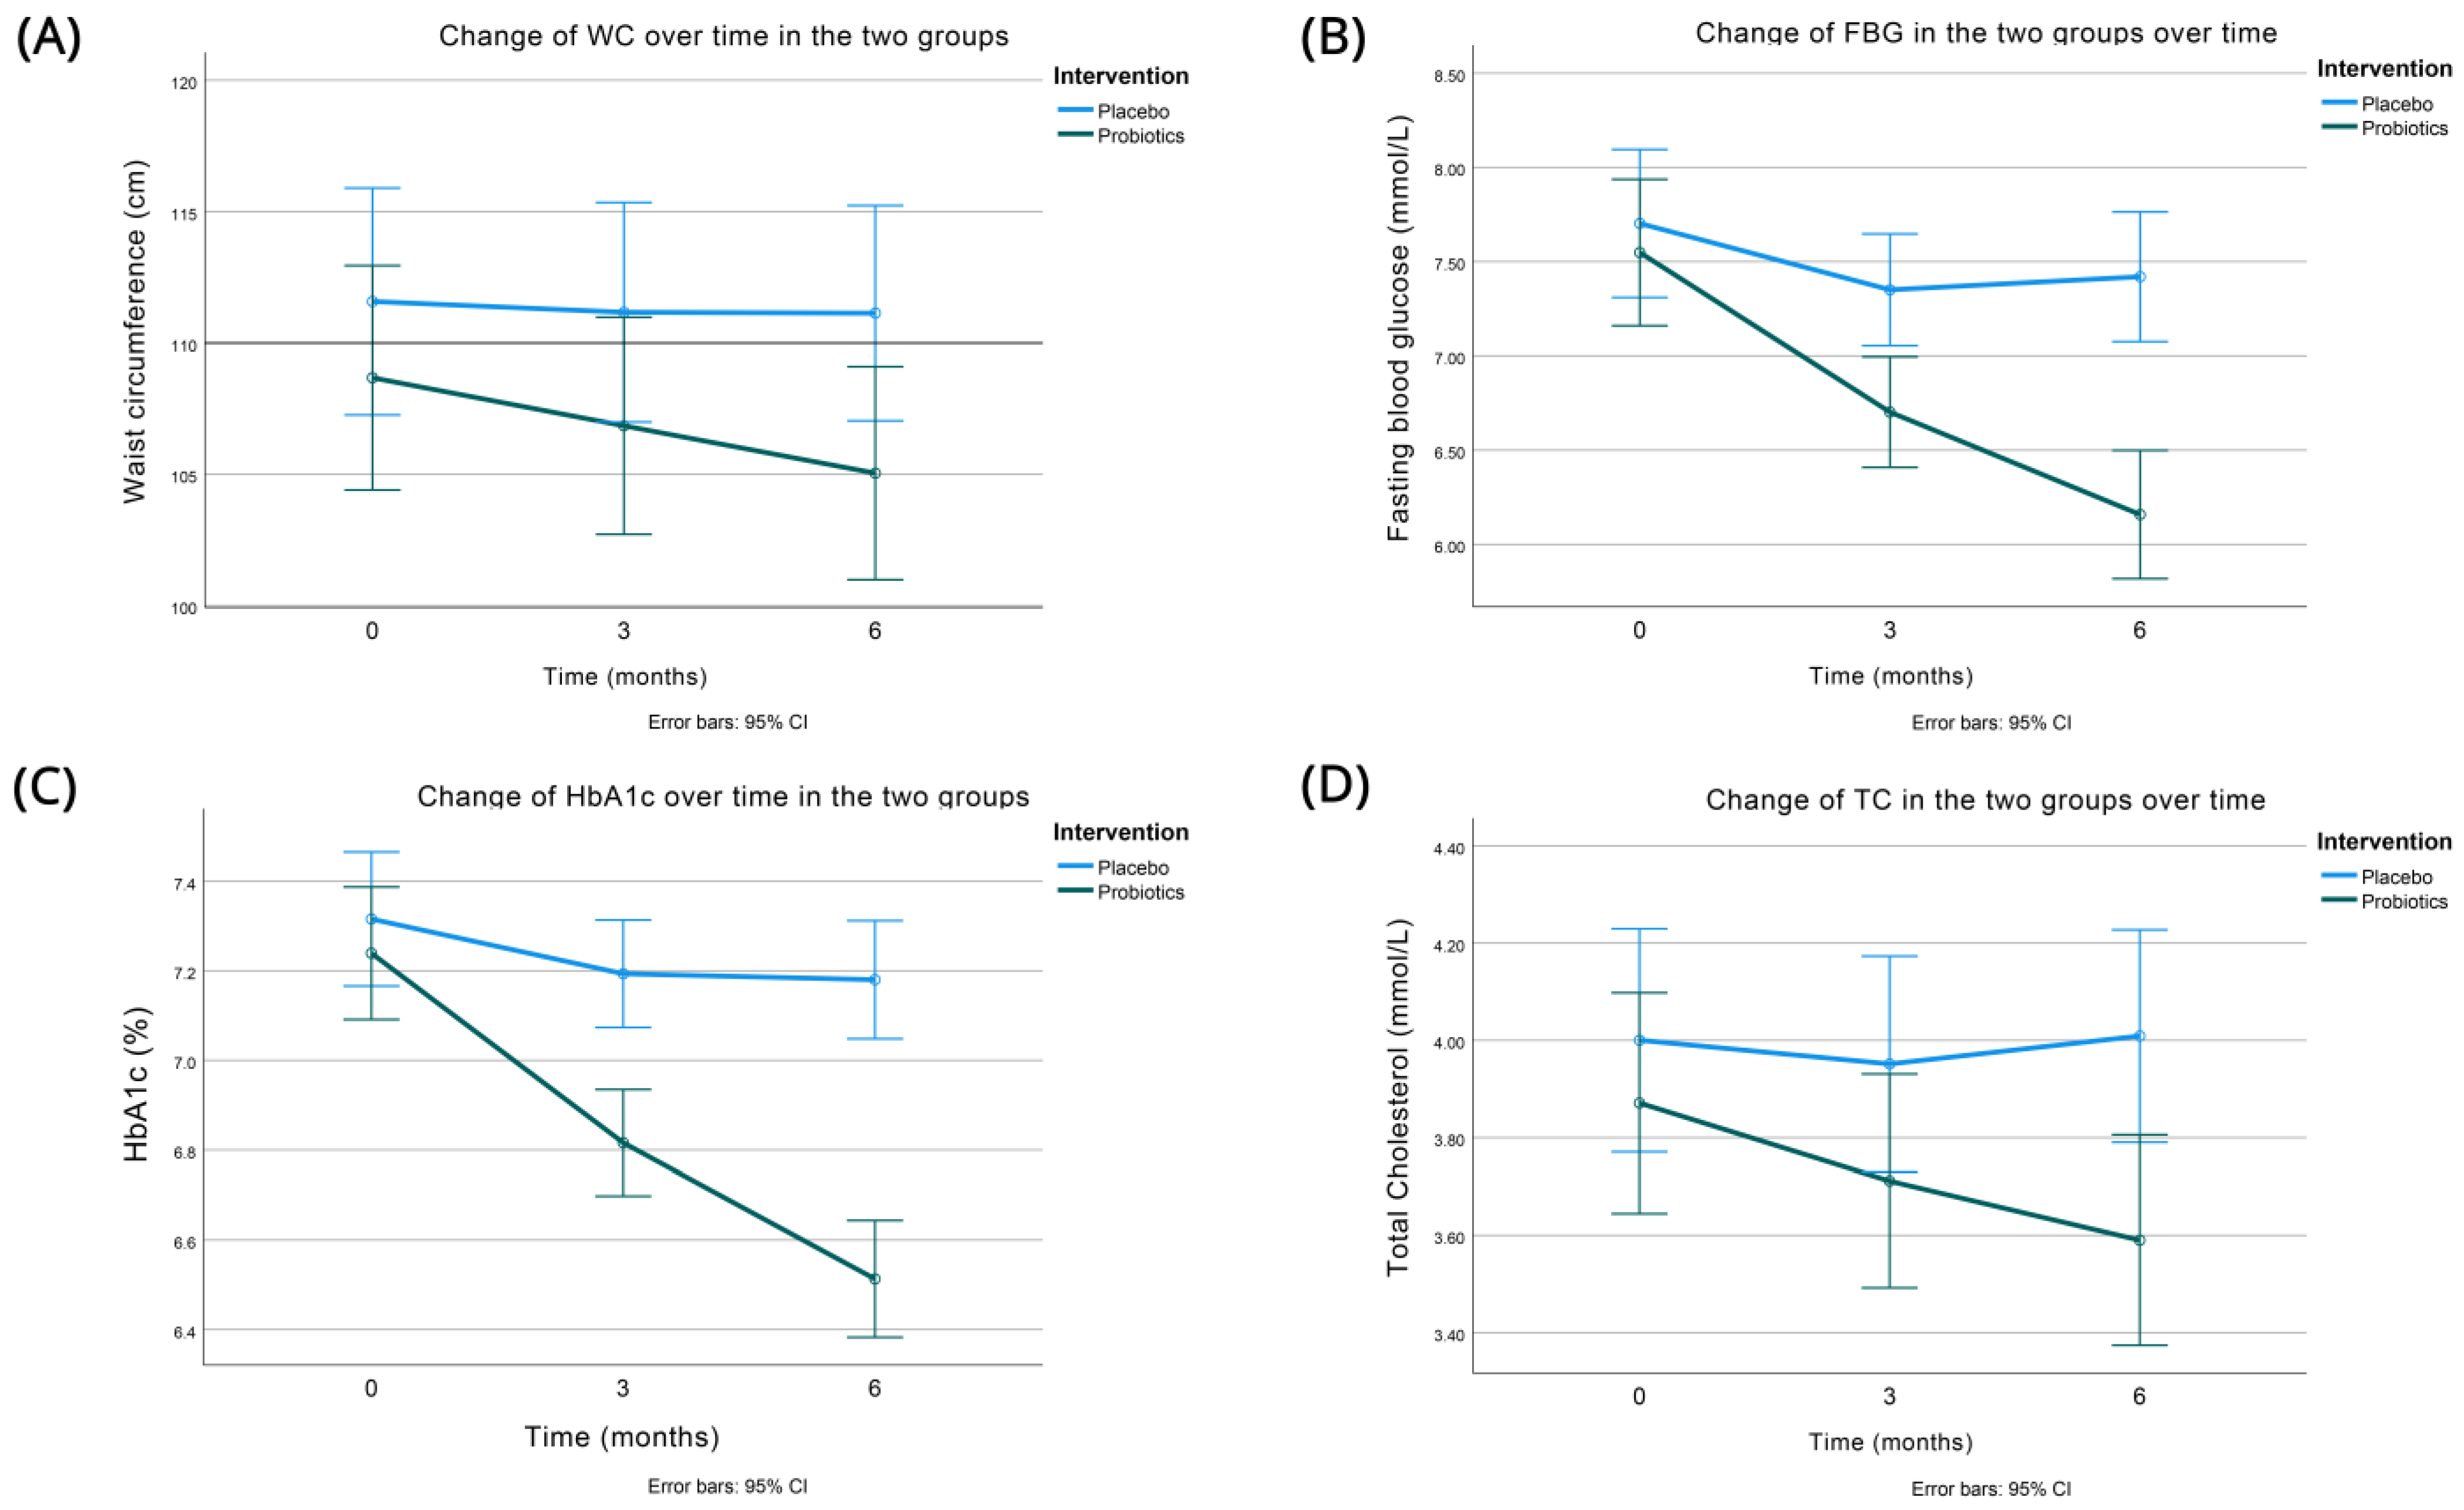
- Significant reduction in obesity (reductions remained significant even after controlling for the greater decrease in adiposity in the probiotics group measured as a decrease in waist circumference);
- HbA1c: significant reduction (0.59%)/6 months with oral probiotic capsule once daily (p < 0.001)—HbA1c change > 0.5% considered as clinically significant;
- FBG-TC: significant reduction/6 months—the positive effect of probiotics on FBG was more marked in participants with less controlled glycemia at baseline.
- The main finding highlighted that the administration of the multi-strain probiotic LactoLevureR over a 6-month period in individuals with T2D was well tolerated and had a positive impact on both glycemic and lipid parameters, alongside led to improvements in indices of adiposity.
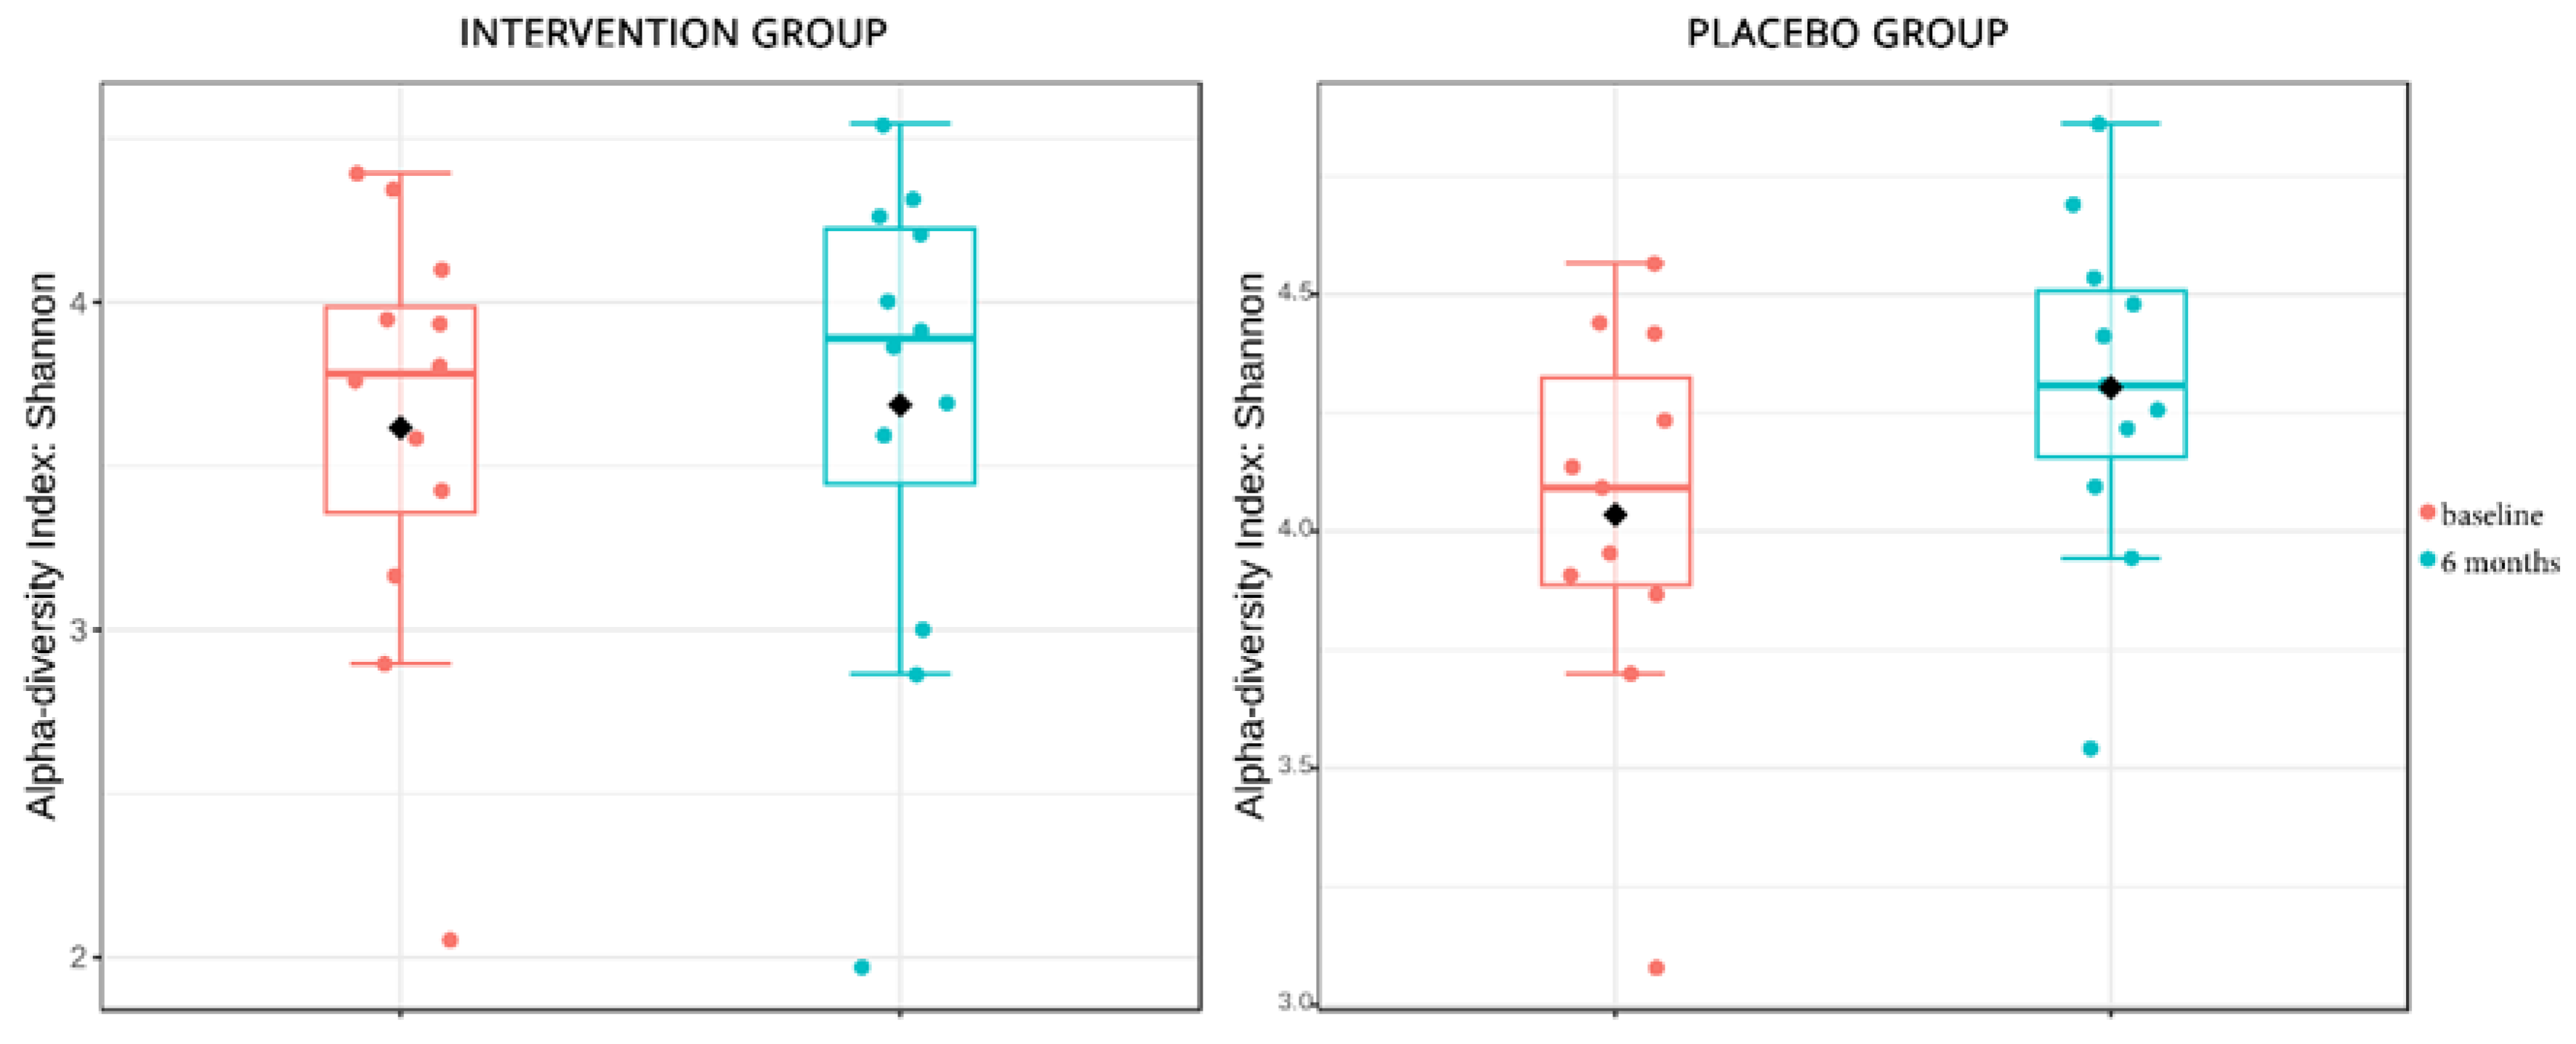
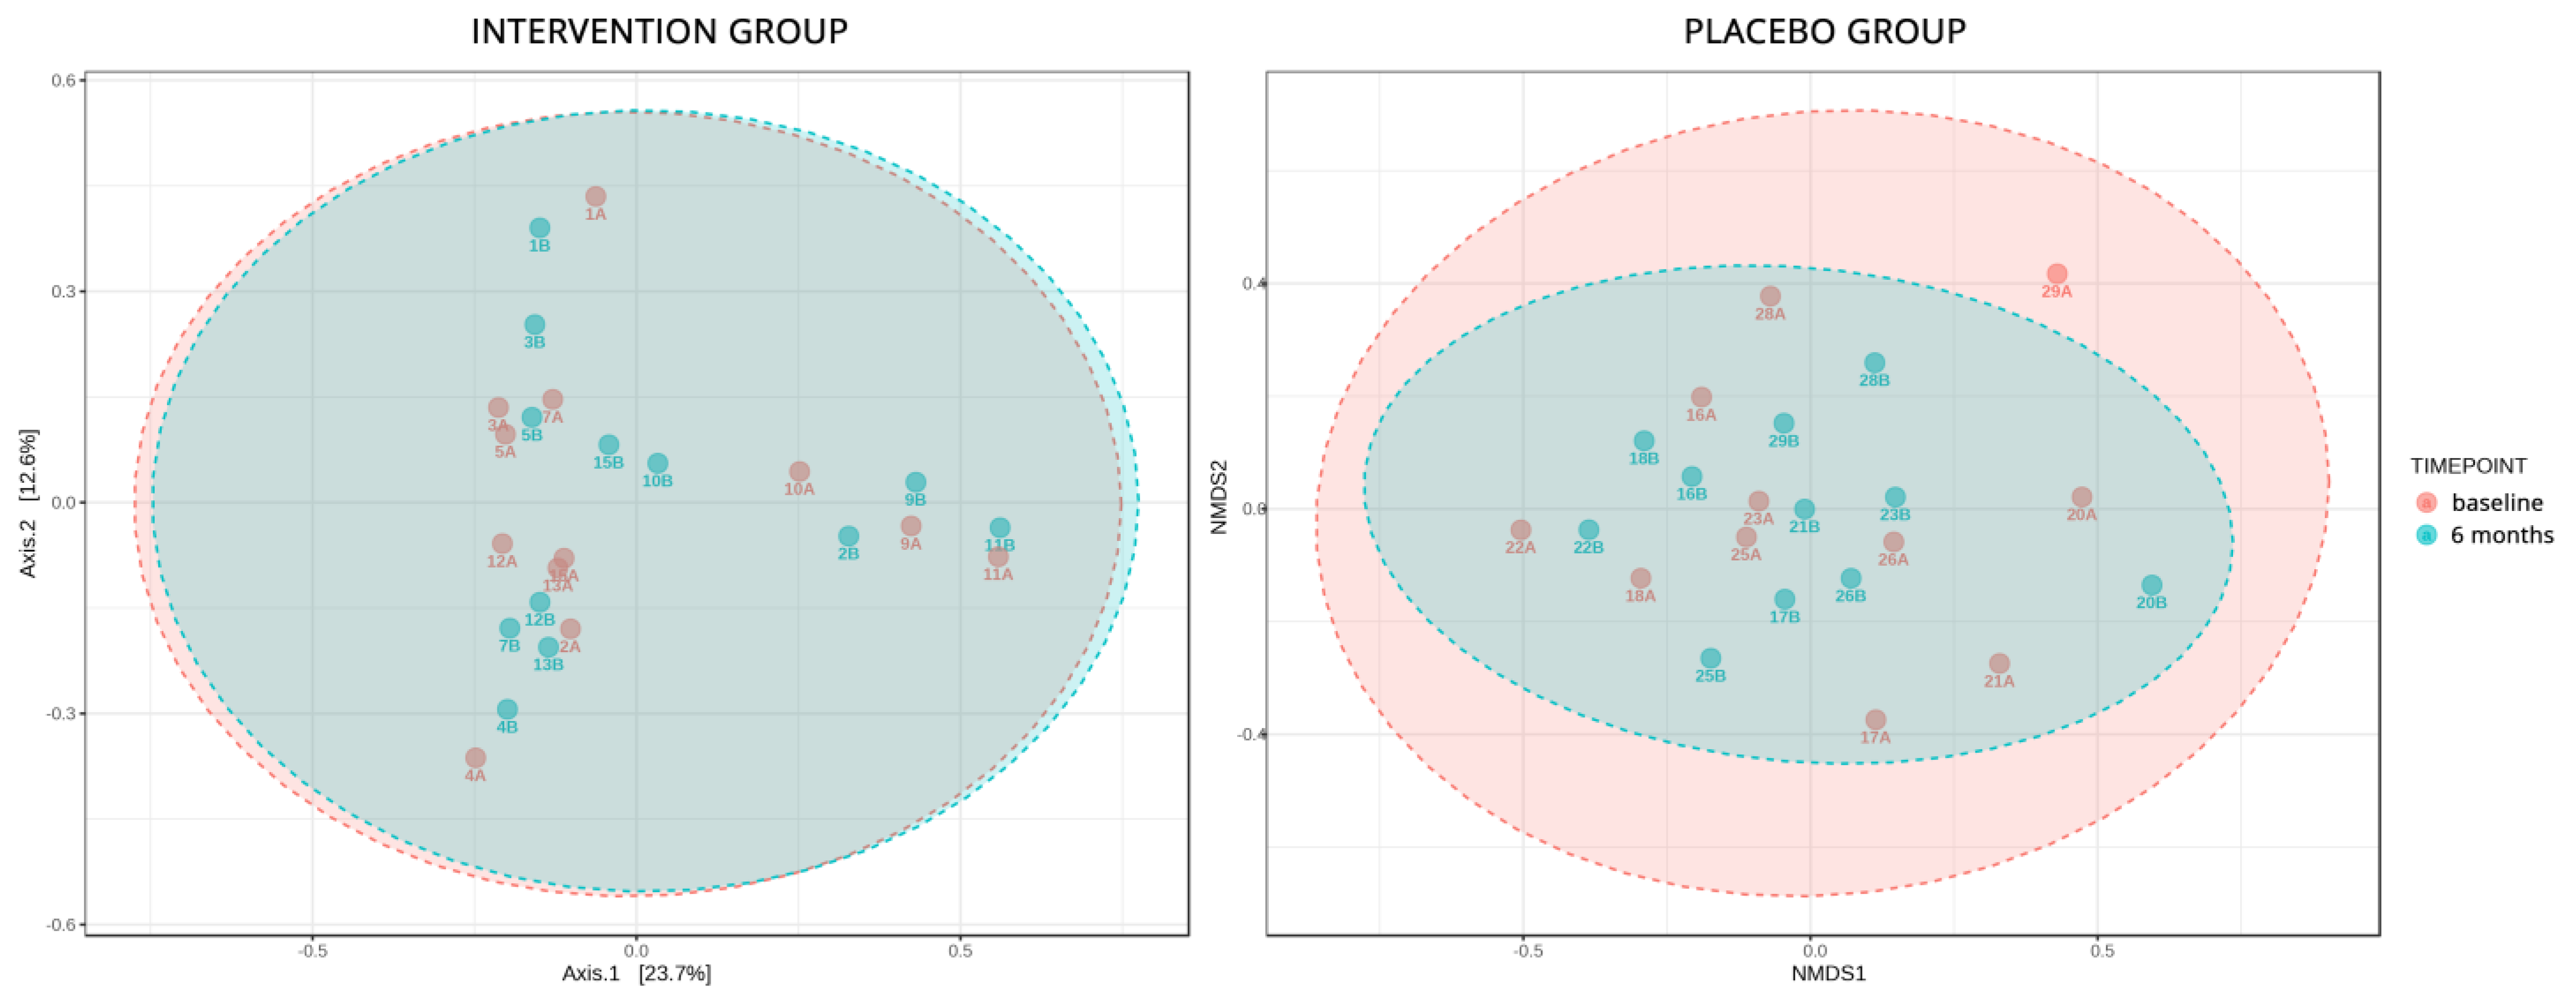
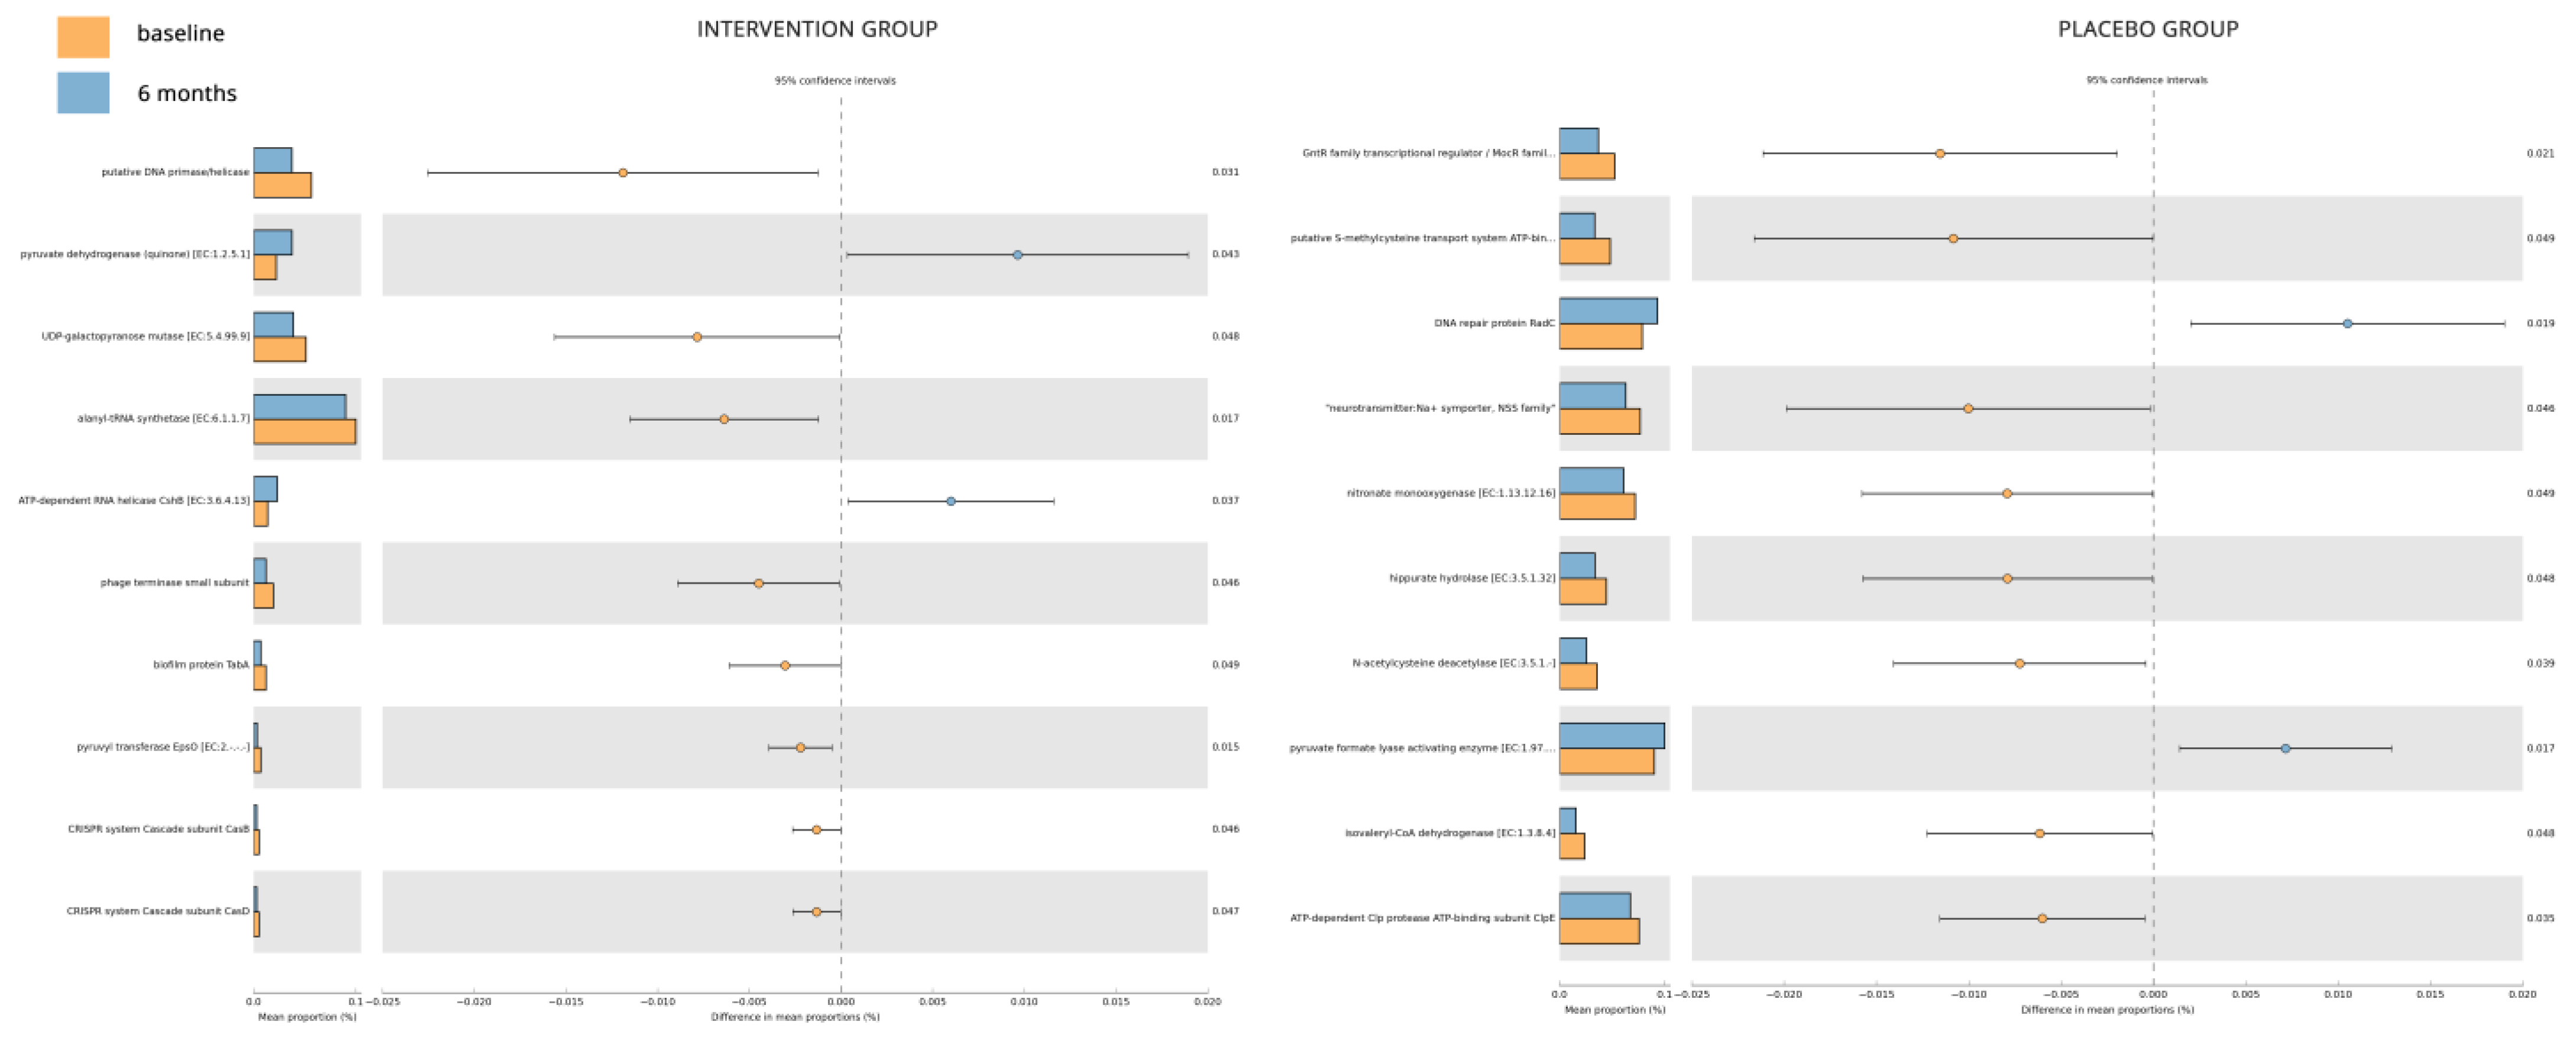
- The gut microbiome analysis demonstrated that the six-month probiotic intervention uncovered noteworthy impacts on specific genera, metabolites, and key enzymes associated with diabetes.
Abstract
1. Introduction
2. Materials and Methods
2.1. Participants
- (a)
- A diagnosis of T2D (based on the American Diabetes Association criteria [37]), for a duration exceeding 6 months.
- (b)
- Age above 18 years.
- (c)
- A body-mass index (BMI) greater than 18.5 kg/m2.
- (d)
- HbA1c levels exceeding 6%.
- (e)
- Stable use of antidiabetic medications (oral or injectable GLP-1 RAs) for at least 8 weeks before screening.
- (a)
- Type 1 diabetes or other forms of diabetes.
- (b)
- Pregnancy or plans to become pregnant during the study.
- (c)
- End-stage kidney failure requiring dialysis, or presence of other severe diseases such as cancer or significant hepatic insufficiency (AST/ALT levels more than 3.5 times above normal).
- (d)
- Recent use of other probiotic products or antibiotics within the previous 6 months.
- (e)
- Participation in other ongoing clinical trials.
- (f)
- Presence of any other medical condition that, in the opinion of the investigators, could hinder compliance with the study protocol, such as malabsorption syndrome (for example celiac disease, inflammatory bowel disease, chronic pancreatitis, cystic fibrosis, short bowel syndrome, bacterial overgrowth, parasitic infections, bariatric surgery, autoimmune disorders like systemic lupus erythematosus and systemic sclerosis, etc.), or an inability to take orally administered medications (due, for example, to dysphagia, Parkinson’s, Alzheimer’s and motor neuron diseases, throat or esophageal problems, stroke, and other neurological conditions).
- (g)
- Administration of insulin. The decision to exclude patients on insulin was based on previous studies showing a more substantial reduction in HbA1c with probiotics in participants not receiving insulin compared to those on insulin therapy [38].
2.2. Study Design
16S rRNA Sequencing
2.3. Bioinformatics and Statistical Analysis
3. Results
Microbiome Sub-Study
4. Discussion
5. Conclusions
Supplementary Materials
Author Contributions
Funding
Institutional Review Board Statement
Informed Consent Statement
Data Availability Statement
Conflicts of Interest
References
- Saeedi, P.; Petersohn, I.; Salpea, P.; Malanda, B.; Karuranga, S.; Unwin, N.; Colagiuri, S.; Guariguata, L.; Motala, A.A.; Ogurtsova, K.; et al. Global and regional diabetes prevalence estimates for 2019 and projections for 2030 and 2045: Results from the International Diabetes Federation Diabetes Atlas, 9. Diabetes Res. Clin. Pract. 2019, 157, 107843. [Google Scholar] [CrossRef] [PubMed]
- Stumvoll, M.; Goldstein, B.J.; van Haeften, T.W. Type 2 diabetes: Principles of pathogenesis and therapy. Lancet 2005, 365, 1333–1346. [Google Scholar] [CrossRef] [PubMed]
- Defronzo, R.A. Banting Lecture. From the triumvirate to the ominous octet: A new paradigm for the treatment of type 2 diabetes mellitus. Diabetes 2009, 58, 773–795. [Google Scholar] [CrossRef]
- Davies, M.J.; Aroda, V.R.; Collins, B.S.; Gabbay, R.A.; Green, J.; Maruthur, N.M.; Rosas, S.E.; Del Prato, S.; Mathieu, C.; Mingrone, G.; et al. Management of Hyperglycemia in Type 2 Diabetes, 2022. A Consensus Report by the American Diabetes Association (ADA) and the European Association for the Study of Diabetes (EASD). Diabetes Care 2022, 45, 2753–2786. [Google Scholar] [CrossRef] [PubMed]
- ElSayed, N.A.; Aleppo, G.; Aroda, V.R.; Bannuru, R.R.; Brown, F.M.; Bruemmer, D.; Collins, B.S.; Hilliard, M.E.; Isaacs, D.; Johnson, E.L.; et al. 9. Pharmacologic Approaches to Glycemic Treatment: Standards of Care in Diabetes—2023. Diabetes Care 2023, 46, S140–S157. [Google Scholar] [CrossRef] [PubMed]
- Schroeder, B.O.; Bäckhed, F. Signals from the gut microbiota to distant organs in physiology and disease. Nat. Med. 2016, 22, 1079–1089. [Google Scholar] [CrossRef]
- Rosenbaum, M.; Knight, R.; Leibel, R.L. The gut microbiota in human energy homeostasis and obesity. Trends Endocrinol. Metab. 2015, 26, 493–501. [Google Scholar] [CrossRef]
- Vallianou, N.G.; Stratigou, T.; Tsagarakis, S. Microbiome and diabetes: Where are we now? Diabetes Res. Clin. Pract. 2018, 146, 111–118. [Google Scholar] [CrossRef]
- Hjorth, M.F.; Blædel, T.; Bendtsen, L.Q.; Lorenzen, J.K.; Holm, J.B.; Kiilerich, P.; Roager, H.M.; Kristiansen, K.; Larsen, L.H.; Astrup, A. Prevotella-to-Bacteroides ratio predicts body weight and fat loss success on 24-week diets varying in macronutrient composition and dietary fiber: Results from a post-hoc analysis. Int. J. Obes. 2019, 43, 149–157. [Google Scholar] [CrossRef]
- Belkaid, Y.; Hand, T.W. Role of the microbiota in immunity and inflammation. Cell 2014, 157, 121–141. [Google Scholar] [CrossRef]
- Turnbaugh, P.J.; Ley, R.E.; Mahowald, M.A.; Magrini, V.; Mardis, E.R.; Gordon, J.I. An obesity-associated gut microbiome with increased capacity for energy harvest. Nature 2006, 444, 1027–1031. [Google Scholar] [CrossRef] [PubMed]
- Bäckhed, F.; Ding, H.; Wang, T.; Hooper, L.V.; Koh, G.Y.; Nagy, A.; Semenkovich, C.F.; Gordon, J.I. The gut microbiota as an environmental factor that regulates fat storage. Proc. Natl. Acad. Sci. USA 2004, 101, 15718–15723. [Google Scholar] [CrossRef] [PubMed]
- Tilg, H.; Moschen, A.R. Microbiota and diabetes: An evolving relationship. Gut 2014, 63, 1513–1521. [Google Scholar] [CrossRef] [PubMed]
- Larsen, N.; Vogensen, F.K.; van den Berg, F.W.; Nielsen, D.S.; Andreasen, A.S.; Pedersen, B.K.; Al-Soud, W.A.; Sørensen, S.J.; Hansen, L.H.; Jakobsen, M. Gut microbiota in human adults with type 2 diabetes differs from non-diabetic adults. PLoS ONE 2010, 5, e9085. [Google Scholar] [CrossRef] [PubMed]
- Chen, W.; Zhang, S.; Wu, J.; Ye, T.; Wang, S.; Wang, P.; Xing, D. Butyrate-producing bacteria and the gut-heart axis in atherosclerosis. Clin. Chim. Acta 2020, 507, 236–241. [Google Scholar] [CrossRef]
- Arora, T.; Tremaroli, V. Therapeutic Potential of Butyrate for Treatment of Type 2 Diabetes. Front. Endocrinol. 2021, 12, 761834. [Google Scholar] [CrossRef]
- Hill, C.; Guarner, F.; Reid, G.; Gibson, G.R.; Merenstein, D.J.; Pot, B.; Morelli, L.; Canani, R.B.; Flint, H.J.; Salminen, S.; et al. Expert consensus document. The International Scientific Association for Probiotics and Prebiotics consensus statement on the scope and appropriate use of the term probiotic. Nat. Rev. Gastroenterol. Hepatol. 2014, 11, 506–514. [Google Scholar] [CrossRef]
- Lahtinen, S.J. Probiotic viability—Does it matter? Microb. Ecol. Health Dis. 2012, 23, 18567. [Google Scholar] [CrossRef]
- Chen, P.; Zhang, Q.; Dang, H.; Liu, X.; Tian, F.; Zhao, J.; Chen, Y.; Zhang, H.; Chen, W. Antidiabetic effect of Lactobacillus casei CCFM0412 on mice with type 2 diabetes induced by a high-fat diet and streptozotocin. Nutrition 2014, 30, 1061–1068. [Google Scholar] [CrossRef]
- Kim, S.H.; Huh, C.S.; Choi, I.D.; Jeong, J.W.; Ku, H.K.; Ra, J.H.; Kim, T.Y.; Kim, G.B.; Sim, J.H.; Ahn, Y.T. The anti-diabetic activity of Bifidobacterium lactis HY8101 in vitro and in vivo. J. Appl. Microbiol. 2014, 117, 834–845. [Google Scholar] [CrossRef]
- Bayat, A.; Azizi-Soleiman, F.; Heidari-Beni, M.; Feizi, A.; Iraj, B.; Ghiasvand, R.; Askari, G. Effect of Cucurbita ficifolia and Probiotic Yogurt Consumption on Blood Glucose, Lipid Profile, and Inflammatory Marker in Type 2 Diabetes. Int. J. Prev. Med. 2016, 7, 30. [Google Scholar] [CrossRef] [PubMed]
- Ejtahed, H.S.; Mohtadi-Nia, J.; Homayouni-Rad, A.; Niafar, M.; Asghari-Jafarabadi, M.; Mofid, V.; Akbarian-Moghari, A. Effect of probiotic yogurt containing Lactobacillus acidophilus and Bifidobacterium lactis on lipid profile in individuals with type 2 diabetes mellitus. J. Dairy Sci. 2011, 94, 3288–3294. [Google Scholar] [CrossRef] [PubMed]
- Hove, K.D.; Brøns, C.; Færch, K.; Lund, S.S.; Rossing, P.; Vaag, A. Effects of 12 weeks of treatment with fermented milk on blood pressure, glucose metabolism and markers of cardiovascular risk in patients with type 2 diabetes: A randomised double-blind placebo-controlled study. Eur. J. Endocrinol. 2015, 172, 11–20. [Google Scholar] [CrossRef] [PubMed]
- Sabico, S.; Al-Mashharawi, A.; Al-Daghri, N.M.; Wani, K.; Amer, O.E.; Hussain, D.S.; Ahmed Ansari, M.G.; Masoud, M.S.; Alokail, M.S.; McTernan, P.G. Effects of a 6-month multi-strain probiotics supplementation in endotoxemic, inflammatory and cardiometabolic status of T2DM patients: A randomized, double-blind, placebo-controlled trial. Clin. Nutr. 2019, 38, 1561–1569. [Google Scholar] [CrossRef]
- Horvath, A.; Leber, B.; Feldbacher, N.; Tripolt, N.; Rainer, F.; Blesl, A.; Trieb, M.; Marsche, G.; Sourij, H.; Stadlbauer, V. Effects of a multispecies synbiotic on glucose metabolism, lipid marker, gut microbiome composition, gut permeability, and quality of life in diabesity: A randomized, double-blind, placebo-controlled pilot study. Eur. J. Nutr. 2020, 59, 2969–2983. [Google Scholar] [CrossRef]
- Walker, A.W.; Hoyles, L. Human microbiome myths and misconceptions. Nat. Microbiol. 2023, 8, 1392–1396. [Google Scholar] [CrossRef]
- Zommiti, M.; Feuilloley, M.G.J.; Connil, N. Update of Probiotics in Human World: A Nonstop Source of Benefactions till the End of Time. Microorganisms 2020, 8, 1907. [Google Scholar] [CrossRef] [PubMed]
- Yan, F.; Li, N.; Shi, J.; Li, H.; Yue, Y.; Jiao, W.; Wang, N.; Song, Y.; Huo, G.; Li, B. Lactobacillus acidophilus alleviates type 2 diabetes by regulating hepatic glucose, lipid metabolism and gut microbiota in mice. Food Funct. 2019, 10, 5804–5815. [Google Scholar] [CrossRef]
- Li, X.; Wang, N.; Yin, B.; Fang, D.; Jiang, T.; Fang, S.; Zhao, J.; Zhang, H.; Wang, G.; Chen, W. Effects of Lactobacillus plantarum CCFM0236 on hyperglycaemia and insulin resistance in high-fat and streptozotocin-induced type 2 diabetic mice. J. Appl. Microbiol. 2016, 121, 1727–1736. [Google Scholar] [CrossRef]
- Li, C.; Ding, Q.; Nie, S.P.; Zhang, Y.S.; Xiong, T.; Xie, M.Y. Carrot juice fermented with Lactobacillus plantarum NCU116 ameliorates type 2 diabetes in rats. J. Agric. Food Chem. 2014, 62, 11884–11891. [Google Scholar] [CrossRef]
- Youn, H.S.; Kim, J.H.; Lee, J.S.; Yoon, Y.Y.; Choi, S.J.; Lee, J.Y.; Kim, W.; Hwang, K.W. Lactobacillus plantarum Reduces Low-Grade Inflammation and Glucose Levels in a Mouse Model of Chronic Stress and Diabetes. Infect. Immun. 2021, 89, e0061520. [Google Scholar] [CrossRef] [PubMed]
- Lee, Y.S.; Lee, D.; Park, G.S.; Ko, S.H.; Park, J.; Lee, Y.K.; Kang, J. Lactobacillus plantarum HAC01 ameliorates type 2 diabetes in high-fat diet and streptozotocin-induced diabetic mice in association with modulating the gut microbiota. Food Funct. 2021, 12, 6363–6373. [Google Scholar] [CrossRef] [PubMed]
- Barssotti, L.; Abreu, I.C.M.E.; Brandão, A.B.P.; Albuquerque, R.C.M.F.; Ferreira, F.G.; Salgado, M.A.C.; Dias, D.D.S.; De Angelis, K.; Yokota, R.; Casarini, D.E.; et al. Saccharomyces boulardii modulates oxidative stress and renin angiotensin system attenuating diabetes-induced liver injury in mice. Sci. Rep. 2021, 11, 9189. [Google Scholar] [CrossRef]
- Everard, A.; Matamoros, S.; Geurts, L.; Delzenne, N.M.; Cani, P.D. Saccharomyces boulardii administration changes gut microbiota and reduces hepatic steatosis, low-grade inflammation, and fat mass in obese and type 2 diabetic db/db mice. mBio 2014, 5, e01011–e01014. [Google Scholar] [CrossRef] [PubMed]
- Abreu, I.C.M.E.; Albuquerque, R.C.M.F.; Brandão, A.B.P.; Barssotti, L.; de Souza, L.B.; Ferreira, F.G.; Oliveira, L.C.G.; Yokota, R.; Sparvoli, L.G.; Dias, D.D.S.; et al. Saccharomyces boulardii exerts renoprotection by modulating oxidative stress, renin angiotensin system and uropathogenic microbiota in a murine model of diabetes. Life Sci. 2022, 301, 120616. [Google Scholar] [CrossRef] [PubMed]
- Gupta, V.K.; Paul, S.; Dutta, C. Geography, Ethnicity or Subsistence-Specific Variations in Human Microbiome Composition and Diversity. Front. Microbiol. 2017, 8, 1162. [Google Scholar] [CrossRef] [PubMed]
- ElSayed, N.A.; Aleppo, G.; Aroda, V.R.; Bannuru, R.R.; Brown, F.M.; Bruemmer, D.; Collins, B.S.; Hilliard, M.E.; Isaacs, D.; Johnson, E.L.; et al. 2. Classification and Diagnosis of Diabetes: Standards of Care in Diabetes—2023. Diabetes Care 2023, 46, S19–S40. [Google Scholar] [CrossRef]
- Rittiphairoj, T.; Pongpirul, K.; Janchot, K.; Mueller, N.T.; Li, T. Probiotics Contribute to Glycemic Control in Patients with Type 2 Diabetes Mellitus: A Systematic Review and Meta-Analysis. Adv. Nutr. 2021, 12, 722–734. [Google Scholar] [CrossRef]
- Williams, J.R. The Declaration of Helsinki and public health. Bull. World Health Organ. 2008, 86, 650–652. [Google Scholar] [CrossRef]
- Ross, R.; Neeland, I.J.; Yamashita, S.; Shai, I.; Seidell, J.; Magni, P.; Santos, R.D.; Arsenault, B.; Cuevas, A.; Hu, F.B.; et al. Waist circumference as a vital sign in clinical practice: A Consensus Statement from the IAS and ICCR Working Group on Visceral Obesity. Nat. Rev. Endocrinol. 2020, 16, 177–189. [Google Scholar] [CrossRef]
- Asmar, R.; Khabouth, J.; Mattar, J.; Pecchioli, V.; Germano, G. Validation of three professional devices measuring office blood pressure according to three different methods: The Omron BP10, the Omron HBP T105 and the Pic Indolor Professional. J. Hypertens. 2010, 28, 452–458. [Google Scholar] [CrossRef] [PubMed]
- Kembel, S.W.; Cowan, P.D.; Helmus, M.R.; Cornwell, W.K.; Morlon, H.; Ackerly, D.D.; Blomberg, S.P.; Webb, C.O. Picante: R tools for integrating phylogenies and ecology. Bioinformatics 2010, 26, 1463–1464. [Google Scholar] [CrossRef]
- Wemheuer, F.; Taylor, J.A.; Daniel, R.; Johnston, E.; Meinicke, P.; Thomas, T.; Wemheuer, B. Tax4Fun2: Prediction of habitat-specific functional profiles and functional redundancy based on 16S rRNA gene sequences. Environ. Microbiome 2020, 15, 11. [Google Scholar] [CrossRef] [PubMed]
- Dhariwal, A.; Chong, J.; Habib, S.; King, I.L.; Agellon, L.B.; Xia, J. MicrobiomeAnalyst: A web-based tool for comprehensive statistical, visual and meta-analysis of microbiome data. Nucleic Acids Res. 2017, 45, W180–W188. [Google Scholar] [CrossRef] [PubMed]
- Kanehisa, M.; Araki, M.; Goto, S.; Hattori, M.; Hirakawa, M.; Itoh, M.; Katayama, T.; Kawashima, S.; Okuda, S.; Tokimatsu, T.; et al. KEGG for linking genomes to life and the environment. Nucleic Acids Res. 2008, 36, D480–D484. [Google Scholar] [CrossRef]
- Parks, D.H.; Tyson, G.W.; Hugenholtz, P.; Beiko, R.G. STAMP: Statistical analysis of taxonomic and functional profiles. Bioinformatics 2014, 30, 3123–3124. [Google Scholar] [CrossRef]
- Lenters-Westra, E.; Schindhelm, R.K.; Bilo, H.J.; Groenier, K.H.; Slingerland, R.J. Differences in interpretation of haemoglobin A1c values among diabetes care professionals. Neth. J. Med. 2014, 72, 462–466. [Google Scholar]
- Bock, P.M.; Telo, G.H.; Ramalho, R.; Sbaraini, M.; Leivas, G.; Martins, A.F.; Schaan, B.D. The effect of probiotics, prebiotics or synbiotics on metabolic outcomes in individuals with diabetes: A systematic review and meta-analysis. Diabetologia 2021, 64, 26–41. [Google Scholar] [CrossRef]
- Zarezadeh, M.; Musazadeh, V.; Faghfouri, A.H.; Sarmadi, B.; Jamilian, P.; Tutunchi, H.; Dehghan, P. Probiotic therapy, a novel and efficient adjuvant approach to improve glycemic status: An umbrella meta-analysis. Pharmacol. Res. 2022, 183, 106397. [Google Scholar] [CrossRef]
- DeFronzo, R.A.; Stonehouse, A.H.; Han, J.; Wintle, M.E. Relationship of baseline HbA1c and efficacy of current glucose-lowering therapies: A meta-analysis of randomized clinical trials. Diabet. Med. 2010, 27, 309–317. [Google Scholar] [CrossRef]
- Xu, D.; Fu, L.; Pan, D.; Chu, Y.; Feng, M.; Lu, Y.; Yang, C.; Wang, Y.; Xia, J.; Sun, G. Role of probiotics/synbiotic supplementation in glycemic control: A critical umbrella review of meta-analyses of randomized controlled trials. Crit. Rev. Food Sci. Nutr. 2022, 1–19. [Google Scholar] [CrossRef] [PubMed]
- Ebrahimi, Z.S.; Nasli-Esfahani, E.; Nadjarzade, A.; Mozaffari-Khosravi, H. Effect of symbiotic supplementation on glycemic control, lipid profiles and microalbuminuria in patients with non-obese type 2 diabetes: A randomized, double-blind, clinical trial. J. Diabetes Metab. Disord. 2017, 16, 23. [Google Scholar] [CrossRef] [PubMed]
- Aggarwal, J.; Swami, G.; Kumar, M. Probiotics and their Effects on Metabolic Diseases: An Update. J. Clin. Diagn. Res. 2013, 7, 173–177. [Google Scholar] [CrossRef] [PubMed]
- Reis, S.A.; Conceição, L.L.; Rosa, D.D.; Siqueira, N.P.; Peluzio, M.C.G. Mechanisms responsible for the hypocholesterolaemic effect of regular consumption of probiotics. Nutr. Res. Rev. 2017, 30, 36–49. [Google Scholar] [CrossRef] [PubMed]
- Álvarez-Arraño, V.; Martín-Peláez, S. Effects of Probiotics and Synbiotics on Weight Loss in Subjects with Overweight or Obesity: A Systematic Review. Nutrients 2021, 13, 3627. [Google Scholar] [CrossRef]
- Madempudi, R.S.; Ahire, J.J.; Neelamraju, J.; Tripathi, A.; Nanal, S. Efficacy of UB0316, a multi-strain probiotic formulation in patients with type 2 diabetes mellitus: A double blind, randomized, placebo controlled study. PLoS ONE 2019, 14, e0225168. [Google Scholar] [CrossRef]
- Horiuchi, H.; Kamikado, K.; Aoki, R.; Suganuma, N.; Nishijima, T.; Nakatani, A.; Kimura, I. Bifidobacterium animalis subsp. lactis GCL2505 modulates host energy metabolism via the short-chain fatty acid receptor GPR43. Sci. Rep. 2020, 10, 4158. [Google Scholar] [CrossRef]
- Han, C.; Ding, Z.; Shi, H.; Qian, W.; Hou, X.; Lin, R. The Role of Probiotics in Lipopolysaccharide-Induced Autophagy in Intestinal Epithelial Cells. Cell. Physiol. Biochem. 2016, 38, 2464–2478. [Google Scholar] [CrossRef]
- Kim, Y.A.; Keogh, J.B.; Clifton, P.M. Probiotics, prebiotics, synbiotics and insulin sensitivity. Nutr. Res. Rev. 2018, 31, 35–51. [Google Scholar] [CrossRef]
- Cheng, Y.-C.; Liu, J.-R. Effect of Lactobacillus rhamnosus GG on Energy Metabolism, Leptin Resistance, and Gut Microbiota in Mice with Diet-Induced Obesity. Nutrients 2020, 12, 2557. [Google Scholar] [CrossRef]
- Pintarič, M.; Langerholc, T. Probiotic Mechanisms Affecting Glucose Homeostasis: A Scoping Review. Life 2022, 12, 1187. [Google Scholar] [CrossRef] [PubMed]
- Gao, R.; Meng, X.; Xue, Y.; Mao, M.; Liu, Y.; Tian, X.; Sui, B.; Li, X.; Zhang, P. Bile acids-gut microbiota crosstalk contributes to the improvement of type 2 diabetes mellitus. Front. Pharmacol. 2022, 13, 1027212. [Google Scholar] [CrossRef] [PubMed]
- Kim, C.H. Microbiota or short-chain fatty acids: Which regulates diabetes? Cell. Mol. Immunol. 2018, 15, 88–91. [Google Scholar] [CrossRef] [PubMed]
- Qin, J.; Li, Y.; Cai, Z.; Li, S.; Zhu, J.; Zhang, F.; Liang, S.; Zhang, W.; Guan, Y.; Shen, D.; et al. A metagenome-wide association study of gut microbiota in type 2 diabetes. Nature 2012, 490, 55–60. [Google Scholar] [CrossRef]
- Gargari, G.; Taverniti, V.; Koirala, R.; Gardana, C.; Guglielmetti, S. Impact of a Multistrain Probiotic Formulation with High Bifidobacterial Content on the Fecal Bacterial Community and Short-Chain Fatty Acid Levels of Healthy Adults. Microorganisms 2020, 8, 492. [Google Scholar] [CrossRef]
- Sze, M.A.; Schloss, P.D. Looking for a Signal in the Noise: Revisiting Obesity and the Microbiome. mBio 2016, 7, e01018-16. [Google Scholar] [CrossRef]
- Thingholm, L.B.; Rühlemann, M.C.; Koch, M.; Fuqua, B.; Laucke, G.; Boehm, R.; Bang, C.; Franzosa, E.A.; Hübenthal, M.; Rahnavard, A.; et al. Obese Individuals with and without Type 2 Diabetes Show Different Gut Microbial Functional Capacity and Composition. Cell Host Microbe 2019, 26, 252–264. [Google Scholar] [CrossRef]
- Wu, Y.; Chi, X.; Zhang, Q.; Chen, F.; Deng, X. Characterization of the salivary microbiome in people with obesity. PeerJ 2018, 6, e4458. [Google Scholar] [CrossRef] [PubMed]
- Chen, X.; Sun, H.; Jiang, F.; Shen, Y.; Li, X.; Hu, X.; Shen, X.; Wei, P. Alteration of the gut microbiota associated with childhood obesity by 16S rRNA gene sequencing. PeerJ 2020, 8, e8317. [Google Scholar] [CrossRef]
- Wu, K.; Xu, H.; Zheng, Y.; Wang, L.; Zhang, X.; Yin, Y. CpsR, a GntR family regulator, transcriptionally regulates capsular polysaccharide biosynthesis and governs bacterial virulence in Streptococcus pneumoniae. Sci. Rep. 2016, 6, 29255. [Google Scholar] [CrossRef]
- Wu, G.; Xiong, Q.; Wei, X.; Wang, Y.; Hu, X.; He, G.; Liu, L.; Lai, Q.; Dai, Z.; Anushesh, D.; et al. Mitochondrial unfolded protein response gene CLPP changes mitochondrial dynamics and affects mitochondrial function. PeerJ 2019, 7, e7209. [Google Scholar] [CrossRef] [PubMed]
- Li, Z.; Zhou, M.; Cai, Z.; Liu, H.; Zhong, W.; Hao, Q.; Cheng, D.; Hu, X.; Hou, J.; Xu, P.; et al. RNA-binding protein DDX1 is responsible for fatty acid-mediated repression of insulin translation. Nucleic Acids Res. 2018, 46, 12052–12066. [Google Scholar] [CrossRef] [PubMed]
- Zhang, S.; Yang, X.; Jiang, M.; Ma, L.; Hu, J.; Zhang, H.H. Post-transcriptional control by RNA-binding proteins in diabetes and its related complications. Front. Physiol. 2022, 13, 953880. [Google Scholar] [CrossRef] [PubMed]
- de la Cuesta-Zuluaga, J.; Mueller, N.T.; Corrales-Agudelo, V.; Velásquez-Mejía, E.P.; Carmona, J.A.; Abad, J.M.; Escobar, J.S. Metformin Is Associated With Higher Relative Abundance of Mucin-Degrading Akkermansia muciniphila and Several Short-Chain Fatty Acid-Producing Microbiota in the Gut. Diabetes Care 2017, 40, 54–62. [Google Scholar] [CrossRef] [PubMed]
- Abdalqadir, N.; Adeli, K. GLP-1 and GLP-2 Orchestrate Intestine Integrity, Gut Microbiota, and Immune System Crosstalk. Microorganisms 2022, 10, 2061. [Google Scholar] [CrossRef]
- Tiderencel, K.A.; Hutcheon, D.A.; Ziegler, J. Probiotics for the treatment of type 2 diabetes: A review of randomized controlled trials. Diabetes/Metab. Res. Rev. 2020, 36, e3213. [Google Scholar] [CrossRef]
- Yatsunenko, T.; Rey, F.E.; Manary, M.J.; Trehan, I.; Dominguez-Bello, M.G.; Contreras, M.; Magris, M.; Hidalgo, G.; Baldassano, R.N.; Anokhin, A.P.; et al. Human gut microbiome viewed across age and geography. Nature 2012, 486, 222–227. [Google Scholar] [CrossRef]


| Total (n = 91) | Intervention (n = 46) | Control (n = 45) | p * | |
|---|---|---|---|---|
| Males/ Females [n (%)] | 57/34 (62.6/37.4) | 30/16 (65.2/34.8) | 27/18 (60/40) | NS |
| Age (years) | 65.12 (10.92) | 64.54 (11.12) | 65.71 (10.82) | NS |
| Weight (kg) | 92.14 (21.12) | 91.39 (21.7) | 92.92 (20.72) | NS |
| BMI (kg/m2) | 32.71 (6.91) | 32.11 (6.55) | 33.32 (7.28) | NS |
| WC (cm) | 110.11 (14.57) | 108.67 (14.6) | 111.58 (14.56) | NS |
| SBP (mmHg) | 130.02 (13.13) | 128.26 (13.59) | 131.82 (12.54) | NS |
| DBP (mmHg) | 79.49 (10.72) | 79.26 (11.87) | 79.73 (9.52) | NS |
| FBG (mmol/L) | 7.62 (1.32) | 7.54 (1.22) | 7.69 (1.43) | NS |
| HbA1c (%) | 7.28 (0.50) | 7.24 (0.49) | 7.32 (0.52) | NS |
| TC (mmol/L) | 3.94 (0.77) | 3.88 (0.76) | 4.01 (0.79) | NS |
| Trig (mmol/L) | 1.47 (0.47) | 1.44 (0.51) | 1.51 (0.43) | NS |
| HDL-C (mmol/L) | 1.13 (0.29) | 1.14 (0.30) | 1.11 (0.28) | NS |
| LDL-C (mmol/L) | 2.16 (0.67) | 2.08 (0.57) | 2.25 (0.76) | NS |
| Creatin (umol/L) | 80.46 (23.87) | 84.88 (26.53) | 76.93 (19.45) | NS |
| AST (U/L) | 19.95 (6.95) | 20.30 (5.61) | 19.58 (8.14) | NS |
| ALT (U/L) | 21.42 (9.67) | 21.41 (6.92) | 21.43 (11.93) | NS |
| γGT (U/L) | 21.60 (11.58) | 20.69 (10.63) | 22.53 (12.53) | NS |
| Alk Phos (U/L) | 65.85 (24.28) | 64.60 (18.67) | 67.13 (29.44) | NS |
| Probiotics (n = 46) | Placebo (n = 45) | p * | |||||
|---|---|---|---|---|---|---|---|
| Baseline | 3 Months | 6 Months | Baseline | 3 Months | 6 Months | ||
| BMI (kg/m2) | 32.11 (6.55) | 31.59 (6.36) | 31.27 (6.31) | 33.32 (7.28) | 33.17 (7.07) | 33.16 (6.95) | NS |
| Change at 3 months | −0.52 (0.63) | −0.15 (1.65) | |||||
| Change at 6 months | −0.84 (1.05) | −0.16 (2.34) | |||||
| WC (cm) | 108.67 (14.60) | 106.85 (14.34) | 105.04 (14.13) | 111.58 (14.56) | 111.17 (13.86) | 111.13 (13.52) | <0.001 |
| Change at 3 months | −1.83 (1.96) | −0.41 (3.25) | |||||
| Change at 6 months | −3.63 (3.10) | −0.44 (5.44) | |||||
| SBP (mmHg) | 128.26 (13.59) | 127.93 (12.02) | 127.30 (8.48) | 131.82 (12.54) | 131.02 (14.02) | 129.71 (16.10) | NS |
| Change at 3 months | −0.33 (10.32) | −0.80 (7.84) | |||||
| Change at 6 months | −0.96 (13.32) | −2.11 (12.53) | |||||
| DBP (mmHg) | 79.26 (11.87) | 78.28 (11.51) | 78.85 (12.66) | 79.73 (9.52) | 78.49 (9.90) | 77.96 (10.52) | NS |
| Change at 3 months | −0.98 (5.16) | −1.24 (4.86) | |||||
| Change at 6 months | −0.41 (9.5) | −1.78 (6.59) | |||||
| Probiotics (n = 46) | Placebo (n = 45) | P | |||||
|---|---|---|---|---|---|---|---|
| Baseline | 3 Months | 6 Months | Baseline | 3 Months | 6 Months | ||
| HbA1c (%) | 7.24 (0.49) | 6.82 (0.39) | 6.51 (0.44) | 7.32 (0.52) | 7.19 (0.42) | 7.18 (0.45) | <0.001 |
| Change at 3 months | −0.42 (0.27) | −0.12 (0.32) | |||||
| Change at 6 months | −0.73 (0.42) | −0.14 (0.46) | |||||
| FBG (mmol/L) | 7.55 (1.22) | 6.70 (0.85) | 6.16 (0.83) | 7.70 (1.42) | 7.35 (1.13) | 7.42 (1.42) | <0.001 |
| Change at 3 months | −0.85 (0.95) | −0.35 (0.88) | |||||
| Change at 6 months | −1.39 (1.08) | −0.28 (0.96) | |||||
| TC (mmol/L) | 3.87 (0.76) | 3.71 (0.69) | 3.59 (0.65) | 4.00 (0.79) | 3.95 (0.80) | 4.01 (0.82) | 0.012 |
| Change at 3 months | −0.16 (0.19) | −0.05 (0.42) | |||||
| Change at 6 months | −0.28 (0.27) | 0.01 (0.50) | |||||
| Trig (mmol/L) | 1.43 (0.51) | 1.37 (0.46) | 1.34 (0.46) | 1.51 (0.43) | 1.51 (0.45) | 1.51 (0.46) | NS |
| Change at 3 months | −0.07 (0.09) | −0.01 (0.19) | |||||
| Change at 6 months | −0.09 (0.13) | 0.00 (0.25) | |||||
| HDL-C (mg/dL) | 1.13 (0.30) | 1.15 (0.29) | 1.16 (0.28) | 1.11 (0.28) | 1.10 (0.27) | 1.10 (0.28) | NS |
| Change at 3 months | 0.01 (0.04) | −0.01 (0.08) | |||||
| Change at 6 months | 0.02 (0.07) | −0.02 (0.13) | |||||
| LDL-C (mg/dL) | 2.08 (0.57) | 2.01 (0.56) | 2.00 (0.56) | 2.24 (0.75) | 2.18 (0.73) | 2.22 (0.71) | NS |
| Change at 3 months | −0.07 (0.13) | −0.07 (0.28) | |||||
| Change at 6 months | −0.08 (0.19) | −0.03 (0.30) | |||||
Disclaimer/Publisher’s Note: The statements, opinions and data contained in all publications are solely those of the individual author(s) and contributor(s) and not of MDPI and/or the editor(s). MDPI and/or the editor(s) disclaim responsibility for any injury to people or property resulting from any ideas, methods, instructions or products referred to in the content. |
© 2023 by the authors. Licensee MDPI, Basel, Switzerland. This article is an open access article distributed under the terms and conditions of the Creative Commons Attribution (CC BY) license (https://creativecommons.org/licenses/by/4.0/).
Share and Cite
Zikou, E.; Dovrolis, N.; Dimosthenopoulos, C.; Gazouli, M.; Makrilakis, K. The Effect of Probiotic Supplements on Metabolic Parameters of People with Type 2 Diabetes in Greece—A Randomized, Double-Blind, Placebo-Controlled Study. Nutrients 2023, 15, 4663. https://doi.org/10.3390/nu15214663
Zikou E, Dovrolis N, Dimosthenopoulos C, Gazouli M, Makrilakis K. The Effect of Probiotic Supplements on Metabolic Parameters of People with Type 2 Diabetes in Greece—A Randomized, Double-Blind, Placebo-Controlled Study. Nutrients. 2023; 15(21):4663. https://doi.org/10.3390/nu15214663
Chicago/Turabian StyleZikou, Eva, Nikolas Dovrolis, Charilaos Dimosthenopoulos, Maria Gazouli, and Konstantinos Makrilakis. 2023. "The Effect of Probiotic Supplements on Metabolic Parameters of People with Type 2 Diabetes in Greece—A Randomized, Double-Blind, Placebo-Controlled Study" Nutrients 15, no. 21: 4663. https://doi.org/10.3390/nu15214663
APA StyleZikou, E., Dovrolis, N., Dimosthenopoulos, C., Gazouli, M., & Makrilakis, K. (2023). The Effect of Probiotic Supplements on Metabolic Parameters of People with Type 2 Diabetes in Greece—A Randomized, Double-Blind, Placebo-Controlled Study. Nutrients, 15(21), 4663. https://doi.org/10.3390/nu15214663