
The Effects of Human Milk Oligosaccharides on Gut Microbiota, Metabolite Profiles and Host Mucosal Response in Patients with Irritable Bowel Syndrome

 , ,
, ,  , ,
, ,
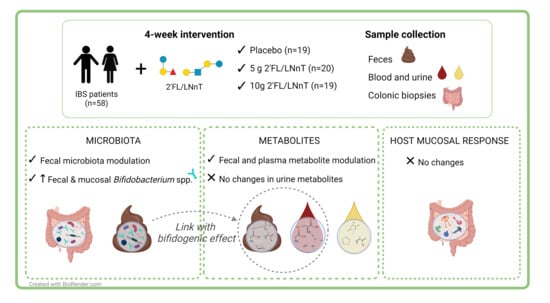
Abstract
:
1. Introduction
2. Material and Methods
2.1. Study Cohort
2.2. Study Design
2.3. Gut Microbiota Analysis
2.4. Determination of Bifidobacterium spp. Levels
2.5. Non-Targeted Metabolomic Analysis
2.6. Gene Expression Analysis
2.7. Statistical Analyses
3. Results
3.1. Demographics and Clinical Characteristics of the Study Cohort
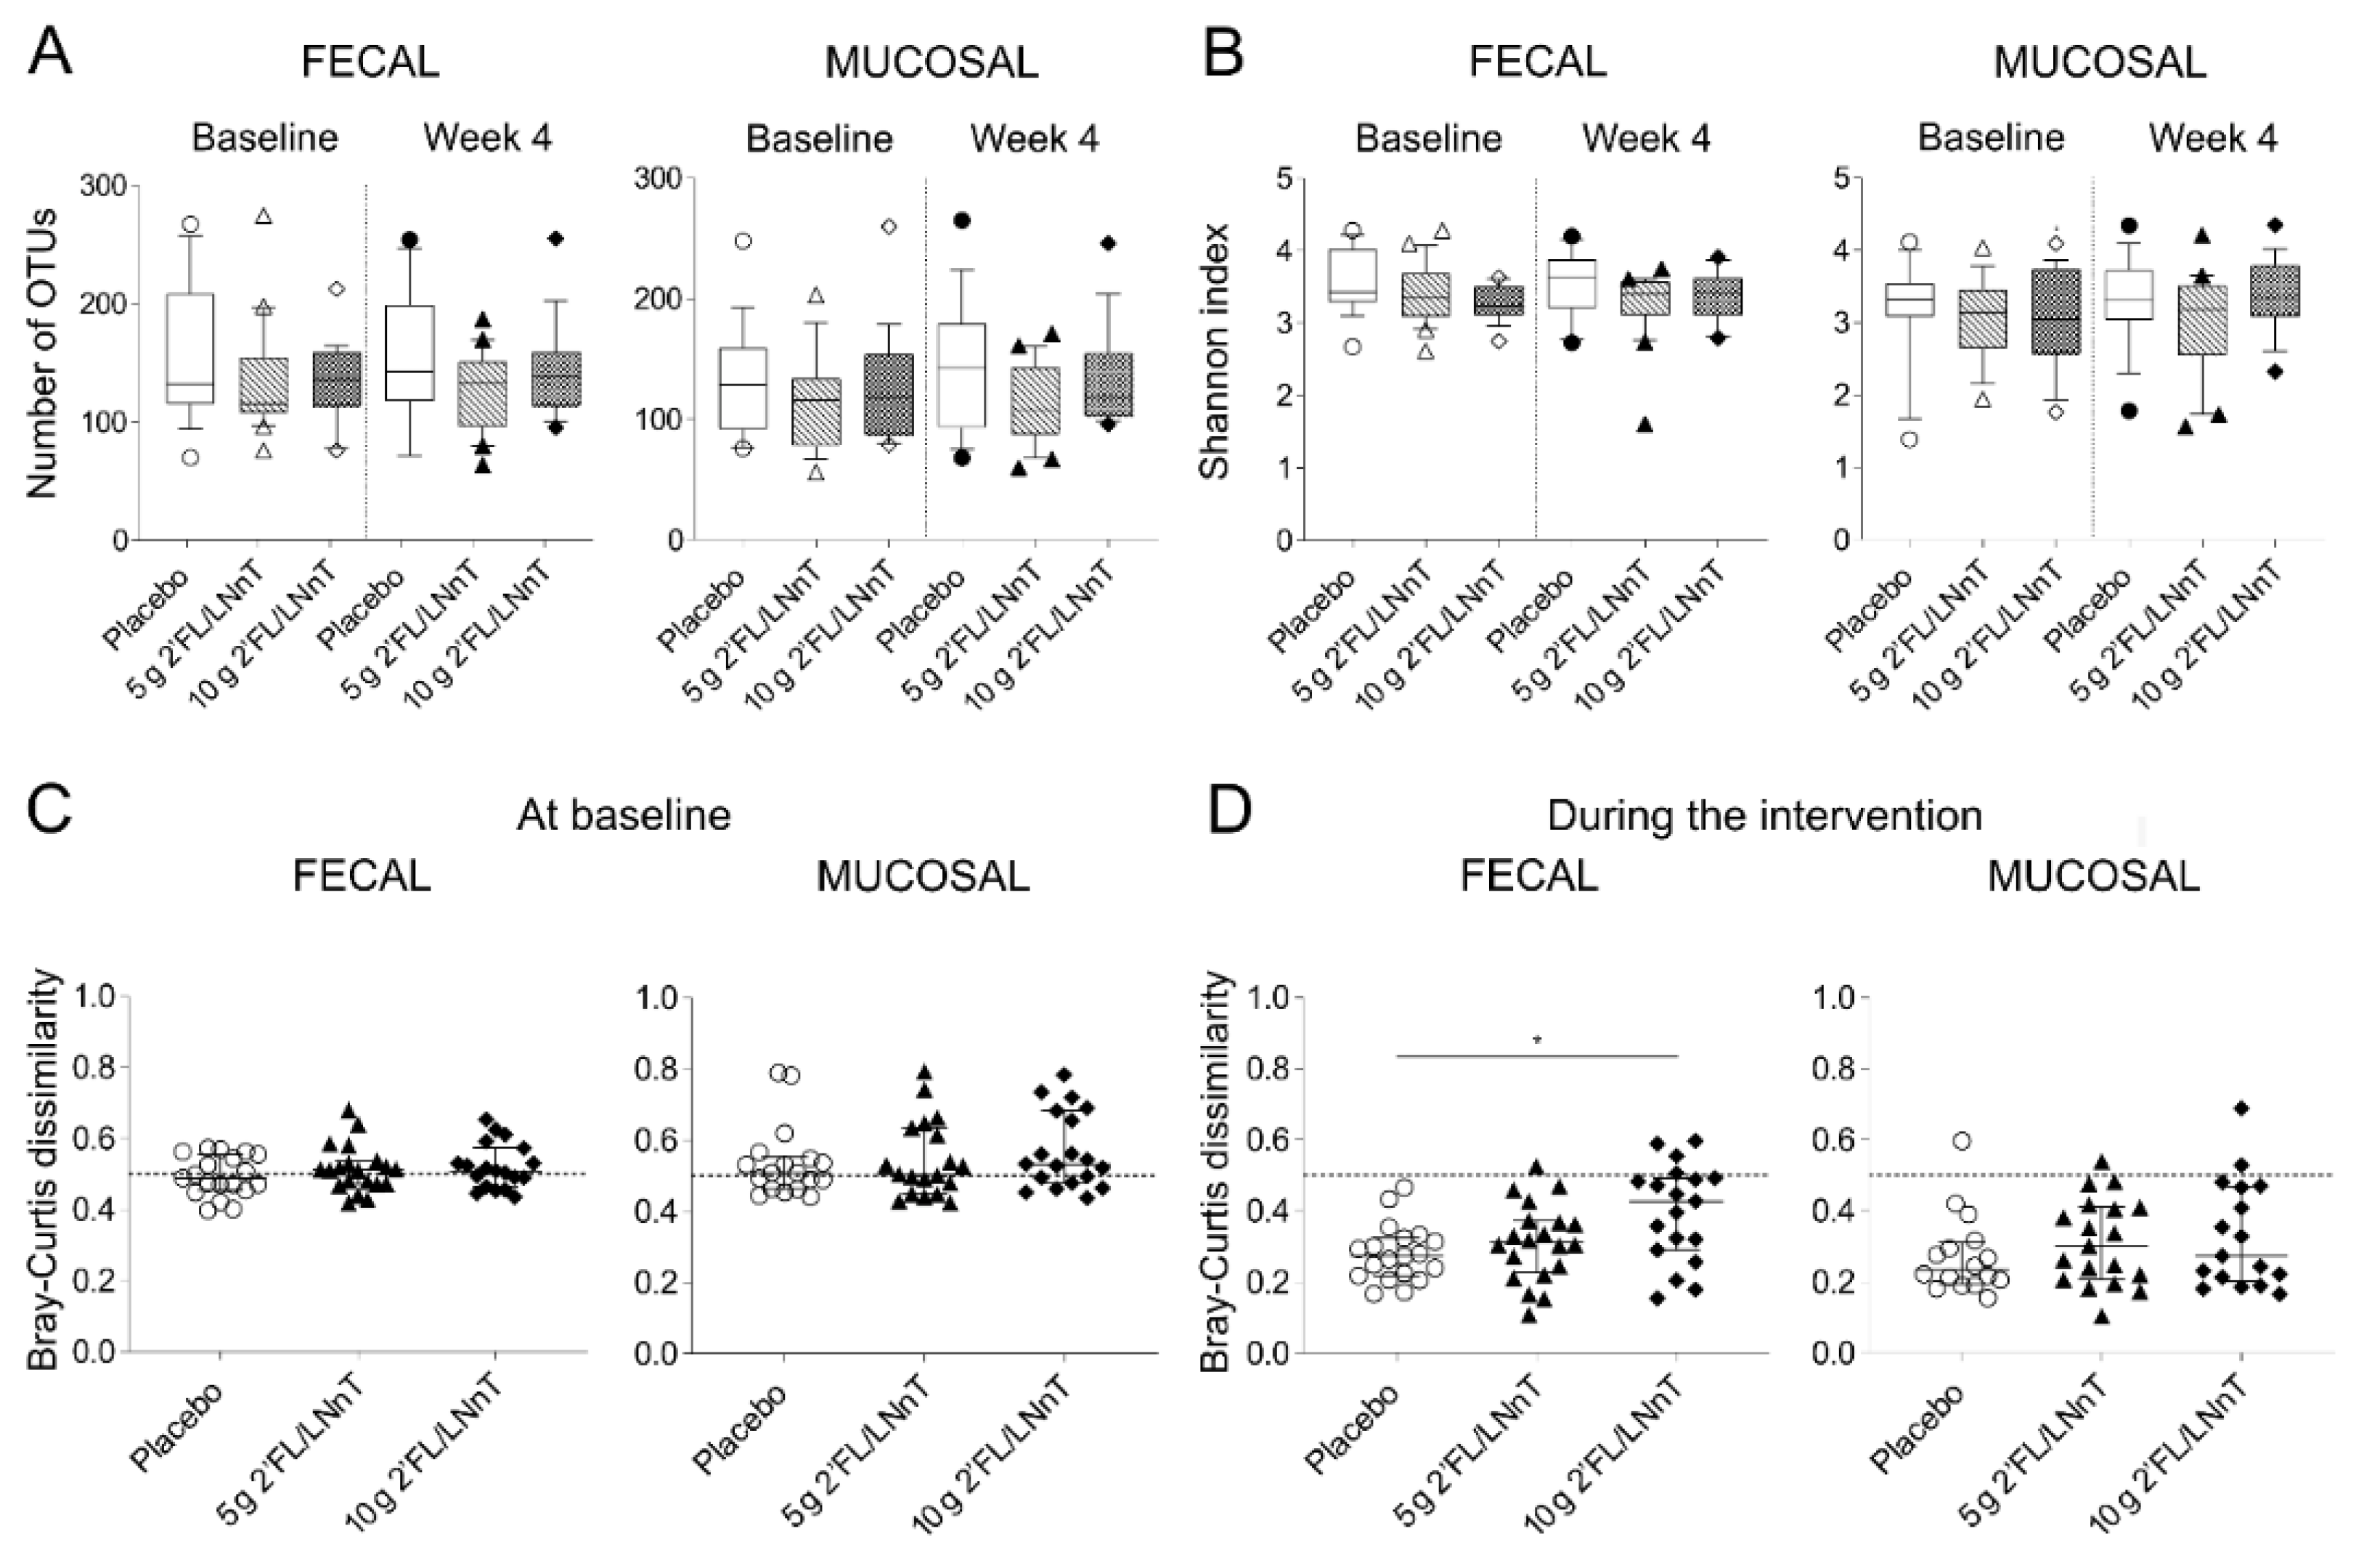
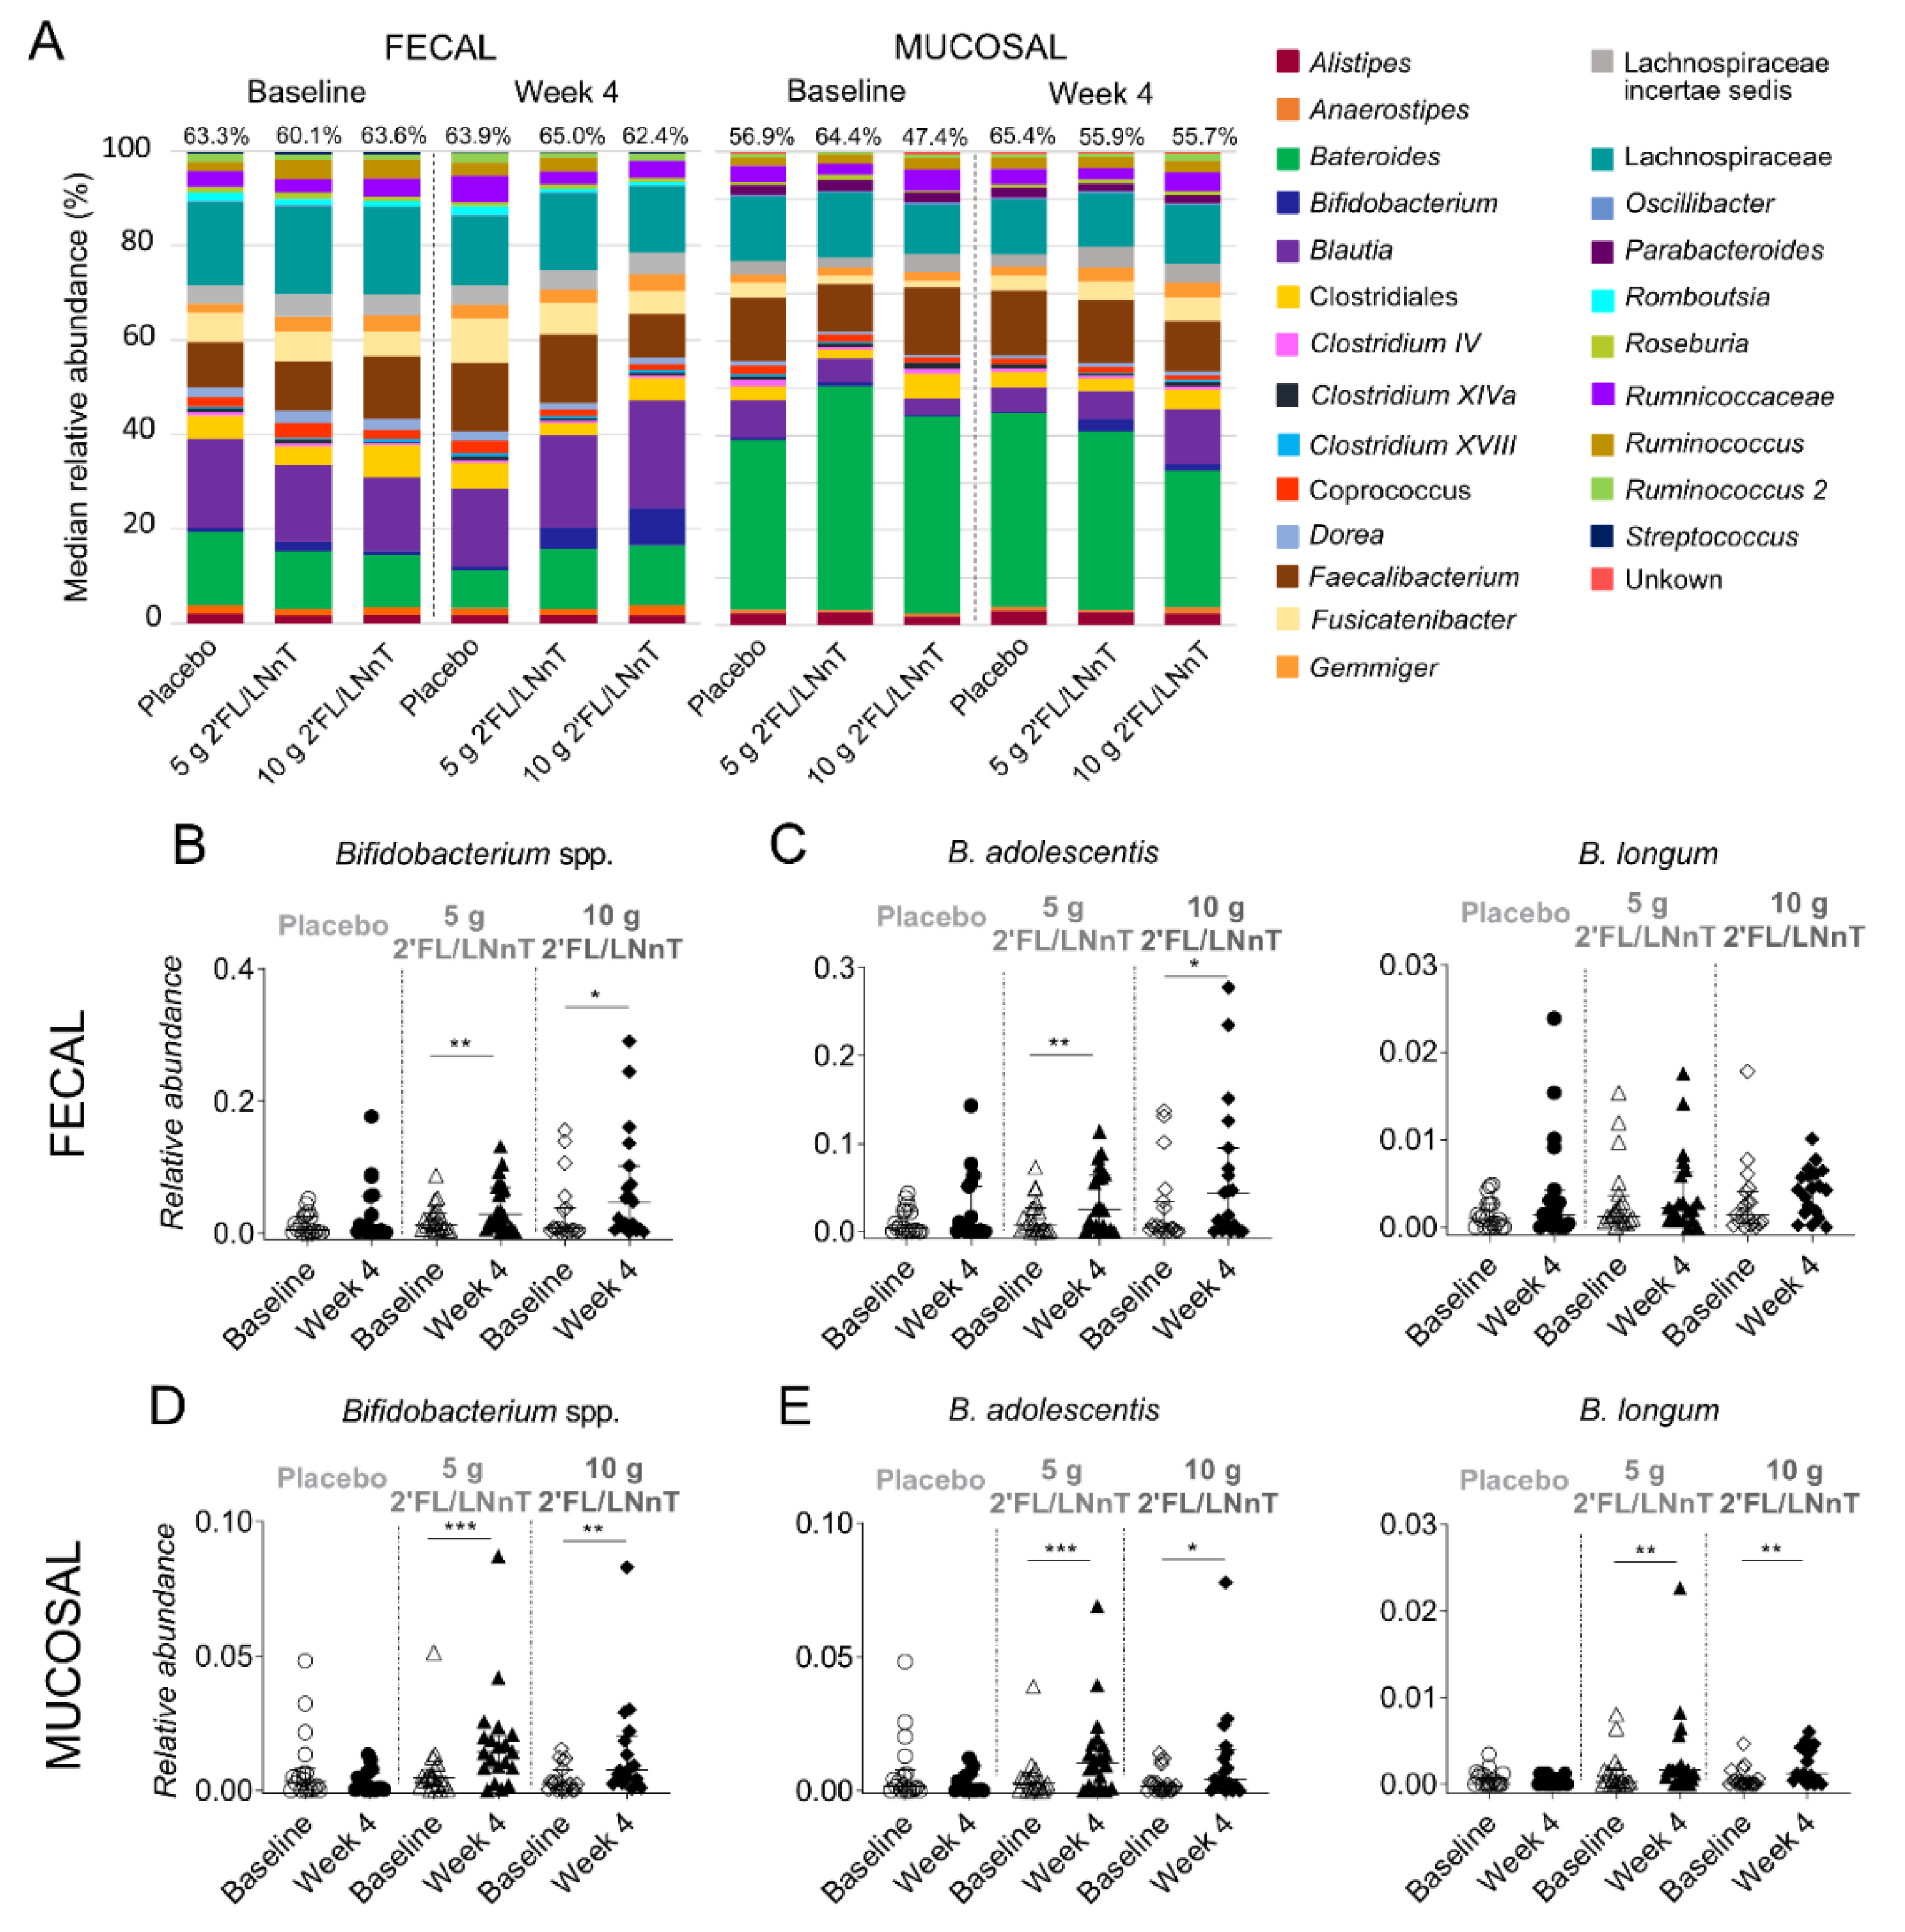
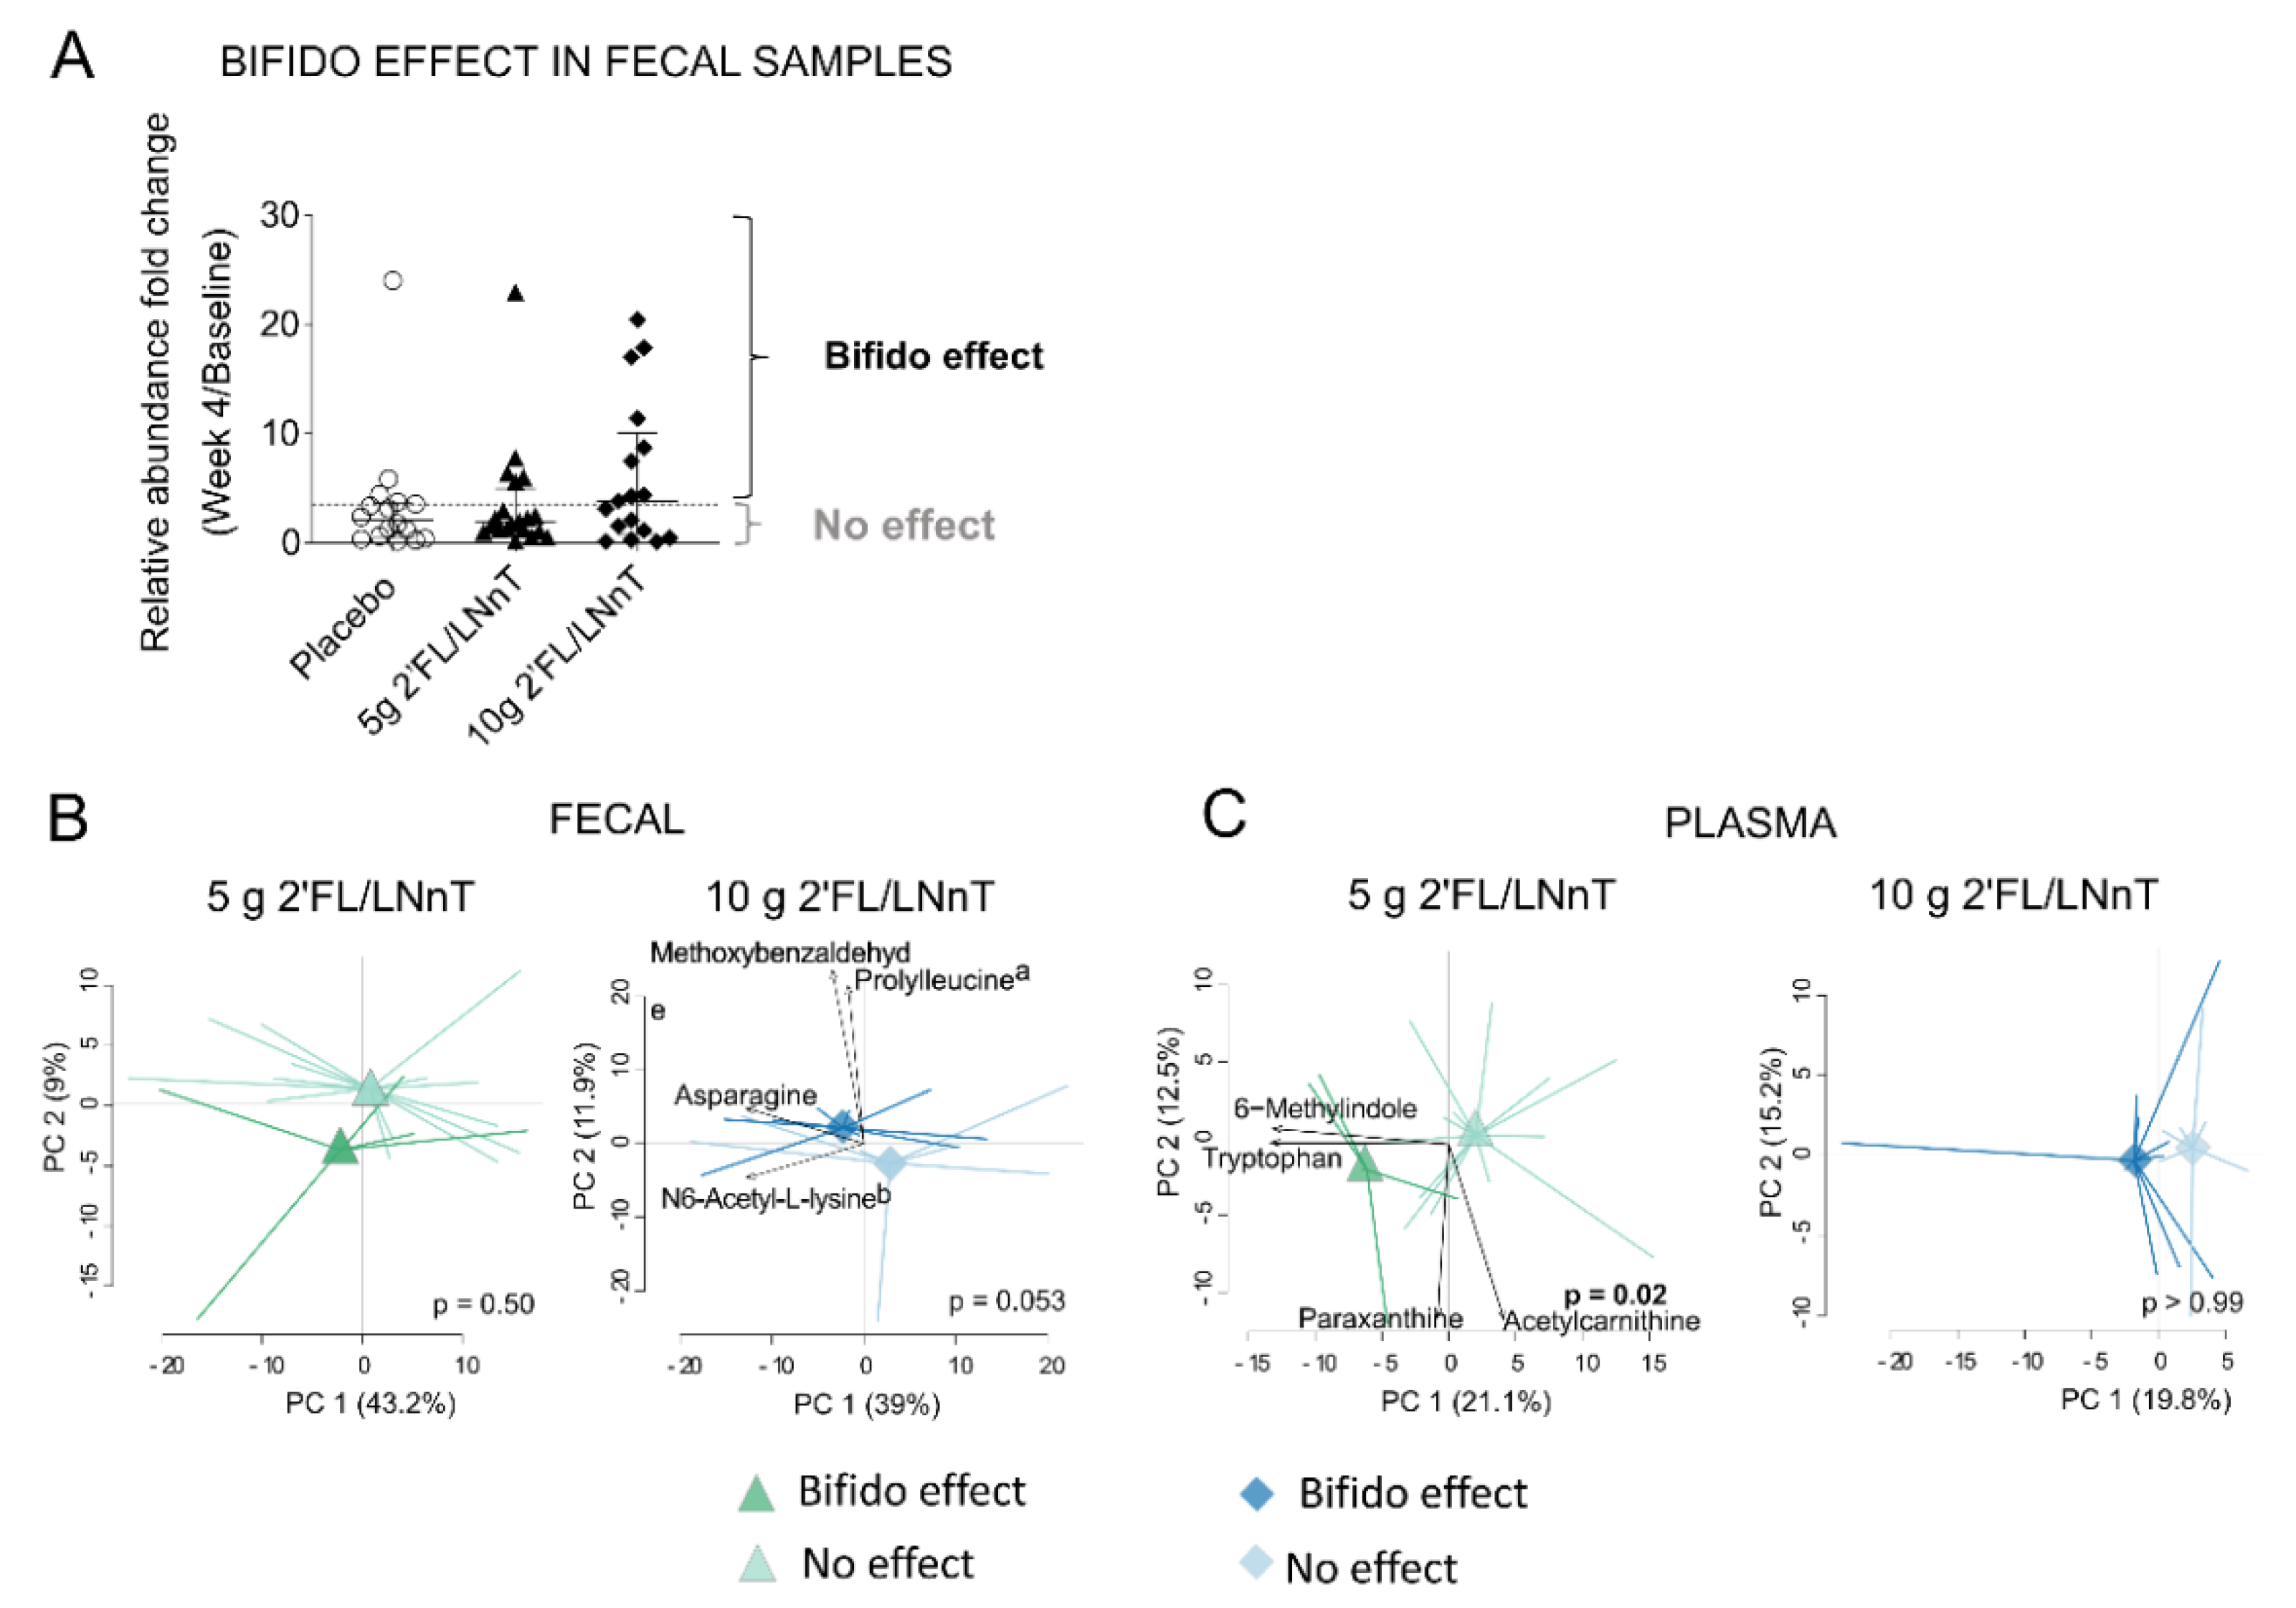
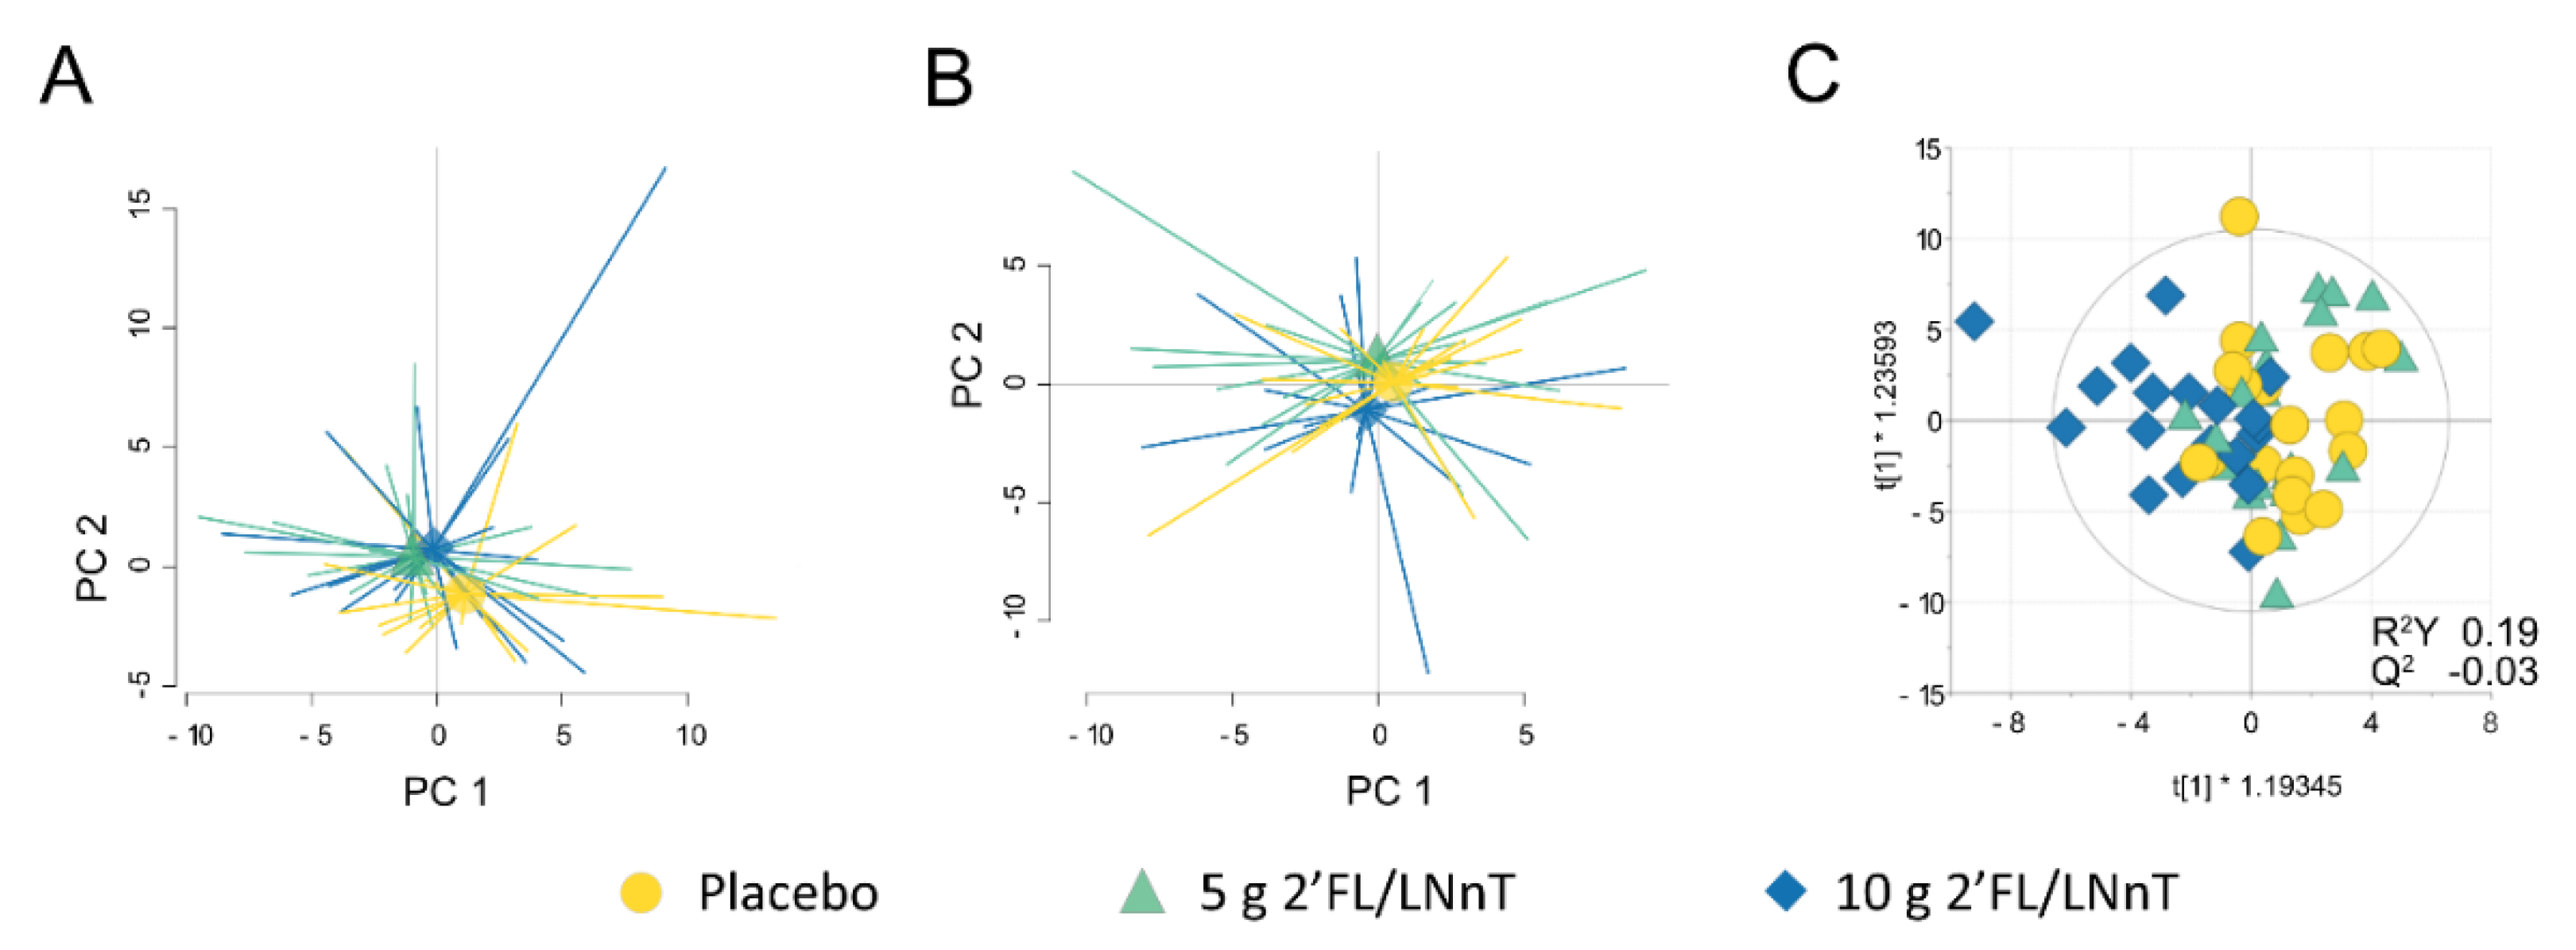
3.2. Effect of 2′FL/LNnT on Fecal and Mucosal Microbiota Profiles
3.3. Effect of 2′FL/LNnT on Microbial and Bifidobacterial Communities
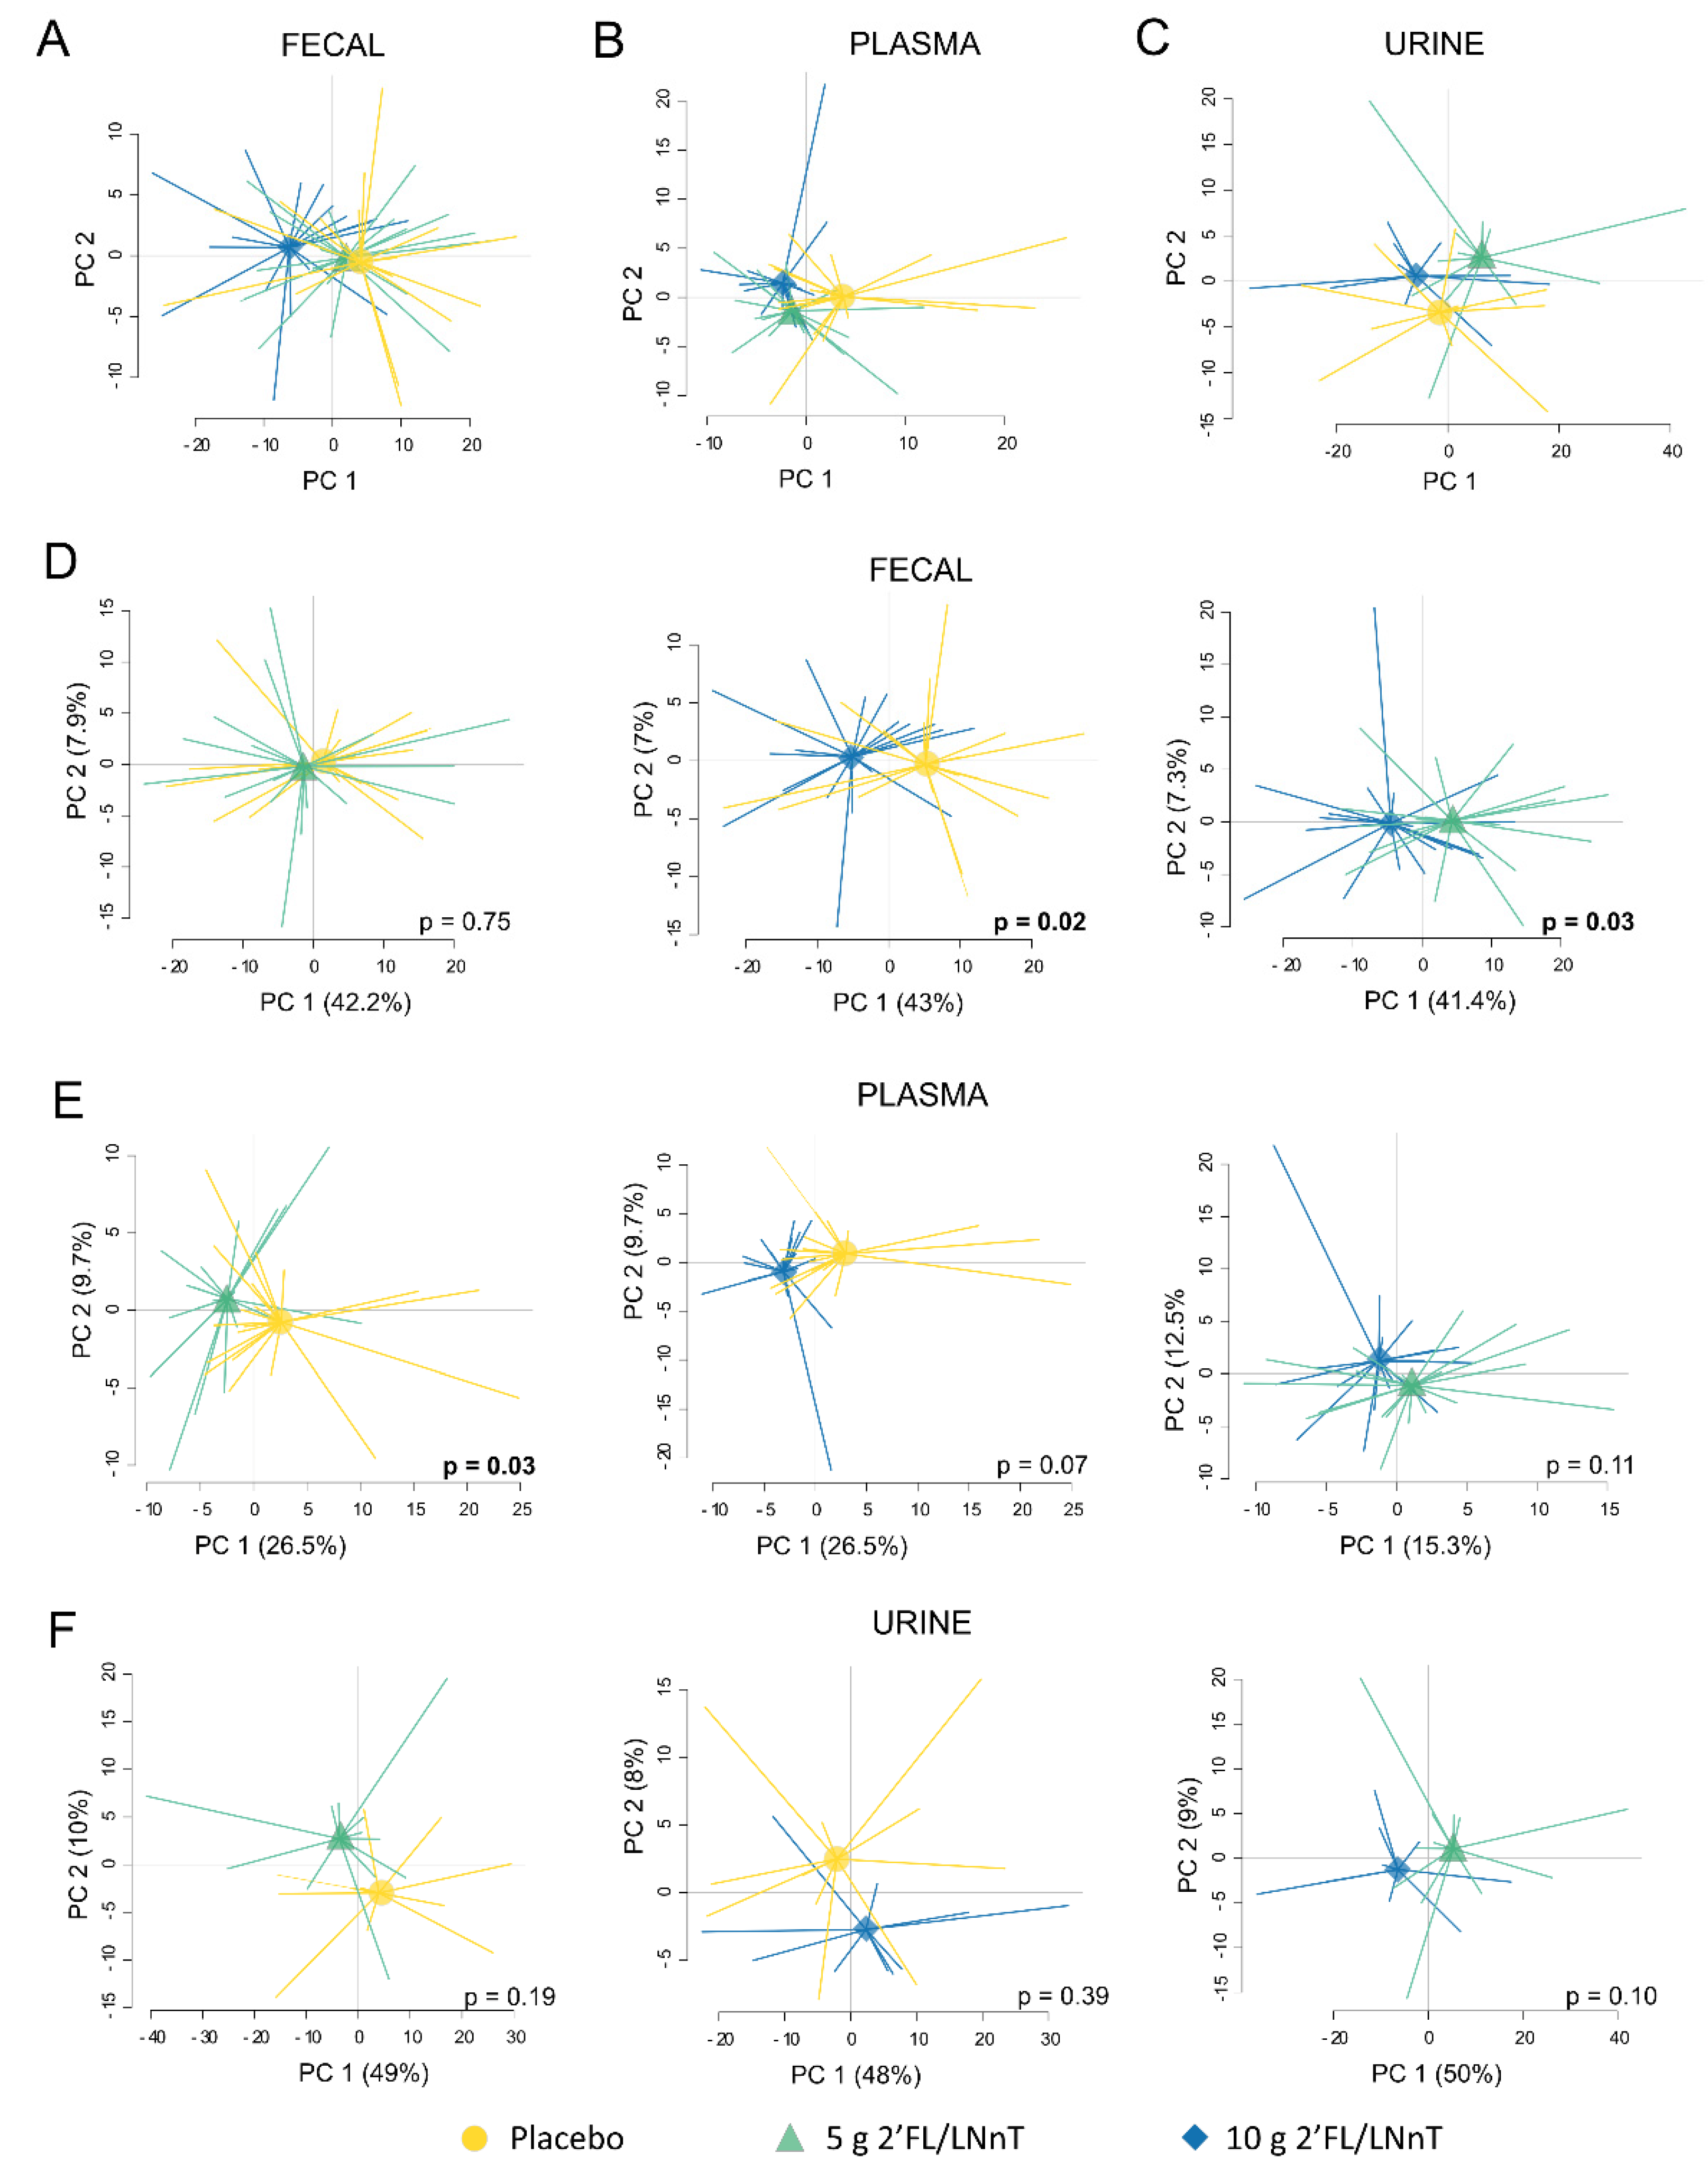
3.4. Effect of 2′FL/LNnT on the Metabolite Profile
3.5. Link between Effect on Bifidobacterium spp. Abundance and Metabolite Modulation
3.6. Effect of 2′FL/LNnT on the Host Mucosal Response Profile
4. Discussion
Supplementary Materials
Author Contributions
Funding
Institutional Review Board Statement
Informed Consent Statement
Data Availability Statement
Conflicts of Interest
References
- Lacy, B.E.; Mearin, F.; Chang, L.; Chey, W.D.; Lembo, A.J.; Simren, M.; Spiller, R. Bowel Disorders. Gastroenterology 2016, 150, 1393–1407.e1395. [Google Scholar] [CrossRef] [PubMed] [Green Version]
- Ford, A.C.; Sperber, A.D.; Corsetti, M.; Camilleri, M. Irritable bowel syndrome. Lancet 2020, 396, 1675–1688. [Google Scholar] [CrossRef]
- Enck, P.; Aziz, Q.; Barbara, G.; Farmer, A.D.; Fukudo, S.; Mayer, E.A.; Niesler, B.; Quigley, E.M.M.; Rajilić-Stojanović, M.; Schemann, M.; et al. Irritable bowel syndrome. Nat. Rev. Dis. Primers 2016, 2, 16014. [Google Scholar] [CrossRef] [PubMed] [Green Version]
- Tap, J.; Derrien, M.; Törnblom, H.; Brazeilles, R.; Cools-Portier, S.; Doré, J.; Störsrud, S.; Le Nevé, B.; Öhman, L.; Simrén, M. Identification of an Intestinal Microbiota Signature Associated with Severity of Irritable Bowel Syndrome. Gastroenterology 2017, 152, 111–123.e118. [Google Scholar] [CrossRef] [PubMed] [Green Version]
- Sundin, J.; Aziz, I.; Nordlander, S.; Polster, A.; Hu, Y.O.O.; Hugerth, L.W.; Pennhag, A.A.L.; Engstrand, L.; Törnblom, H.; Simrén, M.; et al. Evidence of altered mucosa-associated and fecal microbiota composition in patients with Irritable Bowel Syndrome. Sci. Rep. 2020, 10, 593. [Google Scholar] [CrossRef] [Green Version]
- Mars, R.A.T.; Yang, Y.; Ward, T.; Houtti, M.; Priya, S.; Lekatz, H.R.; Tang, X.; Sun, Z.; Kalari, K.R.; Korem, T.; et al. Longitudinal Multi-omics Reveals Subset-Specific Mechanisms Underlying Irritable Bowel Syndrome. Cell 2020, 182, 1460–1473.e1417. [Google Scholar] [CrossRef]
- Zhu, S.; Liu, S.; Li, H.; Zhang, Z.; Zhang, Q.; Chen, L.; Zhao, Y.; Chen, Y.; Gu, J.; Min, L.; et al. Identification of Gut Microbiota and Metabolites Signature in Patients With Irritable Bowel Syndrome. Front. Cell. Infect. Microbiol. 2019, 9, 346. [Google Scholar] [CrossRef] [Green Version]
- Chadwick, V.S.; Chen, W.; Shu, D.; Paulus, B.; Bethwaite, P.; Tie, A.; Wilson, I. Activation of the mucosal immune system in irritable bowel syndrome. Gastroenterology 2002, 122, 1778–1783. [Google Scholar] [CrossRef]
- Bennet, S.M.P.; Sundin, J.; Magnusson, M.K.; Strid, H.; Tap, J.; Derrien, M.; Le Nevé, B.; Doré, J.; Törnblom, H.; Simrén, M.; et al. Altered intestinal antibacterial gene expression response profile in irritable bowel syndrome is linked to bacterial composition and immune activation. Neurogastroenterol. Motil. 2018, 30, e13468. [Google Scholar] [CrossRef]
- Liu, T.; Gu, X.; Li, L.-X.; Li, M.; Li, B.; Cui, X.; Zuo, X.-l. Microbial and metabolomic profiles in correlation with depression and anxiety co-morbidities in diarrhoea-predominant IBS patients. BMC Microbiol. 2020, 20, 168. [Google Scholar] [CrossRef]
- Kennedy, P.J.; Cryan, J.F.; Dinan, T.G.; Clarke, G. Irritable bowel syndrome: A microbiome-gut-brain axis disorder? World J. Gastroenterol. 2014, 20, 14105–14125. [Google Scholar] [CrossRef]
- Gomaa, E.Z. Human gut microbiota/microbiome in health and diseases: A review. Antonie van Leeuwenhoek 2020, 113, 2019–2040. [Google Scholar] [CrossRef] [PubMed]
- Biesalski, H.K. Nutrition meets the microbiome: Micronutrients and the microbiota. Ann. N. Y. Acad. Sci. 2016, 1372, 53–64. [Google Scholar] [CrossRef] [PubMed]
- Oliphant, K.; Allen-Vercoe, E. Macronutrient metabolism by the human gut microbiome: Major fermentation by-products and their impact on host health. Microbiome 2019, 7, 91. [Google Scholar] [CrossRef] [PubMed]
- Jacobson, A.; Yang, D.; Vella, M.; Chiu, I.M. The intestinal neuro-immune axis: Crosstalk between neurons, immune cells, and microbes. Mucosal Immunol. 2021, 14, 555–565. [Google Scholar] [CrossRef]
- Mayneris-Perxachs, J.; Fernández-Real, J.-M. Exploration of the microbiota and metabolites within body fluids could pinpoint novel disease mechanisms. FEBS J. 2020, 287, 856–865. [Google Scholar] [CrossRef]
- Mars, R.A.T.; Frith, M.; Kashyap, P.C. Functional Gastrointestinal Disorders and the Microbiome—What Is the Best Strategy for Moving Microbiome-based Therapies for Functional Gastrointestinal Disorders into the Clinic? Gastroenterology 2021, 160, 538–555. [Google Scholar] [CrossRef] [PubMed]
- Bode, L. Human milk oligosaccharides: Every baby needs a sugar mama. Glycobiology 2012, 22, 1147–1162. [Google Scholar] [CrossRef] [Green Version]
- Gnoth, M.J.; Kunz, C.; Kinne-Saffran, E.; Rudloff, S. Human milk oligosaccharides are minimally digested in vitro. J. Nutr. 2000, 130, 3014–3020. [Google Scholar] [CrossRef]
- Goehring, K.C.; Kennedy, A.D.; Prieto, P.A.; Buck, R.H. Direct Evidence for the Presence of Human Milk Oligosaccharides in the Circulation of Breastfed Infants. PLoS ONE 2014, 9, e101692. [Google Scholar] [CrossRef] [Green Version]
- Azagra-Boronat, I.; Massot-Cladera, M.; Mayneris-Perxachs, J.; Knipping, K.; van’t Land, B.; Tims, S.; Stahl, B.; Garssen, J.; Franch, À.; Castell, M.; et al. Immunomodulatory and Prebiotic Effects of 2′-Fucosyllactose in Suckling Rats. Front. Immunol. 2019, 10, 1773. [Google Scholar] [CrossRef] [Green Version]
- Šuligoj, T.; Vigsnæs, L.K.; Abbeele, P.V.D.; Apostolou, A.; Karalis, K.; Savva, G.M.; McConnell, B.; Juge, N. Effects of Human Milk Oligosaccharides on the Adult Gut Microbiota and Barrier Function. Nutrients 2020, 12, 2808. [Google Scholar] [CrossRef]
- Natividad, J.M.; Rytz, A.; Keddani, S.; Bergonzelli, G.; Garcia-Rodenas, C.L. Blends of Human Milk Oligosaccharides Confer Intestinal Epithelial Barrier Protection in Vitro. Nutrients 2020, 12, 3047. [Google Scholar] [CrossRef]
- Goehring, K.C.; Marriage, B.J.; Oliver, J.S.; Wilder, J.A.; Barrett, E.G.; Buck, R.H. Similar to Those Who Are Breastfed, Infants Fed a Formula Containing 2′-Fucosyllactose Have Lower Inflammatory Cytokines in a Randomized Controlled Trial. J. Nutr. 2016, 146, 2559–2566. [Google Scholar] [CrossRef] [Green Version]
- Wang, Y.; Zou, Y.; Wang, J.; Ma, H.; Zhang, B.; Wang, S. The Protective Effects of 2′-Fucosyllactose against E. Coli O157 Infection Are Mediated by the Regulation of Gut Microbiota and the Inhibition of Pathogen Adhesion. Nutrients 2020, 12, 1284. [Google Scholar] [CrossRef]
- Erney, R.M.; Malone, W.T.; Skelding, M.B.; Marcon, A.A.; Kleman-Leyer, K.M.; O’Ryan, M.L.; Ruiz-Palacios, G.; Hilty, M.D.; Pickering, L.K.; Prieto, P.A. Variability of human milk neutral oligosaccharides in a diverse population. J. Pediatr. Gastroenterol. Nutr. 2000, 30, 181–192. [Google Scholar] [CrossRef]
- Vandenplas, Y.; Berger, B.; Carnielli, V.P.; Ksiazyk, J.; Lagström, H.; Luna, M.S.; Migacheva, N.; Mosselmans, J.-M.; Picaud, J.-C.; Possner, M.; et al. Human Milk Oligosaccharides: 2′-Fucosyllactose (2′-FL) and Lacto-N-Neotetraose (LNnT) in Infant Formula. Nutrients 2018, 10, 1161. [Google Scholar] [CrossRef] [PubMed] [Green Version]
- Fonvig, C.E.; Amundsen, I.D.; Vigsnæs, L.K.; Sørensen, N.; Frithioff-Bøjsøe, C.; Christiansen, M.; Hedley, P.L.; Holm, L.A.; McConnell, B.; Holm, J.-C. Human Milk Oligosaccharides Modulate Fecal Microbiota and are Safe for Use in Children with overweight: An RCT. J. Pediatr. Gastroenterol. Nutr. 2021, 73, 408–414. [Google Scholar] [CrossRef] [PubMed]
- Elison, E.; Vigsnaes, L.K.; Krogsgaard, L.R.; Rasmussen, J.; Sørensen, N.; McConnell, B.; Hennet, T.; Sommer, M.O.A.; Bytzer, P. Oral supplementation of healthy adults with 2′-O-fucosyllactose and lacto-N-neotetraose is well tolerated and shifts the intestinal microbiota. Br. J. Nutr. 2016, 116, 1356–1368. [Google Scholar] [CrossRef] [PubMed] [Green Version]
- Al-Khafaji, A.H.; Jepsen, S.D.; Christensen, K.R.; Vigsnæs, L.K. The potential of human milk oligosaccharides to impact the microbiota-gut-brain axis through modulation of the gut microbiota. J. Funct. Foods 2020, 74, 104176. [Google Scholar] [CrossRef]
- Palsson, O.S.; Peery, A.; Seitzberg, D.; Amundsen, I.D.; McConnell, B.; Simrén, M. Human Milk Oligosaccharides Support Normal Bowel Function and Improve Symptoms of Irritable Bowel Syndrome: A Multicenter, Open-Label Trial. Clin. Transl. Gastroenterol. 2020, 11, e00276. [Google Scholar] [CrossRef]
- Iribarren, C.; Törnblom, H.; Aziz, I.; Magnusson, M.K.; Sundin, J.; Vigsnæs, L.K.; Amundsen, I.D.; McConnell, B.; Seitzberg, D.; Öhman, L.; et al. Human milk oligosaccharide supplementation in irritable bowel syndrome patients: A parallel, randomized, double-blind, placebo-controlled study. Neurogastroenterol. Motil. 2020, 32, 1350–1925. [Google Scholar] [CrossRef]
- Donovan, S.M.; Comstock, S.S. Human Milk Oligosaccharides Influence Neonatal Mucosal and Systemic Immunity. Ann. Nutr. Metab. 2016, 69 (Suppl. S2), 42–51. [Google Scholar] [CrossRef] [PubMed]
- Thurl, S.; Munzert, M.; Henker, J.; Boehm, G.; Müller-Werner, B.; Jelinek, J.; Stahl, B. Variation of human milk oligosaccharides in relation to milk groups and lactational periods. Br. J. Nutr. 2010, 104, 1261–1271. [Google Scholar] [CrossRef] [PubMed] [Green Version]
- Francis, C.Y.; Morris, J.; Whorwell, P.J. The irritable bowel severity scoring system: A simple method of monitoring irritable bowel syndrome and its progress. Aliment. Pharm. Ther. 1997, 11, 395–402. [Google Scholar] [CrossRef] [Green Version]
- Bjelland, I.; Dahl, A.A.; Haug, T.T.; Neckelmann, D. The validity of the Hospital Anxiety and Depression Scale. An updated literature review. J. Psychosom Res. 2002, 52, 69–77. [Google Scholar] [CrossRef]
- Klindworth, A.; Pruesse, E.; Schweer, T.; Peplies, J.; Quast, C.; Horn, M.; Glöckner, F.O. Evaluation of general 16S ribosomal RNA gene PCR primers for classical and next-generation sequencing-based diversity studies. Nucleic Acids Res. 2013, 41, e1. [Google Scholar] [CrossRef]
- Edgar, R.C. SINTAX: A simple non-Bayesian taxonomy classifier for 16S and ITS sequences. Biorxiv 2016, 074161. [Google Scholar] [CrossRef] [Green Version]
- Schloss, P.D.; Westcott, S.L.; Ryabin, T.; Hall, J.R.; Hartmann, M.; Hollister, E.B.; Lesniewski, R.A.; Oakley, B.B.; Parks, D.H.; Robinson, C.J.; et al. Introducing mothur: Open-source, platform-independent, community-supported software for describing and comparing microbial communities. Appl. Environ. Microbiol. 2009, 75, 7537–7541. [Google Scholar] [CrossRef] [Green Version]
- Oksaken, J.; Blanchet, F.G.; Friendly, M.; Kindt, R.; Legendre, P.; McGlinn, D.; Minchin, P.R.; O’Hara, R.B.; Simpson, G.L.; Solymos, P.; et al. vegan: Community Ecology Package. 2020. Available online: https://CRAN.R-project.org/package=vegan (accessed on 2 November 2020).
- R Core Team. R: A Language and Environment for Statistical Computing. R Foundation for Statistical Computing: Vienna, Austria. 2020. Available online: https://www.r-project.org/ (accessed on 1 October 2020).
- Berger, B.; Porta, N.; Foata, F.; Grathwohl, D.; Delley, M.; Moine, D.; Charpagne, A.; Siegwald, L.; Descombes, P.; Alliet, P.; et al. Linking Human Milk Oligosaccharides, Infant Fecal Community Types, and Later Risk To Require Antibiotics. mBio 2020, 11, e03196-19. [Google Scholar] [CrossRef] [Green Version]
- Wagner, B.D.; Grunwald, G.K.; Zerbe, G.O.; Mikulich-Gilbertson, S.K.; Robertson, C.E.; Zemanick, E.T.; Harris, J.K. On the Use of Diversity Measures in Longitudinal Sequencing Studies of Microbial Communities. Front. Microbiol. 2018, 9, 1037. [Google Scholar] [CrossRef] [PubMed] [Green Version]
- Zoetendal, E.G.; de Vos, W.M. Effect of diet on the intestinal microbiota and its activity. Curr. Opin. Gastroenterol. 2014, 30, 189–195. [Google Scholar] [CrossRef] [PubMed]
- Gotoh, A.; Katoh, T.; Sakanaka, M.; Ling, Y.; Yamada, C.; Asakuma, S.; Urashima, T.; Tomabechi, Y.; Katayama-Ikegami, A.; Kurihara, S.; et al. Sharing of human milk oligosaccharides degradants within bifidobacterial communities in faecal cultures supplemented with Bifidobacterium bifidum. Sci. Rep. 2018, 8, 13958. [Google Scholar] [CrossRef] [PubMed]
- Marcobal, A.; Sonnenburg, J.L. Human milk oligosaccharide consumption by intestinal microbiota. Clin. Microbiol. Infect. 2012, 18, 12–15. [Google Scholar] [CrossRef] [PubMed] [Green Version]
- Hibbing, M.E.; Fuqua, C.; Parsek, M.R.; Peterson, S.B. Bacterial competition: Surviving and thriving in the microbial jungle. Nat. Rev. Microbiol. 2010, 8, 15–25. [Google Scholar] [CrossRef] [Green Version]
- Taverniti, V.; Guglielmetti, S. Methodological issues in the study of intestinal microbiota in irritable bowel syndrome. World J. Gastroenterol. 2014, 20, 8821–8836. [Google Scholar] [CrossRef] [PubMed]
- Pittayanon, R.; Lau, J.T.; Yuan, Y.; Leontiadis, G.I.; Tse, F.; Surette, M.; Moayyedi, P. Gut Microbiota in Patients With Irritable Bowel Syndrome-A Systematic Review. Gastroenterology 2019, 157, 97–108. [Google Scholar] [CrossRef] [Green Version]
- Van den Abbeele, P.; Duysburgh, C.; Vazquez, E.; Chow, J.; Buck, R.; Marzorati, M. 2′-Fucosyllactose alters the composition and activity of gut microbiota from formula-fed infants receiving complementary feeding in a validated intestinal model. J. Funct. Foods 2019, 61, 103484. [Google Scholar] [CrossRef]
- O’Connell, T.M. The Application of Metabolomics to Probiotic and Prebiotic Interventions in Human Clinical Studies. Metabolites 2020, 10, 120. [Google Scholar] [CrossRef] [Green Version]
- Noorbakhsh, H.; Yavarmanesh, M.; Mortazavi, S.A.; Adibi, P.; Moazzami, A.A. Metabolomics analysis revealed metabolic changes in patients with diarrhea-predominant irritable bowel syndrome and metabolic responses to a synbiotic yogurt intervention. Eur. J. Nutr. 2019, 58, 3109–3119. [Google Scholar] [CrossRef]
- Lee, S.; Goodson, M.; Vang, W.; Kalanetra, K.; Barile, D.; Raybould, H. 2′-fucosyllactose Supplementation Improves Gut-Brain Signaling and Diet-Induced Obese Phenotype and Changes the Gut Microbiota in High Fat-Fed Mice. Nutrients 2020, 12, 1003. [Google Scholar] [CrossRef] [PubMed] [Green Version]
- Zhu, H.; Pi, D.; Leng, W.; Wang, X.; Hu, C.-A.A.; Hou, Y.; Xiong, J.; Wang, C.; Qin, Q.; Liu, Y. Asparagine preserves intestinal barrier function from LPS-induced injury and regulates CRF/CRFR signaling pathway. Innate Immun. 2017, 23, 546–556. [Google Scholar] [CrossRef] [PubMed] [Green Version]
- Bosi, A.; Banfi, D.; Bistoletti, M.; Giaroni, C.; Baj, A. Tryptophan Metabolites Along the Microbiota-Gut-Brain Axis: An Interkingdom Communication System Influencing the Gut in Health and Disease. Int. J. Tryptophan Res. 2020, 13, 1178646920928984. [Google Scholar] [CrossRef] [PubMed]

| Placebo (n = 19) | 5 g 2′FL/LNnT (n = 20) | 10 g 2′FL/LNnT (n = 19) | p Value | |
|---|---|---|---|---|
| Sex (Female:Male) | 14:5 | 11:9 | 14:5 | 0.35 |
| Age, years † | 45 (21−71) | 42 (19−67) | 47 (26−73) | 0.65 |
| Body mass index, kg/m2 † | 24.7 (20.3−35.5) | 24.0 (19.1−41.7) | 24.4 (17.4−33.54) | 0.79 |
| IBS subtype ¶ | ||||
| IBS-C | 5 | 5 | 4 | 0.93 |
| IBS-D | 8 | 9 | 8 | 0.96 |
| IBS-M | 6 | 6 | 7 | 0.95 |
| IBS-SSS ¶ | ||||
| Mild | 5 | 4 | 5 | 0.93 |
| Moderate | 7 | 11 | 5 | 0.30 |
| Severe | 7 | 5 | 9 | 0.57 |
| HADS ¶ | ||||
| Anxiety:No anxiety | 8:15 | 8:12 | 6:12 | 0.59 |
| Depression:No depression | 1:18 | 3:17 | 3:15 | 0.86 |
| Placebo | 5 g 2′FL/LNnT | 10 g 2′FL/LNnT | ||||
|---|---|---|---|---|---|---|
| Baseline (n = 19) | Week 4 (n = 19) | Baseline (n = 20) | Week 4 (n = 20) | Baseline (n = 19) | Week 4 (n = 19) | |
| Bifidobacterium | 5 × 10⁻³ (0–0.05) | 5 × 10⁻³ (0–0.18) | 0.01 (1 × 10⁻³–0.09) | 0.03 (2 × 10⁻³–0.13) ** | 7 × 10⁻³ (0–0.16) | 0.05 (1 × 10⁻³–0.30) * |
| Clostridium_XIVa | 5 × 10⁻³ (6 × 10⁻⁴–0.06) | 6 × 10⁻³ (4 × 10⁻⁴–0.05) | 5 × 10⁻³ (6 × 10⁻⁴–0.19) | 3 × 10⁻³ (3 × 10⁻⁴–0.08) * | 2 × 10⁻³ (0–0.03) | 2 × 10⁻³ (8 × 10⁻⁴–0.02) |
| Dorea | 0.01 (3 × 10⁻³–0.03) | 0.01 (3 × 10⁻³–0.07) | 0.02 (0–0.04) | 9 × 10⁻³ (4 × 10⁻³–0.04) | 0.01 (4 × 10⁻³–0.05) | 9 × 10⁻³ (8 × 10⁻⁴−0.03) * |
| Faecalibacterium | 0.06 (0.03–0.21) | 0.09 (0.02–0.19) | 0.06 (2 × 10⁻⁴–0.12) | 0.09 (0–0.19) ** | 0.08 (0.08–0.20) | 0.06 (8 × 10⁻³–0.19) |
| Lachnospiraceae | 0.11 (0.04–0.24) | 0.09 (0.03–0.31) | 0.11 (0.02–0.25) | 0.11 (0.02–0.21) | 0.12 (0.02–0.42) | 0.09 (0.02–0.17) * |
| Ruminococcus | 0.01 (0–0.05) | 0.02 (0–0.06) | 0.02 (0–0.09) | 0.02 (2 × 10⁻⁴–0.08) * | 0.02 (0–0.08) | 0.02 (2 × 10⁻⁴–0.06) |
| Placebo | 5 g 2′FL/LNnT | 10 g 2′FL/LNnT | ||||
|---|---|---|---|---|---|---|
| Baseline (n = 18) | Week 4 (n = 17) | Baseline (n = 19) | Week 4 (n = 20) | Baseline (n = 19) | Week 4 (n = 17) | |
| Anaerostipes | 5 × 10⁻³ (0–0.02) | 6 × 10⁻³ (2 × 10⁻⁴–0.02) | 3 × 10⁻³ (0–0.04) | 3 × 10⁻³ (0–0.02) | 3 × 10⁻³ (0–0.01) | 9 × 10⁻³ (4 × 10⁻⁴–0.01) ** |
| Bacteroides | 0.20 (0.04–0.47) | 0.28 (0.05–0.39) | 0.30 (2 × 10⁻⁴–0.53) | 0.21 (0–0.55) * | 0.29 (0.03–0.45) | 0.16 (7 × 10⁻³–0.39) * |
| Bifidobacterium | 3 × 10⁻³ (0–0.048) | 1 × 10⁻³ (0–0.01) | 5 × 10⁻³ (0–0.05) | 0.01 (4 × 10⁻⁴–0.09) ** | 2 × 10⁻³ (0–2 × 10⁻³) | 7 × 10⁻³ (6 × 10⁻³–0.08) ** |
| Blautia | 0.04 (0.01–0.09) | 0.04 (9 × 10⁻³ −0.08) * | 0.03 (0.01–0.15) | 0.03 (7 × 10⁻³ –0.2) | 0.03 (8 × 10⁻⁴–0.07) | 0.06 (2 × 10⁻³–0.17) ** |
| Clostridium XVIII | 3 × 10⁻³ (0–8 × 10⁻³) | 2 × 10⁻³ (0–6 × 10⁻³) | 2 × 10⁻³ (0–9 × 10⁻³) | 1 × 10⁻³ (0–3 × 10⁻³) | 6 × 10⁻⁴ (0–7 × 10⁻³) | 3 × 10⁻³ (0–0.01) ** |
| Fusicatenibacter | 0.02 (6 × 10⁻³–0.08) | 6 × 10⁻³ (0–0.05) | 0.01 (2 × 10⁻³–0.04) | 0.02 (2 × 10⁻⁴–0.11) | 6 × 10⁻³ (2 × 10⁻⁴–0.07) | 0.03 (0–0.05) * |
| Parabacteroides | 0.01 (0–0.06) | 0.01 (0–0.09) | 0.02 (0–0.09) | 9 × 10⁻³ (0–0.1) * | 0.01 (0–0.21) | 9 × 10⁻³ (0–0.07) |
| Ruminococcus2 | 5 × 10⁻³ (6 × 10⁻⁴ –0.03) | 6 × 10⁻³ (0–0.02) | 4 × 10⁻³ (0–0.02) | 4 × 10⁻³ (0–0.02) | 5 × 10⁻³ (0–0.04) | 9 × 10⁻³ (0–0.04) * |
| Placebo | 5 g 2′FL/LNnT | 10 g 2′FL/LNnT | ||||
|---|---|---|---|---|---|---|
| Baseline | Week 4 | Baseline | Week 4 | Baseline | Week 4 | |
| Plasma | 7.0 (6.6–8.4) | 6.8 (6.6–7.6) | 6.8 (6.6–8.2) | 8.3 (6.6–10.4) *** | 6.9 (6.6–8.0) | 8.9 (6.2–10.9) *** |
| Urine | 7.0 (6.7–9.2) | 7.1 (6.7–10.5) | 6.9 (6.7–7.5) | 10.3 (6.7–12.7) ** | 6.85 (6.7–7.2) | 11.3 (9.3–12.8) ** |
Publisher’s Note: MDPI stays neutral with regard to jurisdictional claims in published maps and institutional affiliations. |
© 2021 by the authors. Licensee MDPI, Basel, Switzerland. This article is an open access article distributed under the terms and conditions of the Creative Commons Attribution (CC BY) license (https://creativecommons.org/licenses/by/4.0/).
Share and Cite
Iribarren, C.; Magnusson, M.K.; Vigsnæs, L.K.; Aziz, I.; Amundsen, I.D.; Šuligoj, T.; Juge, N.; Patel, P.; Sapnara, M.; Johnsen, L.; et al. The Effects of Human Milk Oligosaccharides on Gut Microbiota, Metabolite Profiles and Host Mucosal Response in Patients with Irritable Bowel Syndrome. Nutrients 2021, 13, 3836. https://doi.org/10.3390/nu13113836
Iribarren C, Magnusson MK, Vigsnæs LK, Aziz I, Amundsen ID, Šuligoj T, Juge N, Patel P, Sapnara M, Johnsen L, et al. The Effects of Human Milk Oligosaccharides on Gut Microbiota, Metabolite Profiles and Host Mucosal Response in Patients with Irritable Bowel Syndrome. Nutrients. 2021; 13(11):3836. https://doi.org/10.3390/nu13113836
Chicago/Turabian StyleIribarren, Cristina, Maria K. Magnusson, Louise K. Vigsnæs, Imran Aziz, Ingvild Dybdrodt Amundsen, Tanja Šuligoj, Nathalie Juge, Piyush Patel, Maria Sapnara, Lea Johnsen, and et al. 2021. "The Effects of Human Milk Oligosaccharides on Gut Microbiota, Metabolite Profiles and Host Mucosal Response in Patients with Irritable Bowel Syndrome" Nutrients 13, no. 11: 3836. https://doi.org/10.3390/nu13113836
APA StyleIribarren, C., Magnusson, M. K., Vigsnæs, L. K., Aziz, I., Amundsen, I. D., Šuligoj, T., Juge, N., Patel, P., Sapnara, M., Johnsen, L., Sørensen, N., Sundin, J., Törnblom, H., Simrén, M., & Öhman, L. (2021). The Effects of Human Milk Oligosaccharides on Gut Microbiota, Metabolite Profiles and Host Mucosal Response in Patients with Irritable Bowel Syndrome. Nutrients, 13(11), 3836. https://doi.org/10.3390/nu13113836